business finance: i make a profit? focus
TRANSCRIPT

Entrepreneurship: Arkansas Style 1 ©BMCEE
By: Michael Brown
Business Finance: Will I Make a Profit?
FOCUS: Overview: Students analyze the financial information from two business plans to learn how revenues can be increased or costs decreased in order to make the businesses profitable. This is a process that is necessary to the business plan. Businesses must be profitable in order to get financing to keep operating. Through mathematical practice and analysis students will see the importance of dales forecasting to the business planning process and the probability of success Objectives:
• Students will understand that businesses can change their production costs or increase their revenues in order to make a profit.
• Industry sales forecasting is necessary to the business planning process.
Background Information: Understanding industry forecasting is necessary to the creation of a good business plan as well as to operating a business. Industry trends have a tremendous impact on the likelihood of success to a prospective business. As students work in groups to analyze the sales forecast of two businesses they will explore some possibilities for cost decreases or revenue increases. Curriculum Multi‐tasking:
• Mathematics (graphing and computation practice/application) • Economics • Critical thinking
Activity Length: 2 – 3 class periods
PREPARE: Materials:
• Copies of Handout 6.1 – Financial Concept Map for each student • Copies of Handout 6.2 ‐ Financial Fun for each group • Copies of Handout 6.3 – Sales Forecasting for each group

Entrepreneurship: Arkansas Style 2 ©BMCEE
• Copies of Handout 6.4 ‐ Sales Forecasting: Krazy Kites for each group • Copies of Handout 6.5 ‐ Sales Forecasting: Dog Party USA for each group • Copies of Visual/Handout 6.6 – Arkansas Gross Domestic Product by Industry for
each group Construct:
1. Divide students into groups of three.
TEACH:
Introduction: Describe the following scenario: Now that you have settled on an idea for a business and you want to proceed with your business plan, how do you determine if your business will be profitable? A business must be profitable in order to keep operating. You have to pay for your materials, workers, overhead and anything else needed to produce your good or service. Activities: 1. Concept Map: Begin this lesson by giving each student Handout 6.1: Concept Map to
help them connect and organize the material covered. Have students’ check mark the labels on the map as you learn about each of the categories for determining the business financials.
2. Profit: Distribute copies of Handout 6.2 Financial Fun to each group. Have students follow along as you ‘talk’ through the process.
3. Explain that there are two types of profit used to measure the success of a business. The first form of profit is economic profit. Economic profit is defined as the difference between the firm’s revenues and the expenses (costs) and the opportunity costs involved in the business. The opportunity cost includes the salary you would have earned working a different job. The other, most commonly used type of profit is known as accounting profit. Accounting profit is simply the difference between the firm’s revenues and costs. For this activity we will use accounting profit.
4. Have the students follow and discuss the following example in order to develop this understanding.
Economic Profit = Firm’s Revenues – Costs – Opportunity Costs Accounting Profit = Firm’s Revenues – Costs
5. Revenue: Explain that revenue is the price for which the product sells times the
number of units sold. The sales forecasting exercise can help you to determine how many you project you can sell.
6. Profit Example: Economic versus Accounting: Draw the tables below on the board without the numbers. Have a student fill in the numbers as you read the scenario. Explain that Eduardo has made the decision to quit his $3,000 a month job and start his own business. In order to cover the startup expenses he will incur,

Entrepreneurship: Arkansas Style 3 ©BMCEE
Eduardo elects to withdraw the money needed, $2,500, from his savings account which earns a 3.5% interest rate. The opportunity costs, in this case are Eduardo’s salary and the interest he would have earned on his savings account. The cost of withdrawing his money from savings is $87.50 ($2,500 x .035). In his first month of business, he had generated $4,000 in sales and incurred costs of $1,800. As you can clearly see below, Mark earned an accounting profit of $2,200, but when he factors in what he would have earned if he did not start the business (the opportunity cost), he actually lost 887.50. This means that if Mark would have kept his job and not drawn out the $2,500, he would have been better off financially. In other words, the costs of starting the business outweighed the financial benefits he received.
Accounting Profit: Economic Profit:
Revenue $4,000.00 Revenue $4,000.00 Costs − $1,800.00 Costs − $1,800.00 Accounting Profit
= $2,200.00 Mark’s Forgone Salary − $3,000.00 Mark’s Forgone Interest − $87.50
Economic Profit = ‐$887.50
7. Expenses (Costs): Explain that there are two main expense categories for a business, startup expenses and operating expenses. All of the profits left over after these two expenses are accounting profits. Note that these do not take into account opportunity costs.
8. Startup Expenses: Explain that the firm will incur startup expenses before they can open for business. These startup expenses include everything needed to start a business such as rental deposit, utility deposits, business licenses, equipment and tools, advertising, business cards, brochures, office supplies, and other expenses.
9. Operating Expenses: The category of operating expenses is further broken down into production costs and overhead costs. These expenses are the cost of the firm’s day‐to‐day production activities.
10. Production Costs (Variable Costs): Production costs are also known as variable costs or cost of goods sold on the Profit and Loss Statements. As their name implies, variable costs vary depending on the number of units the company produces. Types of variable costs include the cost of all the materials and labor cost used to produce the product.
11. Overhead (Fixed Costs): Overhead or fixed costs are costs that the company incurs even if they choose not to produce any products. These costs include, rent, utilities (power, water, etc.), insurance costs, equipment repairs, and salaries (non‐hourly wages). These overhead costs are paid for by what is known as the contribution margin.
12. Contribution Margin: The contribution margin is calculated by taking the price the company charges for the good or service and subtracting the variable cost per unit.
Contribution Margin = Price of goods/services – Variable Costs per unit

Entrepreneurship: Arkansas Style 4 ©BMCEE
13. Explain that the contribution margin is used to pay for the overhead and startup
costs. Here is an example: Krazy Kites use $1.00 per kite in raw materials and $3.00 per kite in labor, thus the total variable costs are $4.00 per kite. Krazy Kites will set a price of $10.00 for each kite. So the contribution margin is $10.00 ‐ $4.00 = $6.00 per kite. This means that $6.00 of every kite sold will contribute to paying down the overhead and startup costs. Once the overhead costs and the startup costs have been paid, then the excess funds will become profit for the company (remember this is accounting profit).
14. Use another example to highlight the important differences between variable and fixed costs and how we can account for all these costs. Widget World creates custom widgets for special machines. Suppose the cost of the raw materials to produce widgets is $3.00 per unit which includes, metal, bolts, washers and nuts. Each Widget World worker makes $6.00 and hour and it takes each worker fifteen minutes (1/4 of an hour) to produce one widget. In order to calculate the labor cost of producing one widget we take the hourly wage $6.00 and divide by ¼ to get the labor cost for each widget produced, in this case $1.50. The total variable cost per widget is $3.00 materials + $1.50 labor = $4.50. Widget World has the following overhead costs:
• rent‐ $125 • utilites‐ $80 • salaries‐ $150 total overhead cost $355.00 per month
Widget World sells it widgets for $15.00 each. This means the contribution margin is $15.00 (price) – $4.50 (variable cost) = $10.50, so $10.50 of every sale will contribute to the overhead costs of $355.00 per month.
15. The Break‐Even Point: When an entrepreneur starts her own company, the incentive to the entrepreneur is the potential of earning a profit. In order to determine at what point a company will earn a profit, the break‐even point needs to be calculated. The break‐even point is defined as the number of units the company needs to sell in order to cover all operating costs and payoff the startup costs. In other words, the point at which the company begins to earn a profit. The break‐even point is calculated by taking the price per unit and subtracting the variable cost per unit to get the contribution margin. Then add the fixed cost and the startup costs together. The final step is to divide the combined fixed and startup costs by the contribution margin to get the number of units that need to be sold to break even.

Entrepreneurship: Arkansas Style 5 ©BMCEE
Price per Unit − Variable Cost per Unit = Contribution Margin
Fixed Costs + Startup Expenses = Expenses without Variable Costs Expenses minus Variable Costs/Contribution Margin = Break‐Even Point or # of units sold to cover all costs
16. Widget World Breakeven Point: Let’s go back to the Widget World example to see how the break‐even point is calculated. Remember the price per unit was $15.00, the variable cost was $4.50 per unit, so the contribution margin was $10.50 per unit. The overhead costs were $355.00 and Widget World had $600.00 of startup expenses. Here is the break‐even point calculation:
Price per unit − Variable Cost per Unit = Contribution Margin
$15.00 ‐ $4.50 = $10.50
Fixed Costs + Startup Expenses $355.00 + $600.00 = $955.00
Fixed Costs + Startup Costs/ Contribution Margin = Number of Units Sold to Cover Costs or the Break Even Point
$955.00/ $10.50 = 91 units*
*Note: Widget World technically needs to sell 90.95 widgets, but they cannot sell .95 of a widget, so they round up to the next whole number. 17. Explain that now that we understand the expenses of the business and the costs
involved in each, we now explore how this information will be used in the business plan.
18. There are three main components to the financial analysis section of the business plan, the Sales Forecast, the Profit and Loss Projection, and the Break Even Point. Now that we understand how to calculate the Break Even Point, let’s go to the Sales Forecasting.
Part 2: Sales Forecasting 19. Sales Forecasting: Have students follow along on their copy of Handout 6.3 ‐ Sales
Forecasting as you discuss this process. 20. Explain that a very difficult part of preparing a business plan is estimating your sales
for the first three years. It is, however, necessary for a business owner to do this in

Entrepreneurship: Arkansas Style 6 ©BMCEE
order to anticipate levels of profit or to understand that the business idea may not be profitable. Prospective funders or investors will need to see it. Sales forecasting is an estimate that is based on industry trends. So that students can learn the process necessary for sales forecasting a simplified form of the Visual/Handout 6.6‐ Arkansas Gross Domestic Product by Industry is provided. Students will use this to look at the statistics for the Arkansas industries that are similar to theirs. This is a very important concept to business planning and is good mathematics practice also.
21. Business Constraints: Explain that all businesses face constraints. These can include many things but commonly businesses have to work with a limited amount of financial capital, limited amounts of tools or machines, or limited numbers of human resources. Very few businesses would be in a situation of having all of every input needed to produce their good or service. If they did the cost of producing it would be more than any consumer would want to pay.
22. Sales forecasting examples are provided for both a product (Krazy Kites) and a service (Dog Party USA). Normally, sales forecasting is completed for the first three years of business. For this curriculum we have made the forecast for the first three months.
23. Initial Sales Level: Explain that the first step to sales forecasting is to estimate your initial sales level. Begin by thinking about the constraints you face in your business. When brainstorming about these constraints, think about the time needed to build your product. This time of production will allow you to figure out how many units of a good or service you can produce in the first month. The number of goods or services you can produce in a month multiplied by the price you will charge for your product is the initial sales level. But, for this lesson the production periods are one month.
24. Estimate your initial sales level: Explain that you will help the students with this process going step by step. The first thing needed in order to estimate the initial sales level is to determine the time it takes to produce one unit of the good or service. If your business provides massages then how long does it take for an hour massage? Be sure to include the time to greet the customer and to prepare for the massage. If your business produces pizzas, then how much time does it take to produce on pizza?
Time of production = the number of hours to build one good or serve one customer
25. Explain that to determine the initial sales you need to use the following equation.
Please note that you must FIRST divide the 8 hours per day by the time of production and THEN multiply by the number of employees needed to produce one unit of the product time the 30 work days of a month.

Entrepreneurship: Arkansas Style 7 ©BMCEE
Initial Sales = [(8 hours per day) / (time of production)] X (# of employees) X (30 work days per month) X (Price of Good/Service)
26. Determine the industry growth rate for your product: Explain that students now
need to look at what has been happening in similar industries in their state. Have them use Visual/Handout 6.6 ‐ Arkansas Gross Domestic Product by Industry table in this lesson to locate which industry category their business fits into. Further descriptions of industry categories can be found by using the 2002 economic census at: http://www.census.gov/econ/census02/data/comparative/ARCS.HTM by clicking on the “more data” tabs.
27. Explain that this process may take some searching. The challenging part is determining in which category their product fits.
28. Step 3‐ Use industry growth rate to forecast future sales. Using the initial sales level and the industry growth rate, have students calculate the sales growth of their business using the following equations: 1st Month Sales = (Initial Sales level calculated in step 1)
2nd Month Sales = (Initial Sales Level) X (Industry Growth Rate) + (Initial Sales Level) Alternatively: 2nd Year Sales = (Initial Sales Level) X [1 + (Industry Growth Rate)]
3rd Month Sales = (2nd Year Sales) X (Industry Growth Rate) + (2nd Year Sales)
Alternatively: 3rd Year Sales = (2nd Year Sales) X [1 + (Industry Growth Rate)]
29. Divide students into two groups. Have them review the Sales Forecasting examples provided in this lesson. One is for a company that produces goods called Krazy Kites. The other is for a company that provides services called Dog Party USA.
30. Have students work through the examples using the directions provided. 31. Each group should select a spokesperson to describe the financials for that company
to the rest of the class. 32. Explain that understanding the costs of producing your product, the industry growth
rate, and projected sales are critical to the business planning process and to future success. This is an involved mathematical process but is good practice for the students and is a reality in the business world.
Closure: 33. Ask the students why a person starts a business. What is the incentive? What does
s/he expect to get in return for starting a business? (Answers will include suggestions such as being your own boss; because you have a passion for something; because it is a challenge; etc. Ultimately, you need to bring the discussion to the

Entrepreneurship: Arkansas Style 8 ©BMCEE
understanding that the incentive for operating a business is profit and that if the company is not profitable, it cannot remain in business.)
34. Discuss what factors cause the costs of production to change. (Change in resources prices; wage increases; government regulation or taxing; or use of new technologies)
35. Discuss why a producer would supply more of a product if the selling price increases and all other costs remain the same. (because there would be a greater profit margin)
36. Discuss what a entrepreneur can do if s/he develops a business plan and realizes s/he can’t make a profit at the projected price. (Choices include finding a way to reduce the cost of production or charging a higher price for the product if the market will allow it.)

Entrepreneurship: Arkansas Style 9 ©BMCEE
Handout 6.1 – Financial Concept Map
• Also called Costs of Goods Sold
• Varied depending on number of units sold
• Includes materials and labor
• Costs incurred without production
• Include rent, utilities, insurance, repairs, salaries

Entrepreneurship: Arkansas Style 10 ©BMCEE
Handout 6.2 – Financial Fun A Word About Profits There are two types of profit used to measure the success of a business. The first form of profit is economic profit. Economic Profit is defined as the difference between the firm’s revenues and the expenses (costs) and the opportunity costs involved in the business. The other, most commonly used type of profit, is known as accounting profit. Accounting Profit is simply the difference between the firm’s revenues and costs. Let’s look at an example.
Economic Profit = Firm’s Revenues – Costs – Opportunity Costs Accounting Profit = Firm’s Revenues – Costs
Mark has made the decision to quit his $3,000 a month job and start his own business. In order to cover the startup expenses he will incur, Mark elects to withdraw the money needed, $2,500, from his savings account which earns a 3.5% interest rate. The opportunity costs, in this case are Mark’s salary and the interest he would have earned on his savings account. The cost of withdrawing his money from savings $87.50 ($2,500 x .035). In his first month of business, he had generated $4,000 in sales and incurred costs of $1,800. As you can clearly see below, Mark earned an accounting profit of $2,200, but when he factors in what he would have earned if he did not start the business (the opportunity cost), he actually lost 887.50. This means that if Mark would have kept his job and not drawn out the $2,500, he would have been better off. In other words, the costs of starting the business outweighed the benefits he received. Accounting Profit: Economic Profit:
Revenue $4,000 Revenue $4,000.00
Costs − $1,800 Costs − $1,800.00
Accounting Profit
= $2,200 Mark’s Forgone Salary − $3,000.00 Mark’s Forgone Interest − $87.50
Economic Profit = ‐$887.50

Entrepreneurship: Arkansas Style 11 ©BMCEE
Expenses (Costs) There are two main expense categories for a business, startup expenses and operating expenses. All of the projected profits left over after these expenses that are included in the business plan and used in the business operations are Accounting Profits. Startup Expenses The firm will incur startup expenses when before they can open for business. These startup expenses include the categories of Rental Deposit, Utility Deposits, Business License, Equipment and Tools, Advertising, Business Cards and Brochures, Office Supplies, and Other Expenses. These startup expenses are included in the Company Overview section of the business plan. Along with the list of startup expenses, it is a good idea to inform your potential investors about what phases or steps are required to start your business. Technical Note: Before we discuss the two types of expenses, we need to distinguish between a cost and a price. When you produce a product or service you incur a cost of producing that good or service. The cost is the value your company has to pay to obtain raw materials or other goods necessary for production. A price is the value of the good or service the customer pays for your products or services. Here is an example: Krazy Kites use string as a raw material in the assembly of their kites. When the string is purchased from a supplier, Krazy Kites incurs the cost for the sting. When Krazy Kits use the string to make a kite, the kite is sold at a designated price to their customers. Operating Expenses These operating expenses are further broken down into production costs and overhead costs. These expenses are the cost of the firm’s day‐to‐day production activities. Production Costs (Variable Costs) Production Costs are also known as Variable Costs or Cost of Goods Sold on the Profit and Loss Statements. As their name implies, variable costs vary depending on the number of units the company produces. Types of variable costs include the cost of all the materials and labor cost used to produce the product.

Entrepreneurship: Arkansas Style 12 ©BMCEE
Overhead (Fixed Costs) Overhead or fixed costs are costs that the company incurs even if they choose not to produce any products. These costs include rent, utilities (power, water, etc.), insurance costs, equipment repairs, and salaries (non‐hourly wages). These overhead costs are paid for by what is known as the contribution margin. The contribution margin is calculated by taking the price the company charges for the good or service and subtracting the variable cost per unit.
Contribution Margin = Price of goods/services – Variable Costs per unit
This contribution margin is used to pay for the overhead costs. Here is an example: Krazy Kites use $1.00 per kite in raw materials and $3.00 per kite in labor, thus the total variable costs are $4.00 per kite. Krazy Kites will set a price of $10.00 for each kite. So the contribution margin is $10.00 ‐ $4.00 = $6.00 per kite. This means that $6.00 of every kite sold will contribute to paying down the overhead costs. Once the overhead costs and the startup costs have been paid, then the excess funds will become profit for the company (remember this is accounting profit).
Let’s look at another example to highlight the differences between variable and fixed costs and how we can account for all these costs. Widget World creates custom widgets for special machines. Suppose the cost of the raw materials to produce widgets is $3.00 per unit which includes, metal, bolts, washers and nuts. Each Widget World worker makes $6.00 and hour and it takes each worker fifteen minutes (1/4 of an hour) to produce one widget. In order to calculate the labor cost of producing one widget we take the hourly wage $6.00 and divide by ¼ to get the labor cost for each widget produced, in this case $1.50. The total variable cost per widget is $3.00 materials + $1.50 labor = $4.50. Widget World has the following overhead costs, Rent‐$125, Utilites‐$80, and salries‐$150 for a total overhead cost of $355.00 per month. Widget World sells it widgets for $15.00 each. This means the contribution margin is $15.00 (Price) – $4.50 (Var. Cost) = $10.50, so $10.50 of every sale will contribute to the overhead costs of $355.00 per month.
The Break‐Even Point When an entrepreneur starts his or her own company, the incentive to the entrepreneur is the potential of earning a profit. In order to determine at what point a company will earn a profit, the break‐even point needs to be calculated.

Entrepreneurship: Arkansas Style 13 ©BMCEE
The break‐even point is defined as the number of units the company needs to sell in order to cover all operating costs and payoff the startup costs. In other words, the point at which the company begins to earn a profit. The break‐even point is calculated by taking the price per unit and subtracting the variable cost per unit to get the contribution margin. Then add the fixed cost and the startup costs together. The final step is to divide the combined fixed and startup costs by the contribution margin to get the number of units that need to be sold to break even.
Price per Unit −
Variable Cost per Unit
Contribution Margin =
Total Fixed Costs
+ Total Startup Expenses
Fixed + Startup Costs = Divide =
Let’s use the Widget World example to see how the break‐even point is calculated. Remember the price per unit was $15.00, the variable cost was $4.50 per unit, so the contribution margin was $10.50 per unit. The overhead costs were $355.00 and Widget World had $600.00 of startup expenses. Here is the break‐even point calculation:
Price per Unit $15.00
− Variable Cost per Unit $4.50
Contribution Margin = $10.50
Total Fixed Costs $355.00
+ Total Startup Expenses $600.00
Fixed + Startup Costs = $955.00 Divide $10.50 = 91 units*

Entrepreneurship: Arkansas Style 14 ©BMCEE
*Note: Widget World technically needs to sell 90.95 widgets, but they cannot sell .95 of a widget, so they round up to the next whole number. Now that we have surveyed the expenses of the business and the costs involved in each, we now look at how this information will be used in the business plan. There are three main components to the financial analysis section of the business plan, the Sales Forecast, the Profit and Loss Projection, and the Break‐Even Point.

Entrepreneurship: Arkansas Style 15 ©BMCEE
Handout 6.3 – Sales Forecasting Process Sales Forecasting: A very challenging part of preparing a business plan is
estimating your sales for the first three years. It is, however, necessary for a business owner to do this in order to anticipate levels of profit or to understand that the business idea may not be profitable. It is an estimate that is based on industry trends. For your calculations you will use a summarized form of the Industry Growth Domestic Product for Arkansas. In other words, you analyze the statistics for the Arkansas industries that are similar to yours. This is a very important concept to business planning and is good mathematics practice too.
Business Constraints: All businesses face constraints. These can include many
things but commonly businesses have to work with a limited amount of financial capital, limited amounts of tools or machines, or limited numbers of human resources. Very few businesses would be in a situation of having all of every input needed to produce their good or service. Examples are provided for both a product (Krazy Kites) and a service (Dog Party USA). Normally, sales forecasting is completed for the first three years of business. For this curriculum we have made the productions periods one month each.
Initial Sales Level: To estimate your initial sales level, think about the constraints
or limitations you face in your business. A good example is to think about the time needed to create one unit of your good or service. This time of production will allow you figure out how many good or services you can produce in the first month. The number of goods or services you can produce in a month multiplied by the price you will charge for your good/service is the initial sales level. Note: In real businesses the forecasting is done for three years rather than three months.
1. Estimate your initial sales level
Time of production = the number of hours to build one good or serve one customer.
Initial Sales = [(8 hours per day) / (time of production)] X (# of employees) X (30 work days per month) X (Price of Good/Service)

Entrepreneurship: Arkansas Style 16 ©BMCEE
Note: You must divide 8 hours per day and the time of production first, THEN multiply by the number of employees and the 30 work days. 2. Determine the industry growth rate for your product Use Visual/Handout 6.3: Arkansas Gross Domestic Product by Industry table provided in this lesson to locate which industry category your business fits into. Further descriptions of industry categories can be found by using the 2002 economic census at: http://www.census.gov/econ/census02/data/comparative/ARCS.HTM by clicking on the “more data” tabs. 3. Use industry growth rate to forecast future sales: Using the initial sales level and the industry growth rate you can now calculate the sales growth of your business by: 1st Year Sales = (Initial Sales level calculated in step 1) 2nd Year Sales = (Initial Sales Level) X (Industry Growth Rate) + (Initial Sales Level) Alternatively: 2nd Year Sales = (Initial Sales Level) X [1 + (Industry Growth Rate)] 3rd Year Sales = (2nd Year Sales) X (Industry Growth Rate) + (2nd Year Sales) Alternatively: 3rd Year Sales = (2nd Year Sales) X [1 + (Industry Growth Rate)]
Hopefully, you now have the financial information you need and it was not too difficult!

Entrepreneurship: Arkansas Style 17 ©BMCEE
Handout 6.4 – Sales Forecasting Example ‐ Krazy Kites Initial Sales Level: The owners of Krazy Kites want to forecast the initial sales level for the new company. The initial sales of Krazy Kites are calculated by using the estimated time of production. The owners have determined that their time of production is 30 minutes or ½ hour. This means that it will take ½ hour to assemble each kite from start to finish. Krazy Kites will begin with only three employees who can only work 8 hours per day. Using this constraint, they can calculate how many kites they can service in a month and multiply this number by the price they will charge for each kite to find the 1st month’s initial sales level. Krazy Kites has looked at all the costs involved in producing its kites and has decided to sell them for 12.00 each.
Time of Production = ½ hour Number of Employees= 3
Plugging these numbers into our equation:
Initial Sales = [(8 hours per day ) / ( time of production)] X (number of employees) X (30 work days per month ) X (Price of Good/Service) Initial Sales = [(8)/(.5))] X (3) X (30) X ($12)=$4,320.00
So the initial sales level for Krazy Kites will be approximately $4,320 for the first month. The owners now want to see how their business will grow over the next two months. In order to accomplish this goal, they need to apply step 2 of the sales forecasting technique. The owners have conducted their market research and have discovered that their kite company is a manufacturing business. After looking over the “Arkansas Gross Domestic Product by Industry” they find that the most specific category for their business is the broad category of “Doll, Toy, & Game Manufacturing.”

Entrepreneurship: Arkansas Style 18 ©BMCEE
Industry Average Growth Rate
Miscellaneous Manufacturing ‐0.06 Sporting & Athletic Goods Manufacturing ‐0.06 Doll, Toy, & Game Manufacturing ‐0.06
They locate the “average growth rate” column from the “Doll, Toy, & Game Manufacturing” row of the table and discover that the average growth rate in the “Doll, Toy, & Game Manufacturing” category is approximately ‐6% (‐0.06). This negative growth rate means that the toy business is a very poor industry to enter based on the negative average growth rate. The first year (initial) sales are $4,320 calculated from step 1 above. To find the second year’s sales level they apply the “2nd Month Sales” formula (or use the sales forecasting program): 2nd Month Sales = (Initial Sales Level) X (Industry Growth Rate) + (Initial Sales Level) 2nd Month Sales = [(4,320) X (‐0.06]) + (4320) = $4,060.80. To find year three’s sales level they use the year 2 sales level ($4,579.20) and apply the “3rd Month Sales “formula using the same average growth rate used in forecasting year two’s sales level: 3rd Month Sales = (2nd Year Sales) X (Industry Growth Rate) + (2nd Year Sales) 3rd Month Sales = [(4060.80) X (‐0.06]) + (4060.80) = $3,817.15 The results of the sales forecast suggest that for the next three months, the sales level for each month will be:
Month 1 $4,320.00Month 2 $4,060.80Month 3 $3,817.15
Now that Krazy Kites’ owners have a solid sales forecast, they can use these sales values to input the sales level into the Profit and Loss Statement. However, they will need to come up with a very convincing story to explain how they plan to generate positive growth with their business. If the owners can build a strong case for why their company will be successful, then they can recalculate the sales forecast using a 1.5% (.015) growth rate to indicate sluggish growth.

Entrepreneurship: Arkansas Style 19 ©BMCEE
Handout 6.5 – Sales Forecasting Example: Dog Party
Sales Forecasting Example: Service Business
The owners of Dog Party USA want to forecast the initial sales level for the new company. The initial sales of Dog Party USA are calculated by using the estimated total capacity. Dog Party will begin with only two employees. The owners have determined that their capacity constraint is 15 dogs. This means that they only have enough room and staff to care for 15 dogs per day. Using this constraint, they can calculate how many dogs they can service in a month and multiply this number by the price they will charge for each dog party to find the 1st month’s initial sales level. Dog Party USA estimates that each dog will generate an average of $45.00.
Service Constraint (Max. number of dogs) = 15
Plugging these numbers into our equation:
Initial Sales = [(service constraint)] X (30 work days per month) X (Price of
Good/Service)
Initial Sales = [(15)] X (30) X ($45) = $20,250.00
So the initial sales level for Dog Party USA will be approximately $20,250.
The owners now want to see how their business will grow over the next two months. In order to accomplish this goal, they need to apply step 2 of the sales forecasting technique.
The owners have conducted their market research and have discovered that their pet day care is a service business. After looking over the “Arkansas Gross Domestic Product by Industry” they find that the most specific category for their business is the broad category of “Other Services.”
Industry Average Growth
Rate Services 0.10 Repair and Maintenance 0.06 Other Services 0.06

Entrepreneurship: Arkansas Style 20 ©BMCEE
They locate the “average growth rate” column from the “other services” row of the table and discover that the average growth rate in the “other services” category is approximately 6% (0.06). The first month’s (initial) sales are $20,250 calculated from step 1 above. To find the second year’s sales level they apply the “2nd Month Sales” formula (or use the sales forecasting program): 2nd Month Sales = (Initial Sales Level) X (Industry Growth Rate) + (Initial Sales Level) 2nd Month Sales = [(20,250) X (0.06]) + (20,250) = $21,465.00 To find month’s sales level they use the year 2 sales level ($21,465.00) and apply the “3rd Month Sales “formula using the same average growth rate used in forecasting year two’s sales level: 3rd Month Sales = (2nd Year Sales) X (Industry Growth Rate) + (2nd Year Sales) 3rd Month Sales = [(21,465) X (0.06]) + (21,465) = $22,752.90 The results of the sales forecast suggest that for the next three months, the sales level for each month will be:
Month 1 $20,250.00Month 2 $21,465.00Month 3 $22,752.90
Now that Dog Party USA’s owners have a solid sales forecast, they can use these sales values to input the sales level into the Profit and Loss Statement.
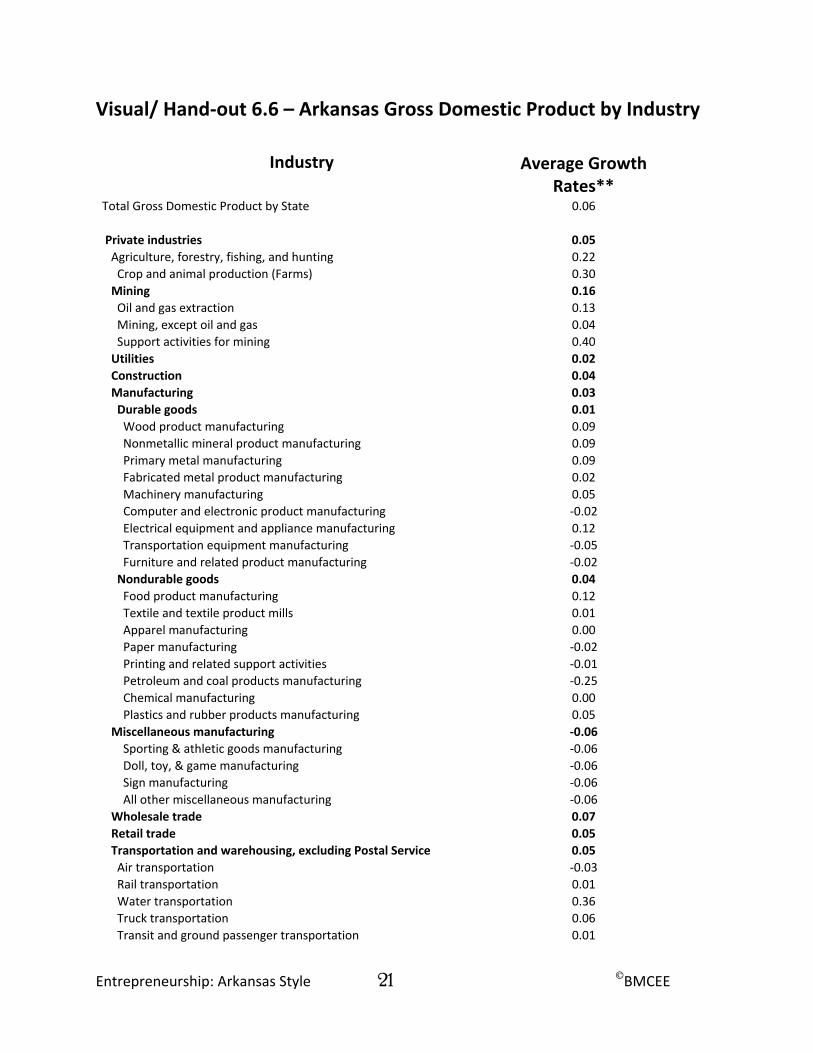
Entrepreneurship: Arkansas Style 21 ©BMCEE
Visual/ Hand‐out 6.6 – Arkansas Gross Domestic Product by Industry
Industry Average Growth Rates**
Total Gross Domestic Product by State 0.06
Private industries 0.05 Agriculture, forestry, fishing, and hunting 0.22 Crop and animal production (Farms) 0.30 Mining 0.16 Oil and gas extraction 0.13 Mining, except oil and gas 0.04 Support activities for mining 0.40 Utilities 0.02 Construction 0.04 Manufacturing 0.03 Durable goods 0.01 Wood product manufacturing 0.09 Nonmetallic mineral product manufacturing 0.09 Primary metal manufacturing 0.09 Fabricated metal product manufacturing 0.02 Machinery manufacturing 0.05 Computer and electronic product manufacturing ‐0.02 Electrical equipment and appliance manufacturing 0.12 Transportation equipment manufacturing ‐0.05 Furniture and related product manufacturing ‐0.02 Nondurable goods 0.04 Food product manufacturing 0.12 Textile and textile product mills 0.01 Apparel manufacturing 0.00 Paper manufacturing ‐0.02 Printing and related support activities ‐0.01 Petroleum and coal products manufacturing ‐0.25 Chemical manufacturing 0.00 Plastics and rubber products manufacturing 0.05 Miscellaneous manufacturing ‐0.06 Sporting & athletic goods manufacturing ‐0.06 Doll, toy, & game manufacturing ‐0.06 Sign manufacturing ‐0.06 All other miscellaneous manufacturing ‐0.06 Wholesale trade 0.07 Retail trade 0.05 Transportation and warehousing, excluding Postal Service 0.05 Air transportation ‐0.03 Rail transportation 0.01 Water transportation 0.36 Truck transportation 0.06 Transit and ground passenger transportation 0.01

Entrepreneurship: Arkansas Style 22 ©BMCEE
Pipeline transportation 0.14 Other transportation and support activities 0.11 Warehousing and storage ‐0.02 Information 0.06 Publishing including software 0.05 Motion picture and sound recording industries 0.04 Broadcasting and telecommunications 0.06 Information and data processing services 0.19 Finance and insurance 0.05 Federal Reserve banks, credit intermediation and related services 0.07 Securities, commodity contracts, investments 0.03 Insurance carriers and related activities 0.02 Funds, trusts, and other financial vehicles 1.55 Real estate, rental, and leasing 0.06 Real estate 0.06 Rental and leasing services and lessors of intangible assets 0.02 Professional and technical services 0.09 Legal services 0.06 Computer systems design and related services 0.09 Other professional, scientific and technical services 0.11 Management of companies and enterprises 0.00 Administrative and waste services 0.06 Administrative and support services 0.06 Waste management and remediation services 0.14 Educational services 0.10 Health care and social assistance 0.07 Ambulatory health care services 0.07 Hospitals and nursing and residential care facilities 0.07 Social assistance 0.11 Arts, entertainment, and recreation 0.02 Performing arts, museums, and related activities ‐0.01 Amusements, gambling, and recreation 0.05 Accommodation and food services 0.05 Accommodation 0.04 Food services and drinking places 0.06 Services 0.10 Repair and Maintenance 0.06 Other Services 0.06