business intelligence with deltamaster: look, see, dolook, see, do. it’s the final stretch of the...
TRANSCRIPT
Business Intelligencewith DeltaMaster:Look, see, do

We makedata visible.
2
Look, see, do.
It’s the final stretch of the process that determines whether Business Intelligence makes an impact – or not. After all, if people don’t read reports, under-stand them, and take appropriate actions, all of the time and effort spent collecting, saving, and prepa-ring data was for nothing. The conditions for human perception are complex, but not as individual as you might think. We have focused on these common traits and used them to design information systems. Universal standards for reports and analyses trigger signals that communicate variances and manage-ment information faster and clearer than ever before. That’s just one reason why the best-managed companies steer their business performance with DeltaMaster. Here are many others.
3
4
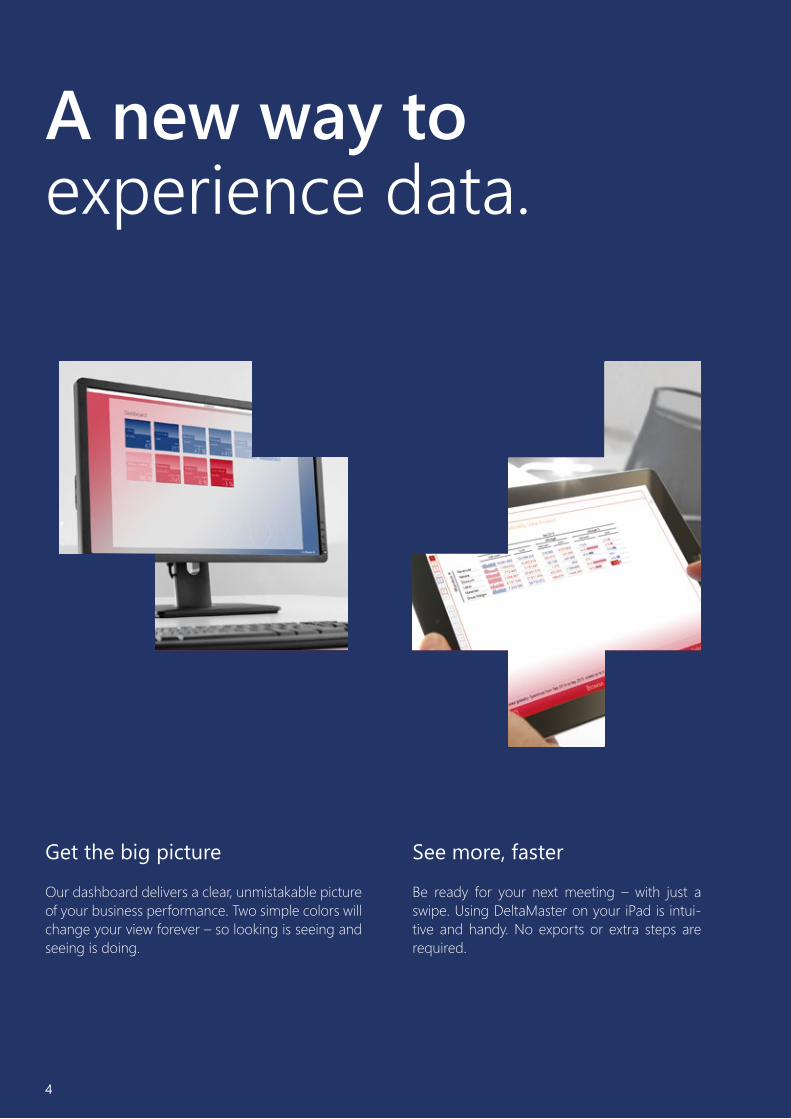
A new way to experience data.
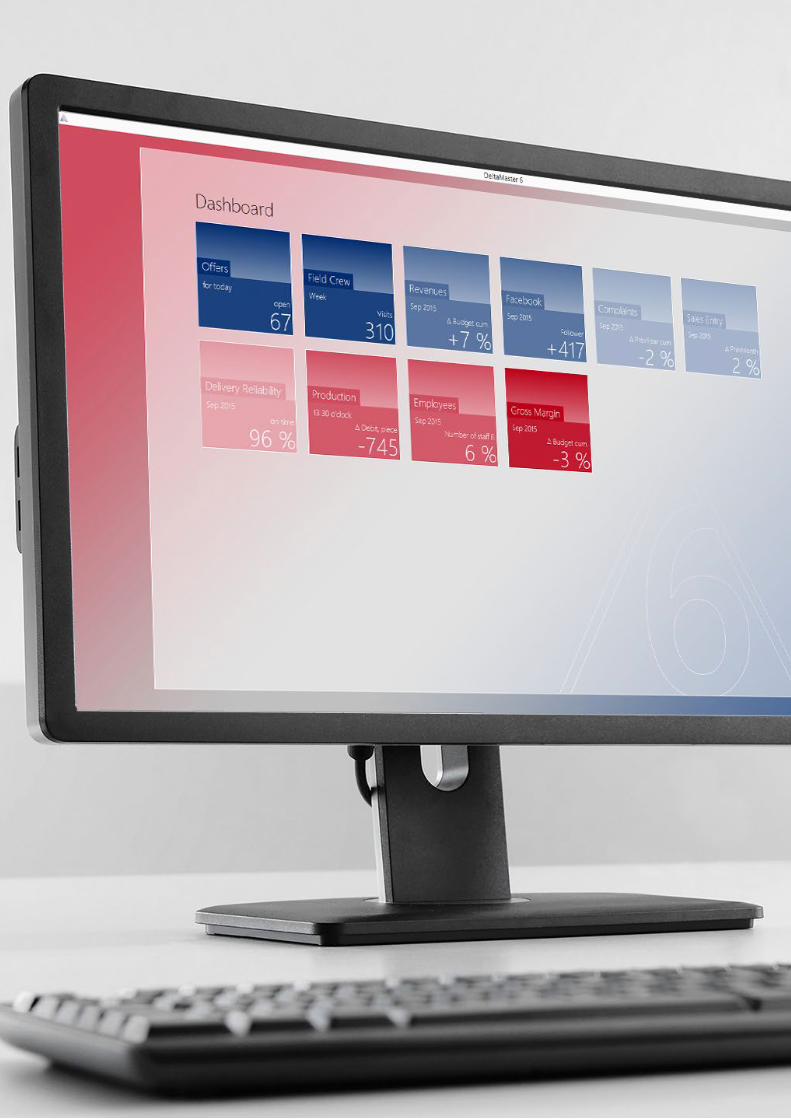
Get the big picture
Our dashboard delivers a clear, unmistakable picture of your business performance. Two simple colors will change your view forever – so looking is seeing and seeing is doing.
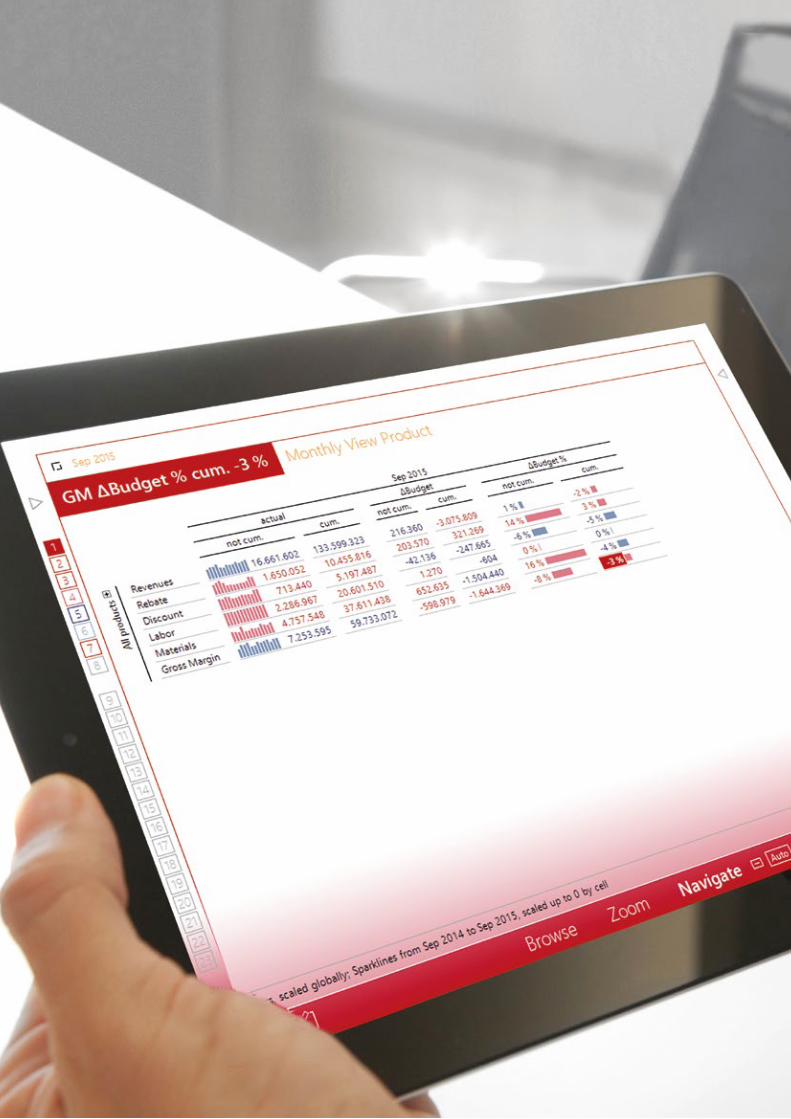
See more, faster
Be ready for your next meeting – with just a swipe. Using DeltaMaster on your iPad is intui-tive and handy. No exports or extra steps are required.
5
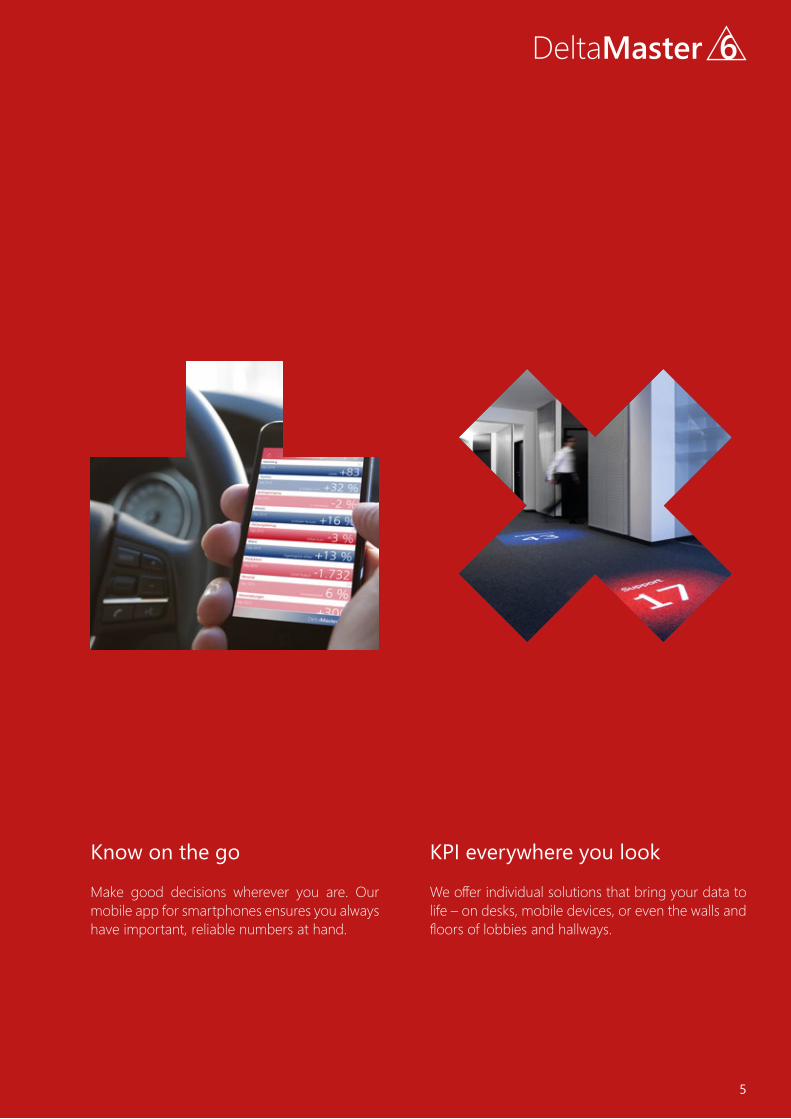
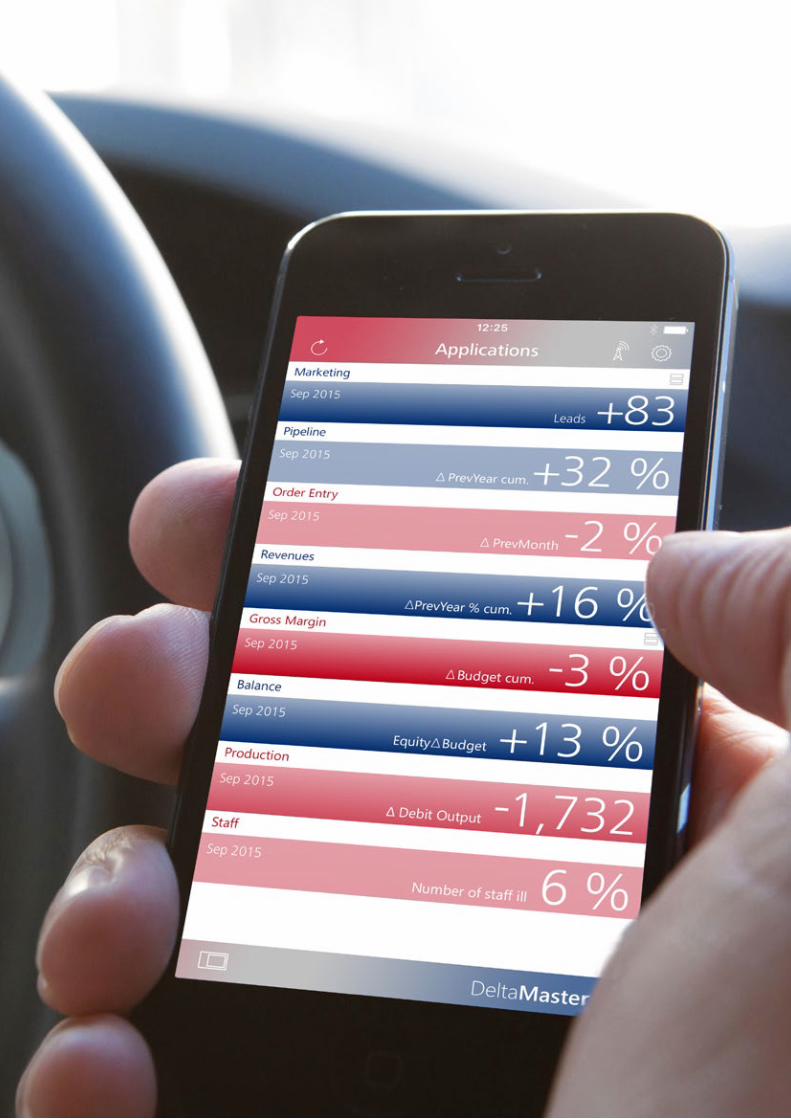
Know on the go
Make good decisions wherever you are. Our mobile app for smartphones ensures you always have important, reliable numbers at hand.
KPI everywhere you look
We offer individual solutions that bring your data to life – on desks, mobile devices, or even the walls and floors of lobbies and hallways.

A dashboard in DeltaMaster serves as a gateway to all your analysis and reporting applications. You can assign a main KPI – for example, incoming orders, gross margin, pipeline, or close rates – to every application. DeltaMaster will then transform it into an impressive, color-coded overview of your current business performance so you know which topics you
should focus on first. DeltaMaster even takes care of the parameterization, configuration, and layout for you.
Every company needs standard reports to steer performance, analyze variances, and forecast future business activities. With DeltaMaster, you can generate them in minutes with the help of the start wizard. Using drag-and-drop functions, you simply choose the desired methods to measure perfor-mance – for example, gross margin calculations, P&L, or input-output calculations in short- and long-term views. The wizard will automatically integrate all necessary structures to dynamically calculate cumu-lations and variances to the budget or previous year into your data model. Many other so-called BI tools can’t even do that manually, let alone automatically.
With a single click, you can create forecasts and pro-jections for all actuals in DeltaMaster. Choose from simple, robust methods such as exponential smoo-thing and linear regression, values calculated from external modules, or a custom method developed by our forecasting experts. You can also create custom forecast models with the help of simple dialog boxes and powerful MDX queries.
02 Standard Reporting
01 Intelligent dashboards
03 Integrated forecast
Why we can dowhat we do.
6
7
8

For enterprise reporting and KPI monitoring, you use the interfaces to the usual data warehouse systems of the major vendors. Unlike other products, DeltaMaster does not use proprietary data storage. Many of our clients value this independency. We sup-port the following databases: Microsoft SQL Server/Analysis Services, SAP BW/Netweaver BI/HANA, IBM Cognos TM1, Oracle OLAP, Oracle Essbase, Infor.
With DeltaMaster, you can design highly individua-lized applications for sales, purchasing, production, logistics, finance, marketing, CRM, after sales, sales planning, quality assurance, field sales management, etc. Since it is a standard product, all clients receive the exact same software and all existing applications stay compatible following a system update. We also integrate specific requests into the system so that our entire client base profits from the added func-tionality.
DeltaMaster helps you share insights quickly and easily. Add extensive comments, send a report spontaneously, or work with other report editors simultaneously on the same application with the RepositoryService.
04 Open data storage
05 Flexibility
DeltaMaster manages data usage and access in a role-base access model. Executives and supervisory board members love DeltaMaster for its clear, pre-cise, performance control templates and reports that work just as well on paper or a tablet as on a PC. Managing directors and department managers appreciate the option to explore details – either through pre-defined analysis paths or automatically generated paths in the result hierarchies. When asked to look into more specific questions, execu-tive assistants and support teams are pleased that
they can probe even deeper or switch perspectives all within the same tool. This supports the smooth transition between roles and responsibilities that is typical in modern companies. DeltaMaster RepositoryService ensures that data and roles fit together.
07 Role-based access
06 Collaboration
9
10

DeltaMaster offers a selection of tried-and-tested business methods. These include rankings, time series, portfolio, concentration, map, location, and cross-table analyses, early warning signals, and drill-through functions to individual postings. These methods require no parametrization and are designed to work on every data model.
DeltaMaster gives your management support teams the leeway they need to conduct creative, experi-mental analyses. This includes slice-and-dice or pivoting functions to compare and analyze customers, regions, products, or other attributes on any level. You can group and classify objects by attributes dynamically or with fixed thresholds – regardless of their values. Wizards help you calculate quotients, sums, variances, or multivariate statistical values.
Using drag-and-drop functions, you can visualize the results with circle, bar, or column elements. You can even apply differences to averages, cumulated variances, and other complex calculations to existing data with just a click of a button.
08 Ad hoc analysis
09 Business methods
DeltaMaster flexibly accommodates the unique fea-tures of modern output media. Most people, for example, view mobile devices in portrait mode but standard computer screens in landscape mode. Both the design templates and functional concepts in DeltaMaster take this into account. The reports of DeltaMaster look just as impressive on the big screens of laptops, desktops, kiosk systems, and business control centers as the smaller displays of smartphones and tablets. You can centrally store data and applications in the cloud and use them both online or offline.
10 Mobility
11
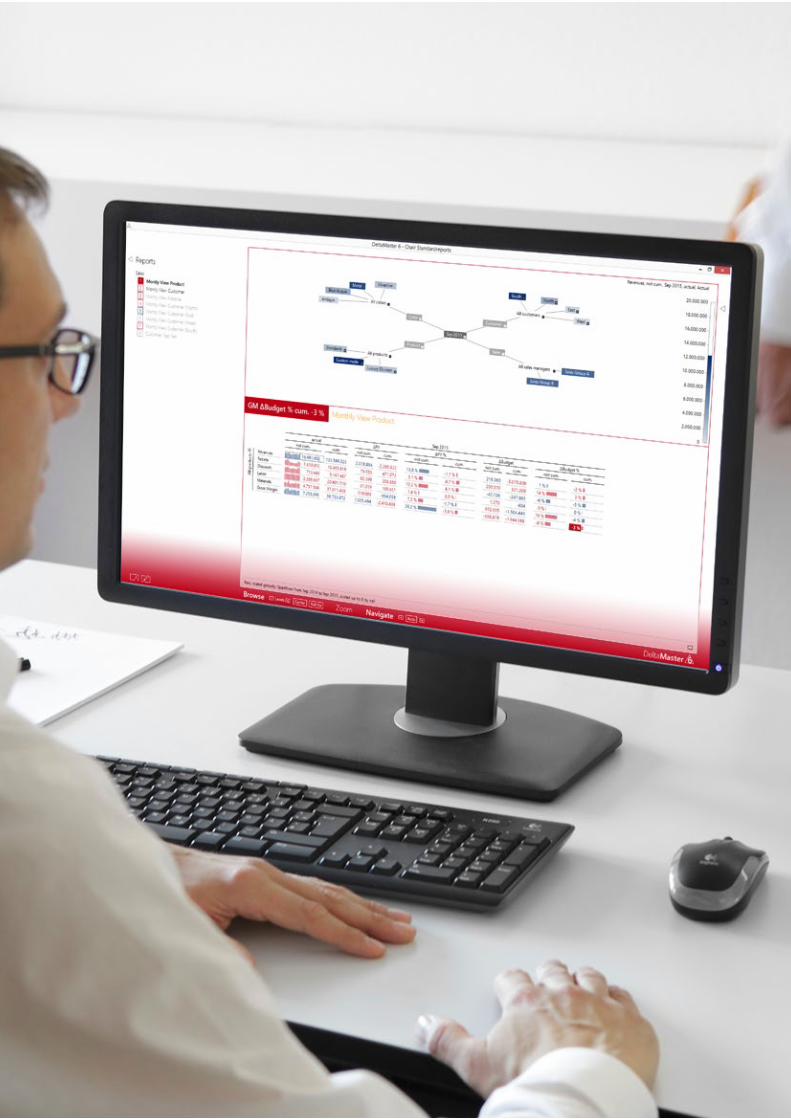
Your numbers,our graphics.Most commonly used chart types are outdated, skimpy, and poorly done. Time series that use a linear scale are often deceiving. Pie charts are dif-ficult to read. Bars and columns simply do not cope well when the values have a broad range. All of them need large spaces to display small amounts of information. It’s no wonder. The Scot-tish engineer and economist William Playfair invented charts over two centuries ago and not much has changed since then.
Today’s decision-makers, however, are starving for information. That’s why DeltaMaster works extensi-vely with graphic tables. This trustworthy, data-dense format complements the numerical values in a pivot table with bars, columns, circles, or sparklines.
Graphic tables combine the tidiness of a table with the attractiveness of a chart. Tables are compact, data dense as well as easy to understand and read. Gra-phics grab your attention, communicate an intuitive impression of the value distribution, reveal patterns,
and direct your focus. As a general rule of thumb, the charts in graphic tables serve as a guide while the numbers make you think. The graphic elements adapt to the predefined cell heights and labels stay where they belong.
Due to these stable formats, you can create and update graphic tables automatically. This makes them an ideal tool for highly automated, data-driven reporting with DeltaMaster. We call this industrial-style reporting because, similar to indus-trial manufacturing, it standardizes many steps and produces reports at low costs in consistently high quality.
12

13
DeltaMaster brings the power of data mining to business users. This helps you conduct analyses without knowing the objective beforehand. Instead, the data should reveal it. With DeltaMaster, setting the necessary parameters is simple. You get results and clear explanations that you can simply pass on to management without any additional work. Sup-ported methods include multidimensional rankings, component comparisons, shopping cart analyses, and Bayes method.
DeltaMaster supports spontaneous self-service analysis – even on new pools of data. Once you have imported your Excel, Access, or other relati-onal sources, you can get right to work. During the modeling process, DeltaMaster automatically reco-gnizes measures and dimensions as well as which levels belong to a hierarchy. Best of all, users don’t require IT support or special technical skills. With just a few steps, they can access their data in a clean, structured model for further analysis.
DeltaMaster automatically enters the suitable charts in your evaluations and suggests the correct gra-phical visualization for any tables. An analysis wizard examines cross tables for outliers using cluster ana-lysis and other methods. To apply more complex methods such as distribution or regression analysis,
you only need a few prior instructions. No program-ming is necessary.
11 Data Mining
12 Self-service BI
13 Guided Analytics
14
The improved signaling in DeltaMaster helps you find your whereabouts quickly. It avoids the ambi-guity of traffic-light functions, uses more effective colors from a physiological standpoint, and requires no parameters. DeltaMaster colors all values and graphic elements in shades of blue and red – depen-ding on if they have a positive or negative effect on a specific KPI or your business as a whole. It applies this same principle to the program interface, edge of the screen, report lists, headlines, and other elements. This communicates a clear message that you cannot miss – even with just a quick glance at your desk or from afar on a kiosk system or business control center. What’s more, DeltaMaster always lists the values that are primarily responsible for the respective coloring.
Where is there room from improvement? Starting from the KPIs of your dashboard, DeltaMaster will guide you to those exact areas – whether in your product range, organization, suppliers, clients, or cost centers. DeltaMaster applies award-winning methods, for example, that document a chain of underlying causes. You can define typical paths as a predefined succession of clicks and keep sight of both the starting point and path travelled.
14 Signaling
15 Analysis paths DeltaMaster contains the statistical functions you need to conduct special analyses on campaigns, web visits, quality, or customer surveys. Using wizards you can create univariate and multivariate KPIs. Box plots help visualize prices and other ranges. DeltaMaster draws trend arrows and concentration curves – correctly, neatly, and fully automatically. Separate modules for distribution and regression analyses are also available.
16 Statistics
15
DeltaMaster is a drag-and-drop product. All impor- tant steps you need to use and create reports work with simple, intuitive mouse movements. Our menus have very few icons. Instead, they display the effect of a command in plain words. Whereas other vendors cannot make up their minds, we work with robust, tried-and-tested default settings for colors, scales, captions, layout, etc. DeltaMaster requires fewer buttons and clicks than other BI products – on all user levels.
The patented Hyperbrowser of DeltaMaster sheds light on complex structures – quickly and securely. You simply drag and drop a measure into the data model, and DeltaMaster will color code it to show if it has a positive or negative effect on the result. This instantly reveals compensating effects hidden in your data. The graphic tables in DeltaMaster make data-dense reports understandable at a glance. Interactive in-cell charts such as zoomable sparklines deliver more details as they grow larger.
The integrated planning functionality in DeltaMaster completes the cycle of planning, analysis, and reporting. The software supports top-down and bottom-up data entry on cell and aggregated levels as well as fixed values and multi-level cell comments. Intelligent cells „know“ how to allocate entries. You can instantly integrate multidimensional, real-time analyses in the planning application to test the plausibility during the data-entry process and gauge the effects on the results. You can also display the planning status of different organizational units in the dashboard.
17 Easy handling
18 Visual Analytics 19 Data entry and distribution
16
17
18

DeltaMaster automatically generates personalized reports – even for hundreds of users. Based on templates that you have generated, DeltaMaster reloads the data, applies colors and warning signals, adapts reports to user-specific criteria, and takes care of exporting, emailing, or storing the file. You can trigger this process with a click of a button, at a set time (e.g. daily, weekly, monthly) or following an event (e.g. exception reporting).
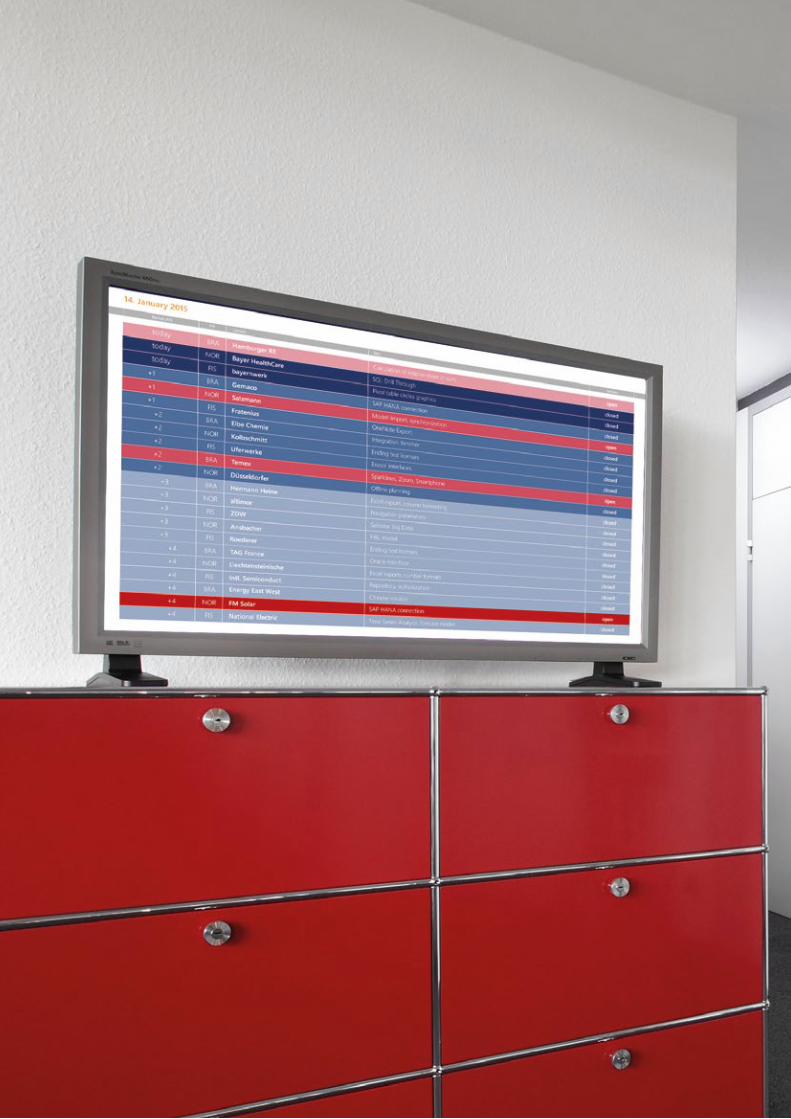
DeltaMaster makes the information in your company accessible and instantly usable without any setup times and little to no interaction. We offer solutions for kiosk systems, monitor walls, and business control centers. Mobile users do not need to take their devices with them – there are devices ready where you need them. You can also integrate images, films, Web sites, and video streams as part of a multimedia corporate communications concept.
You can display all DeltaMaster applications cen-trally in a separate, automatically configured portal or integrate them in leading portal systems such as Microsoft SharePoint. In combination with DeltaMaster Repository, the portal applies the valid permissions and roles for individual users. Single-sign-on options are supported.
DeltaMaster delivers powerful BI for both head-quarters and branch offices. DeltaMaster Repository administers all users, reports, and permissions and applies them to Windows, Web, and mobile environ-ments. This ensures consistent applications that are easy to update and maintain. You can also use DeltaMaster offline, which is especially useful in global planning and budget consolidation processes.
20 ReportServer
21 Portal
22 Cloud BI 23 Kiosk systems and business control centers
19

How we knowwhat we can.1996 Best of Byte – Systems ’961997 Impressive automation of the routine – c’t1998 Hot! Definitely up to the task – Testcenter Infoworld1999 User friendly and intuitive – WHU Koblenz2000 Best Software Frankreich2002 Recommendation MegaMetrics2003 Leading Product – Byte Spanien2004 Very clever! – Edward Tufte2005 Service Management Price – KVD Germany2007 Innovation price – German Informatics Society (GI)2010 Visualization guidebook „Bella consults“2011 Patent for Sparkline technologie2012 #1 für performance, support, implementation – BI Survey2013 Best Practice Award BI in Germany2014 Best Practice Award BI in Austria2015 Best Practice Award BI in Germany
20
„High performance, fast implementation – that’s why we chose DeltaMaster.“Oliver Kissel, Daimler „The reports have impressed our entire management team.“Thomas Rieß, Schwartau „Thanks to DeltaMaster, our reports all have a consistent look and feel. That helps build acceptance and understanding – not to mention our user base.“Reto Märki, Würth International „We chose DeltaMaster because the costs are moderate, the flexibility is outstanding, and competent consul-tants helped us with the implementation.“Lothar Tuttas, Hansainvest „The compelling product and competent consultants were the main reasons we chose Bissantz. Plus, we have direct support whenever we need urgent help.“Jörg Lasner, Norma Group „With our DeltaMaster solution, we can analyze our company’s entire subscription marketing.“Ralf Vollert, Bauer Media Group „Our calculations are much more precise with DeltaMaster. We can now detect unknown correlations on our own, and the automated analyses help us focus on what is truly important.“Heike Wüsthoff, Gustav Alberts „Our senior management uses DeltaMaster to detect outliers in KPIs and examine them without needing assistance from IT or management accounting.“Soenke Stange, VELUX „Our dream of sitting in an executive meeting and spontaneously getting the numbers for a specific region or individual properties is now reality.“Jörg Kesting, Siemens Real Estate
21
You can export DeltaMaster analyses and reports to HTML, PDF, Word, Excel, and PowerPoint files. For writing-intensive reports with custom designs, DeltaMaster also offers a live integration in Word. With this add-in, you can transfer reports and report elements down to individual cells and update them dynamically. This functionality is also available for PowerPoint.
In corporation with Germany’s largest corporations and midsize companies, we conduct research in a variety of fields including executive management, employee motivation, perception/visualization, and data analysis/forecasting. These insights flow into best practice applications that serve as prototypes for new solutions. To ensure that our R&D profits from scientific findings, we conduct our own basic research and participate in cooperative research projects. Our analytic and visualization methods have received multiple patents as well as the innova-tion award from the German Informatics Society (GI).
DeltaMaster is a pioneer in visualization and design. Sparklines, graphic tables, and performance-based color coding are just a few examples of the visual standards that DeltaMaster sets. We synchronize our layout, color, structures, and warning concepts with scientific laws of perception that apply to the brain, eyes, and ears – regardless of personal preferences and customs. This ensures that even new users quickly feel comfortable working with DeltaMaster reports.
24 Office Integration
25 Innovation
26 Information Design
22

23
27We have perfected the reports and analyses in DeltaMaster in cooperation with the experts at Porsche Design Studio. The results are a high-resolu-tion feast for your eyes. DeltaMaster always comple-ments the available data and presents a dramatic, intuitive overview or precise detail.
65 to 80 percent of project steps are identical in all companies. That’s why we offer prebuilt functionality to simplify, unify, and automate these steps. Our ETL tools are designed for end users and even used by large clients.
If you need support, our excellent team of consul-tants can help you configure or even operate con-tinual, automated data management – even from heterogeneous sources. We invest one day a week in training our consultants.
Studies such as the BI Survey from BARC regularly confirm that our clients are pleased with our pro-duct, service, and support. This is primarily due to the fact that our consultants answer many of our cli-ents’ questions directly. They aren’t just fluent in BI, they are native speakers who offer their experience to tackle all your business, technical, and project-spe-cific challenges. When you call our hotline, you are connected to our office – and not some call center.
Product design fromPorsche Design Studio
28 Prebuilt functionality
30 Consulting
29 Customer satisfaction
24
33
To support special application topics, we work with partners who are tightly integrated with our deve-lopment and shine in their fields of expertise. The offerings of our partners range from pre-configured DeltaMaster solutions that support specific industries or processes to long-term operations.
Our clients use DeltaMaster to gear up for the fierce competition in their markets. Some have won prizes for their innovative applications – for example, the Best Practice Award BI of the BARC Institute or the Service Management Prize the German Customer Service Association (KVD). The German Informatics Society (GI) has also honored us with their Innovation Prize. DeltaMaster also receives top accolades from our users as well. In the annual BI Survey conducted by BARC, DeltaMaster regularly earns first place rankings in a variety of categories.
You cannot put counteractions into effect overnight. That’s why the analytic methods of DeltaMaster examine all changes in your organization down to their root causes. All reports contain variance signals that place each value in relation to your expectations, forecast, or budget. After all, you can only identify where you need to make changes, it they can work, or if you need to plan again from scratch if you have suitable comparisons. DeltaMaster tracks down the causes – even those buried deep in your data. This helps you see if specific product and customer attributes are the reasons behind your variances without losing sight of the big picture.
31 Partners 32 Awards and prizes
Early recognition and variance radars
25
Those who know uslove us.ABUS active logistics ADACAebi Schmidt Alfred TalkeAluminium Oxid Stade AMAG Bauer Media Group Bayerbayernhafen-GruppeBechtle Berker Berlinovo ImmobilienBIM Berliner Immobilienmanagement BJBBMWBoehringer Ingelheim Animal Health Bosch Car MultimediaBürgerBürkert WerkeCityJetColorExpert-Storch-GroupCONMETALLCoppenrath & WieseDaimler Datev DB VertriebDeuter SportDie ZEITDirect Linediwa PersonalserviceEagleBurgmann EDEKA SüdwestElaxy Erdinger Brauerei Erwin Müller FloragardFlughafen DüsseldorfFranziskus-Krankenhaus LinzFriedrich Zufall
Germania FlugGINA LAURAGustav AlbertsGühringHANSAINVESTHeinrich Heine Henry ScheinHeroHofpfistereihotel.deJOB AG Josias Gasser BaumaterialienJoseph VögeleKAISER+KRAFTKleine WolkeKMP Print Technik Krankenhaus WeißenburgLabor 28Landau MediaLeica Camera LMTMARS DrinksMATRIX VISIONMediengruppe OberfrankenMeinhardt StädtereinigungMevacoMotor Service International NORMA GermanyNovartisPantaeniuspapstarPascoePaul-Gerhardt-DiakoniePickenpackPMG MühlenPorscheProvetRecordati PharmaReiff Rhein Chemie Rheinau
Rheinische PostRöhligrtv MediaSalinen Austria SANITOP-WINGENROTHScherdelSCHNEEKOPPE Schreiner Group Schulz FarbenSchwartau SENNA Nahrungsmittel Siemens Real EstateSMA Solar Technology SmartracSOS-KinderdorfSOVAGSpectroSteinbacher DämmstoffStiftung GRS BatterienSüdkurierSynlabTakedaTelekom Austria Transfracht Transit Transport Ulla PopkenUniversal-InvestmentVelux VoithVon Roll Isola VolkswagenWencoWerner & PfleidererWewalkaWirtgenWolf ButterBackwolfcraftWöhrlWürth InternationalZukunftsfonds Heilbronn
26

27