business model innovation using lean methodologies for
TRANSCRIPT

Business Model Innovation using Lean Methodologies for
Companies with Established Technologies
Marta Castro Pina Nunes Baptista
Thesis to obtain the Master of Science Degree in
Information Systems and Computer Engineering
Supervisors:
Prof. Miguel Leitão Bignolas Mira da Silva
Eng. João Miguel Carreira Almeida
Examination Committee
Chairperson: Prof. Nuno João Neves Mamede
Supervisor: Prof. Miguel Leitão Bignolas Mira da Silva
Member of the Committee: Maria do Rosário Gomes Osório Bernardo Ponces de Carvalho
June 2015

ii

iii
Acknowledgments
First I would like to thank my Supervisor, Professor Miguel Mira da Silva, for all the guidance through all
this research work and before that, during my master degree. Your patience, encouragement for me to
learn how to think differently together with the constructive critics and opportunities to share and discuss
my opinions made me a better engineer.
I would like to express my gratitude to Eng. João Almeida and Eng. Marcelino Moreno for the opportunity
to work with both of them in this thesis demonstration and to all the practitioners who spared their time
to listen to our ideas and promptly gave their opinions - Professor Luís Caldas de Oliveira, Professor
Luís Mira da Silva, Eng. Pedro Gonçalves, PhD Manuel Tânger, Dra Isabel Ferreira and PhD Nelson
Pinho.
I am also indebted to Professor Miguel Pardal and Eng. Joana Pardal for encouraging me to take a
master degree, for always being available to provide me with good advice and patiently explaining me
the system.
To my brothers in arms from MEIC, Susana, Nuno, Cavalheiro, Alberto and INOV-UN27 kudos for
cheering my days and being always open to discuss and share ideas.
To my mother and father, I hope you both know how grateful I am for my education and the efforts you
made to make this possible. Tiago, my working week and my Sunday rest, thank you.
People will buy what they want and not what you think they need.

iv

v
Resumo
Inovar deixou de ser uma opção. No entanto as empresas continuam a falhar no lançamento de novos produtos e
acabam por investir demasiados recursos no desenvolvimento de tecnologias que não se conseguem vender.
Utilizando a metodologia Design Science Research é proposta uma framework baseada em metodologias lean
para facilitar a inovação do modelo de negócio a empresas com tecnologias já desenvolvidas. A framework
proposta não só permitirá às empresas encontrar o modelo de negócio apropriado para vender as suas tecnologias
mas a produção constante de informação sobre os seus mercados através de um processo iterativo. A tese foi
avaliada através de um caso real para que a framework pudesse ser aplicada em prática e através de entrevistas
a experts e practitioners de inovação e empreendedorismo.
Palavras-Chave: inovação, modelo de negócio, lean startup, lean analytics, innovator’s method, business model
canvas, value proposition canvas, empreendedorismo

vi
vii
Abstract
Innovation is no longer an option. But established companies fail to launch new products and end up spending a
lot of resources on developing technologies no one is willing to buy. Using the Design Science Research
methodology a framework based on lean methodologies to facilitate business model innovation for companies with
established technologies is proposed. The proposed framework will allow companies to find the right business
model to sell their technologies through an iterative process constantly generating knowledge about their markets.
The thesis was evaluated through a field study in order to apply the framework in practice and by interviewing field
experts and practitioners.
Keywords:
innovation, business model, lean startup, lean analytics, innovator’s method, business model canvas, value
proposition canvas, intrapreneurship

viii

ix
Table of Contents
Acknowledgments ................................................................................................................................ iii
Resumo................................................................................................................................................... v
Abstract ................................................................................................................................................ vii
Table of Contents ................................................................................................................................. ix
List of Figures ....................................................................................................................................... xi
List of Tables ....................................................................................................................................... xiii
List of Acronyms ................................................................................................................................. xv
1. Introduction .................................................................................................................................... 1
1.1. Research Problem ................................................................................................................. 1
1.2. Research Methodology .......................................................................................................... 3
1.3. Outline ................................................................................................................................... 4
2. Related Work .................................................................................................................................. 5
2.1. Design Thinking ..................................................................................................................... 5
2.2. Lean Startup .......................................................................................................................... 5
2.2.1. Validated Learning .................................................................................................... 5
2.2.2. Leap-of-faith Assumptions ........................................................................................ 6
2.2.3. Build-Measure-Learn feedback loop ......................................................................... 6
2.2.4. Innovation Accounting .............................................................................................. 7
2.2.5. Engines of Growth .................................................................................................... 7
2.2.6. Limitations ................................................................................................................. 8
2.3. Lean Analytics ....................................................................................................................... 9
2.3.1. Right Metrics ............................................................................................................. 9
2.3.2. Lean Testing ........................................................................................................... 10
2.3.3. Lines in the sand ..................................................................................................... 11
2.3.4. Lean Analytics framework....................................................................................... 11
2.3.5. Lean Analytics for Software as a Service ............................................................... 12
2.4. Business Models ................................................................................................................. 15
2.4.1. Business Model Canvas ......................................................................................... 15
2.4.2. Lean Canvas ........................................................................................................... 17
2.4.3. Value Proposition Canvas ...................................................................................... 18
2.5. Innovator’s Method .............................................................................................................. 21
2.6. Web Analytics ...................................................................................................................... 22
2.7. Summary ............................................................................................................................. 23
3. Proposal ........................................................................................................................................ 25
3.1. Objectives ............................................................................................................................ 25
3.2. Proposal............................................................................................................................... 25
x
3.2.1. Learn ....................................................................................................................... 27
3.2.2. Build ........................................................................................................................ 28
3.2.3. Measure .................................................................................................................. 28
3.2.4. Scale ....................................................................................................................... 29
4. Demonstration.............................................................................................................................. 31
4.1. Iteration #1 ........................................................................................................................... 31
4.1.1. Learn ....................................................................................................................... 31
4.1.2. Build ........................................................................................................................ 32
4.1.3. Measure .................................................................................................................. 34
4.2. Iteration #2 ........................................................................................................................... 36
4.2.1. Learn ....................................................................................................................... 36
4.2.2. Build ........................................................................................................................ 36
4.2.3. Measure .................................................................................................................. 38
4.3. Iteration #3 ........................................................................................................................... 39
4.3.1. Learn ....................................................................................................................... 39
4.3.2. Build ........................................................................................................................ 39
4.3.3. Measure .................................................................................................................. 40
4.4. Iteration #4 ........................................................................................................................... 40
4.4.1. Learn ....................................................................................................................... 40
4.4.2. Build ........................................................................................................................ 41
4.4.3. Measure .................................................................................................................. 41
4.5. Conclusion ........................................................................................................................... 42
5. Evaluation ..................................................................................................................................... 43
5.1. Field Study ........................................................................................................................... 43
5.2. Practitioners interviews ........................................................................................................ 44
6. Conclusion ................................................................................................................................... 47
6.1. Lessons Learned ................................................................................................................. 47
6.2. Limitations............................................................................................................................ 48
6.3. Research Communication ................................................................................................... 48
6.4. Future Work ......................................................................................................................... 48
References ........................................................................................................................................... 51
Appendixes .......................................................................................................................................... 53
Appendix A - What Lean Startup does differently[10] .................................................................... 53
Appendix B - Lean Analytics cycle [12] .......................................................................................... 54
Appendix C – Innovation Report .................................................................................................... 55

xi
List of Figures
Figure 1 - Business Model Innovators outperform Traditional Innovators over time [5] .......................... 2
Figure 2 - DSRM mapped to this research work (adapted from [7]) ....................................................... 3
Figure 3 - DSRM mapped to the outline of this thesis ............................................................................. 4
Figure 4 - Build-measure-learn feedback loop [9] ................................................................................... 6
Figure 5 - Donald Rumsfeld's quote explained (adapted from [12]) ........................................................ 9
Figure 6 - Instant Messaging Services company cohort analysis [9] .................................................... 11
Figure 7 - Lean Analytics five stages framework (adapted from [14]) ................................................... 12
Figure 8 - Skype’s Business Model Canvas [13] ................................................................................... 16
Figure 9 - Empathy Map [13] ................................................................................................................. 16
Figure 10 - Lean Canvas [15] ................................................................................................................ 17
Figure 11 - BMC and VPC connection (adapted from [13],[17]) ............................................................ 19
Figure 12 - Technology push loop (from [17]) ........................................................................................ 20
Figure 13 -The Innovator's Method cycle [14] ....................................................................................... 21
Figure 14 - Google Analytics dashboard [20] ........................................................................................ 22
Figure 15 - Model of the proposal ......................................................................................................... 26
Figure 16 – Model of the proposal 3D view ........................................................................................... 26
Figure 17 - Client-Tourism Agency “old” booking context ...................................................................... 31
Figure 18 - Client-Tourism Agency and DemoCorp Software context ................................................... 32
Figure 19 - “Get out of the building” for tourism professionals flowchart .............................................. 33
Figure 20 - Companies' websites offering booking management systems ........................................... 34
Figure 21 – DemoCorp’s landing page first three prototypes ................................................................ 36
Figure 22 - Various devices adapted to include screens from DemoCorp's software ........................... 37
Figure 23 - Single-page sliding website for DemoCorp ......................................................................... 37
Figure 24 – Rezlite’s first Google advertisement .................................................................................. 38
Figure 25 - Google Analytics graph relating page views with AdWords traffic iteration #2 ................... 38
Figure 26 - Rezlite's website with pricing model ................................................................................... 39
Figure 27 - Google Analytics graph relating page views with AdWords traffic iteration #3 ................... 40
Figure 28 - Rezlite advertisements written for the fourth iteration......................................................... 41
Figure 29 - Google Analytics graph relating page views with AdWords traffic iteration #4 ................... 42

xii

xiii
List of Tables
Table 1 - The 3 A's Metrics (adapted from [9])......................................................................................... 7
Table 2 - The three engines of growth (adapted from [9]) ....................................................................... 8
Table 3 - Metrics proprieties (adapted from [12]) .................................................................................. 10
Table 4 - Key metrics for SaaS (adapted from [12]) .............................................................................. 12
Table 5 - Lean Analytics five stages adapted to the SaaS context (adapted from [12]) ........................ 14
Table 6 - Comparing Business Model Canvas and Lean Canvas [16] .................................................. 18
Table 7 - Value Map's building blocks (adapted from [17]) .................................................................... 19
Table 8 - Customer Profile's building blocks (adapted from [17]) .......................................................... 20
Table 9 - Comparing Lean Methodologies ............................................................................................. 23
Table 10 - Most common pricing types in the booking management systems ...................................... 35
Table 11 - Google Analytics and AdWords results iteration #2 .............................................................. 38
Table 12 - Google Analytics and AdWords results iteration #3 .............................................................. 40
Table 13 - Google Analytics and AdWords results iteration #4 .............................................................. 41
Table 14 - Chosen dimensions, evaluation criteria and sub-criteria (adapted from [22]) ...................... 43
Table 15 - Evaluation - practitioners' opinions ....................................................................................... 45

xiv

xv
List of Acronyms
BCG Boston Consulting Group
BMC Business Model Canvas
BMI Business Model Innovation
CPA Cost per Acquisition
DSRM Design Science Research Methodology
IT Information Technologies
KPI Key Performance Index
LC Lean Canvas
LTV Lifetime value
MVP Minimum Viable Product
PDA Personal Digital Assistant
R&D Research and Development
SaaS Software as a Service
VPC Value Proposition Canvas

xvi

1
1. Introduction
Entrepreneurship is trending. New books and methodologies are published every month creating an
overwhelming panorama for existing companies, struggling to innovate within their businesses. Although
many of these methodologies can be adapted for established organizations, it is not clear and not easy
to implement these processes. However, business models innovation can nowadays leverage research
and development (R&D).
We propose a framework based on modern entrepreneurship methodologies to support companies to
innovate their already developed (technologies) business model by building a new value proposition for
the services and products they already possess based on the most interesting aspects of each
methodology (Lean Startup, Lean Analytics, Innovator’s Method) using recent visual tools (Business
Model Canvas, Value Proposition Canvas) and Web Analytics.
The proposed framework was applied to a field study: DemoCorp - a spin-off ready to promote a new
business model for the parent company’s developed technology.
The evaluation process was based on a field study (demonstration) as well as Nicolas Prat et al.
evaluation criteria and interviews to practitioners and field experts.
1.1. Research Problem
Companies stumble for many reasons: bureaucracy, arrogance, tired executives, poor planning, short-
term investment horizons, inadequate skills and resources, and bad luck but even companies who don’t
have this kind of weaknesses and are apparently well managed (competitive, who listen to their
customers and invest in new technologies) lose market dominance. The logical, competent decisions of
management that are critical to the success of their companies are also the reasons why they lose their
positions of leadership - good management can lead to failure. Companies fail not due to bad
management but to a lack of innovation culture.[1]
Independently of their size or maturity, there is still a big percentage of companies failing when it comes
to launching new products. Due to the “build and they will come” culture time and money are
unnecessarily spent into trying to force these new products into markets that don’t want to buy them. A
famous example is the Apple Newton flop.[2]
The Apple Newton was the first Personal Digital Assistant (PDA) and featured handwriting recognition
with an operative system based on advanced object-oriented programming. Launched in August 1993,
Apple Newton’s sales target were 50k-100k units on the first year and after five years 10M units, while
the actual sales were 80k-100k units on the first year and 350k after five years. The decision to withdraw
due to weak sales was in fact taken after the first five years, in 1998. Apple Newton’s got to the market
too early, customers didn’t want or see the need for the product and that cost Apple $100 Million.[3]

2
Innovation no longer means the creation of new products or technologies, as product life-cycles get
shortened even great technologies can no longer be relied upon to earn a satisfactory profit before they
become commoditized. Innovation must include business models rather than just technology and
R&D.[4]
BusinessWeek and Boston Consulting Group (BCG) conducted a survey in order to identify the most
innovative companies and concluded that Business Model Innovation (BMI) could not only be more
profitable but sustainable on the long term than product or process innovation (Figure 1). In line with
these results BCG states that BMI can be more powerful when it is approached proactively to explore
new avenues of growth instead.[5]
Figure 1 - Business Model Innovators outperform Traditional Innovators over time [5]
However there are barriers to this business model innovation. Although managers recognize the right
business model, its development is resisted due to its conflicts with the prevailing business model (as
the company allocates its resources to the most profitable uses, the established and already well known
technology will be unreasonably favored leaving the disruptive technology starved of resources) or even
that managers have no idea of what this “right business model” ought to be.[6] In other cases the
excessive focus on the product or the constant disproportionately allocation of Information Technologies
(IT) resources to the support and maintenance of legacy systems instead of the deployment of new
capabilities.
Nowadays there are many methodologies and frameworks suggested for entrepreneurship and
innovation or simply the pursuit of new ideas by established companies, however, for companies with
established technologies demanding to innovate through their business model, an exhaustive
adaptation to this particular context is still necessary. These frameworks are abstract in order to be
adaptable to different type of businesses
In short we define our problem as being very difficult for companies with established technologies
to innovate their business models.

3
1.2. Research Methodology
Design Science research methodology (DSRM) is the approach chosen for this work. DSRM’s main
goal is to develop and validate a proposal to solve our problem by proposing the design, development,
demonstration and evaluation of artefacts that may consist of constructs (vocabulary and symbols),
models (abstractions and representations), methods (algorithms and practices) and instantiations
(implemented and prototype systems). The focus of this research will be the creation of a model and an
instantiation of that model. Below we detail the DSRM phases:
Problem identification and motivation: define the specific research problem and justify the
value of a solution.
Define the objectives for a solution: Infer the objectives of a solution from the problem
definition and knowledge of what is possible and feasible.
Design and development: Determine the artefact’s desired functionality and its architecture
and then creating the actual artefact.
Demonstration: Demonstrate the use of the artefact to solve one or more instances of the
problem. May involve its use in experimentation, simulation, case study, proof, or other
appropriate activity.
Evaluation: Observe and measure how well the artefact supports a solution to the problem.
Involves comparing the objectives of a solution to actual observed results from use of the
artefact in the demonstration.
Communication: Communicate the problem and its importance, the artefact, its utility and
novelty, the rigor of its design, and its effectiveness to researchers and other relevant audiences.
In Figure 2 we adapt the generic DSRM phases to our research work.
Figure 2 - DSRM mapped to this research work (adapted from [7])
DSRM contains the test cycle, which characterizes the iterativeness of design science: after evaluating
and/or communicating the solution, we can re-define the objectives and/or re-design the solution.

4
1.3. Outline
To be coherent with our research work, this dissertation will follow the same structure as DSRM which
phases are easily mapped to the structure of this document (Figure 3).
Figure 3 - DSRM mapped to the outline of this thesis
Section 1 and Section 2 identify the problem and the motivation behind the research work. Section 3
details the objectives of the solution and the proposed solution. The solution is demonstrated in section
4 through and evaluated in section 5. In section 6, the research work is concluded with lessons learned,
limitations, research communication and future work.
Section 1 introduced the thesis by detailing the research problem, the chosen research methodology
and the outline structure of this document. In the next section is the literature review for this thesis.

5
2. Related Work
There has been some previous research in this matter. In this section a literature review of the subjects
in this thesis context is introduced. Starting by giving a definition of Design Thinking and introducing the
Lean Startup methodology. The Lean Startup methodology will be complemented by Lean Analytics then
the Business Model concept and its development tools are presented. Completing, after a brief
explanation of the Innovator’s Method and Web Analytics there is a conclusion on the presented
methodologies.
2.1. Design Thinking
Design Thinking, a notion of design as a "way of thinking" in the sciences introduced by Herbert A.
Simon's in 1969, is the foundation for many of the entrepreneurship methodologies and tools. Design
thinking focuses on the human-centred approach, experimentation, collaboration, creativity to find a
solution iteratively. [7]
Tim Brown defined design thinking in a business context: “Design thinking can be described as a
discipline that uses the designer’s sensibility and methods to match people’s needs with what is
technologically feasible and what a viable business strategy can convert into customer value and market
opportunity.”
To summarize his definition, Brown paraphrases Peter Drucker: “Design thinking is converting need into
demand.” [8]
2.2. Lean Startup
The Lean Startup is a set of management practices for helping entrepreneurs increase their odds of
building a successful startup. Defining a startup as a “human institution designed to create a new product
or service under conditions of extreme uncertainty” these practices can also be applied to teams within
established companies willing to innovate and see entrepreneurship as a new kind of management
adapted to this context of high unpredictability. An interesting comparison between lean and traditional
methodologies is available on Appendix A.[9]
2.2.1. Validated Learning
Learning is proposed as the crucial unit of progress for startups and validated learning is the process of
demonstrating (supported by empirical data collected from real customers) that a team has discovered
valuable truths about a startup’s present and future business prospects. A more concrete, accurate and
faster process than market forecasting or classical business planning by answering the right questions:

6
Not “can this product be built?” but “should this product be built?” and “can we build a sustainable
business around this set of products and services?”. Running frequent experiments will not only allow
this learning to be scientifically validated but also entrepreneurs to test each element of their vision. The
goal is to find a synthesis between the entrepreneurs’ vision and what customers would accept and not
be misled either by what customers think they want or telling customers what they ought to want.
2.2.2. Leap-of-faith Assumptions
Entrepreneurs must make leap-of-faith assumptions, the riskiest and the core elements of a startup plan.
The two most important assumptions are the value hypothesis and growth hypothesis. According to
Ries: “The value hypothesis tests whether a product or service really delivers value to customers once
they are using it while the growth hypothesis tests how new customers will discover a product or service”.
Leap-of-faith assumptions need to be tested as soon as possible. Among the techniques suggested by
the author there is the Genchi Gembutsu principle, “Go and see for yourself” particularly useful to build
a customer archetype, a document that endeavours to humanize the proposed target customer, a guide
to product development and decision-making. Business should be based on deep first-hand knowledge.
2.2.3. Build-Measure-Learn feedback loop
The fundamental activity of a startup is to convert ideas into products, measure how customers respond,
and then learn whether to pivot (change the course of strategy) or persevere. All successful startup
processes should be adapted to accelerate that feedback loop (Figure 4).
Figure 4 - Build-measure-learn feedback loop [9]
Once the leap-of-faith assumptions are well defined, the first step is to enter the build phase as quickly
as possible with a minimum viable product (MVP). The MVP is a version of the product that enables a
7
full turn of the build-measure-learn loop with a minimum amount of effort and the least amount of
development time.
Metrics are essential, either for measuring progress or corroborate decisions and decide whether to
change the course of strategy or persevere. Innovation Accounting is how progress is measured using
the Lean Startup framework.
2.2.4. Innovation Accounting
Innovation Accounting is a concept introduced by Ries willing to measure progress when the validated
learning is the progress unit. Entrepreneurs cannot easily communicate their progress when they were
not able to hit the “big numbers” or even present revenue and sales but it doesn’t mean they have not
been progressing or are not getting closer to the ideal. Innovation Accounting intends to differ on the
metrics that are most often used in management and is a systematic approach to evaluate progress
rigorously. Ries suggests three learning milestones:
Establish a baseline – using a MVP to answer the question: “where the company is right now?”
and to get feedback from customers. The riskiest assumptions should be tested first;
Tune in the engine – with the baseline as a point of start, apply changes to the MVP in order
to improve the metrics towards the ideal, focus on changing the customer behaviour for the
better;
Pivot or persevere – when all the possible changes have been applied in the prior phase,
decide whether to pivot or persevere.
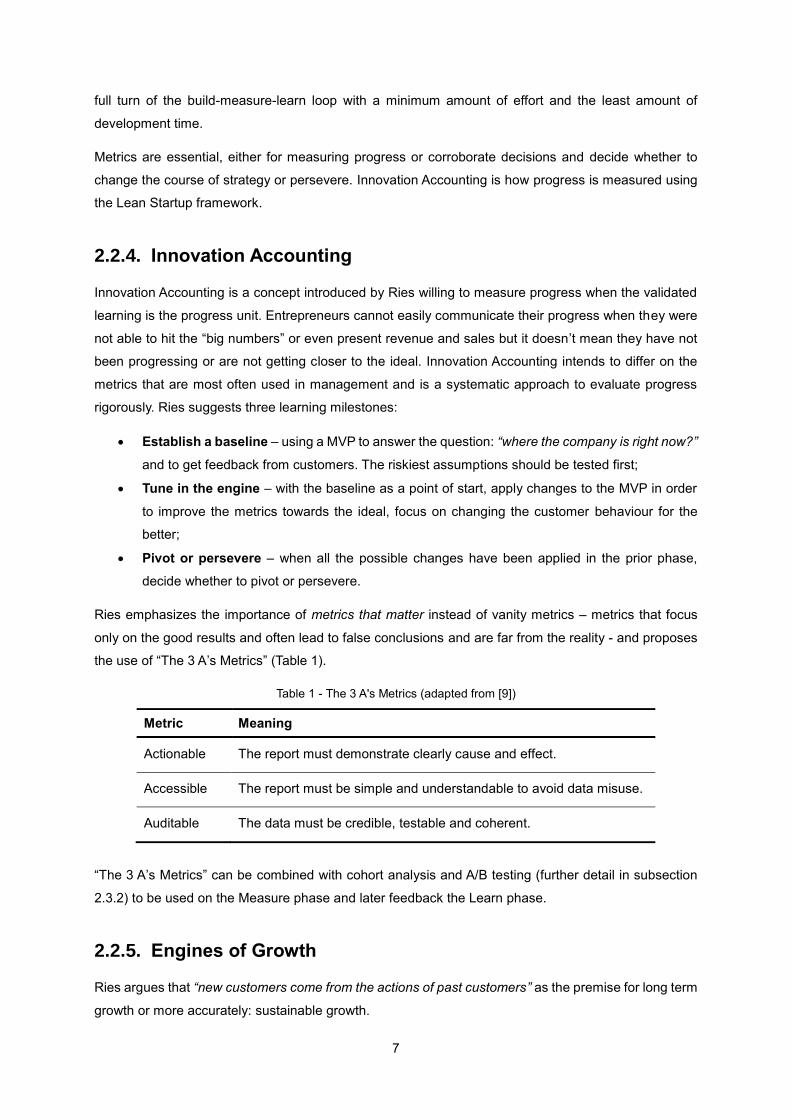
Ries emphasizes the importance of metrics that matter instead of vanity metrics – metrics that focus
only on the good results and often lead to false conclusions and are far from the reality - and proposes
the use of “The 3 A’s Metrics” (Table 1).
Table 1 - The 3 A's Metrics (adapted from [9])
Metric Meaning
Actionable The report must demonstrate clearly cause and effect.
Accessible The report must be simple and understandable to avoid data misuse.
Auditable The data must be credible, testable and coherent.
“The 3 A’s Metrics” can be combined with cohort analysis and A/B testing (further detail in subsection
2.3.2) to be used on the Measure phase and later feedback the Learn phase.
2.2.5. Engines of Growth
Ries argues that “new customers come from the actions of past customers” as the premise for long term
growth or more accurately: sustainable growth.

8
There are four different sources for sustainable growth:
Word of mouth – when customers are excited about a new product or service, they tend to
share this enthusiasm within their circles;
As a side effect of product usage – when customers are seen using their products they can
be influencers;
Through funded advertising – using the marginal profits to buy advertising;
Through repeat purchase or use – some products or services are consumables, intended to
be repurchased repeatedly or within a subscription system.
The benefits of sustainable growth are evident so mechanisms to achieve them are introduced: engines
of growth (Table 2).
Table 2 - The three engines of growth (adapted from [9])
Concept Definition
Sticky Engine of Growth
Companies carefully track their churn rate or the fraction of customers in any period who fail to remain engaged with the company’s product. If the rate of new customer acquisition exceeds the churn rate the business will grow. The speed of growth is determined by the difference between the natural growth rate and the churn rate.
Viral Engine of Growth
Viral growth depends on person-to-person transmission as a consequence of product usage. This word-spreading is often unintentional. The viral coefficient determines the rapidness of the product spreading and is a mathematical function that measures how many new customers will use a product as a consequence of the acquisition of a new customer. The haste of growth is as high as the viral coefficient is.
Paid Engine of Growth
The customer lifetime value (LTV) is determined by the amount a customer pays over his lifetime as a customer minus the variable costs. As long as the LTV is higher than the cost per acquisition (CPA) of advertising, for example, the business will grow. Marginal profit is the margin between the LTV and the CPA and determines how fast the paid engine of growth will turn.
These engines may be considered feedback loops powered by the above mentioned sources and
corroborated by metrics that matter. The faster the loop is covered the faster the business will grow.
Although more than one engine can operate in a business, usually the better approach is to concentrate
energies on only one.
2.2.6. Limitations
The Lean Startup framework is a set of practices mostly based on experimentation, ideal for startups
and new organizations, with useful tools and concepts like the build-measure-learn feedback loop, the
minimum viable product and pivoting but lacks concrete methodologies when it comes to business
model innovation for already established technologies.
9
Steve Blank evidences business model innovation to ensure survival and growth of large companies
and suggests the lean startup methodologies to help the existing companies dealing with these “forces
of continual disruption”, however doesn’t get into much detail on how companies should proceed with
these methodologies. [10]
2.3. Lean Analytics
Following Peter Drucker’s premise “If you can’t measure it, you can’t manage it” [11] Lean Analytics
largely complement Eric Ries’ Innovation Accounting by being more detailed with new frameworks and
concepts that can be easily applied to different business model types. Through all their research work
the authors emphasize the importance of data and analytics and how choosing bad metrics can be
misleading. [12]
2.3.1. Right Metrics
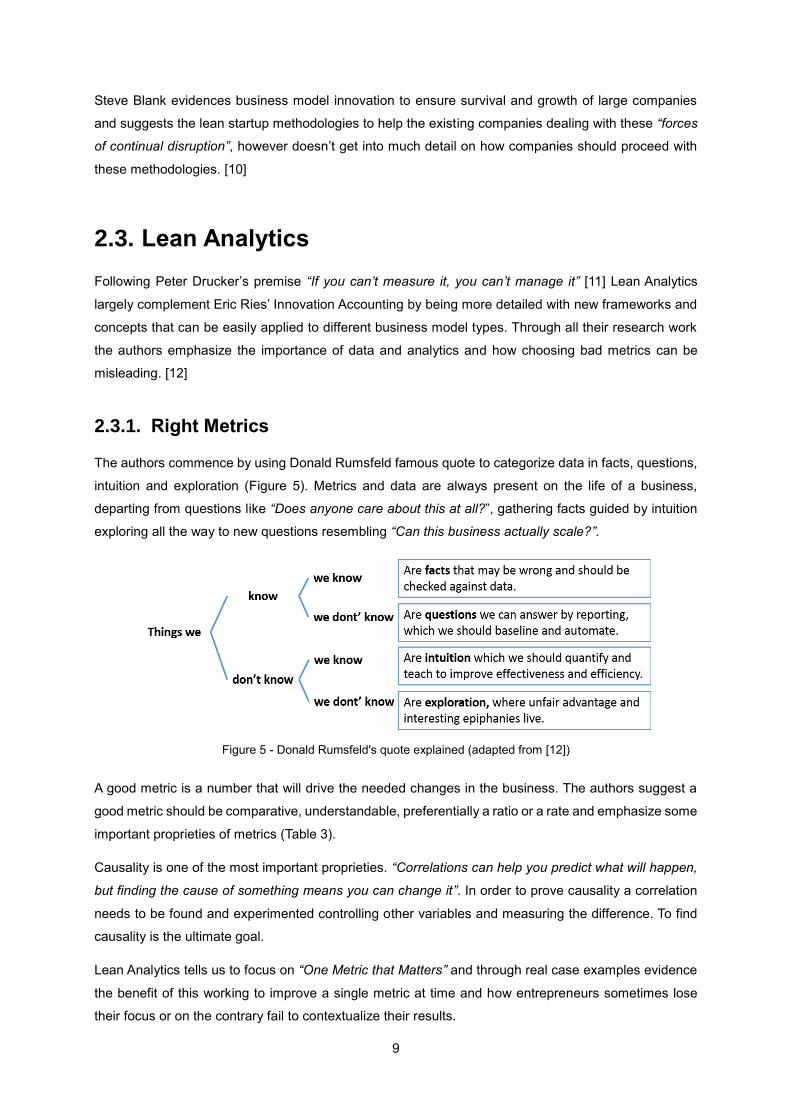
The authors commence by using Donald Rumsfeld famous quote to categorize data in facts, questions,
intuition and exploration (Figure 5). Metrics and data are always present on the life of a business,
departing from questions like “Does anyone care about this at all?”, gathering facts guided by intuition
exploring all the way to new questions resembling “Can this business actually scale?”.
Figure 5 - Donald Rumsfeld's quote explained (adapted from [12])
A good metric is a number that will drive the needed changes in the business. The authors suggest a
good metric should be comparative, understandable, preferentially a ratio or a rate and emphasize some
important proprieties of metrics (Table 3).
Causality is one of the most important proprieties. “Correlations can help you predict what will happen,
but finding the cause of something means you can change it”. In order to prove causality a correlation
needs to be found and experimented controlling other variables and measuring the difference. To find
causality is the ultimate goal.
Lean Analytics tells us to focus on “One Metric that Matters” and through real case examples evidence
the benefit of this working to improve a single metric at time and how entrepreneurs sometimes lose
their focus or on the contrary fail to contextualize their results.

10
Table 3 - Metrics proprieties (adapted from [12])
Qualitative vs Quantitative
Unstructured, anecdotal, revealing, and hard to aggregate;
Involve numbers and statistics, and provide hard numbers but less insight;
Exploratory vs Reporting
Speculative and try to find unknown insights to allow to get the upper hand;
Keep the business abreast of normal, managerial, day-to-day operations;
Vanity vs Actionable
Might make you feel good, but they don’t change how to act.
Change behavior by helping to pick a course of action.
Leading vs Lagging
Give a predictive understanding of the future; Historic metrics that usually explain the past;
Correlated vs Causal
Two (or more) metrics that change together; A metric that causes another metric to change;
The Lean Analytics cycle is introduced as a helper on how to pursue and improve meaningful metrics
having a Key Performance Index (KPI) as a point of o start it covers this process until the final and most
prominent decision: whether to pivot or persevere (please see Appendix B).
2.3.2. Lean Testing
The engine for lean analytics is testing. Testing is crucial and allows the constant contrast and analysis
of the results and there are different techniques that can be smartly combined:
A/B testing – involves testing attributes using groups where the only aspect differentiating their
experience is a specific attribute. This technique is very useful to help developers to understand
whether a particular feature is relevant or not, and how customers react to changes.
Cohort analysis - allows the comparison between similar groups over time, heavily used to
differentiate user experiences. A group of users is a cohort and the goal is to compare cohorts
against one another and infer if metrics are improving or not.
As an example (Figure 6) is shown a cohort graph on an instant messaging services company which
divides their user experiences in cohorts to better understand the different behaviors and what should
be the main focus and concern of the company.

11
Figure 6 - Instant Messaging Services company cohort analysis [9]
In Figure 6 graph’s context we can conclude that in April 9,1% of the users had five conversations,
27,2% had one conversation, 19,9% logged in, 43,1% registered but didn’t log in and 0,7% paid.
2.3.3. Lines in the sand
Lines in the sand are the hypothesis concept for Lean Analytics. Similar to leap-of-faith assumptions,
the innovator must pick a number and set it as a target using his intuition and be confident enough that
if this target is reached the experiment is considered a success. However, when the target is not reached
a new line in the sand must be drawn.
In order to better backing the line in the sand the innovator should either look at the business model (as
to set a minimum number of paying customers based on the business sustainability), to what is
considered standard or ideal.
2.3.4. Lean Analytics framework
Lean Analytics adapts Eric Ries’ engines of growth and defines a framework composed of five stages
(Figure 7).

12
Figure 7 - Lean Analytics five stages framework (adapted from [14])
This framework intends to guide the innovator from the beginning of the process, starting by allowing an
acknowledgement of the stage the business is at.
2.3.5. Lean Analytics for Software as a Service
In the particular case of Software as a Service (SaaS) business models, new key metrics (Table 4) are
introduced (apart from the already known LVT, CPA, churn rate, and viral coefficient). The most relevant
for SaaS are stickiness, conversion (which is linked to attention) while the ultimate goal is to improve
churn rate: if many loyal users are gathered faster than they are lost the business will prosper. User
engagement must be measured from the very beginning as well as all customer activity while possible.
Table 4 - Key metrics for SaaS (adapted from [12])
Concept Definition
Attention How effectively the business attracts visitors.
Enrollment How many visitors become free or trial users, if you’re relying on one of these models to market the service.
Stickiness How much the customers use the product.
Conversion How many of the users become paying customers, and how many of those switch to a higher-paying tier.
Revenue per customer How much money a customer brings in within a given time period.
Upselling What makes customers increase their spending, and how often that happens.
Customer acquisition cost How much it costs to get a paying user.
Virality How likely customers are to invite others and spread the word, and how long it takes them to do so.
Uptime and reliability How many complaints, problem escalations, or outages the company has.
Churn How many users and customers leave in a given time period.
Lifetime value How much customers are worth from cradle to grave.
13
Guidelines and advice on the most common lines in the sand for this type of model are proposed too.
Apart from many case studies and examples present on the bibliography the authors gathered
interesting conclusions from data obtained from 100 SaaS companies. Among these conclusions:
Paid Enrolment: If a credit card is asked up front, 2% of visitors are expected to try the service,
and 50% of them to use it. If no credit card is asked, 10% of visitors are expected to try the
service, and up to 25% to buy — however if they’re surprised by a payment they might be lost
quickly. Not having a credit card up front gives a 40% increase in conversions, provided the
selling efforts can be tailored to each segment of evaluators based on their activity.
Churn rate: Until churn rate reaches 5% it is one of the priorities in metrics improvement. If
churn is higher than 5% the business is not sticky enough, if around 2% the business is doing
exceptionally well.
The authors offer useful recommendations on which metric(s) to pursue in each particular stage of the
Lean Analytics framework (Table 5).

14
Table 5 - Lean Analytics five stages adapted to the SaaS context (adapted from [12])
Model: Software as a Service
Empathy
Problem validation:
Getting inside your market’s head to discover real needs you can solve. These tend to be qualitative discussions and open questions.
Do prospects have a known need they are pained to solve today?
Can they do it with software?
How do they learn about such solutions?
What’s the buying process?
Solution validation:
This happens in both qualitative and quantitative approaches, and in some cases curated MVPs or regional tests.
Will the features you’re offering fit their processes and solve a pain well enough for them to part with money and tell their friends?
Stickiness Achieving a minimum viable product that engages customers in a meaningful, valuable way.
Engagement;
Churn;
Visitor/user/customer funnel;
Capacity tiers;
Feature utilization (or neglect)
Virality
Growing adoption through inherent, artificial, and word- of-mouth virality; optimizing viral coefficient and cycle time.
Inherent virality;
Customer acquisition cost.
Revenue Convincing users to pay with optimal pricing, then pouring some of that money back into customer acquisition.
Upselling;
Customer acquisition cost;
Customer lifetime value;
Upselling;
Path and roadmap.
Scale
Growing the organization through customer acquisition, channel relationships;
Finding efficiencies, and participating in a market ecosystem.
Application programming interface (API)
Traffic,
Magic Number;
App ecosystem;
Channels;
Resellers;
Support costs;
Compliance;
On premise/private versions.

15
2.4. Business Models
Most available definitions for business model have one concept in common: value. A business model is
the combination of two major functions for a company: value creation and value capture [4] or even
“describes the rationale of how an organization creates, delivers, and captures value”[13]. Henry
Chesbrough proposed six functions for the business model:
1. Articulate the value proposition;
2. Identify a market segment;
3. Define the structure of the value chain required by the firm to create and distribute the offering;
4. Specify the revenue generation mechanism(s) for the firm, and estimate the cost structure;
5. Describe the position of the firm within the value network;
6. Formulate the competitive strategy;
Although Chesbrough doesn’t address how to define with more detail each of these functions, he states
that “A better business model often will beat a better idea or technology” and gives several real examples
of this.
2.4.1. Business Model Canvas
Business Model Canvas (BMC) is a strategic visual tool to either develop or document business
models.[13] BMC is composed by nine building blocks:
Customer Segments (CS) - defines the different groups of people or organizations an
enterprise aims to reach and serve;
Value Proposition (VP) - bundle of products and services that create value for a specific
Customer Segment;
Channels (CH) - how a company communicates with and reaches its customer segments to
deliver a value proposition;
Customer Relationships (CR) - the type of relationship a company establishes with each
customer segment;
Revenue Streams (RS) - how a company receives money from each customer segment;
Key Resources (KR) - the most important assets required to make the business model work;
Key Activities (KA) - the most important things a company must do to make its business model
work;
Key Partnerships (KP) - the network of suppliers and partners that make the business model
work;
Cost Structure (CS) - all costs incurred to operate the business model.
16
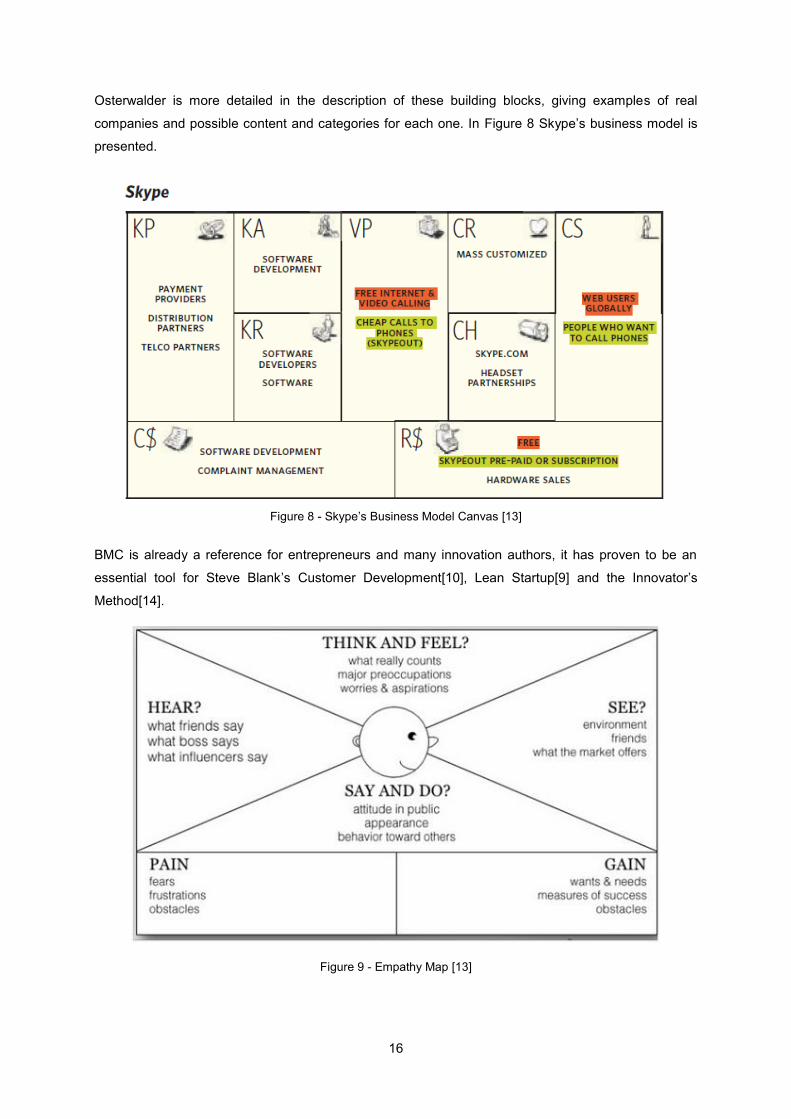
Osterwalder is more detailed in the description of these building blocks, giving examples of real
companies and possible content and categories for each one. In Figure 8 Skype’s business model is
presented.
Figure 8 - Skype’s Business Model Canvas [13]
BMC is already a reference for entrepreneurs and many innovation authors, it has proven to be an
essential tool for Steve Blank’s Customer Development[10], Lean Startup[9] and the Innovator’s
Method[14].
Figure 9 - Empathy Map [13]

17
Osterwalder proposes the Empathy Map (Figure 9) as a visual tool for customer profiling and creating a
customer angle for the constantly inquest of the business model assumptions. “Does this Value
Proposition solve real customer problems?”, “Would the customer really be willing to pay for this?” and
“How would the customer like to be reached?” are examples of questions to be answered.
2.4.2. Lean Canvas
Lean Canvas (LC) is the Lean Startup approach adaptation of the Business Model Canvas. Created by
Ash Maurya the LC intends to be faster, more concise and shareable than BMC. Maurya defends that
the business model should be the actual product sold by a startup.
Figure 10 - Lean Canvas [15]
The LC (Figure 10) is heavily focused on the problem and introduces new concepts as the Unique Value
Proposition (how you capture a customer’s attention), the Unfair Advantage (how your solution deters
copycats and competitors) and the Key Metrics (to identify the single macro metric or goal that drives
the experiments). In Table 6, there is a comparison between the two visual tools, the BMC and the LC.

18
Table 6 - Comparing Business Model Canvas and Lean Canvas [16]
Element Business Model Canvas Lean Canvas
Target New and existing businesses
Startup businesses purely
Focus Customers, Investors, Entrepreneurs, Consultants, Advisors
Entrepreneurs purely
Customers Lays emphasis on customer segments, channels and customer relationships for all businesses
Does not lay much emphasis on customer segments because startups have no known or tested products to sell
Approach
Lays down the infrastructure, lists the nature and sources of financing and the anticipated revenue streams of the business
Begins with the problem, a proposed solution, the channels to achieving the solution, costs involved and the anticipated revenue streams
Competition Focuses on value proposition in quantitative and qualitative terms as way to stay smart in the market
Assesses whether the business has an unfair advantage over the rest and how to capitalize on it for better grounding
Application Fosters candid understanding, creativity, discussion and constructive analysis
It is a simple problem-solution oriented approach which enables the entrepreneur to develop step-by-step
BMC not only has existing businesses as target but lays more emphasis on the customer segment while
the LC’s approach starts with problem fact that limits its use for non-developed solutions.
2.4.3. Value Proposition Canvas
While the BMC is a tool for aiding organizations to create value for their businesses, Value Proposition
Canvas (VPC) proposes aid in creating value for their customers by being a more elaborated approach
to Value Proposition and Customer Segments building blocks. [17]

19
Figure 11 - BMC and VPC connection (adapted from [13],[17])
The Value Map describes with detail the features of a specific value proposition breaking it down into
Products & Services, Pain Relievers and Gain Creators all classified according to their relevance (from
nice to have to essential) (Table 7). Customer Profile expresses accurately a specific customer segment
through its Jobs, Pains and Gains (Table 8).
Table 7 - Value Map's building blocks (adapted from [17])
Concept Definition
Products and
Services
A list of the available products and services. These products and services can be Physical/Tangible, Intangible, Digital and Financial.
Pain Relievers A detailed outline of how products and services will alleviate customer pains, starting by the more acute ones.
Gain Creators An explicit assessment of how products and services create gains for customers.

20
Table 8 - Customer Profile's building blocks (adapted from [17])
The whole purpose of the process of designing value proposition is to find an adequate Fit between
Value Map and Customer Profile (Figure 11). For a successful value proposition the perfect Fit between
what the company has to offer and what customers want. According to the authors of Value Proposition
Design, there are three types of Fit:
Problem-Solution Fit – achieved when there is confirmation of all of the Customer’s Profile
components and a designed value proposition in accordance.
Product-Market Fit – attained when there is evidence the Value Map’s component are creating
value for customers and adhering to market.
Business Model Fit – realized when there is a profitable and scalable business model with the
value proposition set in.
Figure 12 - Technology push loop (from [17])
Osterwalder differentiates the concepts of market pull and technology push. Market pull’s build-
measure-learn loop triggers with the problem and concentrates on finding a solution. Commencing with
Concept Definition
Customer Job(s)
Can be the tasks the customers are trying to perform or the problems they are trying to solve or the needs they are trying to satisfy. Jobs may be Functional, Social, Personal/Emotional or Supporting. Jobs can be assorted with Job Importance (from insignificant to important).
Pains
Anything that is unpleasant for the customer before, after or during the execution of a job and risks associated to this job potential bad outcome. Pains can be Undesired outcomes, problems and characteristics, Obstacles, Risks and described by a Pain Severity (from moderate to extreme).
Gains The outcomes and benefits aimed by the customer. Gains can be: Required, Expected, Desired or Unexpected and classified with Gain Relevance (from nice to have to essential).

21
the customer profile (with well-defined pains, gains and jobs) evolves by building a value proposition
prototype and only after this is tested the technology requirements would be adjusted. Technology push
concentrates on finding a problem and is triggered by an existing technology. Its build-measure-learn
loop (Figure 12) begins by building a value proposition prototype then measures the customer response
and infers customers’ insights. A technology push is what an established company willing to innovate
with an already developed technology longs for, so Osterwalder suggests this technology to be included
in the company’s BMC as a key resource.
2.5. Innovator’s Method
The Innovator’s Method is introduced as “a linear process to simplify a complex process”, the process
of innovation in established organizations. Influenced by design thinking, agile development, the
Innovator’s Dilemma and the Lean Startup framework, the innovator’s method claims to be a holistic
model for covering the innovation process as a whole (Figure 13). Innovator’s Method comprises four
steps:
Insight (savour surprises) – questioning, observing, networking and experimenting in order to
find problems worth solving;
Problem (discover the job-to-be-done) – exploring customers need or problem to validate the
problems found;
Solution (prototype the minimum awesome product) – leverage prototypes and develop a
minimum viable prototype and in due course of time a minimum awesome product;
Business Model (validate the go-to-market strategy) – validate all components of the business
model once the solution is found.
Figure 13 -The Innovator's Method cycle [14]
Proposed as a helper for the problem step is the smoke test - a method to test whether a problem worth
solving has been discovered. The method includes creating a website, advertisement or other channel
where both the problem to be tested and a theoretical solution are described with a call for action option
(“learn more”, “book now”, “try now”). The goal is to measure how many customers (potential customers)
are in fact interested in the projected problem and solution. The test infers conclusions about this
response rate which when greater than 5% the problem is considered worth solving. One of the goals
of this test is to connect with these potential customers and try to be more acquainted with them and
what they think about the solution.

22
The innovator’s method is optimized for innovation having an idea as the entry point for the whole
process, but does not offer such a complete approach when the input is the solution (the already
developed technology) and, therefore, business model innovation.
2.6. Web Analytics
Web analytics is “the objective tracking, collection, measurement, reporting, and analysis of quantitative
Internet data to optimize websites and web marketing initiatives.” [18]
Web Analytics started with the gathering of information on the requests in web server logs, such as the
filename being requested, the requester (website) and the Internet Protocol (IP) address among others.
These logs where compiled through scripting into readable and understandable information for non-
technical individuals transforming technical information into business information.[19]
When combined with Web Marketing, Web Analytics can be a powerful tool for entrepreneurs and
innovators in need of constant feedback as a result of experimentation. Google offers several tools for
Web Marketing and Analytics as Google AdWords and Google Analytics (Figure 14).
Figure 14 - Google Analytics dashboard [20]
Google AdWords is a web advertising service that displays ads if the predefined keywords match the
google searches. Google Analytics offers a small script to be included on the website and a dashboard
where all the activity of that same website can be visualized in real time. It is possible to combine Google
AdWords and Google Analytics in order to understand which advertisements are bringing more users to
the website.

23
2.7. Summary
Of the various methodologies and frameworks presented although they are all considered by their
authors suitable for intrapreneurship, none was built with the particular goal of solving our research
problem (section 1.1). They are complete approaches but still lack objectivity and can be greatly
complemented by each other, considering the different benefits each has to offer. On Table 9 a
comparison between Lean Startup, Lean Analytics and the Innovator’s Method is shown.
Table 9 - Comparing Lean Methodologies
Methodology Concern Why is not enough?
Lean Startup Framework for both innovators and
entrepreneurs. Build-Measure-Learn
Too abstract, not enough
guidelines - needs to be adapted to
the business
Lean Analytics Metrics-centric approach focused on
improving the business metric
More focused on growth hack, not
a stand-alone solution
Innovator’s Method
Linear framework for both innovators
and entrepreneurs. Insight-Problem-
Solution-Business Model
Rigid – Has to start with the insight
phase
When it comes to the visual tools, BMC is an adequate tool (as seen on Table 9) and VPC can be used
as a useful complement tool for the BMC.
In this section a literature review was prepared by summarizing innovation and entrepreneurship
methodologies and other tools to support them, grounded on these practices and guidelines a framework
was developed. This framework is introduced on the next section – Proposal.

24

25
3. Proposal
In this section, a proposed solution to the problem identified in section 1.1 is explained. Objectives of
the proposed solution will be presented followed by a complete description of what the proposal
comprises.
3.1. Objectives
The main objective of our solution is to have a facilitator framework for business model innovation in a
specific context: when there is already a technology fully developed and existing assets (sales,
channels, brands, etc…) that can be leveraged, innovating by finding both a new value proposition and
customer segment.
More specifically the objectives of our solution are linked to the three learning milestones proposed by
Eric Ries in his Innovation Accounting:
Establish a baseline;
Tune the engine;
Pivot or Persevere.
When applied this framework will facilitate the gathering of knowledge on the environment it is implanted
into and will put the innovators closer to the desired new business model but success depends on other
factors too, like how the methodologies are studied and embraced within their teams. The solution aims
to, if needed be, fail faster and actively explore other hypothesis, turn questions into facts and intuitively
explore making more questions.
The proposed solution will combine the key aspects of several methodologies and tools. Considering
the push technology concept, the Lean Startup build-measure-learn feedback loop will be combined
with the Innovator’s Method process, supporting iterations and changes with Lean Analytics, using visual
tools as the BMC and the VPC and Web Analytics.
The objective of the solution is to produce as much as possible validated learning about the
business’s value proposition and customer segment for companies with established
technologies.
3.2. Proposal
Having the technology push loop as starting point a separation of the Innovator’s Method linear process
is proposed. Both the Insight and Solution steps (since they represent correspondingly the
idea/opportunity and the technology) are joined as well as the Problem and Business Model (since they

26
are connected through the value proposition concept) and these two new pairs are placed on the top
and centre of the loop respectively (Figure 15).
Figure 15 - Model of the proposal
The framework comprises of three main phases: Learn, Build and Measure. The loop endures iteratively
approximating the ultimate Problem and Business Model hypothesis. This hypothesis is to be scaled
only when considered and backed up solid. An iteration combines the passage through the three phases
and produces validated learning with each loop being of variable time. This framework is not to be seen
as a 2D flat loop but helicoidally in a 3D dimension progressing to be scaled (Figure 16).
Figure 16 – Model of the proposal 3D view

27
A small set of tasks is suggested for each phase, however, although some tasks and whether or not to
fulfil them is left to the innovators’ reasoning of what is appropriate according to the defined hypothesis,
other tasks are considered mandatory.
The BMC will be used to represent the various hypothesis of business models, always considering some
of the building blocks as partially completed – although this is business model innovation, there are
assets in the company and already implemented processes that can be leveraged in favour of the new
value proposition.
The suggested Web Analytics tools are Google AdWords and Google Analytics, to manage both the
advertising and the users’ activities within the web material.
Lean Analytics techniques and suggested approaches when it comes to metrics and how to improve
them, combined with Ries’ engines of growth guide the loop iterations, either to approximate the ideal
business model or to pivot to another promising idea.
3.2.1. Learn
This phase is where the hypothesis is defined and, therefore, critical where creativity and boldness are
concerned, requiring the involvement of all the team in order to drive a stimulating discussion.
Having a clear understanding of what the initial idea to develop the solution/technology was, it’s
functionalities and the problem this solution intends to solve is crucial.
Defining a hypothesis can be the delineation of a question that needs an answer and how it will be
answered based on what is known about the business and the market at the time. A specification of
changes to be made to the solution in order to emphasize a particular set of functionalities for a given
customer segment can take place too.
The mandatory tasks for the Learn phase are:
Assemble facts – what is known as a result of validated learning;
Ask questions – business questions that need answer;
State the leap-of-faith assumption.
The suggested tasks for the Learn phase are:
Fill the Value Map and the Customer Profile Map;
Define a time-frame for the iteration;
Draw a line in the sand in what concerns metrics;
Define a web analytics strategy;
Specify alterations to the solution;
Specify tests in order to answer your questions;
Structure digital marketing campaigns.

28
After the first iteration, this phase will be powered by the results gathered on the previous iteration (more
precisely the previous Measure phase). Assembling facts, asking questions and taking a leap-of-faith
assumption drive every iteration.
3.2.2. Build
This phase calls for action and execution, this is when the hypothesis will be implemented. For the Build
phase the development of web material (website, landing page), the tests setting and the marketing
campaigns configuration are suggested, always keeping in mind that the effort should be minimal in
order not to spend too much time implementing material that won’t bring any answers.
The Genchi Gembutsu principle and “getting out of the building” is another suggested task for this phase,
using the empathy map so as to contact with the hypothetical customers or area/sector experts, getting
validated learning supported by real acumens. The “get out of the building” can be used to get know
better the competition, not a simple market analysis but to meet their customers and understand not
only if there are switching costs but what made them choose the competition.
The suggested tasks for the Build phase are:
Alter/Customize the solution;
“Get out of the Building”;
Develop a landing page;
Implement tests;
Write advertisements or prepare campaign materials;
Set up the web marketing campaigns.
This phase doesn’t require far creative input, however, it is important not to lose focus and to follow the
strategy defined on the Learn phase.
3.2.3. Measure
The goal in this phase is to draw conclusions that will serve as input for the Learn phase and to assess
the Lean Analytics framework status. All the data generated by the implemented tests or campaigns
must be collected and translated in good metrics (as defined by Lean Analytics).
The innovators are encouraged to produce cohort analysis or just to extract reports from web analytics
tools, to find causality between data and ultimately finding the answer they were looking for - the driver
for the whole loop iteration.
An innovation report template to aid on achieving conclusions is suggested, including a BMC and a VPC
attached (Appendix C). Filling one report for iteration/hypothesis will help not only to visualize progress
but to take more educated decisions.

29
The suggested tasks for the Measure phase are:
Produce legible graphs and actionable metrics;
Produce reports;
Find causality among the extracted data;
Log results and inferences;
Draw conclusions.
Keeping the results and data gathered from every iteration is essential, some metrics may not seem
relevant at that moment but may be in the future and interesting analysis can be made.
3.2.4. Scale
The right time to scale a business model is left to the innovators consideration based on the validated
learning gathered. Lean Startup’s and Lean Analytics can be very useful in this phase considering the
Ries’ Engines of Growth and the frameworks offered for growth-hack in Lean Analytics.
Section 3 detailed the objectives and the proposed framework. The framework is based on the Build-
Measure-Learn feedback loop and was enriched with different methodologies and good practices. In the
next section, the demonstration of the framework in a practical case – DemoCorp – is described.

30
31
4. Demonstration
This section explains how the solution was demonstrated and how the proposed framework was used
to innovate in a company with an already developed technology eager to find the most suitable business
model for it: DemoCorp.
DemoCorp is a spin-off of a small Portuguese company that results from the vision of two CEOs who
intended to merge their areas of expertise: software, transports and mobility integrated solutions.
DemoCorp has a team of two busy but experienced and willing CEOs in part-time. DemoCorp is heavily
inclined to explore business models using cloud technologies and software as a service solutions.
4.1. Iteration #1
The Learn phase, will start by clarifying the DemoCorp situation and the Insight and Solution - the idea,
the technology developed and the challenges implied, then the Build phase, where a “get out of the
building” took place, will be described and finally the Measure phase concludes the iteration with the
results and conclusions.
4.1.1. Learn
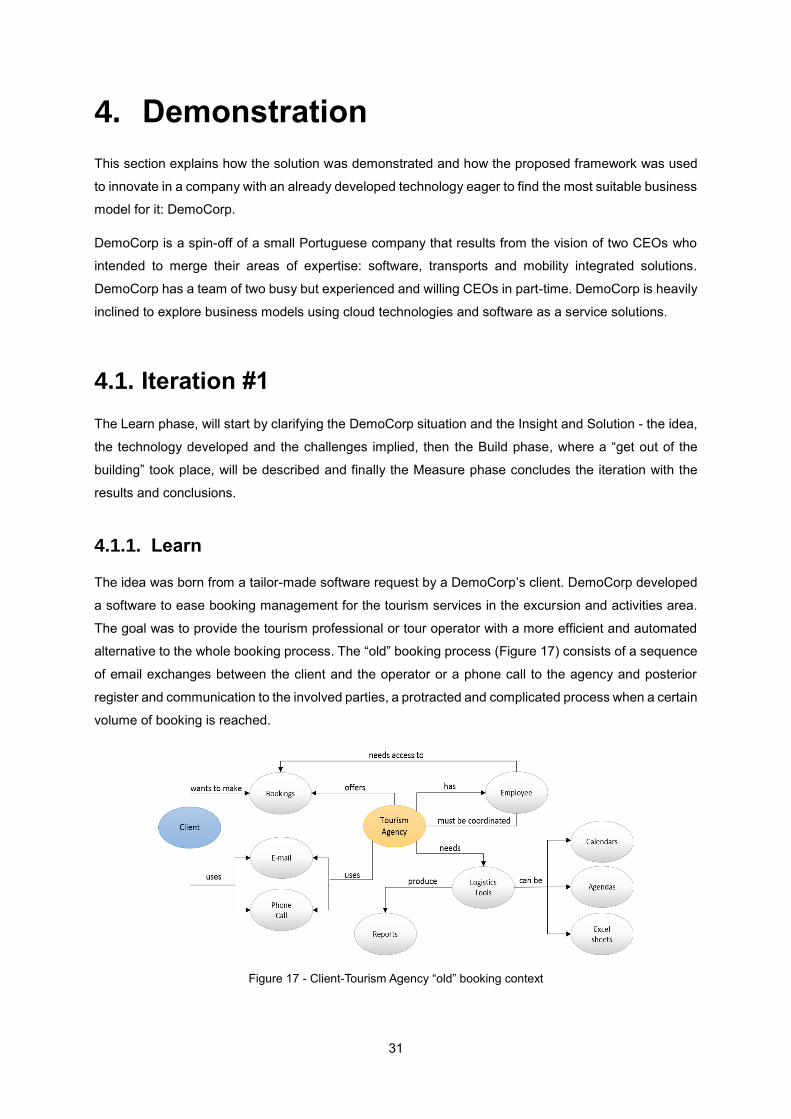
The idea was born from a tailor-made software request by a DemoCorp’s client. DemoCorp developed
a software to ease booking management for the tourism services in the excursion and activities area.
The goal was to provide the tourism professional or tour operator with a more efficient and automated
alternative to the whole booking process. The “old” booking process (Figure 17) consists of a sequence
of email exchanges between the client and the operator or a phone call to the agency and posterior
register and communication to the involved parties, a protracted and complicated process when a certain
volume of booking is reached.
Figure 17 - Client-Tourism Agency “old” booking context

32
DemoCorp’s solution (Figure 18) can be integrated in the tourism agent’s website and its content can
be entirely customizable (type of excursions, activities with all their characteristics and particularities,
prices, availability, etc…). Among the major benefits are facilitated logistics for the tourism professional,
being able to visualize the bookings panorama through reports and calendars, synchronization among
the agency’s employees with remote web-based access for all types of users allowing for real-time
bookings.
Figure 18 - Client-Tourism Agency and DemoCorp Software context
Even though this technology is not disruptive (yet) and there are presently on the market very similar
technologies, the challenge is to find a new value proposition or even a variation of the technology
features to highlight in order to attract the customers’ interest. One of the most promising features at
this point is the possibility of combining the booking system with cloud technology using a smartphone
or even rugged PDA or handheld printer app as a transaction facilitator (when it comes to showing tickets
or even payments), a technology DemoCorp’s calls Ticketing as a Service (TaaS).
The leap-of-faith assumption is “There are small and medium tour operators in Lisbon interested in tour
booking management systems we just don’t know what type of features and pricing models they prefer
yet.” and the validation for this assumption will be achieved by conducting a “get out of the building”.
4.1.2. Build
The “get out of the building” was comprised of two parts:
1. Getting to know the market, analysing the “competition” with similar technologies so as to
understand the concepts within the sector, the type of technologies offered and the pricing
models;
2. Setting up not interviews but “conversations” with potential customers having the empathy map
as a guide and an informal but very observant tactic always seeing these encounters as an
immense learning opportunity.
In this sub-section, these parts will be described in more detail individually.

33
Part I – The Market
Portugal’s economy is highly impacted by its tourism revenues, being Lisbon, Madeira and Algarve the
major destinations [21]. Taking this into account and the geographical setting of DemoCorp there’s a
need of familiarization with not only the type of touristic activities, excursions and experiences existing
in Lisbon but the existing similar booking management systems software offer.
Part II – Meeting Tourism Professionals
The goal was to set around 10-15 encounters with tour operators (in Portuguese: “Agentes de Animação
Turística”), use the empathy map to design a customer profile and try to understand what these potential
customers need in a booking system.
Figure 19 - “Get out of the building” for tourism professionals’ flowchart

34
The solution was perceived as useful for both big and small operators so being a tour operator in Lisbon
with a valid license was the initial criteria for contact. The desired sample was diverse on the type of
tour/experience presented and on the use of booking systems, to allow some interesting and diverse
insights.
Apart from the empathy map, a rough flowchart (Figure 19) was prepared to avoid missing important
questions however, they were not mandatory and that kind of rigor was discordant with the level of
confidence and casualness wanted in the encounters. The conversation course was left to the
interviewer’s judgment and perception of what was appropriate.
4.1.3. Measure
As well as in the previous phase (Build) the Measure phase was divided in two parts in order to better
structure the results obtained.
Part I – The Market: Results and Conclusions
Figure 20 - Companies' websites offering booking management systems
Online companies who deal booking systems/engines for tour operators and tourism related activities
were explored and some conclusions on the most visible companies found (Figure 20) regarding their
business models and solution features were gathered:
Many companies already made available mobile applications and real-time transactions for
customers and most are easily integrated with online sellers of tours and activities allowing real-
time synchronization;
Although some of the companies don’t openly share their prices, the most common type of
pricing is the monthly/annual fee and the least common the commission (please see Table 10).
There are companies that allow all the types of payment methods, having a complex pricing
model with many options;
In general all brands appear to have a well-structured and organized value proposition allied to
attractive interfaces, good usability and accessible support.

35
Table 10 - Most common pricing types in the booking management systems
Pricing Types Designation
Monthly or
Annual fee
A fixed fee that can be adjusted to the volume of users and transactions expected. Often combined with transaction packages.
Transaction
Packages
A number of bookings is assured for a certain price. Often combined with a periodic fee and associated with an expiry date.
Commission A percentage of the transaction value is charged.
Part II – Meeting Tourism Professionals: Results and Conclusions
Twenty-one tour operators of different agencies were contacted by phone, followed by an email when
requested, eight agreed to meet in person and ten agreed to talk. Rapidly it was understood that there
was on these tour operators a certain pattern that should be pursued, a pattern that matched the interest
in aiding revealed when approached: agencies with a young spirit, with a good website (comfortable
with IT), present on TripAdvisor (the biggest peer review website for tourism) and with a significant
bookings’ volume.
Tour operators working with tuk-tuks, bikes, boats, limousines, a diving centre, a surf school,
gastronomic experiences, excursions around Lisbon, some with less than five years in business others
with more than ten were interviewed.
The main conclusions inferred from the encounters are:
Either the booking process is most of the times a one-person job being that person the owner
of the agency or there is a small group of people with that job function;
The preferred tools for those who don’t use booking management systems are Microsoft Office
Excel sheets, Google Docs and Google Calendar. These tools are used for records and to be
synchronized within the agency team;
All agencies recognize the importance of peer review and value their position on TripAdvisor;
Only a few have shown interest about the booking system, for those who do, when pricing is
concerned, the monthly/annual fee is the less desired due to the seasonality of some services;
Another obstacle to the use of booking management systems for some agencies is the
excessively automated process – either they sense that communication (email exchanging) with
the customers permits a tailored service and that is part of their value proposition or they have
constraints on their services that require flexibility in the booking process (for example the
weather for outdoor activities);
There is a clear avoidance of any type of logs and records and no interest in payments credited
directly on the bank account, being the preferred when not the only available, the payment in
cash.
These conclusions were surprising and discouraging. It is assumed that there is a cultural obstacle to
this solution and this is not easily circumvented.
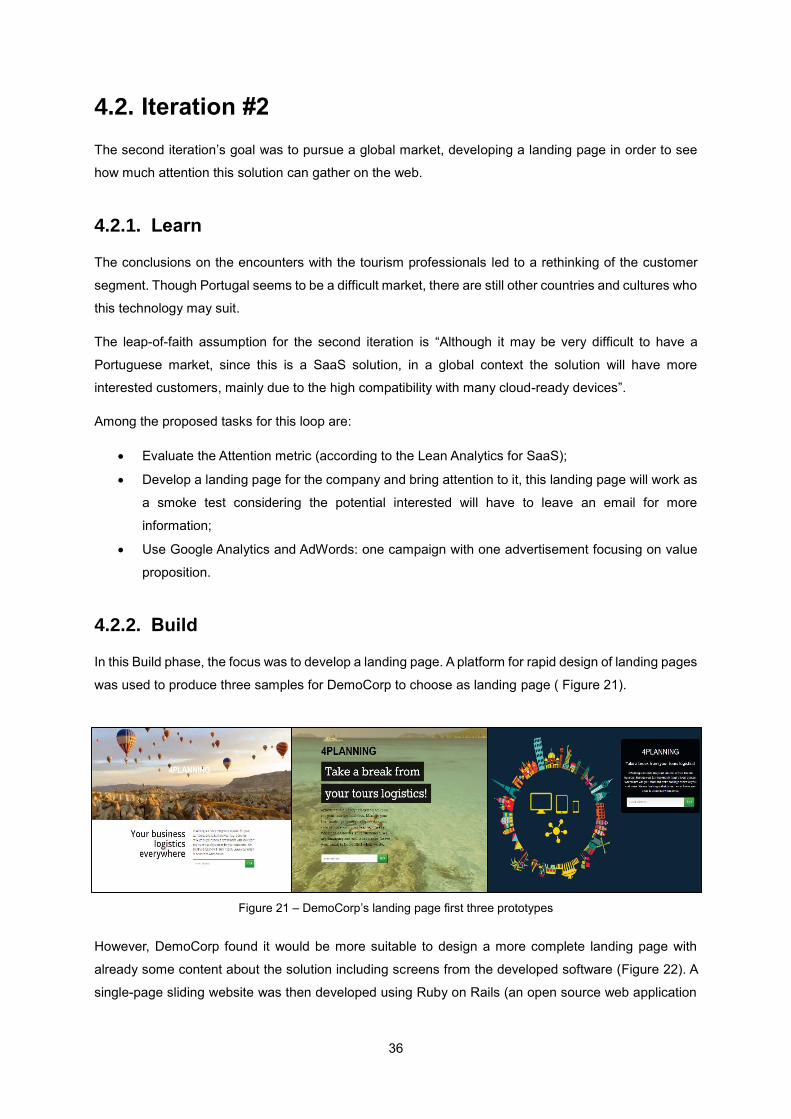
36
4.2. Iteration #2
The second iteration’s goal was to pursue a global market, developing a landing page in order to see
how much attention this solution can gather on the web.
4.2.1. Learn
The conclusions on the encounters with the tourism professionals led to a rethinking of the customer
segment. Though Portugal seems to be a difficult market, there are still other countries and cultures who
this technology may suit.
The leap-of-faith assumption for the second iteration is “Although it may be very difficult to have a
Portuguese market, since this is a SaaS solution, in a global context the solution will have more
interested customers, mainly due to the high compatibility with many cloud-ready devices”.
Among the proposed tasks for this loop are:
Evaluate the Attention metric (according to the Lean Analytics for SaaS);
Develop a landing page for the company and bring attention to it, this landing page will work as
a smoke test considering the potential interested will have to leave an email for more
information;
Use Google Analytics and AdWords: one campaign with one advertisement focusing on value
proposition.
4.2.2. Build
In this Build phase, the focus was to develop a landing page. A platform for rapid design of landing pages
was used to produce three samples for DemoCorp to choose as landing page ( Figure 21).
Figure 21 – DemoCorp’s landing page first three prototypes
However, DemoCorp found it would be more suitable to design a more complete landing page with
already some content about the solution including screens from the developed software (Figure 22). A
single-page sliding website was then developed using Ruby on Rails (an open source web application

37
framework written in Ruby) under a fictitious brand name and image in order to distantiate from
DemoCorp and allow experimentation without risk for the company.
Figure 22 - Various devices adapted to include screens from DemoCorp's software
The chosen brand name was Rezlite with a clear reference to reservations and the cloud technology
feature (Figure 23). The website was hosted on a cloud platform as a service and a domain was bought
on a publicly traded Internet domain registrar.
Figure 23 - Single-page sliding website for DemoCorp
An email account was created for the brand, along with Google Analytics and AdWords accounts. As
stated on the Learn phase the written advertisement focuses on the multi-device aspect of the solution
and its ubiquity and versatility (Figure 24).

38
Figure 24 – Rezlite’s first Google advertisement
The website was connected to a database in order to easily store the submitted contacts for more
information and the required script for Google Analytics was included on the website’s source code.
4.2.3. Measure
The results (Figure 25 and Table 11) were extracted from both the Google Analytics and Google AdWords platform.
Figure 25 - Google Analytics graph relating page views with AdWords traffic iteration #2
Table 11 - Google Analytics and AdWords results iteration #2
Metric Result
Page views 104
Advertisement printings 4298
Advertisement clicks 17
Contacts submitted 1
Most used browser Google Chrome
Most frequent origin United States of America
These were unexpected results only 100 views for seven days and only one contact submitted is not
enough attention for a SaaS business. The email for the interested contact is left for the next iteration.

39
4.3. Iteration #3
On the third iteration the website was adapted to include a pricing model for the solution.
4.3.1. Learn
The leap-of-faith assumption for the third iteration is “The website must have the pricing model in order
to look credible”.
Among the proposed tasks for this loop are:
Evaluate the Attention metric once more;
Produce a similar pricing model based on the competition’s type of models;
Transform the website in a multi-page template and add a pricing tab.
4.3.2. Build
An email was sent to the previous iteration submitted contact and the website was adapted to include a
pricing model (Figure 26). The pricing model is based on the most common pricing models already
present on the competition. Rezlite offers two types of pricings: monthly fees and commissions. The
“More” button leads to a contact submission in order to be posteriorly contacted by the Rezlite team.
Figure 26 - Rezlite's website with pricing model
In terms of Google AdWords the same advertisement was used as in Iteration #2 and the campaign was
set online.
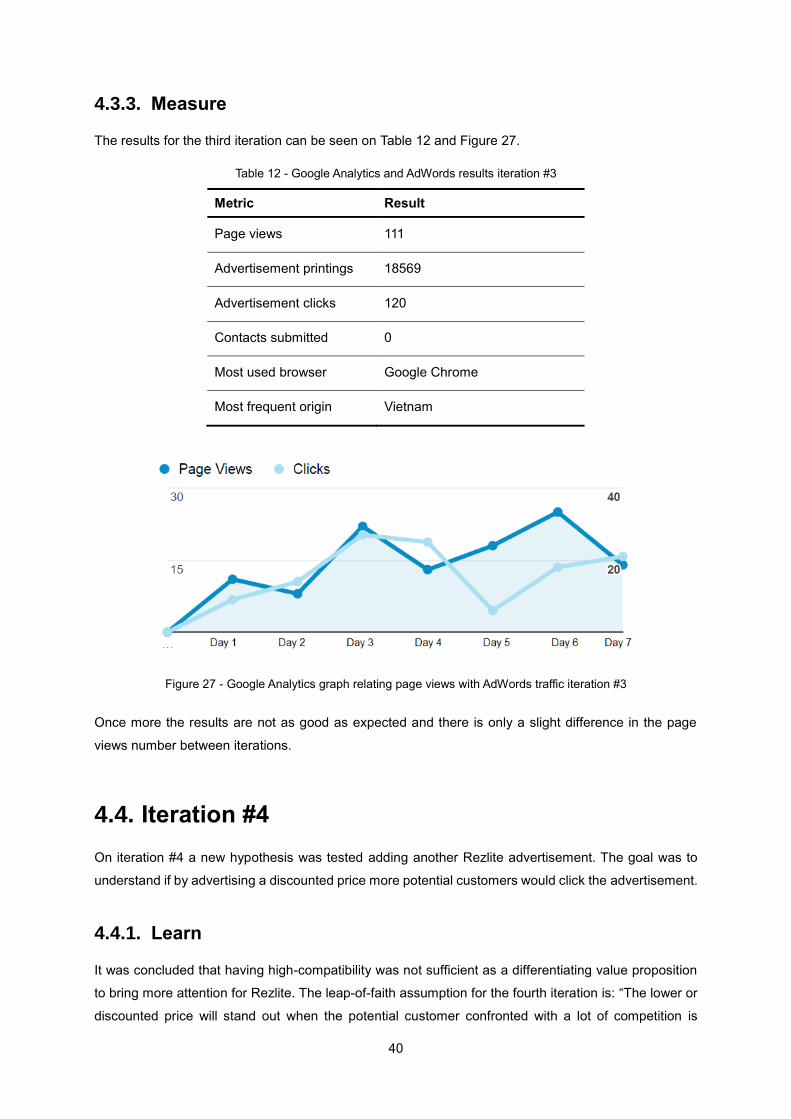
40
4.3.3. Measure
The results for the third iteration can be seen on Table 12 and Figure 27.
Table 12 - Google Analytics and AdWords results iteration #3
Metric Result
Page views 111
Advertisement printings 18569
Advertisement clicks 120
Contacts submitted 0
Most used browser Google Chrome
Most frequent origin Vietnam
Figure 27 - Google Analytics graph relating page views with AdWords traffic iteration #3
Once more the results are not as good as expected and there is only a slight difference in the page
views number between iterations.
4.4. Iteration #4
On iteration #4 a new hypothesis was tested adding another Rezlite advertisement. The goal was to
understand if by advertising a discounted price more potential customers would click the advertisement.
4.4.1. Learn
It was concluded that having high-compatibility was not sufficient as a differentiating value proposition
to bring more attention for Rezlite. The leap-of-faith assumption for the fourth iteration is: “The lower or
discounted price will stand out when the potential customer confronted with a lot of competition is

41
choosing”. The proposed task for this iteration is to rewrite and add new Rezlite advertisements focusing
on the price and the ubiquity aspects.
4.4.2. Build
For this iteration one advertisement was rewritten and another was added, now with a clear call to action
for a discount on prices without leaving the advertising focus on the ubiquity behind (Figure 28).
Figure 28 - Rezlite advertisements written for the fourth iteration
Both advertisements were online at the same time although they have different display requirements.
4.4.3. Measure
The results for the fourth iteration can be seen on Table 13 and Figure 29.
Table 13 - Google Analytics and AdWords results iteration #4
Metric Result
Page views 289
Total Advertisement printings 11635
Advertisement “discount” printings
7228
Advertisement “devices” printings
4407
Total advertisement clicks 91
Advertisement “discount” clicks
60
Advertisement “devices” clicks
31
Contacts submitted 0
Most used browser Google Chrome
Most frequent origin United States of America

42
Figure 29 - Google Analytics graph relating page views with AdWords traffic iteration #4
Although slightly higher in this iteration, the results are again very low and there is no interest shown by
customers into knowing more about the service by submitting contacts. In conclusion: having a low price
is not a game changer in this type of business.
4.5. Conclusion
The project was interrupted at the end of iteration #4 in order to decide whether to Pivot or Persevere.
By persevering, DemoCorp would have to make another leap-of-faith assumption related to this
technology and even Rezlite branding as is and by pivoting DemoCorp would have to make a completely
different approach to the technology distantiating from what has already been done and find another
strategy. Thanks to all the information and data gathered along the 4 iterations DemoCorp can now
make a more informed decision.
In this section the thesis was demonstrated in a real case, DemoCorp, conducting four iterations using
the framework and its proposed tasks. The thesis is evaluated on the next section using this
demonstration as a field study and by interviewing practitioners.

43
5. Evaluation
This section maps to the "Evaluation" step of the DSRM process, the proposal will be evaluated by
confronting the objectives of the solution (section 3.1) with the results obtained in the demonstration
(section 4).
The objectives of the solution included the three learning milestones of Innovation Accounting and
having validated learning as the progress unit these milestones will be evaluated in terms of
achievement and how much learning was produced.
The proposal was evaluated following the proposed approach by Nicolas Prat et al, by choosing four
system dimensions and five evaluation criteria (Table 14).[22]
Table 14 - Chosen dimensions, evaluation criteria and sub-criteria (adapted from [22])
Dimension Evaluation Criteria Definition
Goal Efficacy The degree to which the artifact produces its desired effect.
Environment Consistency with the organization - utility
Measures the quality of the artifact in practical use.
Activity Performance Speed or throughput of an activity.
Evolution Robustness The ability to respond to the fluctuations of the environment.
Learning Capability Capacity of a system to learn from its experience and the reactions of the environment.
The coherency between these criteria and the artefact will be proven through not only the field study
(the demonstration of the proposal instantiated on a real case) but by the input of several practitioners
and field experts.
5.1. Field Study
A field study is defended by some authors as the most gainful method of evaluation due to its practical
nature bringing higher organizational impact and even quality than other methods.[23]
Validated learning on the business and the market was gathered in every iteration. The artefact was
effective, the objectives of the solution were fully achieved and therefore goal – efficacy is a criteria
with a positive evaluation for this artefact.
The artefact is easily adapted to many types of businesses and organizations realities and useful in
terms of the importance of the information gathered about the business and its market and it terms of
44
the level of specification the artefact offers giving guidelines and proposed tasks. Not only every single
business and organization can benefit from business model innovation but can easily have a holistic
view of the innovation process. The artefact is consequently considered consistent with organization
– useful within the environment dimension.
Having the lean-build-measure feedback loop as a foundation, the artefact’s good performance would
always be a relevant characteristic (the whole principle of experimentation being to “fail faster”). Having
successive iterations with well-defined hypothesis and how to test and measure the results speeds up
the process enabling the possibility of choosing the length of an iteration according to the available time.
Hence the artefact matches the activity - performance criteria.
In the evolution system dimension robustness is considered proven in terms of the great part of the
strategy and proposed tasks being left to the innovators’ criteria. Many tasks are suggested and not
mandatory, the artefact is versatile leaving room to the introducing of new tools and methodologies even.
The artefact’s goal is to learn, to provoke questions and new ideas and pairing this aspect with the
artefact’s versatility there areas for continued development and enhancement of the framework. This
artefact has a high learning capability, mostly through experimentation and the innovators’ interaction
with the artefact.
Possible improvements on the artefact were clear once the demonstration with DemoCorp was
concluded. The proposed solution should include more concerns with the involvement of the project
owners in the process, mainly in the Learn phase, not only for a more creative input of the decision
makers but for the interesting discussion that can result in ideas. Presential meetings should be
mandatory and the correlation between engagement and participation of the owners with the richness
of results must be evidenced.
5.2. Practitioners interviews
Practitioners were selected and contacted according to their field of work and experience with innovation
methodologies or for being entrepreneurs and having founded or co-founded their own business. Six
out of the 14 contacted found time for an interview. These interviews took approximately 45 minutes, a
brief explanation of each methodology was given (when necessary), the framework was introduced and
the demonstration case summarized. The conclusions of these interviews can be read on Table 15.

45
Table 15 - Evaluation - practitioners' opinions
Practitioner Opinion
Professor Luís Caldas de Oliveira Vice President for Entrepreneurship Corporate Relations and Technology Transfer - Instituto Superior Técnico
One of the most interesting parts of the process is the “get out of the building” and there is value in discovering how to involve the project owner in this activity without losing the empathy and informality of a not “sales oriented” encounter.
Manuel Tânger Head of Innovation and Co-founder -Beta-i
The framework as is, it’s missing a homogeneous language.
The addition of a methodology to deal with the competition like the Blue Ocean Strategy1 could be interesting.
Nelson Pinho R&D Manager - Compta
The market and scalability analysis should be emphasized on the Learn phase as part of the Insight.
This framework is easily extrapolated for Agile Methodologies like Scrum and be easily put into practice by a team.
Professor Luís Mira da Silva President - INOVISA
The framework may not be easily adopted for people with no knowledge of innovation but can be very helpful for innovators or intrapreneurs.
Doing business model innovation for a third party as for an example in a consultancy arrangement may incite disengagement from the project owners.
Isabel Ferreira CEO and Founder - Bright Knowledge
The “get out of the building” would make more sense on the Learn phase since presuppositions are being validated in this activity and the interview course would be influenced otherwise.
Discovering a problem for a solution is usually a challenge for requirements engineering.
Business process modeling of this innovation process would be an interesting addition.
Pedro Gonçalves CTO and Co-founder - Xpand IT
Other advertising tools should have been used in DemoCorp’s case, in particular Facebook and Linkedin ads and email campaigns.
Unanimous opinions reside on the problem being very common and on the fact that the framework adds
value to the field and is a good compilation of the best practices of the main entrepreneurship and
innovation authors. Not only was the framework well accepted, but in some cases opened business and
collaboration opportunities.
This section detailed the evaluation of the thesis, the next section concludes the thesis with the lessons
learned, limitations, research communication and future work.
1 Blue Ocean Strategy W. Chan Kim and Renée Mauborgne, 2005

46

47
6. Conclusion
The research problem, the companies’ difficulty in innovating their established technologies’ business
model, was presented in this document. There is a vast bibliography on entrepreneurship and innovation
but lacking detail when this particular scenario is concerned, therefore an adaptation of the existing lean
methodologies making the process easier for these cases was proposed. This thesis was then evaluated
by demonstrating the framework in action in a real case – DemoCorp – and by interviewing field experts
and practitioners. The framework adds value to the business model innovation field and was well-
accepted within the innovation community.
The main contribution of this work is a framework for companies to use in their business model
innovation and an exhaustive perception of how this is already applied in a field study. In this modern
age where the “innovate or perish” necessity is evident this framework being easily explained to non-
practitioners presenting a holistic view of the fast process can be the bridge between the traditional
mindset and an innovation culture.
In this section, the lessons learned, limitations, the research communication, and future work will be
described.
6.1. Lessons Learned
This research work raised aspects worth mentioning mainly from the experience within demonstration
case and practitioners interviews.
The “get out of the building” allows a unique insight about the market and is one of the most valuable
activities while innovating. Communication, empathy, perception on a live person-to-person meeting
cannot be substituted by surveys or simply assumptions.
Innovation Consultancy’s success is correlated with the engagement of the customer and the customer’s
mindset. There are still many entrepreneurs who end up managing their businesses instead of focusing
their full-time efforts on innovating their businesses, as they once did.
Although business model innovation is possible, the focus of innovation should be before making
excessive investments on development of a product that cannot be easily sold. Business model
innovation has more barriers than the product or technology innovation mainly because it is fixed to an
investment and a solution that was already made.
The capacity to innovate is not only on the management component but on the organizational mindset.
48
6.2. Limitations
This thesis framework limitations reside mostly on not having been demonstrated in more real cases. It
is possible that the framework has not the same level of usefulness when the innovator applying it
doesn’t have much experience in the field, the adequate innovation mindset or even the holistic view
and knowledge provided by the whole bibliography followed. The framework is not a stand-alone tool,
does not substitute the reading of the familiarity with the methodologies and tools it is founded in.
6.3. Research Communication
This research work was shared with companies and practitioners on the evaluation phase and had a
very good acceptance.
A paper based on this research work will be submitted to the following journals:
Journal of Product Innovation Management from Blackwell Publishing;
Journal of Business Strategy from Emerald Group Publishing;
Innovation from Routledge.
Apart from the companies and practitioners, the research was also shared with DemoCorp the field
study’s company, by having the framework applied to its particular case.
6.4. Future Work
There is still plenty of research that can be done having this thesis as a basis.
The framework could be applied to more cases and even to different kinds of businesses with more
experienced innovators in an “island of freedom” but having a personal stake in the results.
In a consultancy context, could be interesting to add to the framework proposed tasks to bring the
owners closer to the innovators. Including mandatory presential encounters and creativity booster
activities in order to power the owner’s engagement in the process. The Innovator’s DNA2 or the Six
Thinking Hats3 approach could be an increment to stimulate creativity and generate exciting discussions.
Providing guidelines for dealing with competition and highly competitive markets in a model or
framework can motivate companies into differentiating themselves and encourage them not to give up.
A more complete competition approach and analysis could add value to the framework.
The benefits and advantages of modelling the innovation process in BPMN in order to facilitate and
integrate the process in the organization’s business processes could be assessed. There are some
2 The Innovator’s DNA, Jeff Dyer et al., 2011 3 Six Thinking Hats, Edward de Bono, 1985

49
companies already modelling processes for product management, extending this work to the proposed
framework could have interesting results.
The development of a tool to support team synchronization and results integration could be useful, and
thus a business opportunity. There are already tools to apply Lean Startup’s validations and to fill
Business Model, but could bring value allowing the integration of the analytics resulting from Google
AdWords, Facebook and LinkedIn advertisements, email tracking and campaigning tools in order to
have them all in one dashboard.

50

51
References
[1] C. Christensen, The Innovator’s Dilemma: When New Technologies Cause Great Firms to Fail, vol. 19. Harvard Business Review Press, 2013.
[2] S. Blank, The Four Steps to the Epiphany: Successful Strategies for Products that Win. K&S Ranch Publishing LLC, 2013.
[3] V. Chiesa and F. Frattini, “Commercializing Technological Innovation: Learning from Failures in High-Tech Markets*,” J. Prod. Innov. Manag., vol. 28, no. 4, pp. 437–454, Jul. 2011.
[4] H. Chesbrough, “Business model innovation: it’s not just about technology anymore,” Strateg. Leadersh., 2007.
[5] Z. Lindgardt, M. Reeves, G. Stalk, and M. S. Deimler, “Business Model Innovation: When the Game Gets Tough, Change the Game,” Bost. Consult. Gr., no. December, p. 9, 2009.
[6] H. Chesbrough, “Business model innovation: opportunities and barriers,” Long Range Plann., 2010.
[7] H. A. Simon, The Sciences of the Artificial. MIT Press, 1969.
[8] T. Brown, Change by Design. HarperCollins, 2009.
[9] E. Ries, The Lean Startup: How Constant Innovation Creates Radically Successful Businesses. Penguin Books Limited, 2011.
[10] S. Blank, “Why the Lean Start-Up Changes Everything,” Harv. Bus. Rev., no. May, 2013.
[11] P. F. Drucker, Management: Tasks, Responsibilities, Practices. Harper & Row, 1974.
[12] A. Croll and B. Yoskovitz, Lean Analytics: Use Data to Build a Better Startup Faster. O’Reilly Media, Inc., 2013.
[13] A. Osterwalder and Y. Pigneur, Business Model Generation: A Handbook for Visionaries, Game Changers, and Challengers. John Wiley & Sons, 2013.
[14] N. Furr and J. Dyer, The Innovator’s Method: Bringing the Lean Startup into Your Organization. Harvard Business Review Press, 2014.
[15] A. Maurya, Running Lean: Iterate from Plan A to a Plan That Works. 2012.
[16] Canvanizer, “Business Model Canvas vs Lean Canvas.” [Online]. Available: https://canvanizer.com/how-to-use/business-model-canvas-vs-lean-canvas. [Accessed: 05-May-2015].
[17] A. Osterwalder, Y. Pigneur, G. Bernarda, and A. Smith, Value Proposition Design: How to Create Products and Services Customers Want. John Wiley & Sons, 2014.
[18] Web Analytics Association, “Web Analytics Definitions [Report],” Web Anal. Assoc., pp. 1–32, 2007.
[19] A. Kaushik, An Hour a Day. Wiley Publishing, 2007.

52
[20] “Google Analytics.” [Online]. Available: http://www.google.com/intl/en_uk/analytics/.
[21] PwC Portugal, “Desafios do Turismo em Portugal 2014,” 2014. [Online]. Available: http://www.pwc.pt/pt_PT/pt/publicacoes/imagens/2014/pwc_desafios_do_turismo.pdf. [Accessed: 03-Dec-2014].
[22] N. Prat, I. Comyn-Wattiau, and J. Akoka, “ARTIFACT EVALUATION IN INFORMATION SYSTEMS DESIGN-SCIENCE RESEARCH – A HOLISTIC VIEW,” PACIS 2014 Proceedings. 2014.
[23] D. Arnott and G. Pervan, “How relevant is fieldwork to DSS design-science research?,” in Frontiers in Artificial Intelligence and Applications, 2010, vol. 212, pp. 108–119.

53
Appendixes
Appendix A - What Lean Startup does differently[10]
Lean Traditional
Strategy
Business Model Business Plan
Hypothesis-driven Implementation-driven
New-Product Process
Customer Development Product Management
Get out of the office and test hypotheses Prepare offering for market following a linear, step-by-step plan
Engineering
Agile Development Agile or Waterfall Development
Build the product iteratively and incrementally
Build the product iteratively, or fully specify the product before building it
Organization
Customer and Agile Development Teams Departments by Function
Hire for learning, nimbleness and speed Hire for experience and ability to execute
Financial Reporting
Metrics That Matter Accounting
Customer acquisition cost, lifetime customer value, churn, viralness
Income statement, balance sheet, cash flow statement
Failure
Expected Exception
Fix by iterating on ideas and pivoting away from ones that won’t work
Fix by firing executives
Speed
Rapid Measured
Operates on good-enough data Operates on complete data

54
Appendix B - Lean Analytics cycle [12]

55
Appendix C – Innovation Report
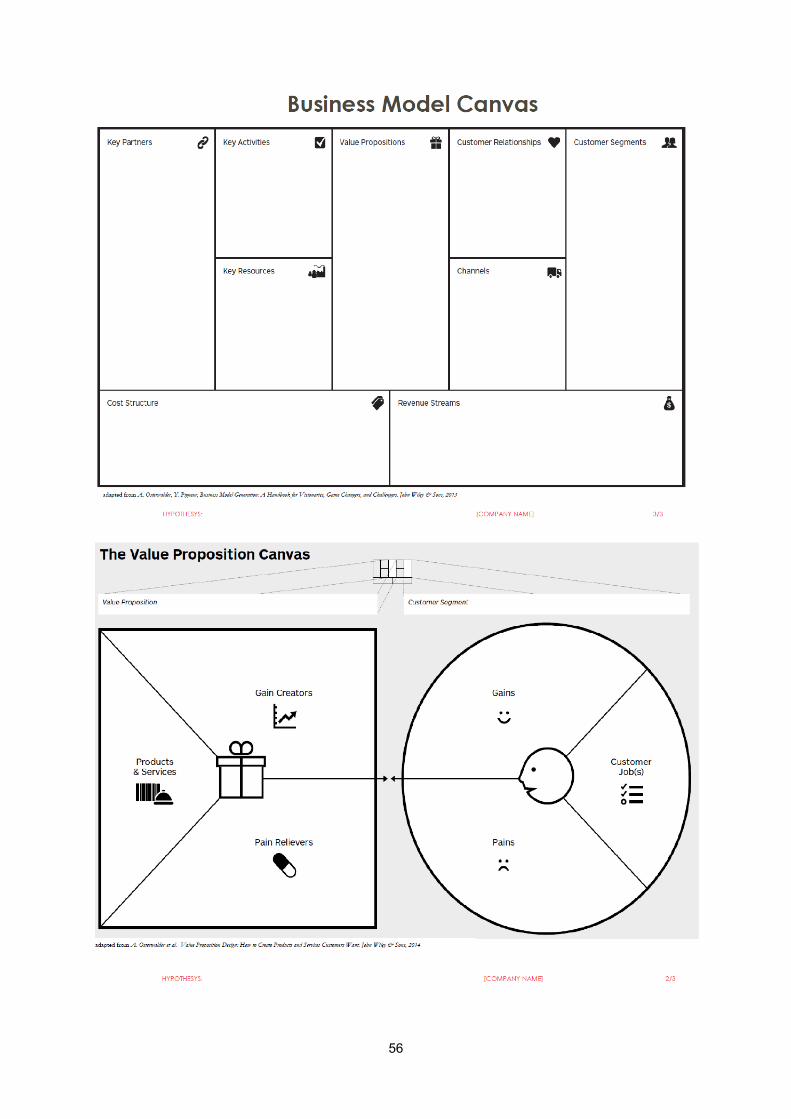
56