business outlook in kazakhstan | 2019 · – advanced accounting systems ... healthcare 1,062 1.9...
TRANSCRIPT

Business Outlook in KazakhstanDeloitte CIS Research Centre2019


Business Outlook in Kazakhstan
03
Foreword 04
Research methodology 05
Key findings 06
Kazakhstan in figures 08
Gross domestic product 08
GDP structure and employment 09
External trade relations 10
Monetary policy 12
Exchange rate 13
Foreign debt and reserves 14
Investment 15
Banking Sector 17
The financial climate in Kazakhstan 20
Development outlook for companies in Kazakhstan 20
Uncertainty and risks 23
Business development strategies 27
Financing sources 30
Development of the non- hydrocarbon sector 31
Innovations and digitalization 33
Expectations of business leaders 36
Our respondents 37
Contacts 38
Contents
Business Outlook in Kazakhstan
04
ForewordThis year, Deloitte celebrates 25 years of operating in Kazakhstan. Throughout these years, we have been actively evolving in parallel with Kazakhstan’s economy.
The oil and gas sector still dominates the country’s economy, however, long-term sustainable development can only be achieved by diversifying the economy and expanding the high-tech sector. Kazakhstan have a long way to go in creating a more balanced economic structure, and this is why it’s extremely important to understand the conditions in which businesses are operating and how they are planning to develop. Our research is based on a survey of Kazakhstan’s corporate leaders and aims to assess the mood of the country’s business community and identify their key development strategies. We placed a special focus on the implementation of innovations by Kazakh companies, and identified the key drivers and barriers to the development of the non-hydrocarbon sector.
This report has been prepared by Deloitte CIS Research Centre. We hope that you find it informative and useful.
If you have any questions or suggestions regarding this report, please contact us at [email protected]
Olga BelonogovaPartner Head of Audit & Assurance in Kazakhstan

Business Outlook in Kazakhstan
05
Research methodologyWe are pleased to present our report on the financial climate in Kazakhstan, produced by Deloitte, CIS.
The perspectives provided by the respondents have enabled us to identify major concerns, key drivers, and development priorities for the Kazakhstan economy, and to perform a comparative analysis of the existing trends.
GoalA comprehensive analysis of the trendsin the Kazakhstan business environment
Research objectives
• Identify prospects for business development in Kazakhstan in 2019
• Provide forecasts of key financial metrics in 2019
• Evaluate the level of uncertainty and key risks of doing business in Kazakhstan
• Identify key business strategies and areas for change
• Identify the drivers and barriers for business in Kazakhstan
Target audience for the Survey Top-management of the leading companies in Kazakhstan in key sectors of the economy.
Sampling methodThe survey was performed on a random sample of respondents from a closed, highly specialized population. The final sample were segregated into several industry groups.
MethodologyData was collected using online questionnaires and personal interviews.
Our comprehensive analysis was based on the following approaches:
• Identification and examination of general market trends;
• Comparative analysis of data in important subgroups (analysis of data differed significantly by subgroup and/or from the overall population);
• Multivariate data analysis (an in-depth analysis of the results in order to identify hidden differences and incorporate the findings).
Event that could have impact on survey results On 19 March 2019, the President of Kazakhstan, Nursultan Nazarbayev, announced his early resignation. To avoid impulsive assessments of the current political and economic situation in the country, the survey was temporarily suspended until 24 March 2019.
Legend
Industries
Manufacturing and extractive industry
Financial services and insurance
TMT (technology, media & telecommunications)
Consumer business
Revenue in 2018
Less than KZT 6 billion
KZT 6 billion – 50 billion
More than KZT 50 billion

Business Outlook in Kazakhstan
06
Key findings
• The majority of respondents (63 percent) were optimistic about the prospects for their companies.
• The Kazakh business community are largely positive about future company income over the next year: 69 percent of respondents are expecting an average of 14 percent growth.
• Over half of the companies surveyed (54 percent) think that their capex will remain unchanged over the next year. However, 37 percent of respondents said that capex will rise in 2019.
• One in three respondents (34 percent) said that their company is planning to increase staff numbers in 2019. In addition, 40 percent spoke about wage growth.
• At the same time, one in five companies (20 percent) expected decrease in staff numbers.
• The key growth areas for Kazakh business relations are Europe and the CIS.
Three most popular financing sources: – Internal financing; – Kazakh and foreign investment; – Government financing.
Financial situation in 2019
GDP (Gross domestic product)
• GDP totaled KZT 59,614 billion in 2018 and real GDP growth is forecast at 3.2 percent–3.9 percent in 2019;
• The key sectors of the Kazakh economy are trade (17 percent), oil and gas production and processing (15 percent) and other manufacturing (11 percent).
• The direct and indirect effect of sectors related to the oil and gas industry amounted to 21 percent.
Inflation in 2018: 5.3 percent
Labor market
• The average gross added value per person employed was KZT 6,383,000 in 2018.
• The average nominal wage in Kazakhstan reached KZT 176,000 per month in 2018, a 17 percent increase on 2017.
Foreign investment
• Kazakhstan received an inflow of USD 23 billion of foreign investment in 2018.
• The country’s key investors are the Netherlands (30 percent of total foreign investment), the US (22 percent) and Switzerland (10 percent).
• The extractive industry accounts for more than half of foreign investment (56 percent), with oil and gas production making up the vast majority of this (50 percent).
External trade relations
• Exports are almost double imports.
• Kazakhstan’s main trading partners are Russia (19 percent of total trade turnover) and Italy (14 percent).
• Key export categories: – oil and oil products: 70 percent; – metals and articles thereof: 14 percent; – food products: 5 percent.
• Key import categories: – machinery and equipment: 40 percent; – products of the chemicals industry: 16 percent;
– metals and articles thereof: 13 percent.
The Kazakh banking sector
• The banking sector comprises 28 banks, half of which (14 banks) have foreign participation.
• Total deposits in 2018: KZT 17 trillion (corporate deposits: 49 percent, retail deposits: 51 percent).
• Loan book in 2018: KZT 13 trillion (non-bank corporate lending: 59 percent, retail lending: 41 percent).
Key economic indicators

Business Outlook in Kazakhstan
07
Top three most popular technological innovations in Kazakh companies: – Advanced accounting systems (44 percent);
– Full automation of selected business processes/chain of business processes (33 percent and 22 percent respectively);
– Big data processing (33 percent).
• The average R&D spend of Kazakh companies was 4.6 percent of revenue in 2018.
Key digitalization drivers: – Management strategy; – Market and competition.
Key digitalization barriers: – Access to talent; – Access to infrastructure.
Innovations and digitalization
Uncertainties, risks and development strategies
• The experts surveyed assessed the current political and economic situation with a low degree of uncertainty (net degree of uncertainty of -26 points).
• Despite the low degree of uncertainty, Kazakh companies are not inclined to make risky decisions (the level of risk appetite totaled -32 points).
Risk factors with an extremely negative impact on the development of Kazakh businesses in 2019–2020: – Stagnation of the Kazakh economy; – Lower domestic demand; – Weakening of the tenge; – Geopolitical risks; – Increased state regulation on business activities.
Priority business strategies in 2019–2020: – Launching new products on the market; – Constant monitoring of costs; – Increased domestic production; – Expansion onto new markets; – Increased cash flow.
• Only a third of Kazakh business leaders (33 percent) said that the government’s efforts to develop the non-hydrocarbon sector were effective.
Top three most pressing problems hindering the development of the Kazakh non-hydrocarbon sector: – Regulatory gaps; – Corruption; – Small domestic market.
Top four key factors necessary to stimulate the development of the Kazakh non-hydrocarbon sector: – Support for innovation; – Tax and other financial incentives; – Investment in physical infrastructure; – Government tenders.
Development of the non-hydrocarbon sector

Business Outlook in Kazakhstan
08
Gross domestic product
GDP, KZT billion (current prices)
Fact
EIU forecast
Real GDP growth, year‑on‑year, %
Fact
EIU forecast
IMF forecast
EBRD forecast
12,8
50 28,2
43 40,8
84
66,5
29 95
,730
16,0
53 31,0
15 46,9
71
71,2
94
17,0
08 35,9
99 53,1
01
79,2
38
21,8
16 39,6
76 59,6
14
87,2
81
2007
2011
2015
2019
*
2023
*
2008
2012
2016
2020
*
2009
2013
2017
2021
*
2010
2014
2018
2022
*
3.3 4.8 1.1 3.27.3 4.2 4.18.9 7.4 1.2 3.91.2 6.0 4.1 3.4 4.3 EIU3.4 3.2 4.63.3 3.33.2 IMF
3.5 3.2 EBRDSource: Ministry of the National Economy of the Republic of Kazakhstan (Statistics Committee)
*Forecasts: Economist Intelligence Unit (EIU), International Monetary Fund (IMF), European Bank for Reconstruction and Development (EBRD)
“Growing real incomes and consumer lending, coupled with an increase in the minimum salary in January 2019, will continue to drive private consumption. Yet GDP growth is expected to slightly decrease – down to 3.5% in 2019 and to 3.2% in 2020 – due to a slowdown in oil production compared to the last two years.”
An Overview of European Bank for Reconstruction & Development. May 2019
“The key factor supporting Kazakhstan’s rating is strong state and external balances, which are supported by significant state savings and substantial net foreign assets of the state.”
Fitch Ratings (Rating action commentary, 22 March 2019)
Kazakhstan’s GDP totaled KZT 59,614 billion in 2018. According to an EIU forecast, real GDP growth will be 3.2–3.9 percent in 2019.
Credit ratings
Agency Rating Outlook Date of change
Moody’s Baa3 Stable 16 October 2018
S&P BBB‑ Stable 11 March 2019
Fitch BBB Stable 22 March 2019
Kazakhstan in figures

Business Outlook in Kazakhstan
09
GDP structure and employment
• The key sectors of the Kazakh economy are trade (17.3 percent), mining (16.3 percent) including oil and gas production (13.3 percent), and manufacturing (12.7 percent) including oil refining (2.0 percent).
• The direct and indirect effect of sectors related to the oil and gas industry including trade, construction and transportation amounted to 21 percent* (the figure is not presented in the table).
• The extractive industry has the highest value added per employee at KZT 31,591,000.
• Value added per person employed in the finance and real estate sector is above average – KZT 19,459,000.
• The average value added per employee in Kazakhstan is KZT 6,383,000.
• Trade (16.1 percent) and agriculture and fishing (14.1 percent) lead the labor market in Kazakhstan, employing almost every third working person in the country.
GDP by industry
in 2018
Employment by industry
in 2018
Gross value added per employed
person
KZT billion % ‘000 people % KZT ‘000
Trade 9,628 17.3 1,397 16.1 6,892
Extractive industry 9,035 16.3 286 3.3 31,591 Oil and gas production 7,372 13.3 – – – Other mining 1,663 3.0 – – –
Manufacturing 7,058 12.7 812 9.3 8,692 Oil refining 1,086 2.0 – – – Other manufacturing 5,972 10.7 – – –
Finance and real estate 6,577 11.9 338 3.9 19,459
Transport and communication 5,976 10.8 791 9.1 7,555
Construction 3,271 5.9 629 7.2 5,200
Agriculture and fishing 2,529 4.5 1,228 14.1 2,059
Education 1,609 2.9 1,096 12.6 1,468
Healthcare 1,062 1.9 499 5.7 2,128
Other sectors 8,756 15.8 1,619 18.7 5,408
Total by industry 55,501 100 8,695 100 6,383
Taxes 4,113 – – – –
Total GDP 59,614 – – – –
Personal income
Average monthly wage, KZT’000
Nominal wage growth, %
Real income index, year‑on‑year, % 9
0 1
26 16
8
101
143
109
151
121
176
2011
2015
1Q 2
019
2012
2016
2013
2017
2014
2018
112 113111 117
141
104 111**108 106
10799103 105109 101 105**103 101
• The average nominal wage in Kazakhstan rose 17 percent in 2018, reaching KZT 176,000. The real incomes of the population also increased by 5 percent.
• Household real and nominal income growth trend persisted through the 1st quarter of 2019.
*According to the Statistics Committee
**Nominal wage growth and real income index for Q1 2019, year-on-year
Source: Ministry of the National Economy of the Republic of Kazakhstan (Statistics Committee)

Business Outlook in Kazakhstan
10
Source: Ministry of the National Economy of the Republic of Kazakhstan (Statistics Committee)
Source: Ministry of Finance of the Republic of Kazakhstan (State Revenue Committee)
External trade relations
2007
2011
2015
Ja
n–
Feb
2019
2008
2012
2016
2009
2013
2017
2010
2014
2018
37.9 46
.4
25.4
28.4
48.8
29.6
31.1
41.3
32.5
32.8 36
.9
30.6
4.5
71.2
86.4
36.743
.2
84.7
48.5
60.3
79.5
61.0
47.8
84.3
46.0
9.9
Exports, USD billion
Imports, USD billion
• Kazakhstan had total trade turnover of USD 93.5 billion in 2018, a 20 percent increase on 2017.
Key export categories:
• The majority of oil and oil products are exported to Europe (75 percent), principally to the EU;
• More than half (53 percent) of metals and articles thereof are exported to Asian countries;
• Over half (51 percent) of food products are exported to CIS countries.
• The value of the country exports are almost double that of its imports.
Key import categories:
• Over a third of machinery and equipment come from Asian countries (35 percent);
• 43 percent of chemicals industry products come from CIS countries, and Russia in particular (39 percent).
• More than half of metals and articles made thereof are imported from Russia (51 percent).
Kazakhstan’s top three export categories
Category Total exports, USD billion
Share in exports
Oil and oil products 42.7 70%
Metals and articles thereof 8.3 14%
Food products and raw materials for their production
3.0 5%
Top five destinations for Kazakh exports
Country Total exports, USD billion
Share in exports
Italy 11.7 19%
China 6.3 10%
Netherlands 6.2 10%
Russia 5.2 9%
France 3.8 6%
Kazakhstan’s top three import categories
Category Total imports, USD billion
Share in imports
Machinery and equipment 13.1 40%
Chemical industry products 5.2 16%
Metals and articles thereof 4.1 13%
Top five exporters to Kazakhstan
Country Total imports, USD billion
Share in imports
Russia 12.4 38%
China 5.4 17%
Germany 1.6 5%
Italy 1.5 5%
USA 1.3 4%

Business Outlook in Kazakhstan
11
T Exports, USD million
T Imports, USD million
Trade turnover in 2018
Mineral fuels, oil and oil products
Inorganic chemical products
Ferrous metals and products
Nonferrous metals and products
Machinery and equipment
Transport
Pharmaceutical products
Plant products
Key export I import categories
Source: Ministry of Finance of the Republic of Kazakhstan (State Revenue Committee)
Trade in other regions accounts for less than 1% of the total.
• European countries account for the largest share of Kazakhstan’s trade turnover with 44 percent. with the European Union (EU) responsible for the vast majority of this (40 percent). Italy is the main trading partner from the EU (14 percent of total trade turnover).
• Asian countries take second place with 27 percent of Kazakhstan’s total trade turnover. China is the most important Asian trading partner with 12 percent of total trade turnover.
• CIS countries account for a further 26 percent of trade turnover. members of the Eurasian Economic Union (EAEU) constitute the majority of this (20 percent). Russia is Kazakhstan’s biggest trading partner with a 19 percent share of the country’s total trade turnover.
• In contrast to Kazakhstan’s trade with Europe and Asia, a negative trade balance characterizes its mutual trade with the CIS countries: imports exceed exports by more than $5 billion.
16,006
52%
17%
11%
8,825
42%
11%
8%
ASIA33,936
93%
2%
1%
6,933
37%
12%
11%
EURO
PE
1,168
52%
18%
17%
1,676
36%
17%
14%
NO
RTH
AN
D S
OU
TH A
MER
ICA 9,455
22%
22%
16%
14,857
16%
15%
12%
CIS

Business Outlook in Kazakhstan
12
Inflation for January–April 2019: 1,8%
Food products 4,8%
Non-foods products 1,3%
Services ‑1,2%
Source: Ministry of the National Economy of the Republic of Kazakhstan (Statistics Committee), the National Bank of Kazakhstan
Monetary policy
Consumer price index, %
The National Bank of Kazakhstan’s refinancing rate
Source: Ministry of the National Economy of the Republic of Kazakhstan (Statistics Committee)
*Forecasts: EIU, IMF
Consumer price index, %
Fact
EIU forecast
IMF forecast
2007
2011
2015
2019
*
2023
*
2008
2012
2016
2020
*
2009
2013
2017
2021
*
2010
2014
2018
2022
*
9.5 6.0 8.5 5.57.8 7.4 5.318.8 7.4 13.6 5.76.2 4.8 7.1 5.3 4.95.15.5 4.04.4 4.14.5
EIUIMF
Inflation в 2018: 5.3 percent
Inflation target for 2019: 4–6 percent
“Inflation could rise to 5–5.3 percent at the end of this year due to increase in minimum wage from June 2019, among other reasons.”
Erbolat Dosayev Governor of the National Bank of Kazakhstan(press conference, 15 April 2019)
**In accordance with Resolution of the Board of the National Bank of Kazakhstan of 24 February 2017 no.30 “On the official refinancing rate” from 1 April 2017 the official refinancing rate is equal to the base rate set at the relevant date.
Source: the National Bank of Kazakhstan
01.0
1.20
07
01.0
1. 2
011
01.0
1. 2
015
01.0
1. 2
019
01.0
1. 2
008
01.0
1. 2
012
01.0
1. 2
016
01.0
1. 2
009
01.0
1. 2
013
01.0
1. 2
017
01.0
1. 2
010
01.0
1. 2
014
01.0
1. 2
018
9.00
11.00 11.00
9.00 9.00
9.25
7.007.50
5.50
The National Bank of Kazakhstan decided to cut the refinancing rate by 0.25 percentage points to 9 percent per annum on 16 April 2019.
“The decision to cut the base rate was based on a number of domestic and external factors. Among them, data on the slowdown in inflation this year, the expectations of the population about its future dynamics, expected inflation slowdowns among our main trading partners and favorable tendencies on international commodities markets.”
Erbolat Dosayev Governor of the National Bank of Kazakhstan(press release by the National Bank of Kazakhstan, 16 April 2019)
Business Outlook in Kazakhstan
13
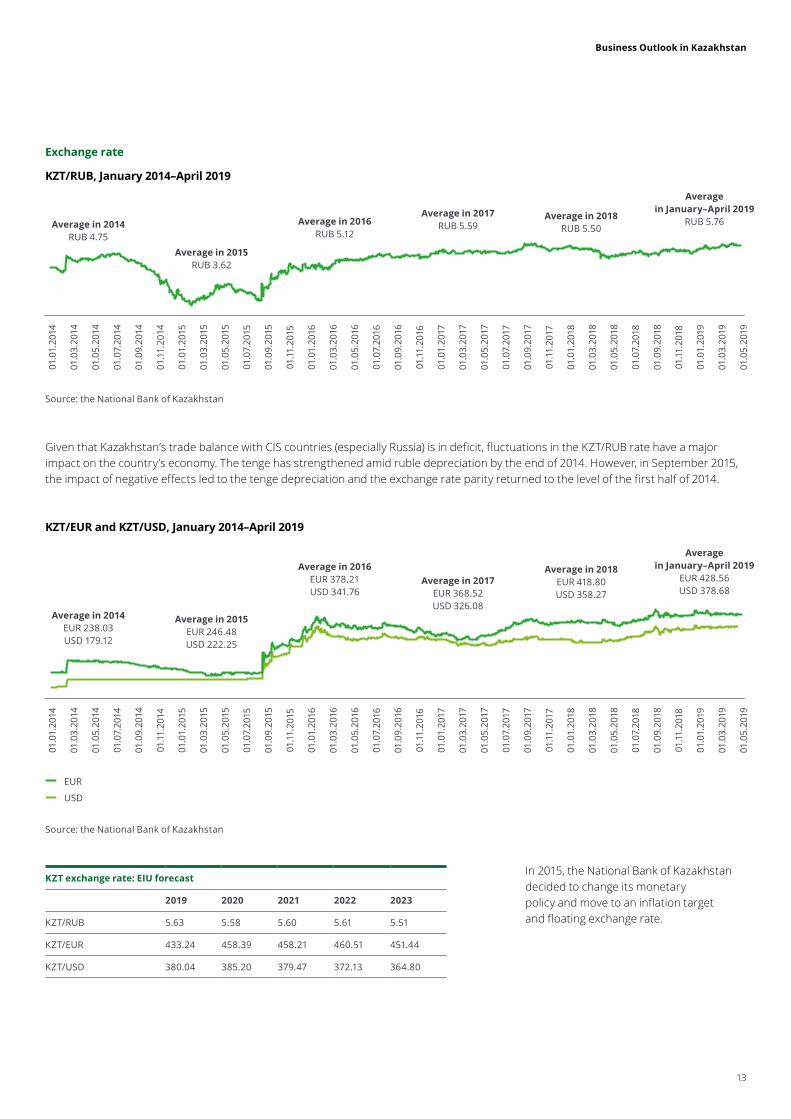
Exchange rate
KZT/RUB, January 2014–April 2019
KZT/EUR and KZT/USD, January 2014–April 2019
Source: the National Bank of Kazakhstan
Given that Kazakhstan’s trade balance with CIS countries (especially Russia) is in deficit, fluctuations in the KZT/RUB rate have a major impact on the country’s economy. The tenge has strengthened amid ruble depreciation by the end of 2014. However, in September 2015, the impact of negative effects led to the tenge depreciation and the exchange rate parity returned to the level of the first half of 2014.
In 2015, the National Bank of Kazakhstan decided to change its monetary policy and move to an inflation target and floating exchange rate.
KZT exchange rate: EIU forecast
2019 2020 2021 2022 2023
KZT/RUB 5.63 5.58 5.60 5.61 5.51
KZT/EUR 433.24 458.39 458.21 460.51 451.44
KZT/USD 380.04 385.20 379.47 372.13 364.80
Source: the National Bank of Kazakhstan
EUR
USD
Average in 2015EUR 246.48USD 222.25
Average in 2014EUR 238.03USD 179.12
Average in 2016EUR 378.21USD 341.76
Average in 2017EUR 368.52USD 326.08
Average in 2018EUR 418.80USD 358.27
Average in January–April 2019
EUR 428.56 USD 378.68
01.0
1.20
15
01.0
1.20
14
01.0
9.20
15
01.0
9.20
14
01.0
1.20
16
01.0
3.20
15
01.0
3.20
14
01.1
1.20
15
01.1
1.20
14
01.0
3.20
16
01.0
5.20
15
01.0
5.20
14
01.0
5.20
16
01.0
7.20
15
01.0
7.20
14
01.0
7.20
16
01.0
9.20
16
01.1
1.20
16
01.0
1.20
17
01.0
3.20
17
01.1
1.20
17
01.0
7.20
18
01.0
5.20
17
01.0
1.20
18
01.0
9.20
18
01.0
7.20
17
01.0
3.20
18
01.1
1.20
18
01.0
9.20
17
01.0
5.20
18
01.0
1.20
19
01.0
3.20
19
01.0
5.20
19
Average in 2015RUB 3.62
Average in 2014RUB 4.75
Average in 2016RUB 5.12
Average in 2017RUB 5.59
Average in 2018RUB 5.50
Average in January–April 2019
RUB 5.76
01.0
1.20
15
01.0
1.20
14
01.0
9.20
15
01.0
9.20
14
01.0
1.20
16
01.0
3.20
15
01.0
3.20
14
01.1
1.20
15
01.1
1.20
14
01.0
3.20
16
01.0
5.20
15
01.0
5.20
14
01.0
5.20
16
01.0
7.20
15
01.0
7.20
14
01.0
7.20
16
01.0
9.20
16
01.1
1.20
16
01.0
1.20
17
01.0
3.20
17
01.1
1.20
17
01.0
7.20
18
01.0
5.20
17
01.0
1.20
18
01.0
9.20
18
01.0
7.20
17
01.0
3.20
18
01.1
1.20
18
01.0
9.20
17
01.0
5.20
18
01.0
1.20
19
01.0
3.20
19
01.0
5.20
19

Business Outlook in Kazakhstan
14
Kazakhstan’s foreign debt
Kazakhstan’s gold and forex reserves
Foreign debt and reserves
Source: the National Bank of Kazakhstan
Foreign debt structure by country as at 1 January 2019
Country’s share of Kazakhstan’s total foreign debt
Netherlands 30%
UK 13%
USA 8%
France 7%
China 7%
Russia 6%
• Kazakhstan’s total trade turnover was USD 159 billion in 2018, down 5 percent compared to 2017.
• In 2016–2017, the country’s foreign debt was higher than its GDP. However, in 2018 foreign debt stood at 93 percent of GDP.
• The Republic of Kazakhstan has significant forex reserves, sufficient to cover almost a year of imports.
Forex reserves, USD billion
Monetary gold, USD billion
Reserve adequacy for covering imports, by month
22 20
19
18
22 17
20
6
10
6
12
7
14
8
31.1
2.20
12
31.1
2.20
16
31.1
2.20
13
31.1
2.20
17
31.1
2.20
14
31.1
2.20
18
31.1
2.20
15
6
1311
7
14
811
T Kazakhstan’s foreign debt, USD billion
Business sector, USD billion
National Bank and banking sector, USD billion
Government, USD billion
Foreign debt as a share of GDP, %
14 812 711 79
118
143
133 14
8
139
141
133
5 125 127 1211
31.1
2.20
12
31.1
2.20
16
31.1
2.20
13
31.1
2.20
17
31.1
2.20
14
31.1
2.20
18
31.1
2.20
15
63
10383
66
119
7193
150 167153137 163158 159

Business Outlook in Kazakhstan
15
Total inflow/outflow of direct investment to/from Kazakhstan from foreign direct investors, USD billion
The structure of foreign investment in Kazakhstan in 2018
Investment
Source: National Bank of Kazakhstan
• Kazakhstan received net inflow of USD 23 billion of foreign investment in 2018.
• Total foreign investment in the Kazakh economy rose by 16 percent, surpassing USD 24 billion.
• The inflow of foreign investment in Kazakhstan has risen 58 percent since 2015 while cash flows from Kazakh investors abroad have dropped 81 percent.
• Just under a third of all investment (30 percent) came from the Netherlands with USD 7.4 billion.
• The US invested over USD 5.3 billion in the Kazakh economy (22 percent).
• Switzerland accounts for a tenth with USD 2.5 billion.
• The mining industry received for more than half of all foreign investment (56 percent). Oil and gas production was a particularly popular recipient of investment (50 percent).
• Manufacturing saw 14 percent of total investment, 11 percent went to the metals industry.
• A further 13 percent was invested in trade.
2010
2014
2018
2011
2015
2012
2016
2013
2017
8.0
6.9
3.0 4.
3
8.7
2.0
10.5
3.4
1.3
26.5
15.4
28.9
21.424
.1
21.022
.2 23.8
24.3
Inflow
Outflow
18%
30%
22%10%6%
6%
4%
4%
5%
12%
56%
14%
13%
Netherlands
USA
Switzerland
Russia
China
France
Belgium
Other countries
Mining
Manufacturing
Trade
Finance
Other sectors
By country By type of activity

Business Outlook in Kazakhstan
16
Investment
The investment attractiveness of Kazakhstan
In 2019, Kazakhstan took 28th place in the World Bank’s Ease of Doing Business Index, which assesses the investment attractiveness of 190 countries, rising eight places from 36th in 2018.
The World Bank said that Kazakhstan’s improvement was due to the following reforms that simplified business processes in the country:
• company registration - cutting the time needed to register as a VAT payer from five days to one, streamlining procedures for opening bank accounts and concluding insurance contracts, etc.;
• international trade - introducing an electronic declaration system, reducing customs fees;
• contract fulfillment security – publishing non-confidential rulings made by courts of all instances in commercial disputes
0 100
Ease of Doing Business Index
Russia
31st (+4 places*)
Kazakhstan
28th (+8 places*)
Azerbaijan
25th (+32 places*)
77.37 77.89 78.64
*Compared to the 2018 ranking on the World Bank’s Ease of Doing Business Index
Source: World Bank

Business Outlook in Kazakhstan
17
Source: Current condition of the Kazakh banking sector, National Bank of Kazakhstan report
Banking Sector
Deposits
• The banking sector comprises 28 banks, half of which (14) have foreign participation.
• Deposits in the Kazakh banking sector have hovered around KZT 17 trillion for the past three years.
• It’s worth highlighting that the deposit structure in Kazakh banks has been gradually shifting in favor of retail deposits over the past four years (their share rising from 39 percent in 2014 to 51 percent in 2018).
• Retail deposits in Kazakh banks have been rising steadily, since 2013 with average annual growth of 19 percent.
• The tenge depreciated following the National Bank’s move to a floating exchange rate in 2015, reducing the attractiveness of deposits in national currency. As a result, the share of retail deposits in national currency have fallen from 79 percent at the end of 2015 to 48 percent at the end of 2018. This means that over half of retail deposits are in forex (52 percent).
Retail deposits Corporate deposits
2013
2017
2014
2018
2015
2016
9,84
5
16,6
80
11,3
51
17,0
43
15,6
05
17,2
69
2013
2017
2014
2018
2015
2016
3,94
9
8,22
7
4,44
2
8,77
1
6,88
6
7,90
8
2013
2017
2014
2018
2015
2016
5,89
6
8,45
4
6,90
9
8,27
2
8,72
0
9,36
1
Share of retail deposits
Share of corporate deposits
T Banking sector deposits, KZT billion
Share of deposits in forex
The share of deposits in national currency
T Retail deposits, KZT billion
Share of deposits in forex
The share of deposits in national currency
T Corporate deposits, KZT billion
• By contrast, corporate deposits have been steadily declining at a average of 6 percent per year since 2016.
• The corporate deposit structure reflects the same changes, with deposits in 2018 in national currency at 46 percent and in forex at 54 percent.

Business Outlook in Kazakhstan
18
Banking Sector
Loan book
• Loan book by Kazakh banks rose 3 percent to KZT 13 trillion in 2018.
• The overall structure of bank lending changed significantly in 2015–2018. Non-bank corporate lending accounted for two thirds (67 percent) in 2015, now having fallen to 59 percent. The share of retail lending has risen by 8 percentage points.
31.1
2.20
14
31.1
2.20
18
31.1
2.20
15
31.1
2.20
16
31.1
2.20
17
11,2
92
13,0
92
12,6
74
12,7
08
12,7
05
Share of retail lending
Share of non-bank corporate lending
T Loan book at the end of the period, KZT billion
Source: The National Bank of Kazakhstan’s Statistical Bulletin
• Lending is a popular source of financing for industrial firms, with 15 percent of loan book in this sector in 2018. Manufacturing accounts for two thirds of lending to industry (10 percent of total loans) with an average annual growth of 10 percent.
• Trade is in second place (14 percent). This sector saw its share of the lending structure shrink by 7 percentage points in 2015–2018 while lending in absolute terms fell by one third (-32 percent) to KZT 845 billion.
• It’s important to note that since 2015 loan book growth has been driven by tertiary segments of the economy and individual entrepreneurs, which increased their share in the lending structure by 9 percentage points.
• Please note that the average weighted rate of issued loans in this sector is significantly above the wider economy’s (by more than 4 percentage points).
Loan book by sector
Sector Loan book at the end of 2015
Loan book at the end of 2018
Change Average weighted rate of issued loans (for 2018)
KZT billion % KZT billion % % %
Industry, including: 1,699 13 2,024 15 +19 9.9
Mining 456 4 387 3 ‑15 7.2
Manufacturing 1,038 8 1,359 10 +31 10.8
Trade 2,646 21 1,801 14 ‑32 12.3
Agriculture and fishing 654 5 490 4 ‑25 13.3
Construction 992 8 753 6 ‑24 13.0
Transport and storage 609 5 593 4 ‑3 10.1
Information and communications 137 1 72 1 ‑47 13.1
Other sectors (tertiary sector, individual activity) 5,939 47 7,358 56 +24 17.6
Total 12,674 100 13,092 100 +3 13.5

Business Outlook in Kazakhstan
19
Business Outlook in Kazakhstan
20
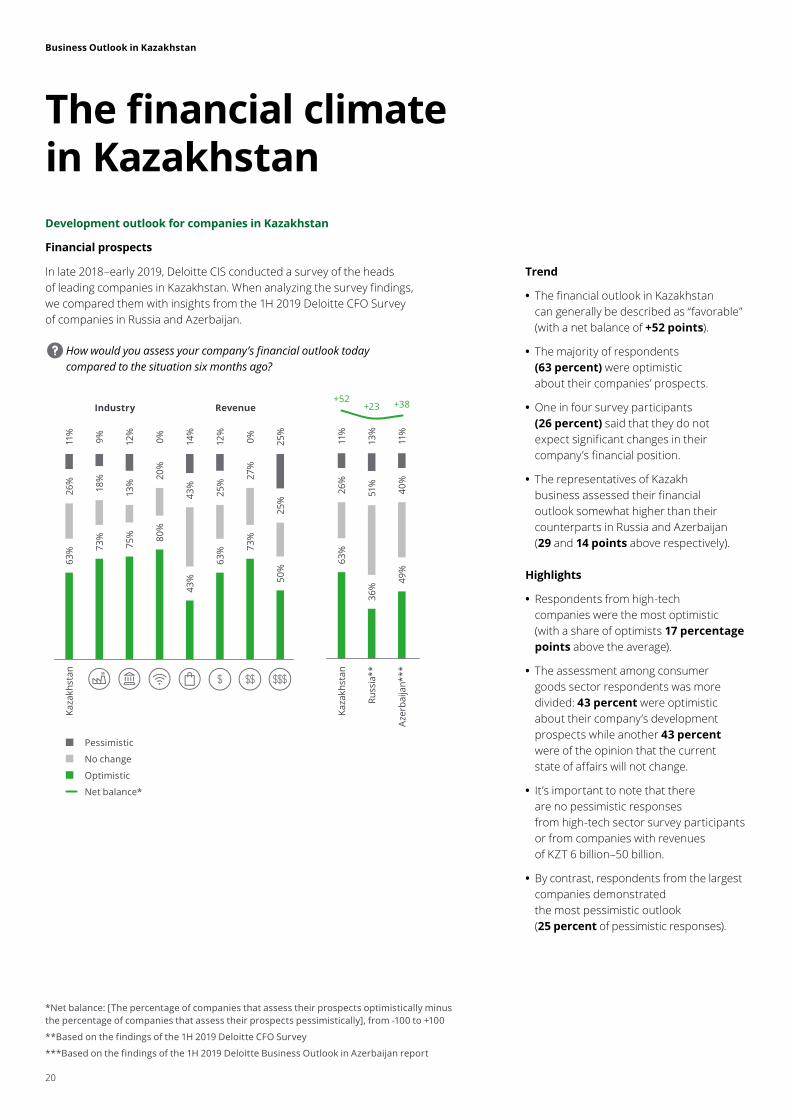
The financial climate in KazakhstanDevelopment outlook for companies in Kazakhstan
Financial prospects
In late 2018–early 2019, Deloitte CIS conducted a survey of the heads of leading companies in Kazakhstan. When analyzing the survey findings, we compared them with insights from the 1H 2019 Deloitte CFO Survey of companies in Russia and Azerbaijan.
How would you assess your company’s financial outlook today compared to the situation six months ago?
Trend
• The financial outlook in Kazakhstan can generally be described as “favorable” (with a net balance of +52 points).
• The majority of respondents (63 percent) were optimistic about their companies’ prospects.
• One in four survey participants (26 percent) said that they do not expect significant changes in their company’s financial position.
• The representatives of Kazakh business assessed their financial outlook somewhat higher than their counterparts in Russia and Azerbaijan (29 and 14 points above respectively).
Highlights
• Respondents from high-tech companies were the most optimistic (with a share of optimists 17 percentage points above the average).
• The assessment among consumer goods sector respondents was more divided: 43 percent were optimistic about their company’s development prospects while another 43 percent were of the opinion that the current state of affairs will not change.
• It’s important to note that there are no pessimistic responses from high-tech sector survey participants or from companies with revenues of KZT 6 billion–50 billion.
• By contrast, respondents from the largest companies demonstrated the most pessimistic outlook (25 percent of pessimistic responses).
Pessimistic
No change
Optimistic
Net balance*
11%
13%
11%
26%
51%
40%
63%
36%
49%
Kaza
khst
an
Russ
ia**
Aze
rbai
jan*
**+23
+52 +38
Kaza
khst
an11
%
14%
9% 12%
12%
0%0% 25%
26%
43%18
%
25%
13%
27%
20%
25%
63%
43%
73%
63%75
%
73%80
%
50%
Industry Revenue
*Net balance: [The percentage of companies that assess their prospects optimistically minus the percentage of companies that assess their prospects pessimistically], from ‑100 to +100
**Based on the findings of the 1H 2019 Deloitte CFO Survey
***Based on the findings of the 1H 2019 Deloitte Business Outlook in Azerbaijan report
Business Outlook in Kazakhstan
21
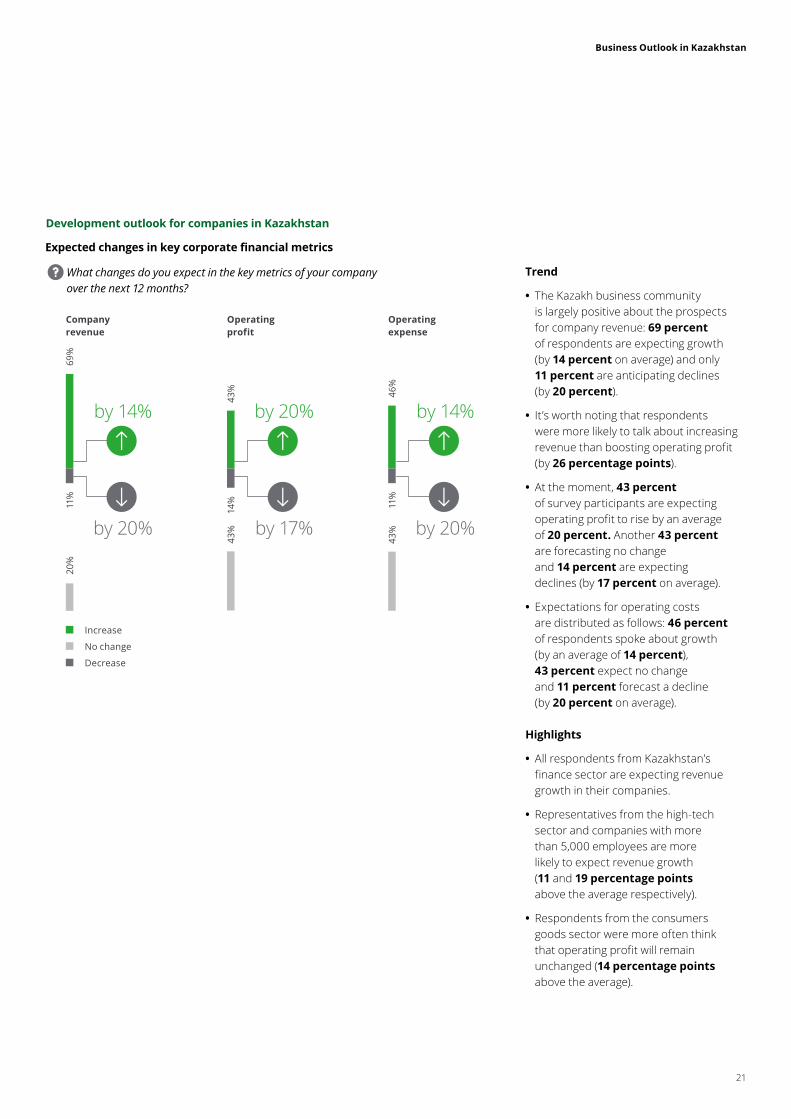
Development outlook for companies in Kazakhstan
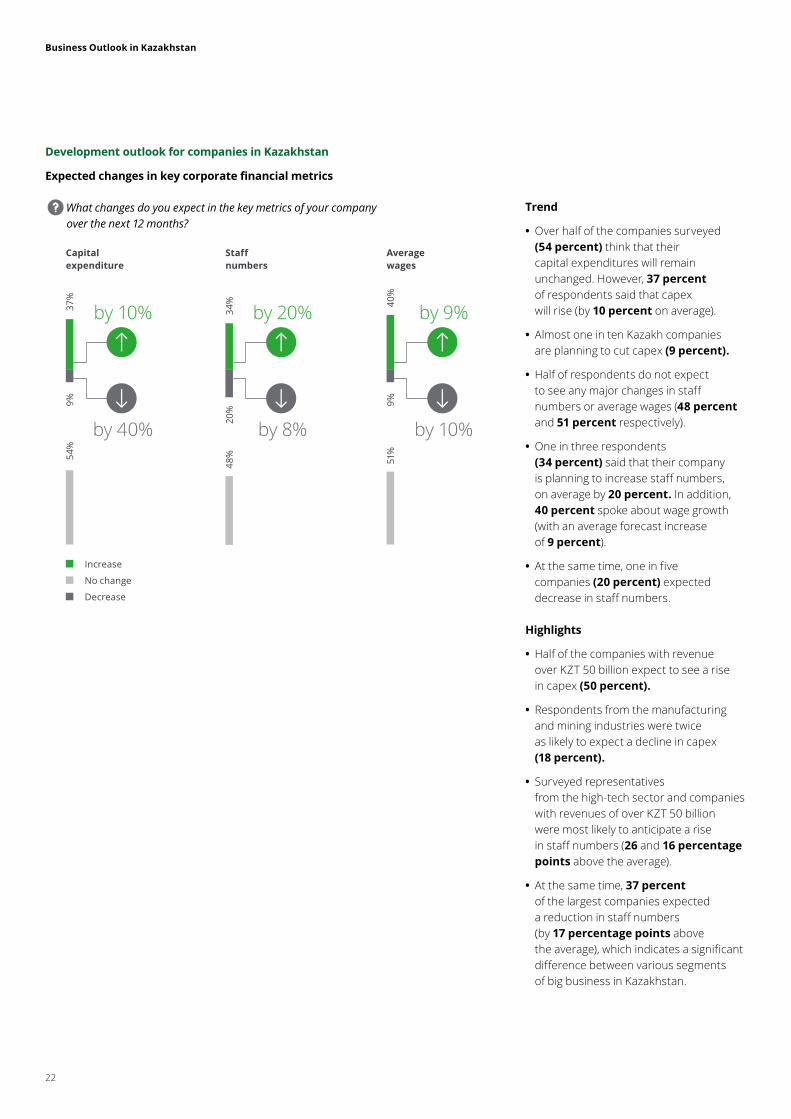
Expected changes in key corporate financial metrics
What changes do you expect in the key metrics of your company over the next 12 months?
Trend
• The Kazakh business community is largely positive about the prospects for company revenue: 69 percent of respondents are expecting growth (by 14 percent on average) and only 11 percent are anticipating declines (by 20 percent).
• It’s worth noting that respondents were more likely to talk about increasing revenue than boosting operating profit (by 26 percentage points).
• At the moment, 43 percent of survey participants are expecting operating profit to rise by an average of 20 percent. Another 43 percent are forecasting no change and 14 percent are expecting declines (by 17 percent on average).
• Expectations for operating costs are distributed as follows: 46 percent of respondents spoke about growth (by an average of 14 percent), 43 percent expect no change and 11 percent forecast a decline (by 20 percent on average).
Highlights
• All respondents from Kazakhstan’s finance sector are expecting revenue growth in their companies.
• Representatives from the high-tech sector and companies with more than 5,000 employees are more likely to expect revenue growth (11 and 19 percentage points above the average respectively).
• Respondents from the consumers goods sector were more often think that operating profit will remain unchanged (14 percentage points above the average).
Increase
No change
Decrease
by 14% by 20% by 14%
by 20% by 17% by 20%
Company revenue
Operating profit
Operating expense
69%
11%
20%
43%
14%
43%
46%
11%
43%
Business Outlook in Kazakhstan
22
Expected changes in key corporate financial metrics
What changes do you expect in the key metrics of your company over the next 12 months?
Trend
• Over half of the companies surveyed (54 percent) think that their capital expenditures will remain unchanged. However, 37 percent of respondents said that capex will rise (by 10 percent on average).
• Almost one in ten Kazakh companies are planning to cut capex (9 percent).
• Half of respondents do not expect to see any major changes in staff numbers or average wages (48 percent and 51 percent respectively).
• One in three respondents (34 percent) said that their company is planning to increase staff numbers, on average by 20 percent. In addition, 40 percent spoke about wage growth (with an average forecast increase of 9 percent).
• At the same time, one in five companies (20 percent) expected decrease in staff numbers.
Highlights
• Half of the companies with revenue over KZT 50 billion expect to see a rise in capex (50 percent).
• Respondents from the manufacturing and mining industries were twice as likely to expect a decline in capex (18 percent).
• Surveyed representatives from the high-tech sector and companies with revenues of over KZT 50 billion were most likely to anticipate a rise in staff numbers (26 and 16 percentage points above the average).
• At the same time, 37 percent of the largest companies expected a reduction in staff numbers (by 17 percentage points above the average), which indicates a significant difference between various segments of big business in Kazakhstan.
Increase
No change
Decrease
by 10%
by 40%
Capital expenditure
37%
9%54
%
by 20%
by 8%
Staff numbers
34%
20%
48%
by 9%
by 10%
Average wages
40%
9%51
%
Development outlook for companies in Kazakhstan

Business Outlook in Kazakhstan
23
Uncertainty and risks
Uncertainty in strategic decision making
We asked the respondents to assess the political and economic environment from the standpoint of uncertainty in strategic decision making.
Trend
• Respondents from Kazakhstan have a low estimation of the level of uncertainty: the net balance is -26 points, which is significantly lower than Russia (by 28 points).
• Thirty-seven percent of survey respondents indicated high uncertainty.
Highlights
• Eighty percent of respondents from high-tech companies spoke about a high degree of uncertainty.
• Consumer goods companies indicated the lowest level of uncertainty: 86 percent of respondents from this sector said uncertainty was low. Companies with revenues of over KZT 50 billion are in agreement (87 percent).
High degree of uncertainty
Low degree of uncertainty
Net balance*
37%
51%
31%
63%
49%
69%
Kaza
khst
an
Russ
ia**
Aze
rbai
jan*
**
+2‑26‑38
Kaza
khst
an37
%
14%
27%
44%
50%
46%
80%
13%
63%
86%
73%
56%
50% 54
%
20%
87%
Industry Revenue
*Net balance: [The percentage of companies that assess the political and economic situation with a high degree of uncertainty minus the percentage of companies that assess it with a low degree of uncertainty], from -100 to +100
**Based on the findings of the 1H 2019 Deloitte CFO Survey
***Based on the findings of the 1H 2019 Deloitte Business Outlook in Azerbaijan report

Business Outlook in Kazakhstan
24
Uncertainty and risks
Assessing risk appetite
*Net balance: [The percentage of companies that think now is a good time for risky decisions minus the percentage of companies that now is this time for such decisions], from -100 to +100
**Based on the findings of the 1H 2019 Deloitte CFO Survey
***Based on the findings of the 1H 2019 Deloitte Business Outlook in Azerbaijan report
Trend
• Despite the low degree of uncertainty, Kazakh business leaders are still generally wary of making risky business decisions (the overall risk appetite level is -32 points).
• The risk appetite of Kazakh business is slightly higher than in Russia, but significantly below that in Azerbaijan (by 30 points).
Highlights
• Companies in the manufacturing and mining industries have higher risk appetites (up 30 percentage points on the average).
• Respondents from the consumer goods sector proved most risk averse (by 20 percentage points).
Do you think now is a good time to take risky decisions that could impact your business?
No, it is not the right time
Yes, it is right time
Net balance*
66%
68%
51%
34%
32%
49%
Kaza
khst
an
Russ
ia**
Aze
rbai
jan*
**
‑36‑32 ‑2
Kaza
khst
an66
%
86%
36%
69%
75%
64%
80%
62%
34%
14%
64%
31%
25%
36%
20%
38%
Industry Revenue
Business Outlook in Kazakhstan
25
Uncertainty and risks
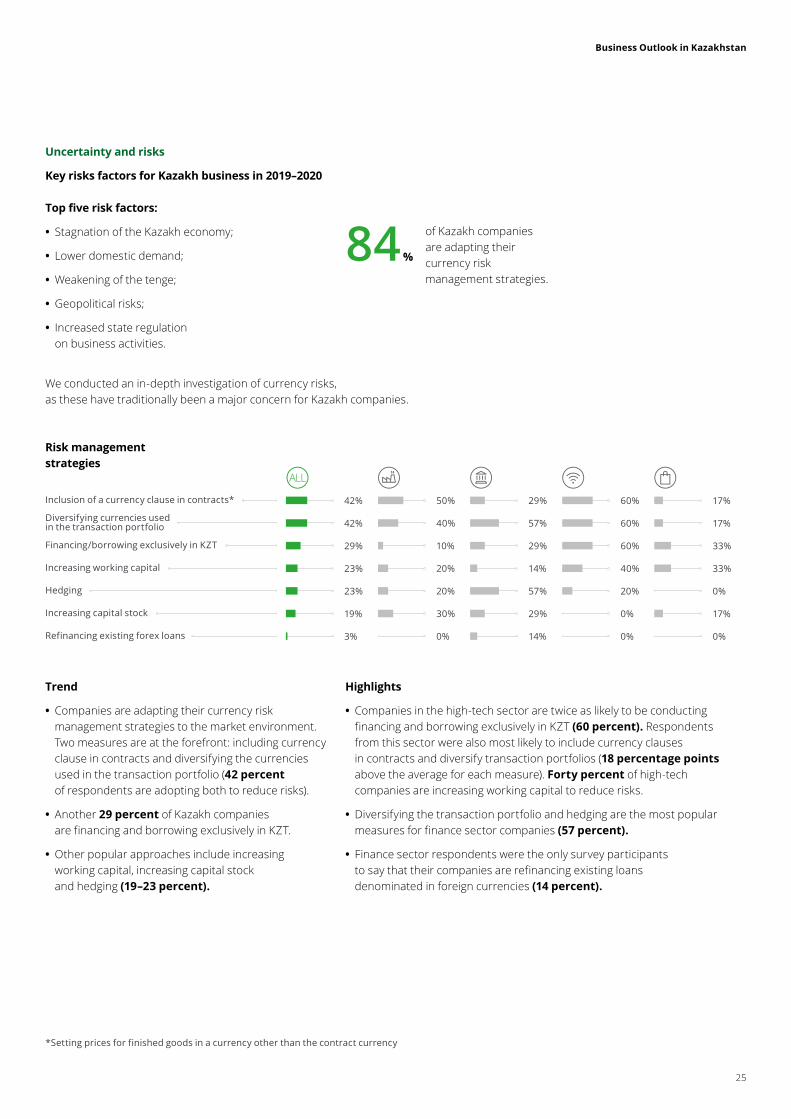
Key risks factors for Kazakh business in 2019–2020
*Setting prices for finished goods in a currency other than the contract currency
Trend
• Companies are adapting their currency risk management strategies to the market environment. Two measures are at the forefront: including currency clause in contracts and diversifying the currencies used in the transaction portfolio (42 percent of respondents are adopting both to reduce risks).
• Another 29 percent of Kazakh companies are financing and borrowing exclusively in KZT.
• Other popular approaches include increasing working capital, increasing capital stock and hedging (19–23 percent).
Top five risk factors:
• Stagnation of the Kazakh economy;
• Lower domestic demand;
• Weakening of the tenge;
• Geopolitical risks;
• Increased state regulation on business activities.
We conducted an in-depth investigation of currency risks, as these have traditionally been a major concern for Kazakh companies.
of Kazakh companies are adapting their currency risk management strategies.
84 %
Highlights
• Companies in the high-tech sector are twice as likely to be conducting financing and borrowing exclusively in KZT (60 percent). Respondents from this sector were also most likely to include currency clauses in contracts and diversify transaction portfolios (18 percentage points above the average for each measure). Forty percent of high-tech companies are increasing working capital to reduce risks.
• Diversifying the transaction portfolio and hedging are the most popular measures for finance sector companies (57 percent).
• Finance sector respondents were the only survey participants to say that their companies are refinancing existing loans denominated in foreign currencies (14 percent).
Risk management strategies
Refinancing existing forex loans
Inclusion of a currency clause in contracts*
Diversifying currencies used in the transaction portfolio
Financing/borrowing exclusively in KZT
Increasing working capital
Hedging
Increasing capital stock
42%
42%
29%
23%
23%
19%
3%
50%
40%
10%
20%
20%
30%
0%
29%
57%
29%
14%
57%
29%
14%
60%
60%
60%
40%
20%
0%
0%
17%
17%
33%
33%
0%
17%
0%

Business Outlook in Kazakhstan
26
Uncertainty and risks
Key risks factors for Kazakh business in 2019–2020
• Weaker domestic demand is more important for companies expecting a rise in operating profit, indicating that profit growth for them is largely associated with domestic sales. On the other hand, weaker external demand is a more pressing concern for companies that are expecting an improved financial position, but not higher operating profit, suggesting that this improved financial position owes more to expansion on foreign markets.
• Weakening of the tenge, economic stagnation in Kazakhstan, capital shortage and an increase in the cost of capital are more acute for companies expecting a worse financial outlook.
• Cyber threats and geopolitical risks are most worrying for companies that are forecasting an improved financial position and an increase in operating profit (favorable zone).
• Decreasing operating income, higher operating expenditures and lower consumer interest in new products are more pressing for companies that are expecting a fall in operating profit and a worse financial position (unfavorable zone).
After a detailed analysis of the data, we collated the risk factors into a risk map, allowing us to assess the effect and the kind of impact they have depending on two performance indicators: expected annual operating profits and the general perception of the current financial outlook.
The greater the distance from the center, the more a risk deviates from the average. Risks located in the center are important for all companies: these include tighter government regulation, intensifying competition and the risk of implementing innovative projects.
Risk mapOperating profit growth
Operating profit growth
Medium risk zone:
:companies expect an increase in operating profit, but say that their financial outlook is worsening.
Unfavorable zone:
companies expect a decline in operating profit and say that their financial outlook is worsening.
Favorable zone:
companies expect that their operating profit will grow
and say that their financial outlook is improving.
Medium risk zone:
companies expect a decline in operating profit
but say that their financial outlook is improving.
Worsening financial position
Improving financial position
Cyber threats
Geopolitical risks
Weaker domestic demandIncrease
in the cost of capital
Intensifying competition
Weakening of the tenge
Stagnation of the Kazakh economy
Innovation project execution risks
New trade barriers/more protectionism
Competition from innovative products
Tighter government regulation
Capital shortage
Decrease in cash flow
Higher operating expenditures in Kazakhstan
Decreasing operating income
Lower consumer interest in new products
Weaker external demand

Business Outlook in Kazakhstan
27
Business development strategies
Attractive business strategies in 2019–2020
We compiled a list of the highest priority development strategies for Kazakh businesses in 2019–2020 based on the results of our survey.
Top five strategies:
• Launching new products on the market;
• Constant monitoring of costs;
• Increased domestic production;
• Expansion onto new markets;
• Increased cash flow.
• Selling assets, cost cutting and reducing leverage should be considered anti-crisis strategies as they are preferred by companies in the unfavorable zone.
• By contrast, companies expecting a rise in operating profit and an improved financial position are more inclined to invest in digitalizing business functions, developing staff and reducing financial risks.
• Developing the business through organic growth and foreign acquisitions are the preferred strategies of companies forecasting an improved financial outlook but not expecting increased operating profit in the short-term.
• Plans to boost production in Kazakhstan are more common among companies expecting a rise in operating profit, which, as already mentioned, is mostly associated with the domestic market.
Business strategy mapOperating profit growth
Operating profit growth
Medium risk zone:
companies expect an increase in operating profit, but say that their financial outlook is worsening.
Unfavorable zone:
companies expect a decline in operating profit and say that their financial outlook is worsening.
Favorable zone:
companies expect that their operating profit will grow
and say that their financial outlook is improving.
Medium risk zone:
companies expect a decline in operating profit
but say that their financial outlook is improving.
Worsening financial position
Improving financial position
Digitalization of business functions
Investing in personnel
Reducing financial
risks
Organic growth
Making acquisitions
abroad
Higher PR/marketing spending
Increasing cash flow
Continuous cost control
Increasing capex
Selling assets
Reducing leverage
Raising capital from external sources
Expanding onto new markets
Cutting costs
Increased domestic production
Stepping up production abroad
Launch of new products/services
Reducing currency risks
We used in-depth data analysis to draw a strategy map that shows the strategic focus areas of businesses. This map helps give a clearer picture of which strategies are the most attractive for companies depending on their financial position and business outlook.
The greater the distance from the center, the more a risk deviates from the average figure.

Business Outlook in Kazakhstan
28
Business development strategies
Pricing policy
Trend
• More than half of respondents (52 percent) said that their companies are planning to increase prices in 2019 (by an average of 10 percent). However, the other 48 percent will keep prices at their current level.
Highlights
• Seventy-five percent of respondents from industrial firms and 67 percent from the consumer goods sector said that they are planning to increase prices in 2019.
• More than half of finance sector companies (57 percent) are planning to keep prices unchanged from 2018. High-tech companies are also more likely than the average to hold their prices in the coming year (60 percent).
Increase
No change
Decrease
by 10%
Planned for 2019
Planned pricing policy in 2019 by industry
Kaza
khst
an52
%
67%
75%
43%
40%
48%
33%
25%
57% 60
%
52%
48%

Business Outlook in Kazakhstan
29
Business development strategies
Prospects of expanding into foreign markets
Current business partnerships
Future business partnership expansion
ASIA
SOU
TH A
MER
ICA
EURO
PE
CIS
NO
RTH
AM
ERIC
A
80%
57%70%
3%
33%
of Kazakh companies work with foreign partners86 %
• The majority of Kazakh companies are currently working with partners from the CIS (80 percent), Europe (70 percent) and Asia (57 percent).
ASIA
SOU
TH A
MER
ICA
EURO
PE
CIS
NO
RTH
AM
ERIC
A
52%67%
14%
• Despite the fact that Kazakh businesses are already working closely with companies from the CIS and Europe, 67 percent of them are planning to expand business ties with these regions.
• Only 3 percent of companies are currently working with South American partners, but 14 percent are planning to expand to this region in the future.
plan to expand their business relations into other regions60 %
14%67%

Business Outlook in Kazakhstan
30
*Net balance: [The percentage of companies that consider a given financing source attractive minus the percentage of companies that consider this source unattractive], from -100 to +100
**Crowdfunding: the practice of funding a project or venture by raising donations from a large number of people.
ICO (Initial Coin Offering): a blockchain-based fundraising tool similar to crowdfunding.
Financing sources
Please rate the attractiveness of the following sources of funding for your organization.
• Internal sources of financing are most attractive for companies with revenues of KZT 6 billion – 50 billion (35 points above the average).
• The percentage of respondents citing the attractiveness of foreign investment was higher for major companies (20 points above the average)
• Obtaining loans from Kazakh banks was the most relevant financing source for 67 percent of companies in the consumer goods sector. A third of respondents from this sector said that obtaining loans from foreign banks was attractive.
• Respondents of manufacturing and extractive industry companies (75 percent) assessed the attractiveness of government financing higher than the average (net attractiveness balance 39 points above average).
• Financing sources such as share or bond issuances were most attractive for companies in the finance sector (by 53 and 38 points respectively).
Favored sources: – Internal financing; – Attracting Kazakh and foreign investment; – Government financing.
Attractive
Not attractive
Net balance*
45%
35%
48%
31%
45%
38%
21%
55%
24%
14%
+24
‑10
+20
‑10
+32
‑3
‑17
+31
‑7
‑24
‑21%
‑45%
‑28%
‑41%
‑13%
‑41%
‑38%
‑24%
‑31%
‑38%
Gov
ernm
ent f
inan
cing
Bon
d is
suan
ce
Fore
ign
inve
stm
ents
Equi
ty is
suan
ce
Inte
rnal
fina
ncin
g
Bor
row
ings
from
ban
ks
in K
azak
hsta
n
Bor
row
ing
from
ban
ks
abro
ad
Attr
actin
g Ka
zakh
in
vest
men
t
Incr
ease
in a
ccou
nts
paya
ble
Crow
dfun
ding
, ICO
**
Business Outlook in Kazakhstan
31
*Index: The weighted balance indicator for the respondents on a scale of 0 to 3
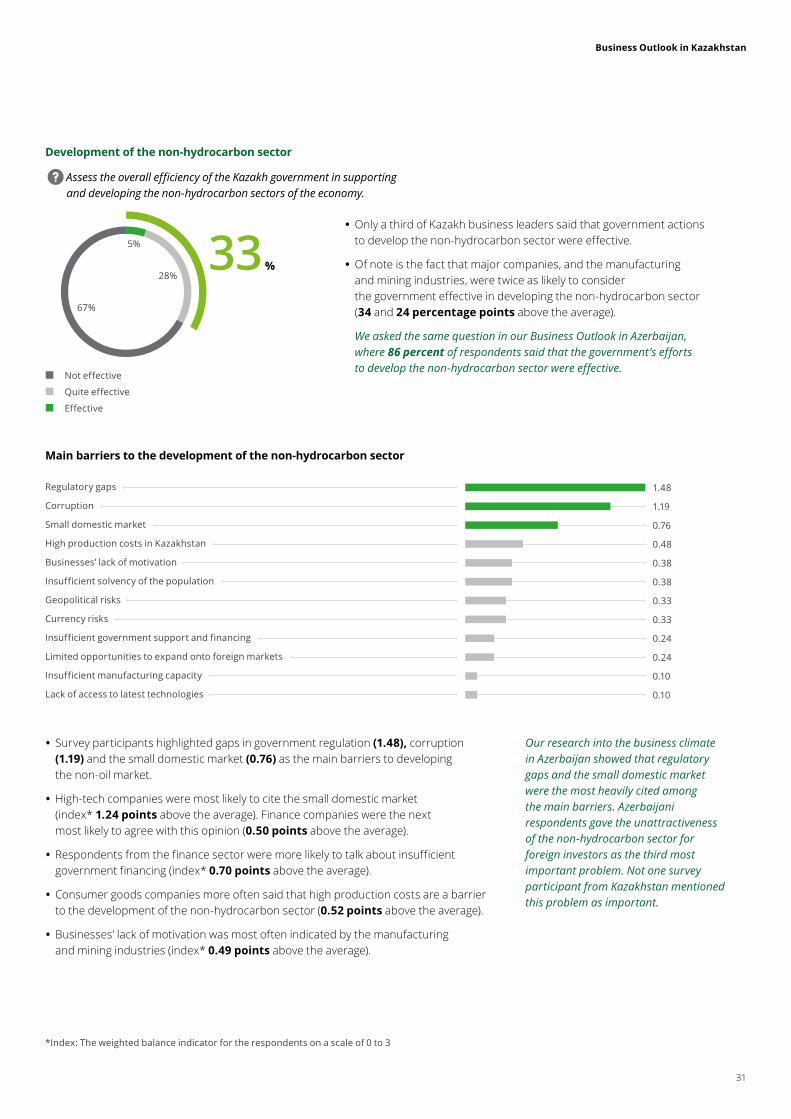
Development of the non-hydrocarbon sector
Main barriers to the development of the non-hydrocarbon sector
Assess the overall efficiency of the Kazakh government in supporting and developing the non-hydrocarbon sectors of the economy.
• Only a third of Kazakh business leaders said that government actions to develop the non-hydrocarbon sector were effective.
• Of note is the fact that major companies, and the manufacturing and mining industries, were twice as likely to consider the government effective in developing the non-hydrocarbon sector (34 and 24 percentage points above the average).
We asked the same question in our Business Outlook in Azerbaijan, where 86 percent of respondents said that the government’s efforts to develop the non-hydrocarbon sector were effective.
Our research into the business climate in Azerbaijan showed that regulatory gaps and the small domestic market were the most heavily cited among the main barriers. Azerbaijani respondents gave the unattractiveness of the non-hydrocarbon sector for foreign investors as the third most important problem. Not one survey participant from Kazakhstan mentioned this problem as important.
• Survey participants highlighted gaps in government regulation (1.48), corruption (1.19) and the small domestic market (0.76) as the main barriers to developing the non-oil market.
• High-tech companies were most likely to cite the small domestic market (index* 1.24 points above the average). Finance companies were the next most likely to agree with this opinion (0.50 points above the average).
• Respondents from the finance sector were more likely to talk about insufficient government financing (index* 0.70 points above the average).
• Consumer goods companies more often said that high production costs are a barrier to the development of the non-hydrocarbon sector (0.52 points above the average).
• Businesses’ lack of motivation was most often indicated by the manufacturing and mining industries (index* 0.49 points above the average).
Not effective
Quite effective
Effective
5%
28%
67%
33 %
Regulatory gaps
Corruption
Small domestic market
High production costs in Kazakhstan
Businesses’ lack of motivation
Insufficient solvency of the population
Geopolitical risks
Currency risks
Insufficient government support and financing
Limited opportunities to expand onto foreign markets
Insufficient manufacturing capacity
Lack of access to latest technologies
1.48
1.19
0.76
0.48
0.38
0.38
0.33
0.33
0.24
0.24
0.10
0.10

Business Outlook in Kazakhstan
32
Development of the non-hydrocarbon sector
Key measures to stimulate the development of Kazakhstan’s non-hydrocarbon sectors
*Index: The weighted balance indicator for the respondents on a scale of 0 to 3
• According to Kazakh business leaders, the most important measures to stimulate the development of non-hydrocarbon sectors are support for innovation (1.29), tax and other financial incentives (1.14), investment in infrastructure (0.76) and government tenders (0.76).
• Tax and other financial incentives were more important for high tech companies (index* 1.36 points average the average).
Support for innovation
Tax and other financial incentives
Investments in physical infrastructure
Public contracts
Decreasing the share of state-owned companies in the non-hydrocarbon sector
Increasing the share of state-owned companies in the non-hydrocarbon sector
Directly subsidizing non-hydrocarbon companies from the budget
Supporting foreign investment in the non-hydrocarbon sector
Reducing export duties for some non-hydrocarbon sector products
Raising export duties for some non-hydrocarbon sector products
Creating industrial clusters and special economic zones
Creating a special non-budget fund for investment in the non-hydrocarbon sector
1.29
1.14
0.76
0.76
0.43
0.33
0.29
0.29
0.29
0.19
0.14
0.10
• Respondents from the manufacturing and mining industries were most likely to say that public contracts for products are necessary for the development of non-hydrocarbon sectors (index* 0.61 points average the average).
• Financial companies most often cited the need for subsidies from the budget (0.91 points above the average).
Our research into the business climate in Azerbaijan revealed that support for innovation and financial incentives were also key measures to stimulate the non-hydrocarbon sector. However, Azerbaijani respondents placed far more importance on the support of foreign investors. This could indicate that Kazakhstan has built more favorable conditions for foreign investment and as a result, this is not such a pressing issue for Kazakh companies.
Business Outlook in Kazakhstan
33
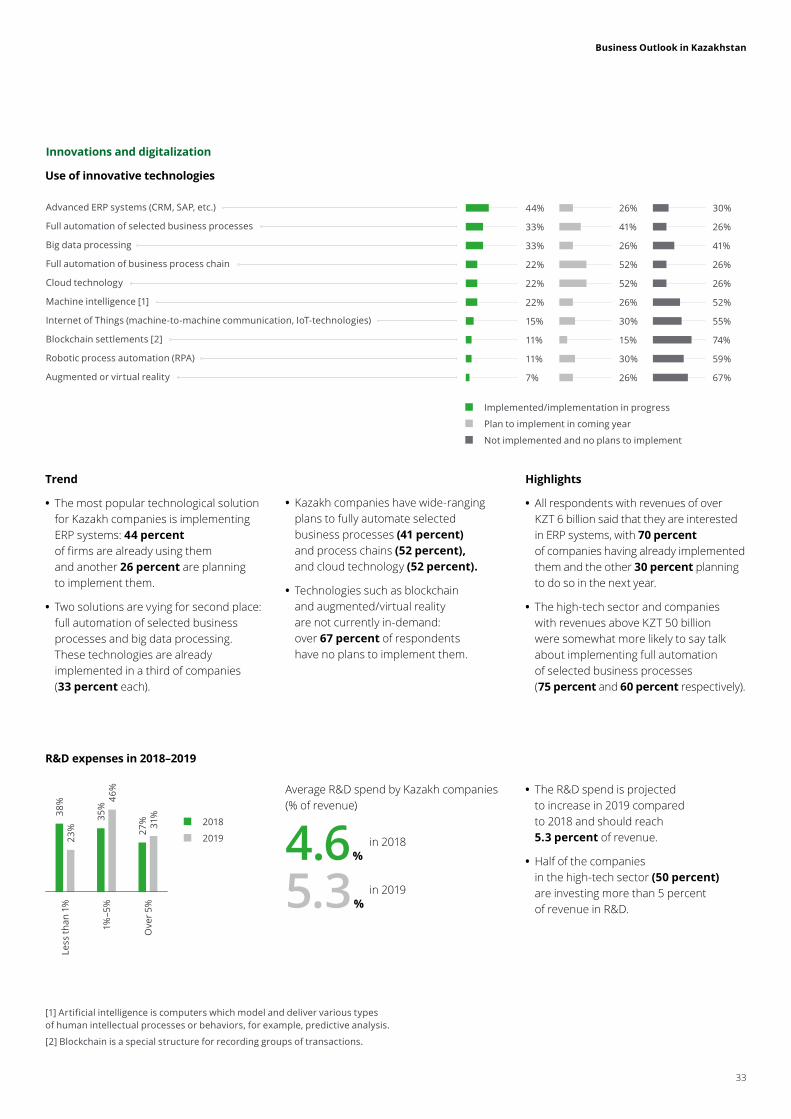
Innovations and digitalization
Use of innovative technologies
R&D expenses in 2018–2019
Trend
• The most popular technological solution for Kazakh companies is implementing ERP systems: 44 percent of firms are already using them and another 26 percent are planning to implement them.
• Two solutions are vying for second place: full automation of selected business processes and big data processing. These technologies are already implemented in a third of companies (33 percent each).
• The R&D spend is projected to increase in 2019 compared to 2018 and should reach 5.3 percent of revenue.
• Half of the companies in the high-tech sector (50 percent) are investing more than 5 percent of revenue in R&D.
2018
2019
27%
38%
35%
31%
23%
46%
Ove
r 5%
Less
than
1%
1%–5
%
Implemented/implementation in progress
Plan to implement in coming year
Not implemented and no plans to implement
[1] Artificial intelligence is computers which model and deliver various types of human intellectual processes or behaviors, for example, predictive analysis.
[2] Blockchain is a special structure for recording groups of transactions.
• Kazakh companies have wide-ranging plans to fully automate selected business processes (41 percent) and process chains (52 percent), and cloud technology (52 percent).
• Technologies such as blockchain and augmented/virtual reality are not currently in-demand: over 67 percent of respondents have no plans to implement them.
Highlights
• All respondents with revenues of over KZT 6 billion said that they are interested in ERP systems, with 70 percent of companies having already implemented them and the other 30 percent planning to do so in the next year.
• The high-tech sector and companies with revenues above KZT 50 billion were somewhat more likely to say talk about implementing full automation of selected business processes (75 percent and 60 percent respectively).
Advanced ERP systems (CRM, SAP, etc.)
Full automation of selected business processes
Big data processing
Full automation of business process chain
Cloud technology
Machine intelligence [1]
Internet of Things (machine‑to‑machine communication, IoT‑technologies)
Blockchain settlements [2]
Robotic process automation (RPA)
Augmented or virtual reality
26%
41%
26%
52%
52%
26%
30%
15%
30%
26%
30%
26%
41%
26%
26%
52%
55%
74%
59%
67%
44%
33%
33%
22%
22%
22%
15%
11%
11%
7%
4.6 %in 2018
5.3 %in 2019
Аverage R&D spend by Kazakh companies (% of revenue)

Business Outlook in Kazakhstan
34
23%
15%
31%
23%
31%
12%
23%
11%
19%
19%
65%
62%
58%
58%
50%
Finance
Production
Marketing, sales
Administration, document flow
HR
Investment in automating business functions
Digitalization drivers and barriers
Drivers
Barriers
Net balance*
69%
73%
50%
85%
62%
85%
+38 +4
6
0
+70
+24
+70
‑31%
‑27%
‑50%
‑15%
‑38%
‑15%
Org
aniz
atio
n st
ruct
ure
Fina
ncin
g
Acce
ss to
tale
nt
Mar
ket c
ompe
titio
n
Acce
ss to
infr
astr
uctu
re
Man
agem
ent s
trat
egy
Investing
Planning to invest
Neither investing, nor planning to do so
• Kazakh companies are most often investing in automating financial and production processes (65 percent and 62 percent respectively).
• All high-tech companies are investing in production automation. In addition, three quarters of companies in the manufacturing and mining industries are investing in this area (75 percent).
• Companies with annual revenues of over KZT 50 billion are most likely to invest in the automation of administrative processes (22 percentage points above the average).
• Consumer goods companies invest in HR processes more frequently than other companies (75 percent).
Innovations and digitalization
• The main drivers of digitalization strategies, according to our respondents, are management strategy and the market and competition (both with a net balance of +70 points).
• Financing is in second place (+46 points).
• On the other hand, half of all respondents cited staffing deficiencies as a barrier to digitalization.
*Net balance: [The percentage of companies that consider a given strategy a driver of digitalization minus the percentage of companies that consider this strategy a barrier], from -100 to +100

Business Outlook in Kazakhstan
35

Business Outlook in Kazakhstan
36
Expectations of business leadersAnticipated market dynamics
We asked our Kazakh respondents to assess the position of selected currencies, commodities, indexes and rates in 2019.
450 KZT
60USD/barrel
USD/KZT
Brent oil price
Refinancing rate
EUR/KZT
Gold price
Inflation
21%
62%
17%
14%
59%
27%
13%
66%
21%
17%
57%
26%
8%
79%
13%
33%
58%
9%
395 KZT
9.25 %
7.0 %
1,300 USD/oz
Less than 380
380–410
More than 410
Less than 430
430–470
More than 470
Less than 55
55–70
More than 70
Less than 1,200
1,200–1,400
More than 1,400
Less than 8.5%
8.5%–10.0%
More than 10.0%
Less than 6.0%
6.0%–8.0%
More than 8.0%

Business Outlook in Kazakhstan
37
Revenue in 2018
Industries
Number of staff
Less than KZT 6 billion
KZT 6 billion – 50 billion
More than KZT 50 billion
Manufacturing and extractive industries
Financing services and insurance (FSI)
TMT (technology, media & telecommunications)
Consumer business
Other sectors
Less than 100 employees
100–1,000 employees
More than 1,000 employees
31%
14%23%
20%
11%
23%
46%
31%
23%
37%
40%
Our respondents

Business Outlook in Kazakhstan
38
Lora NakoryakovaResearch Centre LeaderBusiness DevelopmentDeloitte [email protected]
Mikhail GordeevHead of research projectsResearch CentreDeloitte [email protected]
Samat JamayevHead of Marketing & Communication in Caspian [email protected]
Victoria PigalkinaAnalyst Research CentreDeloitte [email protected]
Contacts
Olga BelonogovaPartner Head of Audit & Assurance in [email protected]
If you have any questions about this research,please do not hesitate to contact us.

Business Outlook in Kazakhstan
39

deloitte.ruAbout Deloitte
Deloitte refers to one or more of Deloitte Touche Tohmatsu Limited, a UK private company limited by guarantee (“DTTL”), its network of member firms, and their related entities. DTTL and each of its member firms are legally separate and independent entities. DTTL (also referred to as “Deloitte Global”) does not provide services to clients. Please see www.deloitte.com/about for a more detailed description of DTTL and its member firms.
Deloitte provides audit, consulting, financial advisory, risk management, tax and related services to public and private clients spanning multiple industries. Deloitte serves four out of five Fortune Global 500® companies through a globally connected network of member firms in more than 150 countries bringing world-class capabilities, insights, and high-quality service to address clients’ most complex business challenges. To learn more about how Deloitte’s approximately 286,000 professionals make an impact that matters, please connect with us on Facebook, LinkedIn, or Twitter.
This communication contains general information only, and none of Deloitte Touche Tohmatsu Limited, its member firms, or their related entities (collectively, the “Deloitte Network”) is, by means of this communication, rendering professional advice or services. Before making any decision or taking any action that may affect your finances or your business, you should consult a qualified professional adviser. No entity in the Deloitte Network shall be responsible for any loss whatsoever sustained by any person who relies on this communication.
© 2019 AO Deloitte & Touche CIS. All rights reserved.