business process analysis and modeling integrerade affärssystem och affärsprocesser
TRANSCRIPT
Business process analysis and modeling
Integrerade affärssystem och affärsprocesser

Contents
Business Process Management Business process models: what is a
model? Business process analysis: text analysis Business process modelling: different
modelling techniques are presented

Business Process Management
5 steps:– Business process identification– Business process analysis– Business process modelling– Business process change/implementation– Business process monitoring, control and
evaluation
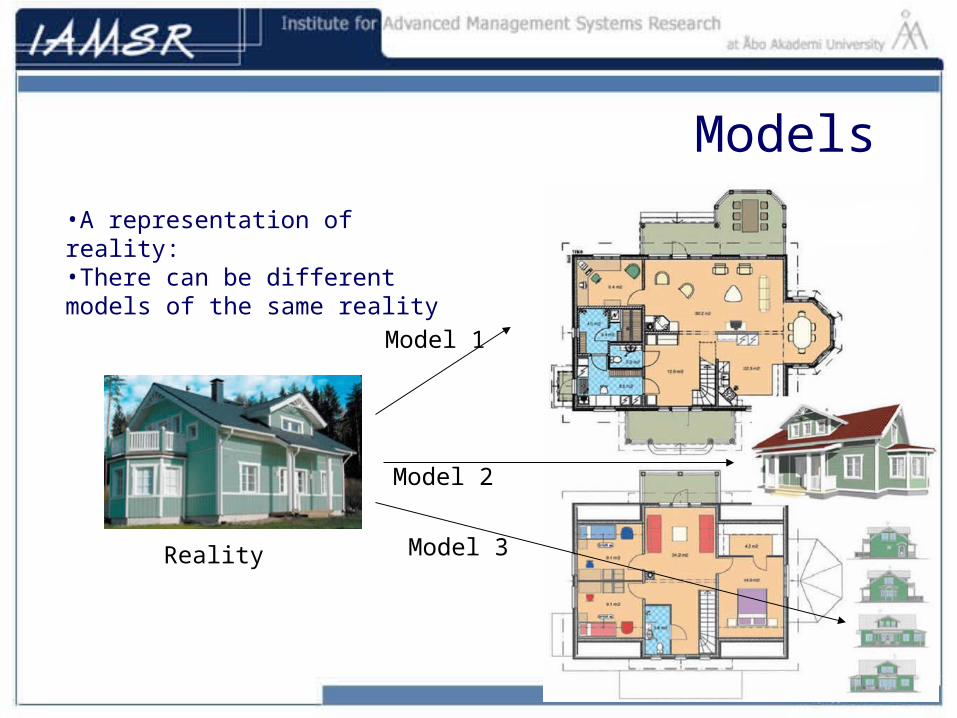
Models
•A representation of reality:•There can be different models of the same reality
Reality
Model 1
Model 2
Model 3
Business process analysis and modeling
Business process model is – A description, representation, specification
of a business process Business process analysis and modelling
– key issues: – how to create a machine-processable model
of processes?– how to represent the different aspects of a
business process?
Business processes have several dimensions
Business processes can be described in several manners:– Organizational dimension: describes the
organizational aspects of the process. Who is involved? What are the reposonisbilities? Who makes decisions?
– Data dimension: describes the data and informations elements involved in the process.
– Function dimension: describes the functions (operations) that are needed in order to run the process
– …And in models that actually incorporate the three dimensions above into a single model.

Business process analysis and modeling
Business process modeling methods: – ways to represent business process models
Business process analysis methods and techniques: – analytical frameworks and techniques that
helps you to create model from source information
– also involves modeling techniques
Process modelling methods and techniques
Diagramming techniques:– One of the most common description of process
models– can be in many different forms because there
are many different diagramming techniques for different purposes
– Formal diagram techniques:• Data Flow Diagrams• Process Flowchart• ANSI Process Flowcharts • IDEF• etc

Process modelling methods and techniques Linguistic Approach
– Structured English (Pseudocode)– OPR STATEMENT
Object oriented approach– ERA (Entity-Relationship Attribute)
Business process modelling:– Object Property Relationship OPR Modeling– Role Activity Diagram, RIN (Role Interaction Net)– Action Workflow– REAL: Resources, Events, Agents, Locations– ARIS method

Business process analysis and modelling vs Information Systems
analysis and modelling
Process analys and modeling finds its roots in information systems development (ISD)
Therefore many BPA and BPM techniques originate from information systems analysis an modelling.– Ex: flowcharts, ERM, IDEF
These techniques are particularly suited to model dataflows, process functions and interrelations between data elements and functions
BPA and BPM techniques stem from different fields
system analysis: flow charting organization and method: organizational charts, … work study: text analysis,
ethnomethodology,office process descriptions operations research: Role Interaction Net (based
on Petri Nets) accounting method: ABC-accounting
Tools like ARIS provide a framework to integrate these different methods.

Business Process Analysis

Simple Text Analysis Techniques(Darnton and Darnton, 1997)
Sources of information for business process analysis– text– spoken language– diagrams
How to draw business process models from text or spoken language?
How to draw business process models from diagrams?

Simple Text Analysis Techniques
Text analysis techniques that help you to identify or construct a set of objects, properties, relationships and statements from verbal sources
Key problems in text analysis:– objects, properties, relationships may be
represented using a variety of expressions - apply judgement
Simple Text Analysis Techniques
Key problems in text analysis:– the words used may not say what was intended
to be said (how to figure out the precise term)– pay attention to the specific meaning of words– synonyms: to produce one agreed term– homonyms: words mean different things in
different contexts (introduce more words and terms to account for all the meaning of a word or term)

Simple Text Analysis Techniques
Key problems in text analysis:– recognize ambiguity in words-meaning and resolve it
when necessary
Any model will inevitably be the result of many arbitrary decisions
Suggestions given by the authors:– do not advocate a full analysis of all parts of speech
(or text), but restrict the analysis to a limited number of parts of speech: nouns, verbs, adjectives and adverbs.

Simple Text Analysis Techniques
Nouns indicates objects Verbs indicates relationships Adjectives/Adverbs indicates properties

Synonyms and homonyms
Issue: how to detect these and to resolve whether they are synonyms and homonyms.
Proposed solution: look at the properties of the terms.
Two terms are synonyms if:– their properties are essentially the same– objects participate in the same relationship types
Terms are homonyms when they have inconsistent properties

Ambiguity
Can occur when different descriptions of the same process depict it in different ways
Example: ”a purchase order is sent to A or B”.– this description is complete but is
ambiguous, as we do not how to decide between A and B
– maybe A and B represent the same entity
Antropomorphism ”the ascription of human attribute or
personality to anything personal or impersonal”– e.g. ”the Purchasing department sends an order
to the supplier”– the Purchasing department is an organizational
unit, and as such does not perform anything; only people within that department can perform operations
– in this case, it is the role of the analyst to see whether there is a need to introduce people as actors who performs the function (send the order)
Text analysis exercise
identify objects, relationships, add comments– (i) identifying the tasks and activities;– (ii) identifying the documents utilized in the
manual business process;– (iii) identifying the participants or agents of
the process– (iv) identifying the inputs (events, resources)
and outputs (products, services, events) of the process.
– (v) identifying the data needed in the process and
– (iv) the computer systems used.
Process modelling methods and techniques
Diagramming techniques:– One of the most common description of process
models– can be in many different forms because there are
many different diagramming techniques for different purposes
– Formal diagram techniques:• Data Flow Diagrams• Process Flowchart: showing a complete process broken
into a series of lower level processes • ANSI Process Flowcharts: Process flowcharts based on
the ANSI Notation
• IDEF, etc

Process modelling methods and techniques
Linguistic Approach– Structured English (Pseudocode)
Object oriented approach– ERA (Entity-Relationship Attribute)
Business process modelling:– Object Property Relationship OPR Modeling– Role Activity Diagram, RIN (Role Interaction Net)– Action Workflow– REAL: Resources, Events, Agents, Locations– ARIS (ARchitecture of Integrated Systems)
Resources for Business Process Modelling Tools– http://www.bpiresearch.com/Resources/Product_Watchlist/
product_watchlist.htm
Data Flow Diagram Represents the flow of data between
different processes within a system Simple, intuitive Business people can understand a
carefully designed DFD, can point out errors and omissions
Focus on flows of data between subprocesses
only four symbols Example

DFD: Limitations
concentrating only on data (or information) objects– focus only on the flow of information; no
symbol for flows of material…
limited vocabulary: no symbols for decision points, sequence of operations, etc.
imprecise about the details of sequence and concurrency
do not show who does what

Flowcharts
Even when DFDs are used extensively, other techniques often used to fill in the details not adequately expressed by DFDs
Flowcharts are diagrams expressing the sequence and logic of procedures using standardized symbols to represent different types of input, output, processing and data storage
Example

IDEF(www.idef.com, + …, USAF ICAM Office, 1981; Mayer et al, 1995)
Icam DEFinition method– originated from ICAM process modelling– each box is an activity or subject which may be de-
composable IDEF0: used for process modelling, but suffers from
being firmly rooted in a data-driven view although has notation for some elements of
behavioural and organizational perspectives, on the whole, it captures only a small variety of process features.
Rooted in the hard, neat and tidy world of information technologists, forces a strictly hierarchical view of human activity
Process Mapping(Rummber and Brache, 1990)
Still a traditional flowchart, with extensions to show organizational responsibility for process steps and performance constraints or goals
cover a broader range of process features than IDEF0
easily understood by business readers Limitation: undirectional flows as the only
relationship between activities means that other types of interaction between people have to be fudged.
Check ”Process mapping”, Marelli A. (2005) – PDF document in Moodle

Structured English (Pseudocode)
Can specify exactly how a procedures operates
to represent the precise logic of a procedure by writing that logic using a few limited forms such as sequence, iteration, and selection using “if-then” or “if-then-else”, “go to”,...
Example:

Role Activity Diagramming RAD
Developed by Anatol Holt (1983) for modelling the ways that people work together, the coordination and interaction in the workplace; especially well suited to business process modelling;
with a concise and rich notation that is easy to read RAD offers good coverage of the functional,
behavioural and organizational perspectives, particularly at the detailed level
RAD has formal basis in Petri-Net theory RAD lacks notations for dataflows

RAD provides four perspectives on Business Process Modelling
Functional: representing what activities are being performed and what data flows connect them
Behavioural: representing when activities are performed, with sequencing, feedback loops, iteration, decision making, triggering conditions, etc.
Organizational: representing where and by whom activities are performed, plus physical communication mechanisms and storage media
Informational: representing the entities (documents, artifacts, products) produced or manipulated y a process, including their structure and inter-relationships

The RAD Notations
Role, Activity, State, State description, etc. Five key concepts that need to be modeled
for a business process• how activities are divided amongst roles• what the organization is trying to reach with the
process: the process goal• what people do to achieve the goals (activities)• how people with groups interact collaboratively to get
the job done: interaction• what constraints the organization puts on what people
can do and how they should operate (the business rules)

What is a role? A set of activities that are generally carried out by an
individual or groups with some organizationally relevant responsibility
associated with the roles are the resources required for performing that role, such as files, desks, tools and skills
each role in a process behaves independently, with its own set of resources and coordinates with other roles as necessary, via interactions. The role is separated from the people who act it.
For example,the project manager role, Chief Accountant role

What is a process goal?
Vertical line to define the point in the process where the
goal can be said to have been achieved the notion of goal is a special case of the
more fundamental concept of state. A goal may be thought of as a state or combination of states that the process is trying to get to
interesting goals are labeled
What is an activity?
A black box , with a state line above it (pre-state that the role must reach for the activity to start) and a line below it (post-state is reached on completion of activity)
The notion of pre-state and post-state allows us to define a sequence of activities precisely.

Interaction between roles
I pass you some info I delegate a task to you We agree on an action You pass me the result of your
work I wait for you to do something
Interaction between roles
Each role box has pre-state and post-state lines attached
The interaction takes place when both roles are in their respective pre-states and finishes with both roles simultaneously entering their post-states. That is, interaction is simply a point of synchronization between roles.
An interaction often involves a transfer of some object (an expense claim, good or services) from one role to another. But it may also not involve the transfer of anything (e.g. just meet to agree on something)

Business Rules
The concepts of role, goal, activity and interaction are represented directly in RAD
The business rules show up as the pattern of sequencing, decision making, and concurrent activity that binds them all together
Events: Indicates places processes start Example
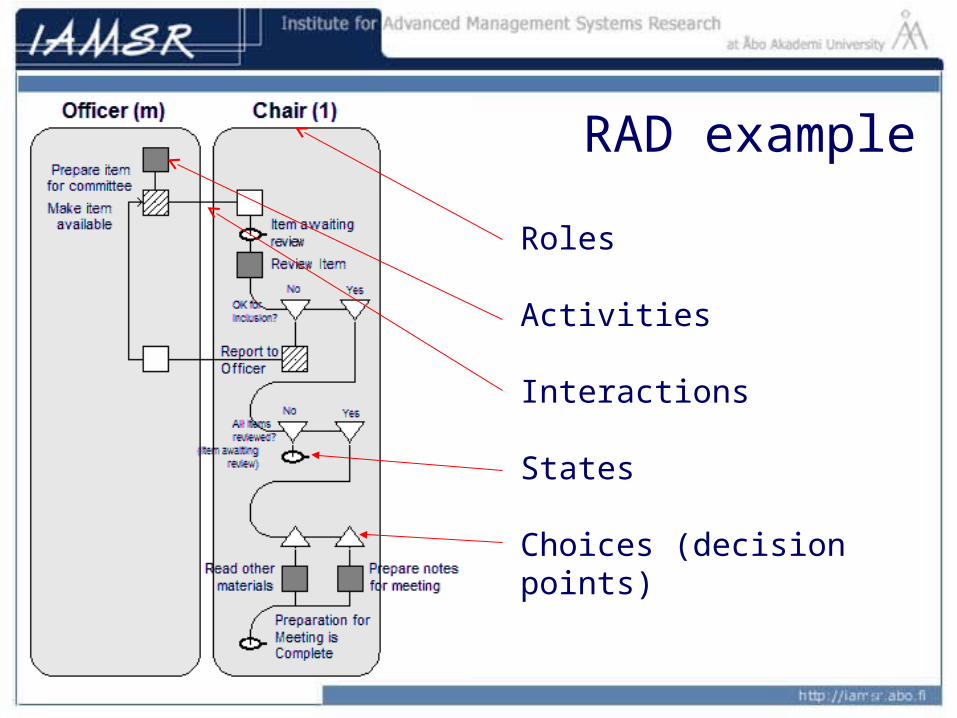
RAD example
Roles
Activities
Interactions
States
Choices (decision points)

RAD
To know more about RAD:– A guide to Role Activity Diagrams, available
at: http://www.sprint.gov.uk/pages.asp?id=77
