business process engineering - qut · business process management: theory on progression and...
TRANSCRIPT
Business Process Management:
Theory on Progression and Maturity
Tonia de Bruin
MIT, BBus (Acc), BBus (Mgmt), CPA
Thesis submitted to the School of Information Technology in the Faculty of
Science and Technology in partial fulfilment of the requirements for the
degree of
Doctor of Philosophy
at
Queensland University of Technology
Brisbane 2009


- i -
Dedication
I would like to dedicate this thesis to my two beautiful children.
Hannah and Zach
You give me hope and perspective, direction and light. I hope that throughout your
lives you are as fortunate as I am in the family, friends and opportunities I have. I
hope that you combine a sense of loyalty, compassion and morality with an innate
curiosity and courage that will see your lives filled with much love, laughter,
adventure and new experiences. Most of all, I hope that I am as inspirational to
you as you are to me. Always remember…
Mummy loves you big ones!


Business Process Management: Progression and Maturity
- iii -
Abstract
Business Process Management (BPM) is a topic that continues to grow in
significance as organisations seek to gain and sustain competitive advantage in an
increasingly global environment. Despite anecdotal evidence of organisations
improving performance by pursuing a BPM approach, there is little theory that
explains and substantiates this relationship. This study provides the first theory on
the progression and maturity of BPM Initiatives within organisations and provides a
vital starting block upon which future research in this area can build.
The Researcher starts by clearly defining three key terms (BPM Initiative, BPM
Progression and BPM Maturity), showing the relationship between these three
concepts and proposing their relationship with Organisational Performance. The
Researcher then combines extant literature and use of the Delphi Technique and
the case study method to explore the progression and measurement of the BPM
Initiatives within organisations. The study builds upon the principles of general
theories including the Punctuated Equilibrium Model and Dynamic Capabilities to
present theory on BPM Progression and BPM Maturity.
Using the BPM Capability Framework developed through an international Delphi
study series, the Researcher shows how the specific organisational context
influences which capability areas an organisation chooses to progress. By
comparing five separate organisations over an extended time the Researcher is
able to show that, despite this disparity, there is some evidence of consistency with
regard to the capability areas progressed. This suggests that subsequent
identification of progression paths may be possible. The study also shows that the
approach and scope taken to BPM within each organisation is a likely predictor of
such paths. These outcomes result in the proposal of a formative model for
measuring BPM Maturity.
Key Words
Business process management, progression, maturity, progression theory,
punctuated equilibrium, dynamic capabilities


Business Process Management: Progression and Maturity
- v -
Table of Contents
1 Introduction....................................................................................... 1:1
1.1 Problem Statement .....................................................................................1:3
1.1.1 Lack of a Theoretical Base 1:3
1.1.2 Aims of this Study 1:6
1.1.3 Chapter Overview 1:6
1.2 Key Definitions ............................................................................................1:7
1.2.1 Defining Organisational Level BPM 1:8
1.2.2 Defining BPM and BPM Initiative 1:9
1.2.3 Defining BPM Progression and BPM Maturity 1:12
1.3 Research Questions ................................................................................. 1:14
1.4 Research Plan........................................................................................... 1:15
1.4.1 Thesis Structure 1:16
1.5 Research Contributions ........................................................................... 1:18
1.5.1 Publications 1:18
1.5.2 Practical Applications and Contributions 1:20
1.5.3 Practical Contributions 1:22
1.6 Chapter Summary .................................................................................... 1:24
2 Research Design ............................................................................ 2:25
2.1 Chapter Overview .................................................................................... 2:25
2.2 Positioning the Study ............................................................................... 2:26
2.2.1 Domain Positioning 2:26
2.2.2 Theoretical Positioning 2:27
2.2.3 Philosophical Positioning 2:31
2.3 Research Strategy .................................................................................... 2:34
2.4 Methods: Selection and Application ....................................................... 2:36
2.4.1 Case Studies 2:41
2.4.2 Survey 2:51
2.5 Data: Validity and Reliability ................................................................... 2:57
2.6 Chapter Summary .................................................................................... 2:61
3 Literature Review ............................................................................ 3:65
- vi -
3.1 Chapter Outline ........................................................................................ 3:65
3.2 BPM Terminology ..................................................................................... 3:66
3.2.1 Definitions of Process 3:66
3.2.2 Classification of Processes 3:67
3.2.3 Definitions of Business Process Management 3:71
3.3 Developing an Initial Conceptual Model .................................................. 3:76
3.3.1 Identification of Factors 3:76
3.4 Operationalising the Conceptual Model .................................................. 3:82
3.4.1 Identifying Perspectives 3:82
3.5 Measuring BPM Maturity ......................................................................... 3:84
3.5.1 Measuring Maturity in the BPM Domain 3:85
3.5.2 Maturity Models in the BPM Domain 3:89
3.5.3 Evaluating Measurement Models 3:101
3.6 Chapter Summary ................................................................................... 3:104
4 Conceptual Model Refinement ..................................................... 4:105
4.1 Chapter Overview ................................................................................... 4:105
4.2 Case Study Design .................................................................................. 4:106
4.2.1 Unit of Analysis 4:106
4.2.2 Case Selection 4:106
4.2.3 Data Collection Instruments 4:107
4.3 Conduct of the Case Studies ................................................................... 4:109
4.3.1 Case Study: Company A 4:110
4.3.2 Case Study: Company B 4:113
4.3.3 Summarising BPM Initiatives in Company A and B 4:115
4.4 Refining the Conceptual Model .............................................................. 4:115
4.4.1 Performance 4:116
4.4.2 Accountability 4:120
4.4.3 Methodology 4:125
4.4.4 Information Technology 4:130
4.4.5 Culture 4:135
4.4.6 Role of Context 4:141
4.5 Consequence of the Case Studies .......................................................... 4:146
4.5.1 Model Extension 4:146

Business Process Management: Progression and Maturity
- vii -
4.5.2 Terminology Issues 4:148
4.6 Next Steps .............................................................................................. 4:150
4.7 Chapter Summary .................................................................................. 4:150
5 Delphi Studies ............................................................................... 5:153
5.1 Chapter Overview .................................................................................. 5:153
5.2 Delphi Study Plan ................................................................................... 5:154
5.2.1 Determine the Delphi Study Questions 5:155
5.2.2 Determine the Approach 5:155
5.2.3 Initial Plan for the Delphi Studies 5:158
5.2.4 Determining Experts 5:159
5.2.5 Inviting Potential Participants 5:162
5.2.6 Conducting the Pilot Study 5:163
5.2.7 Revising the Plan 5:164
5.3 Conducting the Delphi Studies .............................................................. 5:166
5.3.1 Data Collection 5:167
5.3.2 Data Analysis 5:168
5.4 Delphi Study Outcomes ......................................................................... 5:170
5.4.1 Participation 5:170
5.4.2 Definitions 5:171
5.4.3 Capability Areas 5:172
5.5 Discussion and Next Steps ..................................................................... 5:174
5.6 Chapter Summary .................................................................................. 5:175
6 Exploratory Case Study ............................................................... 6:177
6.1 Chapter Overview .................................................................................. 6:177
6.2 Case Study Design .................................................................................. 6:178
6.2.1 Unit of Analysis 6:178
6.2.2 Case Selection 6:178
6.2.3 Data Collection Instruments 6:179
6.3 Data Collection ...................................................................................... 6:184
6.4 Company M’s BPM Initiative ................................................................. 6:189
6.4.1 Commencing the BPM Initiative 6:190
6.4.2 BPM Projects and their Drivers 6:191
6.4.3 Benefits from the BPM Initiative 6:196

- viii -
6.4.4 Challenges to BPM Progression 6:197
6.4.5 The Role of One-Company M 6:199
6.4.6 The Influence of Company P 6:200
6.5 Testing the Extended Conceptual Model ............................................... 6:202
6.5.1 Overview of Factors 6:203
6.5.2 Overview of Capability Areas 6:204
6.6 Outcomes and Next Steps ...................................................................... 6:206
6.6.1 Next Steps 6:207
6.7 Chapter Summary ................................................................................... 6:208
7 Longitudinal Case Studies ........................................................... 7:213
7.1 Chapter Overview ................................................................................... 7:214
7.2 Multiple Case Study Design .................................................................... 7:214
7.2.1 Approach to Sampling 7:215
7.2.2 Change in Emphasis 7:217
7.2.3 Case Selection 7:218
7.3 Data Collection Instruments ................................................................... 7:220
7.3.1 Interview Guide 7:220
7.3.2 BPM Evolution Survey 7:220
7.3.3 Workshop Agenda 7:222
7.3.4 Document Review 7:223
7.4 Data Collection ....................................................................................... 7:223
7.4.1 Scheduling and Timing of Case Studies 7:224
7.4.2 Selecting and Inviting Participants 7:224
7.4.3 Approach to Data Collection 7:226
7.5 Measuring Change in the Capability areas ............................................. 7:228
7.6 Chapter Summary ................................................................................... 7:230
8 Within Case Analysis.................................................................... 8:233
8.1 Chapter Overview ................................................................................... 8:233
8.2 Case 1 – Company S ............................................................................... 8:233
8.2.1 Participants in Study 8:235
8.2.2 Demographics of the BPM Initiative 8:236
8.2.3 First Year of the BPM Initiative 8:237
8.2.4 Change from First to Last Year of the BPM Initiative 8:240

Business Process Management: Progression and Maturity
- ix -
8.2.5 Discussion on Progression of the BPM Initiative 8:243
8.2.6 Company S Summary 8:247
8.3 Case 2 – Company T ............................................................................... 8:248
8.3.1 Participants in Study 8:248
8.3.2 Demographics of the BPM Initiative 8:249
8.3.3 First Year of the BPM Initiative 8:251
8.3.4 Change from First to Last Year of the BPM Initiative 8:253
8.3.5 Discussion on Progression of the BPM Initiative 8:256
8.3.6 Company T Summary 8:259
8.4 Case 3 – Company U .............................................................................. 8:260
8.4.1 Participants in Study 8:261
8.4.2 Demographics of the BPM Initiative 8:262
8.4.3 First Year of the BPM Initiative 8:264
8.4.4 Change from First to Last Year of the BPM Initiative 8:267
8.4.5 Discussion on Progression of the BPM Initiative 8:270
8.4.6 Company U Summary 8:273
8.5 Case 4 – Company V .............................................................................. 8:274
8.5.1 Participants in Study 8:275
8.5.2 Demographics of the BPM Initiative 8:276
8.5.3 First Year of the BPM Initiative 8:277
8.5.4 Change from First to Last Year of the BPM Initiative 8:280
8.5.5 Discussion on Progression of the BPM Initiative 8:283
8.5.6 Company V Summary 8:285
8.6 Case 5 – Company W ............................................................................. 8:286
8.6.1 Participants in Study 8:286
8.6.2 Demographics of the BPM Initiative 8:288
8.6.3 First Year of the BPM Initiative 8:289
8.6.4 Change from First to Last Year of the BPM Initiative 8:292
8.6.5 Discussion on Progression of the BPM Initiative 8:295
8.6.6 Company W Summary 8:298
8.7 Chapter Summary .................................................................................. 8:298
9 Comparative Case Analysis ......................................................... 9:301
9.1 Chapter Overview .................................................................................. 9:301
9.2 Summary of Cases.................................................................................. 9:302

- x -
9.3 First Year Emphasis on Capability Areas ................................................ 9:305
9.3.1 Capability Areas in the Top Quartile 9:306
9.3.2 Capability Areas in the Bottom Quartile 9:311
9.3.3 Discussion of First Year 9:317
9.4 Last Year – Emphasis on Capability areas .............................................. 9:321
9.4.1 Capability Areas in the Top Quartile 9:322
9.4.2 Capability Areas in the Bottom Quartile 9:327
9.4.3 Discussion of Last Year Emphasis 9:333
9.5 Change in Emphasis on Capability areas ................................................ 9:336
9.5.1 Capability Areas with Greatest Change in Emphasis 9:336
9.5.2 Capability areas with the Least Change in Emphasis 9:340
9.6 Discussion on Key Themes ..................................................................... 9:343
9.6.1 Structure of the BPM Initiative 9:343
9.6.2 Factors and Capability areas 9:348
9.7 Chapter Summary ................................................................................... 9:350
10 Theory Building .......................................................................... 10:351
10.1 Chapter Overview ................................................................................. 10:351
10.2 Classification of Theory ........................................................................ 10:352
10.2.1 Types of Theory 10:352
10.2.2 Theory Supported by this Study 10:353
10.3 Theory for Analysing............................................................................. 10:353
10.3.1 The BPM Capability Framework 10:354
10.3.2 Typology of BPM Initiatives 10:356
10.4 Theory for Explaining............................................................................ 10:360
10.4.1 Explanatory Theory of BPM Progression 10:361
10.4.2 Conjectures from the Theory of BPM Progression 10:363
10.5 Classification of Explanatory Theory .................................................... 10:366
10.6 Theory for Explaining and Predicting ................................................... 10:374
10.6.1 A BPM Maturity Measurement Model 10:375
10.7 Classification of EP Theory ................................................................... 10:378
10.7.1 Multi-Dimensional Constructs 10:378
10.7.2 Reflective –v– Formative Models 10:379
10.7.3 Choosing between Reflective and Formative Models 10:380
Business Process Management: Progression and Maturity
- xi -
10.8 Chapter Summary ................................................................................ 10:387
11 Research Contributions, Limitations & Outlook ....................... 11:389
11.1 Chapter Overview ................................................................................ 11:389
11.2 Reiterating the Study Questions .......................................................... 11:390
11.2.1 Answering the Study Questions 11:391
11.3 Research Contributions ....................................................................... 11:395
11.3.1 Theoretical Implications 11:395
11.3.2 Practical Implications 11:399
11.4 Research Limitations ............................................................................ 11:401
11.4.1 Selection Issues 11:401
11.4.2 Data Bias 11:403
11.4.3 Starting Points 11:403
11.4.4 Future Theory Testing Implications 11:404
11.4.5 Researcher Ability 11:405
11.5 Research Outlook................................................................................. 11:406
11.5.1 Recognising Dynamic Capabilities 11:406
11.5.2 Paradigmatic Research 11:407
11.5.3 BPM Success, Process Success and Organisational Performance11:408
11.5.4 Change and Relationship Research 11:409
11.5.5 Measures for Capability Areas 11:409
11.6 Chapter Summary ................................................................................ 11:409
12 Bibliography ................................................................................ 12:411
13 Appendices ................................................................................. 13:433
13.1 Multiple Case Study Supporting Documentation (1) ........................... 13:435
13.1.1 Invitation to Participate 13:435
13.1.2 Information Sheet and Informed Consent 13:441
13.1.3 Interview Guide: Performance 13:447
13.1.4 Establishment Survey: Completed by Company B 13:449
13.1.5 Feedback Survey 13:455
13.1.6 Maturity Survey Questions: Culture Factor 13:457
13.1.7 Write up of Interview Notes: Company A 13:463
13.2 Delphi Study Supporting Documentation ............................................ 13:477
13.2.1 Email Invitation Sent to Prospective Participants 13:477

- xii -
13.2.2 Proposal Sent to Prospective Participants 13:479
13.2.3 Confirmation Email Sent to Participants 13:485
13.2.4 Report to Panel Following Pilot 13:487
13.2.5 Diary Note: Pilot Study 13:493
13.2.6 Delphi Study Structure Following Pilot Study 13:497
13.2.7 Email to Panel Member for Round 13:501
13.2.8 Follow-up Emails Sent to Participants 13:503
13.2.9 Summary of Responses from Delphi Study Round 13:505
13.2.10 Coding From Delphi Study Round 13:509
13.2.11 Round Report to Panel: Completed by Expert 13:511
13.2.12 Strategic Alignment Delphi Study 13:519
13.2.13 Governance Delphi Study 13:527
13.2.14 Methods Delphi Study 13:533
13.2.15 Information Technology Delphi Study 13:541
13.2.16 People Delphi Study 13:549
13.2.17 Culture Delphi Study 13:557
13.2.18 Final Executive Summary: Table of Contents 13:563
13.2.19 Final Series Summary: Table of Contents & Appendix 13:565
13.2.20 Mapping of Original Items to Capability Areas 13:569
13.3 Exploratory Case Study Supporting Documentation ............................ 13:585
13.3.1 Testing the Extended Conceptual Model 13:585
13.3.2 Information Sheet and Informed Consent 13:625
13.3.3 Interview Guide 13:633
13.3.4 Workshop Guide: Strategic Alignment 13:643
13.3.5 Background Survey 13:647
13.3.6 Background Survey: Governance Participants 13:649
13.3.7 Changes to Maturity Survey Scales 13:655
13.3.8 Maturity Survey: Sample Screen Shots 13:657
13.3.9 Instructions for Maturity Survey 13:659
13.3.10 Final Report: Executive Summary & Contents 13:661
13.3.11 Categorisation of Past Challenges 13:673
13.3.12 Categorisation of Future Challenges 13:677
13.4 Longitudinal Case Study Supporting Documentation .......................... 13:681
13.4.1 Expression of Interest in BPM Evolution Case Studies 13:681
13.4.2 Information Sheet and Informed Consent 13:683
13.4.3 Interview Guide 13:691

Business Process Management: Progression and Maturity
- xiii -
13.4.4 BPM Evolution Survey 13:693
13.4.5 Workshop Agenda 13:713
13.4.6 Mapping Activities to Factors: Company S & U 13:715
13.4.7 BPM Capability Area Overview 13:721
13.4.8 BPM Capability Areas: Key Practices (Sample) 13:733
13.4.9 BPM Case Study Report 13:743

Business Process Management: Progression and Maturity
- xv -
Table of Figures
Figure 1: Positioning BPM Progression, Maturity and Success ....................... 1:13
Figure 2: Study Questions: Managerial, Research and Investigative ............... 1:14
Figure 3: Application within Australian Bank .................................................... 1:21
Figure 4: Application within Australian Transport Company ............................. 1:21
Figure 5: The Metaparadigm Perspective ........................................................ 2:33
Figure 6: The Organisation-Environment Relationship .................................... 2:40
Figure 7: Research Design .............................................................................. 2:44
Figure 8: Process Hierarchy ............................................................................ 3:68
Figure 9: Initial Conceptual Model ................................................................... 3:76
Figure 10: Plan for Operationalising the Conceptual Model ............................. 3:84
Figure 11: Model for Rating a Process' Condition ............................................ 3:90
Figure 12: The Five Levels of CMM ................................................................. 3:94
Figure 13: The European Foundation for Quality Management Model ............. 3:96
Figure 14: Fisher's Five Levers of Change ...................................................... 3:98
Figure 15: Five Levers of Change combined with Five Maturity Stages ........... 3:99
Figure 16: Kiraka and Manning‟s Theoretical Model ...................................... 3:100
Figure 17: Company A – Business Process Model ........................................ 4:112
Figure 18: Refined Conceptual Model ........................................................... 4:146
Figure 19: Planning for the Delphi Studies .................................................... 5:154
Figure 20: Delphi Group Size – Error and Reliability ..................................... 5:160
Figure 21: Revised Delphi Study Plan ........................................................... 5:166
Figure 22: Final Satisfaction Ratings for Definitions ...................................... 5:172
Figure 23: Rating of the Final List of Items for each Factor ........................... 5:173
Figure 24: BPM Capability Framework .......................................................... 5:173
Figure 25: Company M Sites ......................................................................... 6:179
Figure 26: Calculation of Maturity Scores ...................................................... 6:182
Figure 27: Company M Vision for BPM and Cost Reduction.......................... 6:190
Figure 28: Company M‟s Approach to Safety ................................................ 6:191
Figure 29: Selected BPM Projects per Factor ................................................ 6:193
Figure 30: Maturity Scores per Factor ........................................................... 6:203
Figure 31: Capability Area Results – Company M ......................................... 6:204
Figure 32: Elements in a BPM Initiative ......................................................... 6:206

- xvi -
Figure 33: Geographical Dispersion of Company S ....................................... 8:234
Figure 34: Company S – Emphasis during First Year (2005) ......................... 8:238
Figure 35: Company S – Emphasis during Last Year (2007) ......................... 8:240
Figure 36: Company S – Change in Emphasis on Capability Areas .............. 8:242
Figure 37: Company T – Emphasis during First Year (2000) ......................... 8:252
Figure 38: Company T – Emphasis during Last Year (2007) ......................... 8:253
Figure 39: Company T – Change in Emphasis on Capability Areas ............... 8:256
Figure 40: Company U – Emphasis during First Year (2003) ......................... 8:265
Figure 41: Company U – Emphasis during Last Year (2007) ......................... 8:267
Figure 42: Company U – Change in Emphasis on Capability Areas .............. 8:269
Figure 43: Company V – Emphasis during First Year (2005) ......................... 8:278
Figure 44: Company V – Emphasis during Last Year (2007) ......................... 8:280
Figure 45: Company V – Change in Emphasis on Capability Areas .............. 8:281
Figure 46: Company W – Emphasis during First Year (2005) ........................ 8:290
Figure 47: Company W – Emphasis during Last Year (2007) ........................ 8:292
Figure 48: Company W – Change in Emphasis on Capability Areas ............. 8:295
Figure 49: BPM Capability Framework ........................................................ 10:355
Figure 50: Typology for BPM Initiatives ....................................................... 10:358
Figure 51: Example – Variability across Capability Areas (Company U) ...... 10:370
Figure 52: Example – Change in Capability Areas (Company V) ................. 10:371
Figure 53: Example – Last Year Emphasis for Selected Companies ........... 10:373
Figure 54: Proposed EP Theory for BPM Maturity ....................................... 10:376
Figure 55: Example – Change in Factors (Company U) .............................. 10:382
Figure 56: Example – Change in Capability Areas (Company U) ................. 10:382
Figure 57: Example – Change in Factors from First Year to Last Year ........ 10:384
Figure 58: Example – Change in Capability Areas (Company U & Company V) .................................................................................................. 10:385
Figure 59: The Study Questions: Managerial, Research and Investigative .. 11:390
Figure 60: Strategic Alignment Definition – Responses per Rating .............. 13:520
Figure 61: Strategic Alignment Definition – Average & Standard Deviation . 13:520
Figure 62: Strategic Alignment Capability Areas – Average & Std Dev ........ 13:525
Figure 63: Governance Definition – Responses per Rating ......................... 13:527
Figure 64: Governance Definition – Average & Standard Deviation ............. 13:528
Figure 65: Governance Capability Areas – Rating per Response ................ 13:530
Figure 66: Governance Capability Areas – Average & Standard Deviation .. 13:531
Figure 67: Governance Capability Areas – Perceived Importance ............... 13:531
Business Process Management: Progression and Maturity
- xvii -
Figure 68: Methods Definition – Responses per Rating ............................... 13:533
Figure 69: Methods Definition – Average and Standard Deviation ............... 13:534
Figure 70: Methods Capability Areas – Responses per Rating .................... 13:537
Figure 71: Methods Capability Areas – Average & Standard Deviation ....... 13:537
Figure 72: Methods Capability Areas – Perceived Importance .................... 13:538
Figure 73: Information Technology Definition – Responses per Rating ....... 13:542
Figure 74: IT Definition – Average and Standard Deviation ......................... 13:542
Figure 75: IT Capability Areas – Responses per Rating .............................. 13:545
Figure 76: IT Capability Area – Average and Standard Deviation ................ 13:546
Figure 77: IT Capability Area – Perceived Importance ................................. 13:546
Figure 78: People Definition – Responses per Rating ................................. 13:549
Figure 79: People Definition – Average and Standard Definition ................. 13:550
Figure 80: People Capability Areas – Response per Rating ........................ 13:552
Figure 81: People Capability Areas – Average and Standard Deviation ...... 13:553
Figure 82: People Capability Areas – Perceived Importance ....................... 13:553
Figure 83: Culture Definition – Responses per Rating ................................. 13:557
Figure 84: Culture Definition – Average and Standard Deviation ................. 13:558
Figure 85: Culture Capability Areas – Responses per Rating ...................... 13:559
Figure 86: Culture Capability Areas – Average & Standard Deviation ......... 13:560
Figure 87: Culture Capability Areas – Perceived Importance ....................... 13:560
Figure 88: Example: Strategy Map Usage ................................................... 13:587
Figure 89: Aligning Process Measures to Strategy ...................................... 13:589
Figure 90: Linking Roles and Six Sigma ...................................................... 13:594
Figure 91: Linking Six Sigma and Lean ....................................................... 13:601
Figure 92: Training for Six Sigma ................................................................ 13:611
Figure 93: Linking Company M Vision with Key BPM Concepts .................. 13:618
Figure 94: Entry screen from BPMM On-line Assessment ........................... 13:657
Figure 95: Example from BPMM Operational Planning Survey .................... 13:657
Figure 96: Example from BPMM Operational Practice Survey ..................... 13:658
Figure 97: Conceptual BPM Maturity Model ................................................ 13:685
Figure 98: Major Activities Leading to BPMI Commencement ..................... 13:715
Figure 99: Company S – Major Activities during BPM Initiative ................... 13:716
Figure 100: Major Initiatives in BPM Initiative – Company U........................ 13:718


Business Process Management: Progression and Maturity
- xix -
Table of Tables
Table 1: Thesis Structure: Stage 1 Chapters ................................................... 1:17
Table 2: Thesis Structure: Stage 2 Chapters ................................................... 1:17
Table 3: Practical Contributions....................................................................... 1:23
Table 4: Purposes of Theory ........................................................................... 2:29
Table 5: Virtues Against Which to Judge Theory ............................................. 2:30
Table 6: Matching Research Design with Theory Building Activities ................ 2:37
Table 7: Contributions of Research Methods to Theory Building Research ..... 2:38
Table 8: Relative Strengths of Case Study and Survey Methods ..................... 2:39
Table 9: Research Methodologies ................................................................... 2:42
Table 10: Building Theory from Case Study .................................................... 2:50
Table 11: Application of the Delphi Method in Information Systems ................ 2:54
Table 12: Requirements of Exploratory Survey ............................................... 2:56
Table 13: Process Classification ..................................................................... 3:68
Table 14: Organizational Process Framework ................................................. 3:69
Table 15: Managerial Process Framework ...................................................... 3:69
Table 16: Framework for Action ...................................................................... 3:70
Table 17: Select Examples from Initial Mapping of the Performance Factor .... 3:77
Table 18: Select Examples from Initial Mapping of the Accountability Factor .. 3:78
Table 19: Select Examples from Initial Mapping of the Methodology Factor .... 3:79
Table 20: Select Examples from Initial Mapping of the IT Factor ..................... 3:80
Table 21: Select Examples from Initial Mapping of the Culture Factor ............. 3:81
Table 22: Initial Perspectives in Planning for Model Operationalisation ........... 3:83
Table 23: Select Examples of Maturity Models ................................................ 3:85
Table 24: Select Findings from Ittner and Larcker (1997) ................................ 3:89
Table 25: Hammer's Process Enablers and Enterprise Capabilities ................ 3:91
Table 26: Extract from Hammer's Enterprise Matrix ........................................ 3:92
Table 27: EFQM Fundamental Concepts ........................................................ 3:97
Table 28: Evaluating Models against Selected Criteria .................................. 3:103
Table 29: Company A – Key Organisational Dimensions .............................. 4:111
Table 30: Company A – Participants ............................................................. 4:112
Table 31: Company B – Key Organisational Dimensions .............................. 4:113
Table 32: Company B – Participants ............................................................. 4:114

- xx -
Table 33: Company A and Company B – Key BPM Dimensions ................... 4:115
Table 34: Company A and Company B – Combined Factor Relevance ........ 4:115
Table 35: Company A and Company B – Select Methods for Alignment ....... 4:119
Table 36: Company A and B – Methods used within the BPM Initiatives ....... 4:129
Table 37: Company A and Company B – IT used within the BPM Initiatives . 4:134
Table 38: Items Mapped to People Factor from the Initial Culture Factor ...... 4:140
Table 39: Initial Timeline for Conducting the Delphi Study Series ................. 5:158
Table 40: Initial Outline for Conducting a Study............................................. 5:159
Table 41: Invited Participants per Factor ....................................................... 5:163
Table 42: Capability Area Ratings from Pilot Study ....................................... 5:165
Table 43: Expert Panel - Invited and Completed ........................................... 5:170
Table 44: Sample Maturity Survey Questions ............................................... 6:183
Table 45: Company M – Participation in Data Collection ............................... 6:186
Table 46: Company M – Participant Details .................................................. 6:188
Table 47: Selected Major BPM Projects ........................................................ 6:192
Table 48: Major Affects of BPM ..................................................................... 6:196
Table 49: Major Challenges – Past and Future ............................................. 6:198
Table 50: Range in Maturity of Capability Areas ............................................ 6:205
Table 51: Summary of Company Demographics at time of Case Study ........ 7:219
Table 52: Conduct of Longitudinal Cases ...................................................... 7:224
Table 53: Summary of Participants for all Companies ................................... 7:226
Table 54: Alternative Methods of Measuring and Testing Change................. 7:230
Table 55: Company S – Company Demographics ......................................... 8:234
Table 56: Company S – Participant Details ................................................... 8:235
Table 57: Company S – BPM Initiative Details .............................................. 8:236
Table 58: Company S – First Year Range in Emphasis ................................. 8:238
Table 59: Company S – Last Year Range in Emphasis ................................. 8:241
Table 60: Company T – Company Demographics ......................................... 8:248
Table 61: Company T – Participant Details ................................................... 8:249
Table 62: Company T – BPM Initiative Details .............................................. 8:250
Table 63: Company T – First Year Range in Emphasis ................................. 8:252
Table 64: Company T – Last Year Range in Emphasis ................................. 8:255
Table 65: Company U – Company Demographics ........................................ 8:261
Table 66: Company U – Participant Details ................................................... 8:262
Table 67: Company U – BPM Initiative Details .............................................. 8:263

Business Process Management: Progression and Maturity
- xxi -
Table 68: Company U – First Year Range in Emphasis ................................ 8:266
Table 69: Company U – Last Year Range in Emphasis ................................. 8:268
Table 70: Company V – Company Demographics ......................................... 8:275
Table 71: Company V – Participant Details ................................................... 8:275
Table 72: Company V – BPM Initiative Details .............................................. 8:276
Table 73: Company V – First Year Range in Emphasis ................................. 8:279
Table 74: Company V – Last Year Range in Emphasis ................................. 8:281
Table 75: Company W – Company Demographics ........................................ 8:286
Table 76: Company W – Participant Details .................................................. 8:287
Table 77: Company W – BPM Initiative Details ............................................. 8:288
Table 78: Company W – First Year Range in Emphasis ................................ 8:290
Table 79: Company W – Last Year Range in Emphasis ................................ 8:293
Table 80: Summary of Company Demographics ........................................... 9:302
Table 81: Summary of BPM Initiative Demographics ..................................... 9:304
Table 82: First Year – Capability Areas in the Top Quartile ........................... 9:306
Table 83: First Year – Distribution of Capability Areas in the Top Quartile .... 9:307
Table 84: First Year – Strategic Alignment Top Quartile ................................ 9:308
Table 85: First Year – Governance Top Quartile ........................................... 9:309
Table 86: First Year – Methods Top Quartile ................................................. 9:309
Table 87: First Year – Information Technology Top Quartile ......................... 9:310
Table 88: First Year – People Top Quartile ................................................... 9:310
Table 89: First Year – Culture Top Quartile ................................................... 9:311
Table 90: First Year – Capability Areas in the Bottom Quartile ...................... 9:312
Table 91: First year – Distribution of Capability Areas in the Bottom Quartile 9:313
Table 92: First Year – Strategic Alignment Bottom Quartile ........................... 9:314
Table 93: First Year – Governance Bottom Quartile ...................................... 9:314
Table 94: First Year – Methods Bottom Quartile ............................................ 9:315
Table 95: First Year – Information Technology Bottom Quartile .................... 9:315
Table 96: First Year – People Bottom Quartile .............................................. 9:316
Table 97: First Year – Culture Bottom Quartile .............................................. 9:317
Table 98: Last Year – Capability Areas in the Top Quartile ........................... 9:322
Table 99: Last Year – Distribution of Capability Areas in the Top Quartile ..... 9:323
Table 100: Last Year – Strategic Alignment Top Quartile .............................. 9:324
Table 101: Last Year – Governance Top Quartile ......................................... 9:324
Table 102: Last Year – Methods Top Quartile ............................................... 9:325

- xxii -
Table 103: Last Year – Information Technology Top Quartile ........................ 9:326
Table 104: Last Year – People Top Quartile ................................................. 9:326
Table 105: Last Year – Culture Top Quartile ................................................. 9:327
Table 106: Last Year – Capability Areas in the Bottom Quartile .................... 9:328
Table 107: Last Year – Distribution of Capability Areas in the Bottom Quartile9:329
Table 108: Last Year – Strategic Alignment Bottom Quartile ......................... 9:330
Table 109: Last Year – Governance Bottom Quartile .................................... 9:330
Table 110: Last Year – Methods Bottom Quartile .......................................... 9:331
Table 111: Last Year – Information Technology Bottom Quartile .................. 9:332
Table 112: Last Year – People Bottom Quartile ............................................ 9:332
Table 113: Last Year – Culture Bottom Quartile ............................................ 9:333
Table 114: Change in Emphasis – Top Quartile ............................................ 9:337
Table 115: Distribution of Capability Areas in the Top Quartile ...................... 9:338
Table 116: Range in Change – Top Quartile ................................................. 9:338
Table 117: Variability between Companies – Top Quartile ............................ 9:339
Table 118: Change in Emphasis – Bottom Quartile ....................................... 9:341
Table 119: Distribution of Capability Areas in the Bottom Quartile................. 9:342
Table 120: Range in Change – Bottom Quartile ............................................ 9:342
Table 121: Capability areas not in Top Quartile ............................................. 9:349
Table 122: Capability areas not in the Bottom Quartile .................................. 9:350
Table 123: BPM Theory supported by this Study ........................................ 10:353
Table 124: The BPM Capability Framework as a Taxonomic Theory .......... 10:355
Table 125: Conjectures about BPM Progression ......................................... 10:365
Table 126: Description of Universalistic Theory ........................................... 10:366
Table 127: Description of Contingency Theory ............................................ 10:367
Table 128: Description of Life Cycle Theory ................................................ 10:368
Table 129: Description of Punctuated Equilibrium Theory ........................... 10:369
Table 130: Conjectures about BPM Maturity ............................................... 10:377
Table 131: Criteria for Reflective and Formative Models ............................. 10:381
Table 132: Strategic Alignment Expert Panel .............................................. 13:519
Table 133: Strategic Alignment Capability Area Modifications ..................... 13:525
Table 134: Governance Expert Panel ......................................................... 13:527
Table 135: Governance Capability Area Modifications ................................ 13:532
Table 136: Methods Expert Panel ............................................................... 13:533
Table 137: Information Technology Expert Panel ........................................ 13:541

Business Process Management: Progression and Maturity
- xxiii -
Table 138: People Expert Panel .................................................................. 13:549
Table 139: People Capability Area Modifications ........................................ 13:554
Table 140: Culture Expert Panel ................................................................. 13:557
Table 141: Culture Capability Area Modifications ........................................ 13:561
Table 142: Maturity Scores for Strategic Alignment Capability Areas .......... 13:585
Table 143: Maturity Scores for Governance Capability Areas ..................... 13:591
Table 144: Maturity Scores for Capability Areas .......................................... 13:599
Table 145: Summary of Existing Methods ................................................... 13:600
Table 146: Methods – Lessons Learned ..................................................... 13:602
Table 147: Maturity Scores for Information Technology Capability Areas .... 13:603
Table 148: Existing Information Technology ................................................ 13:605
Table 149: Maturity Scores for People Capability Areas .............................. 13:606
Table 150: Desirable Attributes of Process Leaders .................................... 13:614
Table 151: Maturity Scores for People Capability Areas .............................. 13:615
Table 152: Major Historical Challenges ....................................................... 13:675
Table 153: Major On-going Challenges ....................................................... 13:680


Business Process Management: Progression and Maturity
- xxv -
Statement of Original Authorship
I have not previously submitted the work contained in this thesis, Business
Process Management: Theory on Progression and Maturity to meet the
requirements for an award at this or any other higher education institution. To the
best of my knowledge and belief, the thesis contains no material previously
published or written by another person except where due reference is made.
________________________
Tonia de Bruin
October 2009


Business Process Management: Progression and Maturity
- xxvii -
Acknowledgements
Although completing a PhD is an intensely personal experience, none of us could
undertake the journey without a strong support network. Therefore, it is with great
pleasure that I take this opportunity to thank those many people instrumental in
helping me complete my journey.
First, my sincerest thanks to my principal supervisor Professor Michael Rosemann.
I first met Michael in 2003 when I was doing my Masters and toying with the idea of
undertaking research and further exploring an academic career. Since that time,
Michael has provided a constant source of inspiration, challenge and opportunity.
Those of us fortunate enough to know Michael also know his passion for process,
his dedication to QUT‟s BPM Research Group and his commitment to conducting
research that is both rigorous and relevant. Thanks Michael for the support,
guidance and friendship over the years – words cannot say enough. It has been a
privilege and an honour to work with you.
I would also like to acknowledge my deepest appreciation to my associate
supervisor Professor Glenn Stewart who was instrumental in getting my final thesis
to where it is today. In particular, Glenn‟s attention to detail and forthright
comments with regard to my writing style have helped me to make significant
improvements to my draft thesis. Glenn, thank you for helping me to produce a
thesis that I trust meets your requirements of „elegant and refined‟ and one of
which I am truly proud.
My sincere thanks to Professor Guy Gable for providing me with an initial reference
that enabled me to make the transition from a coursework Masters to a research
PhD. Guy, thanks for having faith in my research ability and for the support and
guidance during the early stages of my research when words like „paradigm‟,
„epistemology‟, „interpretist‟ and „positivist‟ where so completely confusing.
To QUT‟s BPM Research Group including our adjunct Professors and visiting
academics and students, a heartfelt thanks. I consider myself fortunate to have
been a member of such an illustrious group of individuals. To all of you, thanks for
your support and friendship over the years. In particular, thanks to Dr Jan Recker
and Dr Wasana Bandara for your friendship, guidance and support with regard to

- xxviii -
the many research questions I have sent your way and the many discussions we
have had over the years. Given the quality of your own theses, you have been
tough acts to follow. It has been an honour to work with such dedicated and
talented researchers. Thanks also to those of you who helped make the day-to-
day so enjoyable and for creating a fantastic working environment: Guy, Sander,
Stephan, Alfredo, Marcello, Alex, Sebastian, Stefan, Islay, Jess, Karen, Samia,
Christian, Mathias, Ross, Axel, Arthur and Kenneth. An extra special thanks to
Guy and Sander for taking on the onerous task of being my regular squash
buddies – thanks for giving me an avenue to vent, I miss our regular hit-outs. I
would also like to express my heartfelt appreciation to visiting students who
assisted me with the development of parts of this research. Olaf, Tapio and Ruhle,
your efforts are much appreciated.
A special thanks to Professor Peter Green and Dr Marta Indulska from University
of Queensland. Thank you both for making the time to provide me with additional
insights and comments with regard to my research. Marta, a special thanks for
your deep friendship, advice and guidance over the years. I could not have done it
without you. I will never forget being that „lovely couple from New Farm that likes
the duck soup‟ or our shared passion for cocktails!
My appreciation also to the numerous academics who have provided me with
guidance and advice during my journey, in particular, Michael zur Muehlen, Iris
Vessey and Hajo Reijers but also the anonymous reviewers of my articles over the
years. I am also deeply indebted to the two reviewers who made the time to
evaluate my thesis. The thesis is „on the long side‟ and I greatly appreciate the
attention to detail, valuable comments and timeliness of both reviewers.
To the companies and the individuals that participated in my research my sincerest
appreciation. It is impossible to undertake quality research that has a high
relevance to practice without the support of such organisations and individuals.
Despite the labour intensive research methods I used in this research, the
companies and individuals willingly gave their time and shared their knowledge,
experiences and insights, providing me with rich sources of data. I would also like
to thank members of the BPM industry groups that provided support and insight
into practical issues during my research. To all the members of the Australian

Business Process Management: Progression and Maturity
- xxix -
BPM Roundtable and the Queensland BPM Chapter a heartfelt thanks. In
particular, my deepest appreciation to Gaby Doebeli who not only takes on the role
of coordinating the BPM Chapter but who was also instrumental in this research
starting. Gaby, thank you for your friendship and support over the years. I have
enjoyed our discussions immensely and learned much from your practical insights
and honest opinions. I look forward to continuing our work in the future.
A special thanks to Jo, Helen, Dianha and Chris, Anne and Cheryl, and Belinda
and Danny who have helped my body keep up with my mind! I doubt I would have
made it through the last twelve months without your help and support. Thanks for
listening and providing me with a means of balancing the mental with the physical.
A special thanks to James and Mia, for helping me to see the lighter side of things
and reminding me of what is truly important in life. I will be forever in your debt. To
my other friends and neighbours who have helped keep me sane and assisted
Jeremy, Hannah and Zach a huge thanks. In particular, Tania and Rowan, Jane
and Chris, Claire and Greg, Dina and Frank, Carol-Ann and Geoff, Jane and John,
Tina and David, Kylie and Rob, your friendship and support over the years has
helped get us all through.
Thanks to my parents, David and Frances, and my (late) grandparents for
providing me with a life long love of learning and the opportunity to further my
education at a time when money was short and things where tough. To my
siblings, Colin, Jill and Melody and my cousins Dyane and Kevin and their families,
thanks for everything over the years. Thanks also to Rosemary for supporting us
over the last few years.
Finally, to those most affected and most important. I started this journey as a
means of having income and flexibility while my children were little. Hannah was
just over two and Zach was only three months old when I officially started my PhD
in 2005. Now Hannah is in Grade 1, Zach is soon to commence Prep and it
reminds me how long the journey has been. To my husband Jeremy and my two
gorgeous children Hannah and Zach, thank you for everything. Words cannot
express my appreciation for all that you have done and all that you have put up
with throughout this journey. Finally, it is done!


Business Process Management: Progression and Maturity
- 1:1 -
1 Introduction
usiness Process Management (BPM) first began emerging as a
discipline during the mid 1990‟s, following the introduction of
Hammer‟s (1993) business process reengineering and Davenport‟s
(1993) process innovation. A study undertaken by Pritchard and Armistead
(1999) found that 97% of European organisations surveyed considered BPM
important to the organisation and only 3% had not commenced BPM practices.
Similarly, Elzinga et al. (1995) found that 96% of respondents were engaged in
“some form of process management” with formal programs adopted by 68% of
these respondents. At the time, the interest in BPM arose from the:
Need to improve responsiveness and quality and, to manage competitive
threats (Pritchard & Armistead, 1999)
Globalization, changing technology, regulation, the action of stakeholders
and the eroding of business boundaries (Armistead, 1996)
Competitiveness of industry within the international marketplace (Elzinga
et al., 1995).
Since that time, investment and interest in improving and managing an
organisation‟s processes has continued. Harmon & Wolf (2008) found that 88%
of the organisations surveyed invested up to $5 million in their BPM Initiatives in
2006. Meanwhile, for the fifth year, Gartner (2009) identified process
improvement as the number one business priority of CIO‟s.
B
Chapter 1 – Introduction
- 1:2 -
According to Harmon & Wolf (2008, 15) the key drivers in BPM remain similar to
those identified by earlier researchers (e.g. Armistead, 1996; Elzinga et al., 1995;
Pritchard & Armistead, 1999) being to:
Remain competitive by improving products and/or customer satisfaction
Save money by improving productivity and/or reducing costs
Improve organisational responsiveness, management coordination and
management of IT resources.
Extant literature provides extensive support for the link between BPM and
competitiveness, customer satisfaction and change management.
Gulledge and Sommer (2002, 365) and Zairi (1997, 68) suggest that a process
approach to business increases competitive advantage by reducing cycle times,
utilising new information technologies and obtaining managerial control. More
generally, Hammer (2001, 4) suggests that a process focus helps to achieve
higher (sustainable) performance with strategies including reducing costs,
resources and/or overheads (Hammer, 2001; Zairi, 1997).
Adopting a process approach leads to increases in customer satisfaction and an
improved ability to respond to customer needs (Hammer, 2001; Pritchard and
Armistead, 1999; Zairi, 1997). It does this by improving an organisation‟s focus
on the customer (DeToro & McCabe, 1997; Zairi 1997) and introducing greater
flexibility (Hammer, 2001). Other customer benefits include a reduction in the
time to market and an improvement in service delivery (Gulledge & Sommer,
2002; Zairi 1997) and quality (Elzinga et al., 1995; Hammer, 2001; Zairi, 1997).
Furthermore, a process approach has a positive impact on change management
and cultural issues (DeToro & McCabe, 1997 Llewellyn & Armistead, 2000;
Pritchard & Armistead, 1999). Similarly, Lee and Dale (1998) indicate that BPM
practices can lead to a reduction in turf mentality and Zairi (1997) suggests that
improved teamwork is possible. There are also indications that increasing the
level of employee empowerment leads to a reduction in cross-functional barriers
(DeToro & McCabe, 1997).

Business Process Management: Progression and Maturity
- 1:3 -
1.1 Problem Statement
Despite high interest, strong drivers and the recognised benefits associated with
adopting a process management approach, there is evidence that progressing
BPM is difficult for organisations. Pritchard and Armistead (1999) indicate that,
despite 97% of organisations expressing a high interest in BPM, as few as 27%
of those surveyed were at more than a basic level of adoption. Hatten and
Rosenthal (1999) suggest that continuing evidence of organisations failing to
reap the benefits of their efforts will lead to the latest round of process thinking
becoming yet another management fad. More recently, Harmon & Wolf (2008)
found that 50% of those surveyed in 2007 considered themselves to be merely
exploring opportunities or as having only a limited initial investment in BPM, the
same percentage as in 2006.
In their study, Pritchard and Armistead (1999) identify a number of inhibitors to
the progression of BPM within organisations including:
Poor understanding of BPM concepts
Lack of consistency in BPM approaches within organisations
Long-term nature of developing a process perspective.
The inhibitors identified by Pritchard and Armistead (1999) indicate disconnect
between theory and practice, providing support for the notion that a theoretical
core is missing from the BPM domain, with respect to the adoption of
organisational level BPM Initiatives.
1.1.1 Lack of a Theoretical Base
Since the late 1980's and 1990‟s, there has been growing research into the
managerial, improvement and organisational aspects of process (Davenport,
1993; Hammer & Champy, 1993; Lee & Dale, 1998; Melan, 1989; Pritchard &
Armistead, 1999). In line with the views of managerial researchers (Adler, 1983;
Parkhe, 1993), this positions process management as an emerging domain that
is at a pre-paradigmatic stage of development. According to Parkher (1993, 227)
domains at this stage:

Chapter 1 – Introduction
- 1:4 -
“…lack a strong theoretical core or an encompassing framework that
effectively integrates past research and serves as a springboard for
launching future research…”
With regard to this, a number of researchers have articulated principles, key
steps or lessons learned when implementing BPM practices.
In expanding his approach, Zairi (1997, 79) developed a number of governing
rules including:
Proper mapping and documentation of major process activities
A focus on customers
A reliance on systems and documentation to ensure consistency
Discipline and repeatability of quality performance
Measurement and assessment of performance of processes to meet
targets set for delivery of output levels in line with corporate objectives
Achievement of extra benefits through a base of continual improvement
achieved and problem solving
Achievement of superior competitiveness by aspiring to best practice
and not relying on just having good systems and the right structure but
also the adoption of a change culture.
Similarly, Pritchard and Armistead (1999, 19-21) identified a number of lessons
learned including:
Link BPM into strategic programs
Ensure clarity of BPM approach
Address style and context within BPM
Allow time to acquire a process perspective
Achieve focus
Integrate top level BPM strategy with team level activity
Acquire new process competencies
Business Process Management: Progression and Maturity
- 1:5 -
Consider the impact of BPM strategy at team and task level
Train around business processes
Build a knowledge base around processes.
In addition, Armistead (1996, 49-50) identified 10 principles for managing
processes including:
Designate a process champion
Know the process
Understand the linkages
Work on the trade-offs
Teach others about the process
Train within the process
Measure the process
Manage careers
Build specialist expertise
Improve the process.
According to Anderson et al. (1994), such lists, whilst potentially useful and
comprehensive, do not represent theory. In their review of the Deming
Management method, Anderson et al. (1994) argue that a similar listing of
Deming‟s 14 principles of TQM represented:
“…principles of transformation for improving the practice of
management (…) a complex, prescriptive set of interrelated rules of
inter- and intraorganizational behaviour, codified and communicated
in the linguistic form of commands. Although they certainly do
suggest and advocate a number of concepts, they, themselves, are
not concepts, the building blocks of theory (Chafetz, 1978: 45)…”
The Researcher agrees with Anderson et al. (1994) and contends that lists such
as those proposed by Armistead (1996), Pritchard and Armistead (1999) and
Chapter 1 – Introduction
- 1:6 -
Zairi (1997) are not theory but rather provide guidance for the development of
theory. Whilst Chapter 2 provides a deeper discussion on theory and theory
building, a principal reason for this argument is the lack of clearly defined
constructs and their relationships. According to Gregor (2006, 613), the
significance of theory to research and practice is that:
“...Theories are practical because they allow knowledge to be
accumulated in a systematic manner and this accumulated
knowledge enlightens professional practice...”
Hung (2006) presents one of the first attempts of organisational level, BPM
theory, defining constructs of People Involvement and Process Alignment and
testing their relationship with Organisational Performance. This study is
significant as it provides validation of the link between BPM and Organisational
Performance. The study does not assist organisations in knowing how to
progress BPM endeavours or how to measure such progression however.
1.1.2 Aims of this Study
Consequently, this study aims to make both a theoretical and a practical
contribution to the BPM body of knowledge and the sustainability of BPM
practice. Specifically the study will focus on organisations adopting BPM with a
view to building theory on the progression of BPM Initiatives. Furthermore, the
study will investigate how organisations might measure such progress to enable
greater understanding of the link between the BPM Progression and
organisational performance.
1.1.3 Chapter Overview
The structure of this Chapter is as follows. Section 2 positions the research,
providing clarification and definition of important terms within this study. Section
3 presents the research questions that aim to address the development of BPM
theory. Section 4 discusses the high-level research plan including the use of a
multi-paradigmatic approach. Section 5 summarises the research contributions
including the publications and the practical application of a number of the
research outcomes. Section 6 provides a summary of the chapter.
Business Process Management: Progression and Maturity
- 1:7 -
1.2 Key Definitions
The inhibitors identified by Pritchard and Armistead (1999) highlight an aspect of
emerging domains – this being the lack of common language and inconsistent
use of terminology. Within the BPM domain, there is further evidence of this
shortcoming.
On the one hand, there are multiple terms used to denote variations of practice
such as business process (re)engineering (BPR and BPE), business process
innovation (BPI) and business process management (BPM). These terms each
present slightly differing views. Hammer and Champy (1993) present BPR as a
means of achieving significant process change, often making use of technology
to automate processes. Davenport (1993) indicates that BPI looks to integrate
BPR and total quality management (TQM) to avoid potential confusion within
organisations. At an organisational level, Pritchard and Armistead (1999) present
BPM as an approach to organisational management that, if done well, has the
potential to provide organisations with significant competitive advantage.
Arguably, the distinction between the terms is not always clear and consequently,
the use of these terms is not always consistent with the original intent.
On the other hand, a single term can have more than one meaning. Business
Process Management (BPM) is an example of this. As indicated above, to
Pritchard and Armistead (1999), BPM represents an organisational management
approach, whereas, for McDaniel (2001) BPM takes a more restrictive
interpretation denoting a piece of technology. In their work looking at process
management maturity, Curtis and Alden (2006) use the term BPM to refer to the
management or improvement of discrete processes whilst McCormack (2001)
uses the term to refer to the level of process orientation within a business1.
Inconsistent use of terminology or a lack of a common language presents a
number of issues for research in an emerging domain. First, it makes comparing
and contrasting extant literature more complex as the exact meaning of a term,
as used within an article, may be open to interpretation. Second, it makes using
1 The literature review in Chapter 3 provides further insights into variation in BPM terminology.
Chapter 1 – Introduction
- 1:8 -
some methods (e.g. surveys) potentially less suitable. This is because it
becomes increasingly difficult to ensure that the interpretation of questions is
consistent with the researcher‟s intent as opposed to the participants own
personal interpretation. Consequently, there is the possibility of a reduction in
the reliability and validity of data and subsequently spurious findings from the
research are possible. Third, there is likely to be a lack of common constructs
upon which to build theory.
Furthermore, anecdotal evidence suggests that ambiguity in terms may reduce
the acceptability of a term to practitioners. For example, anecdotal evidence
indicates that past endeavours (such as BPR) have been so closely tied to staff
reductions, or have failed so significantly in some organisations, that there is now
a reluctance to use a related term such as BPM, even when what the
organisation is doing has all the hallmarks of BPM. Instead, organisations use
terms such as organisational transformation, business transformation, work
productivity improvement and other similar names to denote their process-based
approaches. This potentially compromises the ability of researchers to gather
comparable data.
To provide clarity for this study and its outcomes, the next section defines key
terms that the Researcher developed and applied during this study.
1.2.1 Defining Organisational Level BPM
First, it is necessary to define the level of this study. In doing so, the Researcher
positions the study with regard to the unit of analysis and clearly distinguishes the
study from existing research.
The aims of achieving competitive advantage, increasing globalisation and
competitiveness suggest that an organisational level study of BPM is appropriate.
Strategic management proponents such as Teece et al. (1997, 518) support such
a notion, indicating the:
“…competitive advantage of firms lies with its managerial and
organizational processes, shaped by its (specific) asset position, and
the paths available to it…”

Business Process Management: Progression and Maturity
- 1:9 -
To this end, the study will investigate organisations that have implemented (or
are implementing) BPM principles within an organisational approach to process
management. As such, this study distinguishes from those that focus on:
Process improvement projects or programs (Box & Platts, 2005; Maull
et al. 2003)
Implementation of process aware technologies or solutions (Dumas et
al., 2005)
Discrete aspects of BPM such as process modelling (Bandara et al.,
2005) or the use of process methods (Ittner & Larcker, 1997).
1.2.2 Defining BPM and BPM Initiative
The inconsistency in terminology requires further clarification due to the possible
multiple interpretations and use of the term BPM2. In earlier discussion, there
were two interpretations of BPM as a management approach. Pritchard and
Armistead (1999) indicate that BPM represents an approach to managing the
organisation, challenging the traditional functional approach, whereas in their
work looking at process maturity, Curtis and Alden (2006) use the term BPM to
refer to the management of discrete processes.
Positioning the study at the level of an organisational management approach
recognises that either of these managerial approaches or some variant of the two
might exist within organisations. It is important that the Researcher considers the
impact of this difference as it can influence the unit of analysis within the study,
and affect the study outcomes.
One way of dealing with the varying interpretations is to refine the scope of the
study and limit it to include only one of the approaches. The exploratory nature
of the study however, makes it suitable for investigating the impact of this
distinction and contributing to the body of knowledge regarding the different
interpretations of BPM. Consequently, the Researcher does not intend to limit
2 The Researcher discusses the different interpretations of BPM in detail when reviewing extant
literature in Chapter 3.

Chapter 1 – Introduction
- 1:10 -
the study based on the managerial approach taken, but rather aims to explore
the consequences of the different approaches within the study.
To address this, the Researcher distinguishes between two key terms: (1) BPM –
what BPM means to the Researcher in terms of its use within the study and (2)
BPM Initiative (BPMI) – what BPM means to the organisations participating in the
study3. Defining what BPM means in the context of the study provides a clear
frame of reference for future interpretation of the study and its findings. Defining
what BPM means to the participants of the study ensures that any differences in
their approaches and applications of BPM are clear and that the Researcher can
consider distinctions in the analysis of data. Furthermore, recognising a
distinction between these two terms is important for providing clarity when
selecting the unit of analysis during the study and when communicating with
companies participating in the study4.
Definition of BPM
The Researcher developed a definition of BPM for use in the study by analysing
common aspects of definitions from extant literature. In determining this
definition, the Researcher recognised that the scope (i.e. the area of the
organisation to which BPM is applied) and the approach taken to implementation
(i.e. use of projects, or a program of work, or use of a Centre of Excellence) could
apply to either managerial interpretation of BPM discussed earlier.
Consequently, in defining BPM for the study, it was important to avoid reference
to either the scope or the implementation approach and focus only the principles
of BPM. The definition of BPM as it applied to this study was:
3 These definitions have not been subject to any form of testing or validation as their purpose was
for consistent interpretation of the terms as used in the study.
4 Distinguishing between these two terms does not mean that the two terms cannot be the same in
some instances. Rather, it acknowledges that, due to the inconsistency in terminology usage, there are times when they may not be consistent and therefore this approach provides clarity at these times.

Business Process Management: Progression and Maturity
- 1:11 -
“…„BPM‟ refers to a management practice aimed at adopting a
process-orientation as a way of doing business. There is recognition
that an organisation may not refer directly to BPM however, in the
context of this research this term encompasses a management
approach that includes a focus on:
Having a strategic focus on process management
Defining the end-to-end processes of the organisation
Standardising and streamlining processes
Creating a customer perspective and generating value-add
Collaborating on processes
Connecting with customer and supplier processes
Eroding cross-functional boundaries
Simplifying process work…”
Definition of BPM Initiative (BPMI)
The purpose of the term BPM Initiative was to recognise that the extent to which
an organisation applied these BPM principles could potentially vary from
organisation to organisation. Within one organisation for example, the BPM
Initiative might equate to a focus on undertaking ad hoc process improvement
projects. Within another organisation, the BPM Initiative might entail the
development of a centralised team that provided BPM services to the entire
organisation or alternatively a more narrowly defined area within the organisation.
The Researcher was interested in whether different variants of BPM made a
difference to the progression of the BPM Initiative so it was important to be able
to distinguish between them. Consequently, the Researcher proposed
descriptions of the type of structure a BPM Initiative might have, based on
existing literature. The definition of BPM Initiative as it applied to this study was:
“…„BPM Initiative‟ or „BPMI‟ is a proxy for your organisation‟s
process-based initiative. Such an initiative might be in the form of:
An ad hoc approach to process improvement and management

Chapter 1 – Introduction
- 1:12 -
A project-based approach to process improvement and management
Pockets of BPM excellence e.g. a centre of excellence, contained within
discrete business units or perhaps a specialist team
An enterprise wide BPM Initiative.
It is recognised that the initiative may not be called „BPM‟ within each
organisation but may be called something like Business
Transformation, Business Improvement or Change Project. In
essence, such an initiative would display (to a greater or lesser
extent) similar attributes as those detailed in the definition of BPM…”
1.2.3 Defining BPM Progression and BPM Maturity
In early investigations, the Researcher identified that organisations face
difficulties in measuring the progression of BPM and related fields. In studying
BPR programmes, for example, Maull et al. (2003) recognise temporal and
contextual difficulties in measuring a dynamic concept within an organisational
context5. Recognising that this conflict between static and dynamic states is
likely to be present within this study, the Researcher distinguished between the
terms BPM Progression and BPM Maturity.
BPM Progression refers to the journey of BPM that occurs within an
organisation over time. BPM Progression reflects, but does not measure, events,
sequencing and influences that occur during this journey. BPM Progression is a
dynamic concept reflecting the temporal aspects of adopting a BPM approach.
BPM Maturity refers to an artificial construct developed to measure BPM
Progression at a given point in time6. Consequently, BPM Maturity is a static
concept, crystallising progression at a given point. This construct incorporates
dimensions critical to BPM Progression including relationships between the
5 The Researcher discusses issues in measuring BPM in more detail in Chapter 3.
6 Aside from its use in the examples of Maull et al. (2003) and Pritchard and Armistead (1999) in
common language, maturity refers to the state or quality of being fully-grown or developed, with words synonymous with maturity including ability, advancement, capability, completion, development, experience, fitness, perfection, readiness, sophistication and wisdom (http://dictionary.reference.com, 2006). The Researcher contends that this makes use of the term „maturity‟ suitable for the notion of measuring progress.

Business Process Management: Progression and Maturity
- 1:13 -
dimensions that derive from insights gained by exploring BPM Progression.
The Researcher does not intend that these terms are interchangeable, but they
are interrelated. Insights and a deeper understanding of BPM Progression will
assist in the development of a measurement model for BPM Maturity by
contributing to the understanding of the relationships between the components of
the model. Furthermore, understanding the dynamic concept of progression
separately to the static notion of measurement will enable greater insights as a
dynamic theory will not lose the richness of understanding and insight that
inevitably occur when simplifying complex phenomenon in a model.
In addition to these definitions, it is beneficial to clarify the Researcher‟s view on
how BPM Progression and BPM Maturity potentially relate to the notion of BPM
Success. In doing so, the Researcher sets the boundaries of this study and
shows areas of potential future research. To this end, the highlighted section on
the left hand side of Figure 1 shows the coverage of this study7. The right hand
side of the diagram shows the possible relationship of this study to future
research into BPM Success and Process Success.
Figure 1: Positioning BPM Progression, Maturity and Success
7 The Researcher discusses the exclusion of the measures for the capability areas when detailing
the research questions for this study.
BPM Success
Process Success
Organisational Performance
Other Measures of
Process Success
Other Measures of BPM Success
Strategic Alignment
Capability Areas 1-5
GovernanceCapability Areas 1-5
MethodsCapability Areas 1-5
Information Technology
Capability Areas 1-5
PeopleCapability Areas 1-5
CultureCapability Areas 1-5
Organisational Context
BPM Maturity
Measures 1-n
Measures1-n
Measures 1-n
Measures 1-n
Measures 1-n
Measures 1-n
Explained by theory on BPM Progression Future Research
Measured by
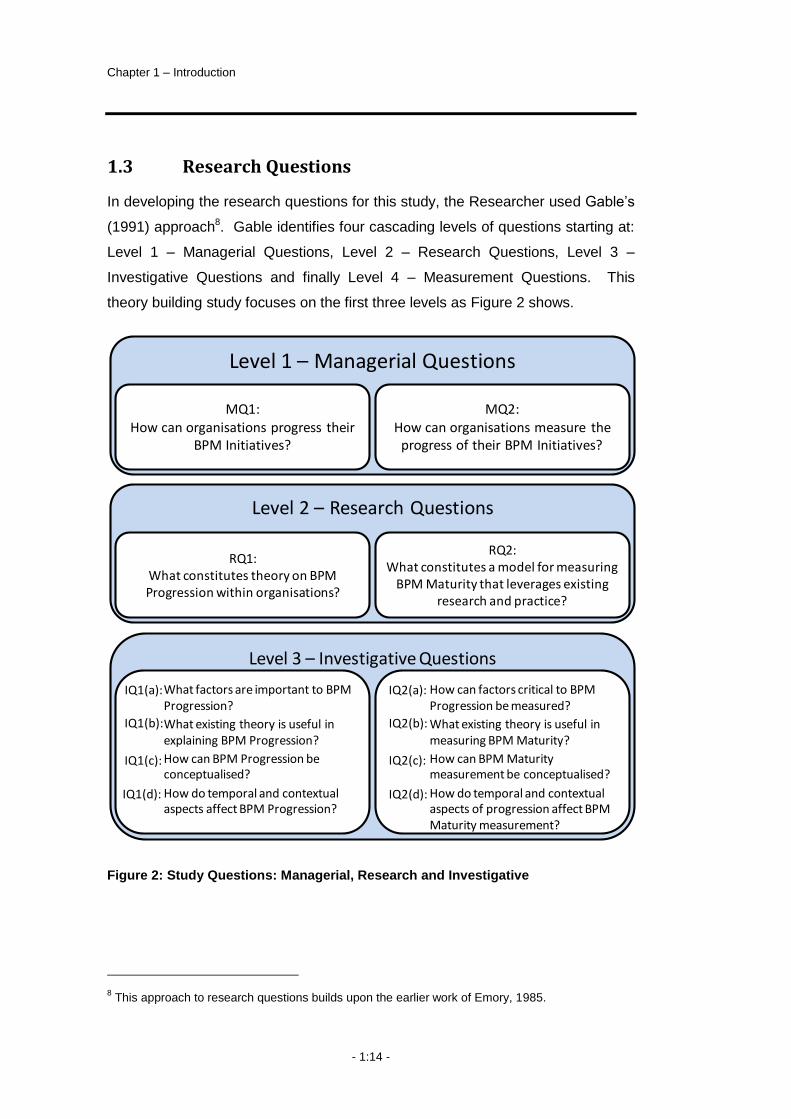
Chapter 1 – Introduction
- 1:14 -
1.3 Research Questions
In developing the research questions for this study, the Researcher used Gable‟s
(1991) approach8. Gable identifies four cascading levels of questions starting at:
Level 1 – Managerial Questions, Level 2 – Research Questions, Level 3 –
Investigative Questions and finally Level 4 – Measurement Questions. This
theory building study focuses on the first three levels as Figure 2 shows.
Figure 2: Study Questions: Managerial, Research and Investigative
8 This approach to research questions builds upon the earlier work of Emory, 1985.
Level 1 – Managerial Questions
MQ1:How can organisations progress their
BPM Initiatives?
MQ2:How can organisations measure the
progress of their BPM Initiatives?
Level 2 – Research Questions
RQ1:What constitutes theory on BPM Progression within organisations?
RQ2:What constitutes a model for measuring
BPM Maturity that leverages existing research and practice?
Level 3 – Investigative Questions
What factors are important to BPM Progression?
What existing theory is useful in explaining BPM Progression?
How can BPM Progression be conceptualised?
How do temporal and contextual aspects affect BPM Progression?
How can factors critical to BPM Progression be measured?
What existing theory is useful in measuring BPM Maturity?
How can BPM Maturity measurement be conceptualised?
How do temporal and contextual aspects of progression affect BPM Maturity measurement?
IQ1(a):
IQ1(b):
IQ1(c):
IQ2(a):
IQ2(b):
IQ2(c):
IQ2(d):IQ1(d):

Business Process Management: Progression and Maturity
- 1:15 -
The pre-paradigmatic state of the BPM domain makes it premature to develop
measurement questions prior to first developing a more comprehensive
understanding of this complex phenomenon. Furthermore, the operationalisation
of the measurement model using Level 4 – Measurement Questions is
appropriate to theory testing and extension stages of research. Consequently,
Level 4 is outside of the scope of this study and provides an opportunity for future
research9.
1.4 Research Plan
As discussed in previous sections, this study aims to build organisational level
theory in the emerging BPM domain. In doing so, the study adopts a multi-
paradigmatic perspective and utilises a multi-method strategy to address its
unique needs. Furthermore, the use of multiple data collection instruments
within the research methods assists with triangulation of data thereby
strengthening the outcomes of the research.
Gioia and Pitre (1990) indicate that a multi-paradigmatic approach is suited to
organisational level theory building in complex and emerging phenomenon. In
taking this approach, the Researcher seeks to focus on the circumstances and
purpose of the research by combining opposing aspects of research in a manner
that suits the research at hand (Hammersley, 1999). The study combines
elements of positivism and critical thinking in an integrated approach to exploring
the progression of BPM within organisations. The development of the a priori
conceptual model and subsequent proposal of a measurement model are
consistent with Orlikowski and Baroudi‟s (1991) view of positivism, whilst the
recognition and integration of the contextual and temporal aspects of BPM
Progression align with their view on critical thinking.
9 As this study involves the conceptualisation of BPM Maturity however, the Researcher needs to
be mindful of the manner in which subsequent operationalisation of the measurement model might eventuate. To this end, the study provides an opportunity to pilot early ideas on future operationalisation in the design of data collection instruments. However, in doing this the focus of the study is on exploration of potential issues with operationalisation and not on the development and validation of measurement questions.

Chapter 1 – Introduction
- 1:16 -
The research design incorporates the use of multiple research methods
including:
A number of targeted literature reviews. The first review contributes to
the understanding of the discipline and the development of an initial a
priori conceptual model. The second review contributes to the selection
and application of appropriate methods in the study. Finally, a further
review contributes to the theory building process including the
development of a formative measurement model.
A series of Delphi studies (6) to explore and expand the critical factors
of the conceptual model. In total six Delphi studies occurred – one for
each of the factors included in the conceptual model.
Extensive use of case studies, both singular and multiple. In the first
instance, multiple case studies (2) contribute to the refinement of the
conceptual model. Following the Delphi studies, a single exemplary case
study (as defined by Yin, 1994) provides the impetus for an emergent
BPM theory. A further set of multiple, longitudinal case studies (5) refine
the emergent theory and measurement model.
Finally, the Researcher applies qualitative data techniques and
principles to collect, understand, analyse and present the data and
outcomes of the study.
1.4.1 Thesis Structure
The Researcher takes a staged approach to this study, recognising the need to
undertake exploratory fact-finding research (Wacker, 1998) in an emerging field
prior to undertaking structured theory building research (Eisenhardt, 1989).
There is further discussion on these two stages in Chapter 2 – Research Design.
Consequently, following the early chapters that focus on the introduction and
justification (Chapter 1) and design (Chapter 2), the next four chapters, Chapters
3 to 6, represent Stage 1 – Exploring the BPM Domain.

Business Process Management: Progression and Maturity
- 1:17 -
Stage Chapter Description Pages Appendix 1. E
xp
lora
tory
Rese
arc
h
3 Development of an a priori conceptual model from literature review.
3:65 – 3:104 N/A
4 Refinement the conceptual model through the conduct of two case studies.
4:105 – 4:151 13.1
5 Extension the refined conceptual model through the application of the Delphi technique.
5:153 – 5:175 13.2
6 Application of the extended conceptual model in an exploratory case study.
6:177 – 6:208 13.3
Table 1: Thesis Structure: Stage 1 Chapters
Chapters 7 to 10 represent Stage 2 – Building BPM Theory as shown in Table 2.
Examples of the documentation and data collection instruments the Researcher
used throughout the study are included in the Appendix, together with examples
of data and data analysis where relevant. Table 1 and Table 2 provide details of
the location of the relevant Appendix for each chapter.
Stage Chapter Description Pages Appendix
2. T
heo
ry B
uild
ing
Res
earc
h
7 Design of a series of multiple, longitudinal case studies for the subsequent exploration of BPM Initiatives from the frame of the extended conceptual model.
7:213 – 7:230 13.4
8 Within-case analysis undertaken on the data from the multiple, longitudinal case studies.
8:233 – 8:298 N/A
9 Cross-case analysis undertaken on the data from the multiple, longitudinal case studies.
9:301 – 9:350 N/A
10 Proposal of a theory on BPM Progression.
Proposal of a formative model for measuring BPM Maturity.
10:351 – 10:387 N/A
Table 2: Thesis Structure: Stage 2 Chapters
Chapter 11 concludes the thesis, providing a summary of the study outcomes,
limitations and outlook for future research.
Chapter 1 – Introduction
- 1:18 -
1.5 Research Contributions
A desire to conduct both rigorous and relevant research underpins this study. As
such, there are both theoretical and practical contributions arising from its
conduct. On a theoretical level, contributions include:
A so called BPM Capability Framework, developed from an extensive
literature review identifying factors critical to BPM Initiatives and refined
using the Delphi technique to identify areas of measurement
Definition of a construct for measuring BPM Maturity including the
proposal of a formative measurement model
Explanatory Theory for BPM Progression developed through the
conduct of exploratory case studies, and refined through a series of
longitudinal case studies
Development of a typology for classifying BPM Initiatives based on the
scope of the initiatives and the approach taken to their implementation
An understanding of the potential role of context and contextual
variables on the relationships in the BPM Maturity measurement model.
1.5.1 Publications
The publications accepted during the course of this study support the theoretical
contributions of the study. These publications include:
Conference Publications:
de Bruin, T., & Doebeli, G. (2009). Progressing an organizational approach to
BPM: Integrating experience from industry and research. Proceedings of the 21st
International Conference on Advanced Information Systems (Industrial Track),
Amsterdam.
de Bruin, T. (2008). Strategies for increasing executive commitment to BPM.
Proceedings of the 16th European Conference on Information Systems, Galway,
1620-1631.

Business Process Management: Progression and Maturity
- 1:19 -
de Bruin, T. (2007). Insights into the evolution of BPM in organisations.
Proceedings of the 18th Australasian Conference on Information Systems,
Toowoomba, 632-642.
de Bruin, T., & Rosemann, M. (2007). Identifying BPM capability areas using the
Delphi Technique. Proceedings of the 18th Australasian Conference on
Information Systems, Toowoomba, 643-653.
de Bruin, T., & Rosemann, M. (2006). Towards understanding strategic alignment
of BPM. Proceedings of the 17th Australasian Conference on Information
Systems, Adelaide.
de Bruin, T., Rosemann, M., Freeze, R., & Kulkarni, U (2005). Understanding the
main phases of developing a maturity model. Proceedings of the 16th
Australasian Conference on Information Systems, Sydney.
Rosemann, M., & de Bruin, T. (2005). Towards a business process management
maturity model. Proceedings of the 13th European Conference on Information
Systems, Regensburg, 521-532.
Rosemann, M., & de Bruin, T. (2004). Application of a holistic model for
determining BPM. Proceedings of the AIM Pre-ICIS Workshop on Process
Management and Information Systems, Washington D.C.
Rosemann, M., de Bruin, T., & Hueffner, T. (2004). A model for business
process management maturity. Proceedings of the 15th Australasian Conference
on Information Systems, Hobart.
Doctoral Consortiums:
de Bruin, T. (2005, November). BPM maturity. In K. Fielden & B. Rowlands (Co-
Chairs), Doctoral Consortium for the 16th Australasian Conference of Information
Systems, Sydney10.
10
This paper was selected as 1 of the 3 best papers from the Doctoral Consortium and the Researcher was invited to present at the ACIS 2005 conference.

Chapter 1 – Introduction
- 1:20 -
de Bruin, T. (2005, November). BPM maturity. In I. Hawryszkiewycz (Chair),
Doctoral Consortium for the 2nd International Conference on Qualitative Research
in IT & IT in Qualitative Research, Brisbane.
Book Chapters
de Bruin, T., & Doebeli, G. (in press). BPM as an organizational approach: The
experience of an Australian transport provider. In M. Rosemann & J. vom Brocke
(Eds.), Handbook on Business Process Management: (Vol 1). Berlin: Springer
Publishing Company.
Rosemann, M., de Bruin, T., & Power, B. (2006). A model to Measure BPM
Maturity and Improve Performance. In J. Jeston & J. Nelis (Eds.), Business
Process Management: Practical guidelines to successful implementations, (pp.
299-315). Burlington, Massachusesetts: Butterworth-Heinemann.
Education Modules:
de Bruin, T (2005). Embedding BPM. In: Self study course in Business Process
Management, Module 9. Informa Australia Pty, Sydney.
1.5.2 Practical Applications and Contributions
On a practical level, contributions arise from the application of the theoretical
outcomes within organisations, by the individuals that work there. Figure 3
shows how an Australian bank has used the factors to underpin their five-year
plan for BPM within the IT Division. Figure 4 shows how an Australian transport
provider has used the BPM Capability Framework in their intranet portal.
Furthermore, during the study, the Researcher made presentations and
conducted education seminars on the research outcomes as reflected in Table 3.

Business Process Management: Progression and Maturity
- 1:21 -
Figure 3: Application within Australian Bank
Figure 4: Application within Australian Transport Company

Chapter 1 – Introduction
- 1:22 -
1.5.3 Practical Contributions
In addition to the theoretical contributions, the Researcher contributed to industry and practice during the course of the study including:
Organisation / Event Title / Description Time
Presentations
Fosters Brewery – Melbourne Progressing BPM March 2008
Water Corporation – Perth Measuring BPM Maturity November 2007
5th Australasian Process Days 2007 Measuring and Managing BPM Maturity August 2007
Commonwealth Bank – Sydney Evolving BPM Maturity August 2007
Rio Tinto Process Business Leaders Annual Meeting – Brisbane
Progressing BPM August 2007
Bentley College – Boston BPM Maturity July 2007
Bank of America – Charlotte BPM Maturity July 2007
BPM Chapter – Canberra BPM Contextual Factors May 2007
Commonwealth Bank – Sydney Measuring BPM Maturity May 2007
4th Australasian ProcessDays 2006 Contextual Factors that Affect BPM August 2006
BPM Roundtable Culture and BPM August 2006

Business Process Management: Progression and Maturity
- 1:23 -
Organisation / Event Title / Description Time
IQPC BPM Conference 2006 Evaluating and Advancing BPM Using a BPM Maturity Model May 2006
BPM Chapter – Brisbane A Model to Assess BPM Maturity September 2005
Education
IP Australia – Canberra 1 day of training on BPM Maturity May 2009
Queensland Courts 1 day of training on BPM Maturity February 2008
Queensland Motorways 1 day of training on BPM Maturity November 2007
Queensland Treasury 1 day of training on BPM Maturity October 2007
Queensland Department of Education 1 day of training on BPM Maturity June 2007
Queensland Department of Education 1 day of training on BPM Maturity October 2006
Queensland Courts 1 day of training on BPM Maturity September 2006
Queensland Department of Main Roads – Roadtek 1.5 hr session on BPM Maturity June 2006
Other
Queensland Health Consulting Engagement: Assessing BPM Capability May 2008
OMG Think Tank – San Francisco Chair of Roundtable July 2007
Table 3: Practical Contributions

Chapter 1 – Introduction
- 1:24 -
1.6 Chapter Summary
In this chapter, the Researcher presented arguments supporting the study of
BPM at an organisational level. The Researcher recognised the potential
influences on the design and conduct of the study resulting from BPM being an
emerging discipline and consequently lacking a common language, shared
terminology and a core body of theory (with respect to BPM as a management
practice).
Next, there was definition of key terms as they apply to the study including
organisational level research, BPM, BPM Initiative, BPM Progression and BPM
Maturity. Furthermore, the Researcher positioned the study with respect to the
concepts of BPM Success and Process Success. In doing so, the Researcher
set the boundaries of the study and clarified the contribution of the study to future
research.
The study aims to contribute to the BPM body of knowledge by developing theory
for BPM Progression and a measurement model for BPM Maturity. This reflected
in the three levels of study questions including managerial, research and
investigative questions. Level 4 – Measurement Questions were excluded from
the scope of this study.
The Researcher provided an overview of the research design plan and a review
of the thesis structure, before presenting the theoretical and practical
contributions that have arisen from the study.
The next Chapter provides details of the research design that supports the
conduct of the study.

Business Process Management: Progression and Maturity
- 2:25 -
2 Research Design
here has been a resurgence in the appeal of BPM as a means by
which organisations can meet the increasing demands of globalisation
and competitive advantage. This study aims to make a theoretical
contribution to the BPM domain by exploring the progression of BPM Initiatives
within organisations, including the investigation of how to measure such
progression. This chapter presents the research design for achieving the aims of
the study: (1) develop theory about BPM Progression and (2) propose a model to
measure BPM Maturity11.
2.1 Chapter Overview
The structure of this chapter is as follows. Section 2 discusses the positioning of
the study from a domain, a theoretical and a philosophical perspective. Section 3
details the research strategy including the two stages of the study whereby Stage
1 aims at exploring BPM and Stage 2 aims at building theory. Section 4 provides
justification for the selection of a multi-method approach to the study, detailing
the integrated use of exploratory case study and survey research. Section 5
discusses data collection including the use of Lincoln and Guba‟s (1985) criteria
for collecting qualitative data. Section 6 provides a summary of the chapter.
11
Separating the theory from the measurement model in this manner is consistent with views on the logical structure of theory being variance or process theory (Markus and Robey, 1988). Other
proponents of such separation are Huber and Van de Ven (1995), Mohr (1982) and Seddon (1997).
T

Chapter 2 – Research Design
- 2:26 -
2.2 Positioning the Study
A requirement of this study is that it makes a unique, theoretical contribution to a
body of knowledge. It is therefore necessary to position the study from three
perspectives: (1) the domain, (2) its theoretical basis (i.e. theory building, theory
testing, theory extension or some combination) and (3) the philosophical
positioning of the research.
2.2.1 Domain Positioning
This study positions BPM as a complex, organisational level phenomenon
emerging from earlier practices such as Total Quality Management, Business
Process Reengineering and Business Process Innovation. The newness of BPM
as an approach to managing organisations and processes equates to a young
domain, presenting a number of unique challenges that the Researcher needs to
consider in the research design12.
Lack of Theory
In Chapter 1, the Researcher argued that there was little theory to assist
organisations progress BPM. Whilst there was evidence of guidance on
progression (Pritchard & Armistead, 1999; Zairi, 1997), the Researcher argued
that this was not theory due to the lack of constructs and relationships (Anderson
et al., 1994).
An approach to overcoming a lack of constructs is to transfer constructs from
other areas and integrate them into a BPM theory. In developing a priori
constructs in this way however, there is an inherent danger that this transference
will inhibit insights during future theory building exercises (Eisenhardt, 1989;
Glaser & Strauss, 1967; Walsham, 1995). Furthermore, within BPM many
existing studies take a process or a project perspective not an organisational
perspective. Eisenhardt (1989) indicates that when the unit of analysis is at an
12
Pritchard and Armistead (1999) were one of the first researchers to recognise BPM as an approach to managing an organisation – one that challenges the traditional functional approach to organisational management. Earlier researchers (e.g. Davenport, 1993; Hammer & Champy, 1993; Zairi, 1997) focused on BPM as an operational approach to the management and/or improvement of processes within an organisation but not on the management of the organisation itself.

Business Process Management: Progression and Maturity
- 2:27 -
individual or process level, a potential limitation is that findings do not necessarily
translate to organisational level research.
Similarly, an approach to overcoming a lack of theory is to transfer or borrow
theory from other domains. At an organisational level however, a number of
researchers have found a lack of theory in other applied disciplines such as
operations management (Anderson et al. 1994) and human resources (Lynham,
2000). Transferring theory in this manner may also introduce the same
limitations on future theory building as transferring constructs (Eisenhardt, 1989).
The early stage of the BPM domain, including the lack of theory and construct
definition, positions this as a theory building study.
2.2.2 Theoretical Positioning
Typically, research addresses theory building (i.e. discovery, description,
mapping and relationship building), theory testing (i.e. validation), theory
extension / refinement (Handfield & Melnyk, 1998), or some combination of
these. Whilst the stage of the domain and the lack of theory position this as a
theory building study, the time constraints of a PhD, limit the study from
progressing to the theory testing and refinement stages.
What is Theory?
According to Dubin (1976, 26), theory is an attempt to “model some theoretical
aspect of the real world” in order to “make sense of the observable world by
ordering the relationship among elements that constitute the theorist‟s focus of
attention in the real world”. Dubin sees theory as producing two outcomes:
1. Process knowledge (i.e. knowledge about how the phenomenon works)
2. Outcome knowledge (i.e. the ability for the theory to explain or predict
with regard to the phenomenon).
Senge et al. (1994) agree with Dubin‟s view on theory producing process
knowledge, seeing theory as developing fundamental propositions to explain how
the world works. They go further to suggest that a theory needs to be tested
repeatedly in order to build confidence.

Chapter 2 – Research Design
- 2:28 -
Torraco (2002) sees theory in line with Dubin‟s second outcome, expressing
theory as something that explains what a phenomenon is and how it works.
Bacharach (1989) takes a positivist view stating that theory is about the
relationships between observed or approximated units. In supporting a multi-
paradigmatic approach, Gioia and Pitre (1990, 587) define theory as being “any
coherent description or explanation of observed or experienced phenomena”.
Lynham (2000, 222) adapts Gioia and Pitre‟s (1990) definition to express theory
as “a coherent description, explanation, and representation of observed or
experienced phenomena”.
In keeping with its exploratory nature, this study adopts a view of theory
consistent with Lynham (2000) and Gioia and Pitre (1990). The proposal of a
conceptual measurement model for BPM Maturity, including insights and
conjectures relating to potential relationships between constructs and sub-
constructs position the theory for future testing and predictive possibilities.
What is Theory Building?
According to Whetten (1989), answering questions of how, when and why is the
primary goal of theory. In applied disciplines such as human resource
development, researchers have identified theory building as serving the purpose
of: increasing maturity and professionalism (Chalofsky, 1996; Marsick, 1990),
interpreting new data, responding to new problems, identifying new research
directions and developing common language (Torraco, 2002). Lynham (2000)
gives three reasons why theory building is important including to:
1. Advance professionalism in and maturity of the field
2. Help dissolve the tension between research and practice
3. Develop multiple and inclusive methods of research for theory building
and practice.
Whilst Lynham (2000) was referring to the development of human resources,
these aspects extrapolate well to other applied disciplines such as BPM.
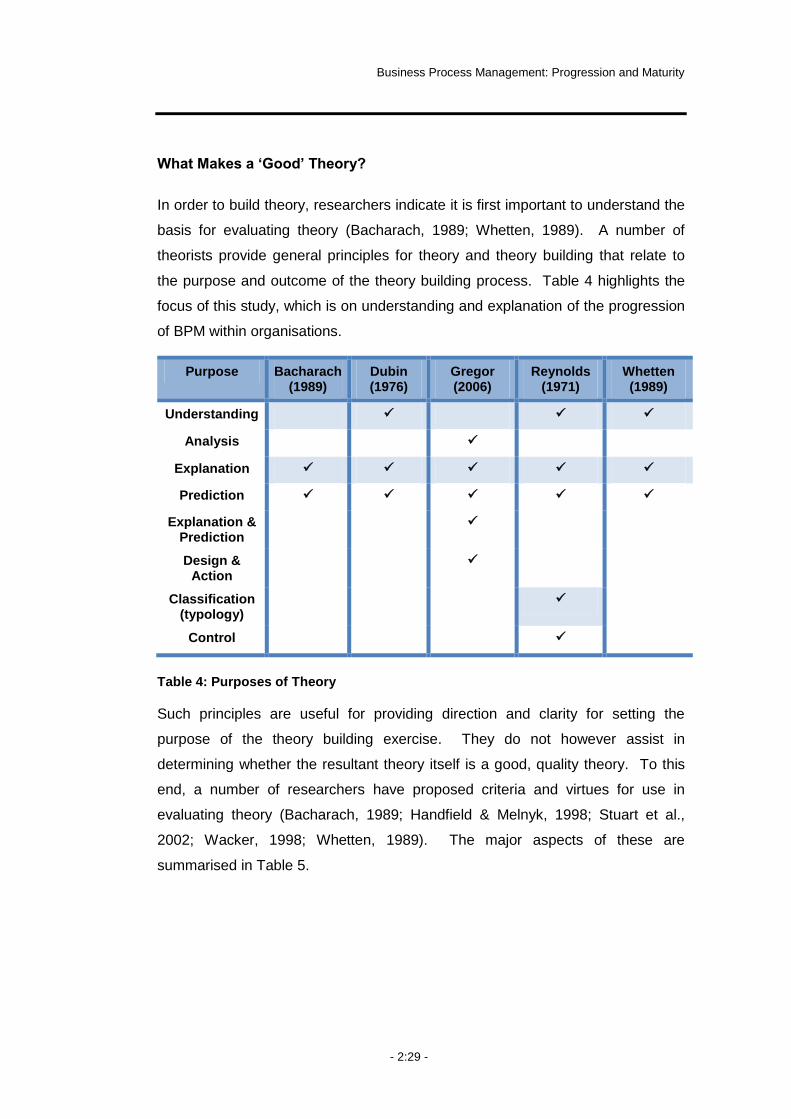
Business Process Management: Progression and Maturity
- 2:29 -
What Makes a „Good‟ Theory?
In order to build theory, researchers indicate it is first important to understand the
basis for evaluating theory (Bacharach, 1989; Whetten, 1989). A number of
theorists provide general principles for theory and theory building that relate to
the purpose and outcome of the theory building process. Table 4 highlights the
focus of this study, which is on understanding and explanation of the progression
of BPM within organisations.
Purpose Bacharach (1989)
Dubin (1976)
Gregor (2006)
Reynolds (1971)
Whetten (1989)
Understanding
Analysis
Explanation
Prediction
Explanation & Prediction
Design & Action
Classification (typology)
Control
Table 4: Purposes of Theory
Such principles are useful for providing direction and clarity for setting the
purpose of the theory building exercise. They do not however assist in
determining whether the resultant theory itself is a good, quality theory. To this
end, a number of researchers have proposed criteria and virtues for use in
evaluating theory (Bacharach, 1989; Handfield & Melnyk, 1998; Stuart et al.,
2002; Wacker, 1998; Whetten, 1989). The major aspects of these are
summarised in Table 5.

Chapter 2 – Research Design
- 2:30 -
Virtue Description Bach
ara
ch
(1989)
Han
dfie
ld &
Meln
yk
(1998)
Stu
art e
t al.
(2002)
Wac
ker
(1998)
Wh
ette
n
(1989)
Uniqueness One theory must be differentiated from another (Wacker, 1998) Conservatism Can replace a theory only if the new theory is superior in its virtues (Wacker, 1998) Generalizability The more areas that a theory can be applied to makes the theory a better theory
(Wacker, 1998)
Fecundity A theory that is more fertile in generating new models and hypotheses is better than a theory that has fewer hypotheses (Wacker, 1998)
Parsimony Other things being equal the fewer the assumptions the better (Wacker, 1998)
Delete factors that add little additional value to our understanding (Whetten, 1989)
Comprehensiveness All relevant factors included (Whetten, 1989) Internal consistency The theory identifies all relationships and gives adequate explanation (Wacker, 1998)
Falsification Theories can never be proven only disproven (Bacharach, 1989)
Empirical riskiness – refutation must be very possible (Wacker, 1998)
Abstraction Abstraction level of theory means it is independent of time and space (Wacker, 1998)
Not Wrong Refers to the overall approach used by the researchers including its suitability and the correctness with which it is applied (Handfield & Melnyk, 1998; Whetten, 1989)
Useful Must deal with a problem of „real-importance, add to prior studies, direct the researcher to issues and problems not previously examined (but which are still of interest) and explain or predict (Handfield & Melnyk, 1998)
Table 5: Virtues Against Which to Judge Theory
Business Process Management: Progression and Maturity
- 2:31 -
Although this study does not look to evaluate theory, the virtues in Table 5 act to
guide the theory building process. The lack of theory in the BPM domain and the
lack of suitable theory to transfer make the first two requirements of uniqueness
and conservatism relatively straightforward, for example. The aim of high
relevance results in particular attention to the useful criteria. Similarly, an
awareness of the difficulties in doing good qualitative, multi-paradigmatic
research increases the emphasis on the not wrong virtue. The study aims for
medium levels of generalisability to increase the relevance and applicability of the
study outcomes but recognises the potential constraint of organisational context
on the theory building process. Recognising high-level constructs and sub-
constructs is consistent with the criteria for comprehensiveness. Constraints
such as the early stage of BPM research and PhD timeframes however, make it
difficult to apply some criteria. Criteria such as falsifiability are more relevant to
theory testing, for example. Recognising the need to achieve these virtues at
latter stages nevertheless provides useful guidance for the study.
2.2.3 Philosophical Positioning
Information Systems research presents, among others, three philosophical
positions including the positivist, the interpretive and the critical research
philosophies. According to Orlikowski and Baroudi (1991):
Positivism Has the assumption that an aspect of a given phenomenon
has a unique, ideal description whereby “…the existence of a
priori fixed relationships (…) is typically investigated with
structured instrumentation…” A limitation of this view is that
it ignores the role of contextual variables (Orlikowski &
Baroudi, 1991, 13-14).
Interpretivism Avoids applying external categorisation, instead seeing
importance in the subjective meaning and the way in which
people construct reality. This view avoids external
conditions, structural conflicts in organisations and society,
unintended consequences of action and historic changes.
Whilst providing rich contextual insights, this view makes

Chapter 2 – Research Design
- 2:32 -
generalisability and replicability difficult (Orlikowski &
Baroudi, 1991, 13-14).
Critical Focuses on revealing conflicts and contradictions in the
structures of existing social systems and has a view that
“…things can never by treated as isolated elements…”. Like
interpretivism, this view provides rich contextual insights
although often takes a longitudinal view due to the notion of
„totality‟. A major difference between these two views is in
the approach to evaluation (Orlikowski & Baroudi, 1991, 19).
Despite the distinct philosophical views, a number of researchers argue that
organisational research and theory building can benefit from taking a multi-
paradigmatic approach to studies (Bacharach, 1989; Gioia & Pitre, 1990; Lee,
1991; Mingers, 2001; Van de Ven, 1989).
According to Gioia and Pitre (1990), a multi-paradigmatic approach is one that
looks to cross the boundaries of existing paradigms in order to generate multiple
perspectives on topics under investigation13. Similarly, Lee (1991) acknowledges
that when adopting such an approach the philosophical beliefs of the researcher
will still dominate, but that there is acceptance of alternate views and a belief that
the multiple views can be mutually supportive and not mutually exclusive.
Furthermore, Gioia and Pitre (1990) argue that the blurred transition zones
between two paradigms allow bridges between the paradigms (such as the
Interpretivist-Functionalist Transition Zone that includes theories of
structurationism) as seen in Figure 5 from Gioia and Pitre (1990, 597).
13
Similarly, Mingers (2001) uses the term strong pluralism as being “where all research situations are seen as inherently complex and multidimensional, and would thus benefit from a range of methods.”

Business Process Management: Progression and Maturity
- 2:33 -
Figure 5: The Metaparadigm Perspective
According to Gioia and Pitre (1990), theory building within each of these
paradigms includes different goals, theoretical concerns and different theory
building approaches.
This study positions as (1) organisational level, (2) theory building, (3) being in a
complex and emerging phenomenon. Gioia and Pitre (1990, 595-596) indicate
that a multi-paradigmatic approach to theory building is conducive to the complex
nature of human and organisational realities and their dynamic contexts, stating:
“…given the multiplicity of organizational realities, a pluralistic,
multiple-perspectives view becomes a necessity for achieving any
sort of comprehensive view. Such a multiple-perspectives view
requires that organizational theorists consider the set of theories
relevant to a given topic from some view-point beyond that of an
individual paradigm (…) it is an attempt to account for many
representations related to an area of study (e.g. organizational
structure, culture, socialization) by linking theories through their
transition zones. The various knowledge claims thus assembled can
constitute a multidimensional representation of the topic area…”
RadicalHumanist
Radical Structuralist
Interpretist Functionalist
Interpretivist-Functionalist Transition Zone
1. The shaded areas between theparadigms represent the blurredtransition zones.
2. The meta-level vantage position,represented by the ellipse, is arbitrarilyplaced above the plane of paradigms todenote that the viewer typically isrooted in the assumptions of someparadigm. Yet the circle also representsthe possibility of multiple viewers,ideally from multiple paradigms.
3. The directional arrows toward theplane of the paradigms represent thediverse paradigmatic views availablefrom the meta-level vantage position.(The perspective lines are not intendedto depict convergence toward someviewpoint that would representintegration of differing, multiple views.
Chapter 2 – Research Design
- 2:34 -
Gioia and Pitre (1990) argue that theory building should not be a viewed as a
search for the truth but rather that different approaches be used to create more
comprehensive views when studying complex organisational phenomena.
Furthermore, Gioia and Pitre (1990, 599) state:
“…Multi-paradigm approaches to theory building can generate more
complete knowledge than can any single paradigmatic perspective…”
Finally, as indicated earlier, the aim of the study is twofold. On the one hand, it
seeks to gain a deeper understanding of the progression of BPM within
organisations, enabling the development of a theory on BPM Progression. On
the other hand, it seeks to contribute to the measurement of BPM Progression
using the construct of BPM Maturity. The notion of measurement implies some
level of acceptance of the existence of a priori relationships and the possibility of
subsequent testing and prediction of theory, consistent with positivist thinking.
The study of progression within natural settings, using a longitudinal approach to
assist understanding and overcome impediments, also implies acceptance of the
role of context and the notion of totality, consistent with a critical viewpoint.
Consequently, the Researcher has adopted a multi-paradigmatic approach as
described by Gioia and Pitre (1990), choosing to focus on the circumstances and
purpose of the research and combining opposing aspects of research in a
manner that suits the research at hand (Hammersley, 1999). The philosophical
approach transitions the critical and positivist paradigms, consistent with the
definitions of these paradigms provided by Orlikowski and Baroudi (1991).
2.3 Research Strategy
A number of researchers support a staged approach to exploring emerging
domains. For example, Wacker (1998, 371) distinguishes between “good fact
finding research” and “good theory building research”. Similarly, van der Zwaan,
in Kerssens-van Drongelen (2001, 503), suggests conducting “pilot research”
where there is no existing or well-developed theory. According to Wacker (1998),
good fact finding research looks at existing relationships, explores new
relationships and offers explanations about why things may have occurred.
Wacker (1998, 371) goes further to indicate that because this stage of research
Business Process Management: Progression and Maturity
- 2:35 -
is not constrained by existing theory it can provide:
“…fertile ground for subsequent new theory building…”
Alternatively, Kerssens-van Drongelen (2001) argues that this pre-fix to building
theory is not required but rather, is a part of an iterative theory building process.
An iterative view of theory building is consistent with approaches suggested by
researchers including Eisenhardt (1989) and Lynham (2000). In these
approaches however, the iteration occurs at the data analysis stage and refers to
relating the emergent theory back to the various cases.
The Researcher contends that the separation of the research into two distinct
stages as suggested by Wacker (1998) and van der Zwaan (2001) is beneficial to
this study and fits well with the multi-paradigmatic approach to the study. The
value the Researcher sees in this approach stems from the problems of
inconsistent terminology usage, the lack of a shared language and the low level
of theory within the domain. In an emerging domain, these issues potentially
lead to a research problem that is not defined well or relevant. Undertaking an
exploratory stage of research, prior to a structured theory-building phase, gives
the Researcher the opportunity to clarify and refine the research problem prior to
progressing to an iterative theory building approach. Consequently, this study
used a staged approach consistent with Wacker (1998) whereby:
Stage 1 focuses on exploring BPM. In this stage, by studying extant literature
and organisational practice the Researcher gains a deeper understanding of the
phenomenon. What is seemingly important from existing literature or from
practice? What does industry want researched? What new relationships might
exist? What do organisations do when implementing BPM? What issues do
BPM practitioners encounter?
Stage 2 focuses on building BPM theory. In this stage, the interest is in the
manner of progression and the potential relationships between different aspects.
How do these aspects relate to each other? How do changes in the environment
affect relationships? How does the passing of time affect relationships? How
generalisable is the emerging theory?

Chapter 2 – Research Design
- 2:36 -
2.4 Methods: Selection and Application
The successful completion of the study is dependent on two primary
assumptions: 1) being able to gather quality, relevant and representative data;
and 2) being able to meaningfully interpret such data and communicate findings
to interested parties. Leedy and Ormrod (2001, 103) indicate that selecting the
correct approach to collecting data provides validity to the study itself. Table 6
shows how Handfield and Melnyk (1998) relate the research structure (i.e. the
methods used) to the purpose of the study and the research questions. This
representation is useful as it assists in selecting methods that are appropriate to
the purpose of the study.
Purpose Research Question Suggested Research Structure
1a. Discovery
Uncover areas for research and theory development
What is going on here?
Is there something interesting enough to justify research?
In-depth case studies
Unfocused, longitudinal field study
1b. Description
Explore Territory
What is there?
What are the key issues?
What is happening?
In-depth case studies
Unfocused, longitudinal field study
2. Mapping
Identify/describe key variables
Draw maps of the territory
What are the key variables?
What are the salient/critical themes, patterns, categories?
Few focused case studies
In-depth field studies
Multi-site case studies
Best-in-class case studies
3. Relationship building
Improve maps by identifying the linkages between variables
Identify the „why‟ underlying these relationships
What are patterns or linkages between variables?
Can an order in the relationships be identified?
Why should these relationships exist?
Few focused case studies
In-depth field studies
Multi-site case studies
Best-in-class case studies

Business Process Management: Progression and Maturity
- 2:37 -
Purpose Research Question Suggested Research Structure
4. Theory Validation
Test the theories developed in the previous stages
Predict future outcomes
Are the theories we have generated able to survive the test of empirical data?
Did we get the behaviours predicted by the theory or did we observe another unanticipated behaviour?
Experiment
Quasi-experiment
Large scale sample population
5. Theory Extension / Refinement
To expand the map of the theory
To better structure the theories in light of the observed results
How widely applicable / generalizable are the theories that we have developed?
Where do these theories apply?
Where don‟t these theories apply?
Experiment
Quasi-experiment
Large scale sample of population
Table 6: Matching Research Design with Theory Building Activities
As highlighted in Table 6, this study focuses on Handfield and Melnyk‟s (1998)
first three purposes, discovery and description, mapping, and relationship
building14. The first two purposes (discovery and description, and, mapping),
align with Stage 1 of Wacker‟s (1998) two-stage approach. The third purpose,
relationship building, aligns with Wacker‟s second stage focus on theory building.
In investigating theory building in applied disciplines, Torraco (2002, 361)
identifies a number of research methods as shown in Table 7. According to
Torraco (2002), Dubin (1978) uses a deductive, quantitative approach to explain,
predict, and control the phenomenon and create theory. Glaser and Strauss‟
(1967) grounded theory takes an inductive approach relying on interaction
between data collection and analysis. Meta analytic theory building summarises
similar existing empirical studies into coherent patterns. Social constructionist
theory building looks at using narratives to model how people make sense of the
social world and case study research looks to understand complex phenomena
by exploring it in its natural setting and using the rich context to generate theory.
14
Purposes 4 and 5 of Handfield and Melnyck‟s (1998) approach are outside of the scope of this thesis.

Chapter 2 – Research Design
- 2:38 -
Type of Research Driving Rational General Theory-Building Research Phase
Methods Quantitative Qualitative Deductive Driven
Inductive Driven
Conceptual Development
Operationalization Confirmation or Disconfirmation
Application Continuous Refinement & Development
Quantitative (Dubin)
Grounded (Glaser & Strauss)
Meta Analysis
Social Constructionist
Case Study
Table 7: Contributions of Research Methods to Theory Building Research
Note: Denotes a limited role only
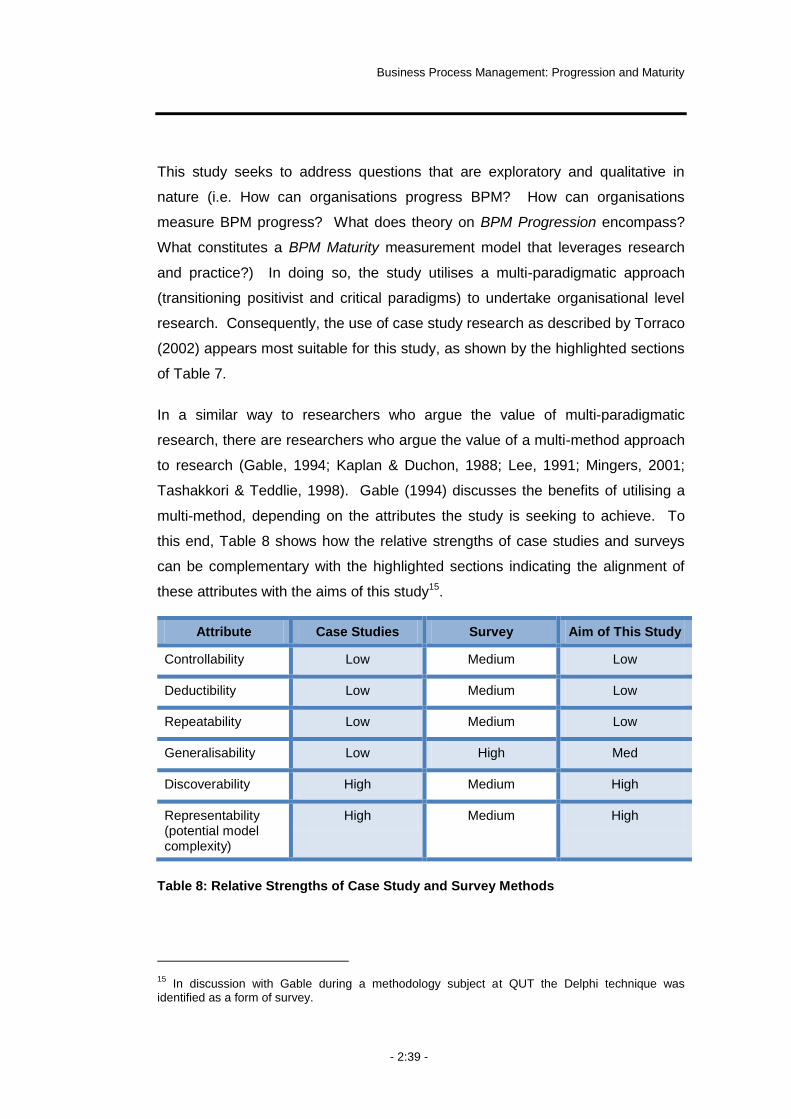
Business Process Management: Progression and Maturity
- 2:39 -
This study seeks to address questions that are exploratory and qualitative in
nature (i.e. How can organisations progress BPM? How can organisations
measure BPM progress? What does theory on BPM Progression encompass?
What constitutes a BPM Maturity measurement model that leverages research
and practice?) In doing so, the study utilises a multi-paradigmatic approach
(transitioning positivist and critical paradigms) to undertake organisational level
research. Consequently, the use of case study research as described by Torraco
(2002) appears most suitable for this study, as shown by the highlighted sections
of Table 7.
In a similar way to researchers who argue the value of multi-paradigmatic
research, there are researchers who argue the value of a multi-method approach
to research (Gable, 1994; Kaplan & Duchon, 1988; Lee, 1991; Mingers, 2001;
Tashakkori & Teddlie, 1998). Gable (1994) discusses the benefits of utilising a
multi-method, depending on the attributes the study is seeking to achieve. To
this end, Table 8 shows how the relative strengths of case studies and surveys
can be complementary with the highlighted sections indicating the alignment of
these attributes with the aims of this study15.
Attribute Case Studies Survey Aim of This Study
Controllability Low Medium Low
Deductibility Low Medium Low
Repeatability Low Medium Low
Generalisability Low High Med
Discoverability High Medium High
Representability (potential model complexity)
High Medium High
Table 8: Relative Strengths of Case Study and Survey Methods
15
In discussion with Gable during a methodology subject at QUT the Delphi technique was identified as a form of survey.

Chapter 2 – Research Design
- 2:40 -
The emergent nature of BPM at an organisational level point to attributes of
discoverability and representability. The desire to produce a theory on
progression suggests generalisability is also an important attribute for this study.
The organisational level of the study however, introduces a potential constraint
upon the generalisability of the theory due to the complex environments that exist
within organisations.
The Organisation-Environment Relationship model developed by Barton et al.
(2001, 66) and represented in Figure 6 is useful for understanding the potential
impact of complex environments.
Figure 6: The Organisation-Environment Relationship
This model depicts the organisation in the context of the mega environment and
the task environment whereby the view of the mega environment is often remote
and not well understood. Essentially, the mega environment represents the
Mega Environment
International
Task Environment / The Stakeholders
Suppliers
CompetitorsLabour Supply
Government Agencies
Customers & Clients
The
Organisation
Mega Environment
International
Task Environment / The Stakeholders
Suppliers
CompetitorsLabour Supply
Government Agencies
Customers & Clients
The
Organisation
Business Process Management: Progression and Maturity
- 2:41 -
ideologies that exist and interrelate to shape organisations. The task
environment is closer to the organisation consisting of stakeholders that are
important to it. The task environment is critical to the survival of an organisation
as it represents both the needs and expectations an organisation seeks to fill,
together with the resources required in order to fulfil these (Kiraka & Manning,
2005).
Understanding the Organisation-Environment Relationship is important to this
study as it highlights the need to consider the context of the organisation in
undertaking organisational research. In doing so, it emphasises the important
point that the contextual environment is likely to vary between organisations.
This has the potential then, to affect the generalisability of any theory developed
in this study.
Despite the potential constraint raised by the consideration of context, the study
aims for medium levels of generalisability, suggesting that a multi-method
approach, combining case study research and survey research, is suitable for the
study. The next sections discuss this selection in more detail.
2.4.1 Case Studies
In his seminal work on case studies, Yin explores the suitability of a number of
methods for undertaking research based on three criteria. Yin (2003, 4) argues
that, in itself, exploratory research does not necessitate the use of case studies
but rather the existence of three conditions does. The conditions are the:
1. Extent of control an investigator has over actual behavioural events
2. Degree of focus on contemporary as opposed to historical events
3. Type of research question posed.
Table 9 from Yin (2003, 5) summarises the relationship of these questions to
various research methods and highlights those applicable to this study.

Chapter 2 – Research Design
- 2:42 -
Strategy
Experiment Survey Archival analysis
History Case Study
Requires control over behavioural events
Yes No No No No
Focuses on contemporary events
Yes Yes Yes/No No Yes
Form of research question
How, why Who, what, where, how many, how
much
Who, what, where, how many, how
much
How, why How, why
Table 9: Research Methodologies
As shown by the highlighted areas in Table 9, the use of case study within this
research is consistent with Yin‟s application of case study. The following
sections provide further support for the selection and use of case studies within
this research.
At an organisational level, BPM is an applied discipline. The Researcher
therefore does not have, or require, control over behavioural events as the
learning is from practice satisfying the first of Yin‟s criteria. In itself, this is not
sufficient to justify selection of the case study method as Yin (2003) indicates that
methods including survey, archival analysis and history are also suitable methods
to adopt in this instance.
Benbasat et al. (1987) argue that research in the IS field has moved from
technological to managerial to organisational questions. In doing so, Benbasat et
al. (1987, 369) suggest that, as this transition occurs, there is more interest in the
interaction between context and innovations and that case research is:
“…particularly appropriate for certain types of problems: those in
which research and theory are at their early, formative stages, and
sticky, practice-based problems where the experiences of the actors
are important and the context of action is critical…”

Business Process Management: Progression and Maturity
- 2:43 -
This study positions BPM as an emerging domain, whereby understanding of the
term BPM is evolving from a narrow technological driven view, to a view
encompassing a managerial approach to processes and ultimately with a focus
managing the organisation itself. Consequently, the emergent state of BPM and
the organisational level of this study results in a focus on contemporary events in
accordance with Yin‟s (2003) criteria.
The combination of having a focus on contemporary events and control over
behavioural events however, is suited to a number of methods including case
study, survey and archival analysis. This led the Researcher to consider the form
of the research question, being the last of Yin‟s (2003) criteria.
This study addresses „how‟ questions, looking at how organisations progress
BPM and how to measure BPM Maturity. The study also incorporates „what‟
questions during the exploratory stage, looking at „what is going on‟ and „what
needs to be included‟. According to Yin (2003), this would exclude the case
study method as it is suited to „how‟ and „why‟ questions, leaving the survey and
archival analysis methods as the most appropriate to the study. Considering the
„form of research question‟ purely on „how and why‟ questions as proposed by
Yin (2003) is inconsistent with researchers in applied disciplines however.
Handfield and Melnyk (1999) indicate that questions such as „what is going on
here?‟, „what are the key issues?‟, „what is happening?‟ or „what are the key
variables?‟ are relevant to early stage research and are also well matched to use
of the case study method. Meredith (1998) also indicates case research is suited
for „what‟, „how‟ and „why‟ questions. Furthermore, Benbasat et al. (1987)
indicate that case study research is useful for capturing practical experiences, for
accumulating knowledge from the iterative trial and error process and for building
theory.
According to Eisenhardt (1989), case study research provides benefits to theory
building including a greater likelihood of translating contradictory or paradoxical
evidence into novel theory using creative insight. Similarly, Wacker (1998)
indicates that case research can act to increase virtues of good theory (such as
empirical riskiness as measurement of the constructs is likely during the theory-
building process) and the likelihood that the resultant theory is valid increases

Chapter 2 – Research Design
- 2:44 -
due to the intimate link between data and theory. Consequently, the case study
method is an appropriate choice of methods for the conduct of this study.
2.4.1.1 Plan for use of Case Study Method
Case studies can be both exploratory and explanatory. According to Yin (2003),
exploratory studies have a goal to develop hypotheses and propositions for
further inquiry whereas explanatory case studies are those that seek to address
operational linkages over time. As shown in Figure 7, the research design
proposes the use of the case study method at three distinct points to suit the
varying purposes of the study in both an exploratory and an explanatory manner.
Figure 7: Research Design
As shown in Figure 7 the research design first uses multiple case studies to
explore potential issues in the measurement of BPM Maturity within organisations
and to refine the conceptual model derived from extant literature. Next, the
design uses a single case study to explore BPM Progression from the frame of
the study at that point. The aim of the exploratory case study is to apply the
Stag
e 1
:Ex
plo
rato
ry F
act
Fin
din
g
Ch
apte
rs 3
& 4
Ch
apte
rs 5
& 6
Ch
apte
rs 7
-10
Literature
Refined Conceptual Model (RCM)
Initial Conceptual Model (ICM)
ICM
RCM
Exploratory Case Studies (x 2)
Extended Conceptual Model (ECM)
Review
Delphi Studies(x 6)
Literature and ECM Emergent BPM TheoryExemplary Case Study
(x 1)
OutputActivityInput
Emergent BPM TheoryWithin Case AnalysisCross Case Analysis
Longitudinal Case Studies
(x 5)
Stag
e 2
: Th
eory
Bu
ildin
g
Within Case AnalysisCross Case Analysis
Conceptual BPM Theory and
Measurement ModelReview and Theorising
Business Process Management: Progression and Maturity
- 2:45 -
extended conceptual model, to understand how the components of the model
interact in a practical setting, to articulate how these might come together in a
theory on BPM Progression and to understand how this interaction affects the
development of a BPM Maturity measurement model. Finally, design aims to
undertake multiple, longitudinal case studies to refine the emergent theory and
increase its generalisability.
The iterative use of case study research is consistent with recommendations of
researchers including Benbasat et al. (1987, 373) who state that:
“…single-case study projects are most useful at the outset of theory
generation (…) A single case used for exploration may be followed by
a multiple-case study. This corresponds to Bonoma‟s drift stage in
which researchers learn first hand the relevant jargon and context in
which the phenomenon will be studied (…) Multiple-case designs are
desirable when the intent of the research is description, theory
building…”
This integrated use of case study method is also similar to applications by
researchers in other applied disciplines such as proposals by Hirschman (1986)
and Bonoma (1985) including (1) a priori, theory-based hypotheses; (2)
systematic multiple case research; and (3) multiple independent evaluation
techniques.
2.4.1.2 Addressing the Limitations of the Case Study Method
Despite the suitability and strengths of case studies for the purpose of the study,
there are a number of potential limitations arising from the use of this method.
Eisenhardt (1989) suggests that building theory from case studies can result in
theory that is “novel, testable and empirically valid”, however, she cautions that it
can also lead to theory that is overly complex or conversely, narrow and
idiosyncratic. Wacker (1998) suggests that the art of theory building includes
balancing virtues such as parsimony and internal consistency. Meredith (1998)
identifies a number of other recognised limitations of the case study method
including:
Chapter 2 – Research Design
- 2:46 -
Physical requirements (cost, time, access)
Need for multiple sources of data collection
Lack of controls
Lack of familiarity with the process of conducting case studies.
The following sections discuss plans to address these limitations16.
Physical Requirements
Issues such as cost, time and access affect the selection of cases and the depth
of investigation that can be undertaken. Researchers aim to select cases in
accordance with carefully thought-out criteria, however, the reality is that a
balance between these criteria and the constraints of cost, time and access is
likely. In designing each of the three applications of the case study method, the
Researcher first defined the requirements that met the purposes of each
application. Due to the physical requirements, cases were then selected from a
known pool of organisations (i.e. participating organisations of the Australian
BPM Roundtable) using the defined requirements. An Information Sheet was
prepared that detailed the aims and background of the proposed case and
satisfied the ethical requirements of the study. The Researcher then used the
Information Sheet when inviting potential case organisations.
Need for Multiple Sources of Data Collection
Organisational level research (independent of the research discipline) is by its
nature complex. Jick (1979) advocates the use of multiple data collection
instruments to enable triangulation of data. Similarly, Eisenhardt (1989) suggests
that using multiple sources of data increases the reliability of findings arising from
case studies. In all applications of the case study method, the Researcher used
a combination of interviews, embedded surveys and the review of relevant
documentation to support findings. In the single exploratory study and the
multiple, longitudinal studies, the Researcher also used workshops.
16
Chapters 4, 6 and 7, together with their respective Appendices include further details on the instruments mentioned in these sections.

Business Process Management: Progression and Maturity
- 2:47 -
Lack of Controls
To control the conduct of the case studies and the quality of data collected, the
design incorporates a number of control mechanisms. This includes the use of
Interview and Workshop Guides, recording interviews and workshops where
possible, transcription of recordings, scheduling of interviews and workshops to
integrate first round data analysis thereby providing a check-point for data
interpretation, presentation of findings and interpretations in meetings, and
written reports in order to solicit feedback.
Lack of Familiarity with the Process of Conducting Case Studies
A number of researchers provide guidelines for undertaking theory building in
applied disciplines (Benbasat et al., 1987; Eisenhardt, 1989; Lee, 1989; Lynham,
2000). This study uses Eisenhardt‟s guidelines as they are specifically for
building theory from case study research, suited to emerging research areas and
synthesises research concepts from a range of researchers including Glaser and
Strauss (1967), Miles and Huberman (1984) and Yin (1981). Table 10
summaries the key activities and the eight steps in Eisenhardt‟s approach that
the Researcher applies to the case studies in this study17.
17
Chapters 4, 6 and 7 provide further details in the application of Eisenhardt‟s (1989) steps and key activities to each set of case studies in this study.
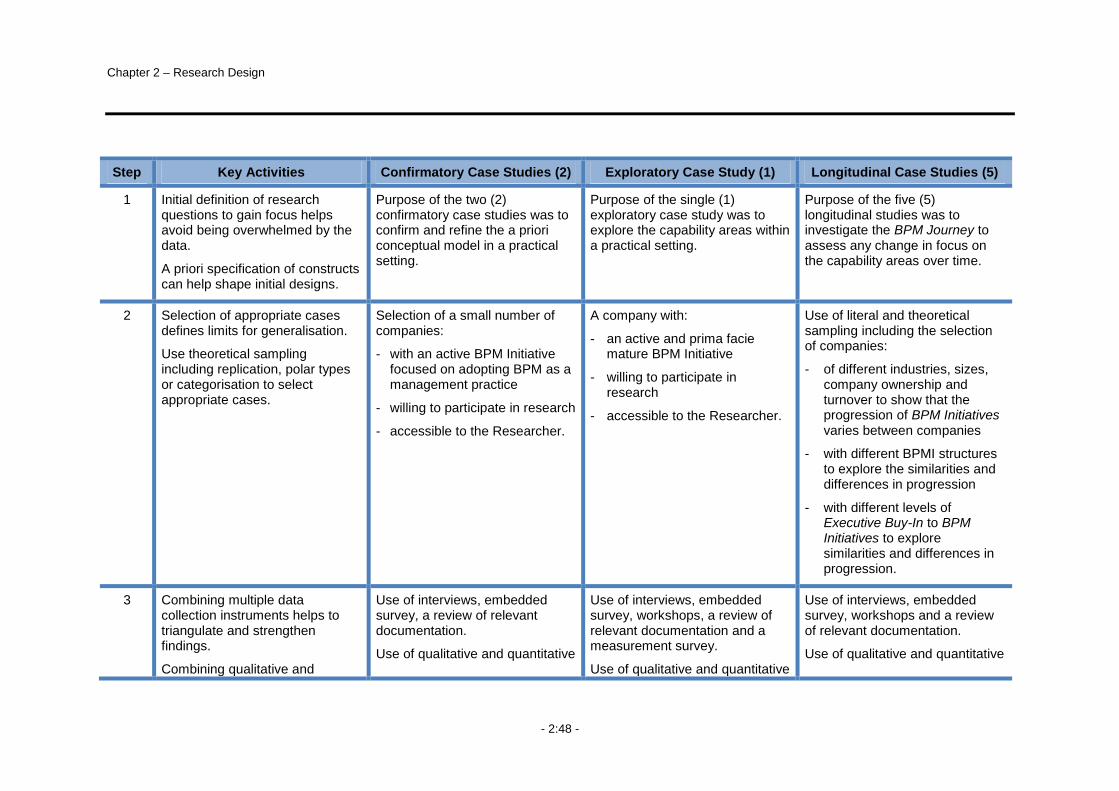
Chapter 2 – Research Design
- 2:48 -
Step Key Activities Confirmatory Case Studies (2) Exploratory Case Study (1) Longitudinal Case Studies (5)
1 Initial definition of research questions to gain focus helps avoid being overwhelmed by the data.
A priori specification of constructs can help shape initial designs.
Purpose of the two (2) confirmatory case studies was to confirm and refine the a priori conceptual model in a practical setting.
Purpose of the single (1) exploratory case study was to explore the capability areas within a practical setting.
Purpose of the five (5) longitudinal studies was to investigate the BPM Journey to assess any change in focus on the capability areas over time.
2 Selection of appropriate cases defines limits for generalisation.
Use theoretical sampling including replication, polar types or categorisation to select appropriate cases.
Selection of a small number of companies:
- with an active BPM Initiative focused on adopting BPM as a management practice
- willing to participate in research
- accessible to the Researcher.
A company with:
- an active and prima facie mature BPM Initiative
- willing to participate in research
- accessible to the Researcher.
Use of literal and theoretical sampling including the selection of companies:
- of different industries, sizes, company ownership and turnover to show that the progression of BPM Initiatives varies between companies
- with different BPMI structures to explore the similarities and differences in progression
- with different levels of Executive Buy-In to BPM Initiatives to explore similarities and differences in progression.
3 Combining multiple data collection instruments helps to triangulate and strengthen findings.
Combining qualitative and
Use of interviews, embedded survey, a review of relevant documentation.
Use of qualitative and quantitative
Use of interviews, embedded survey, workshops, a review of relevant documentation and a measurement survey.
Use of qualitative and quantitative
Use of interviews, embedded survey, workshops and a review of relevant documentation.
Use of qualitative and quantitative
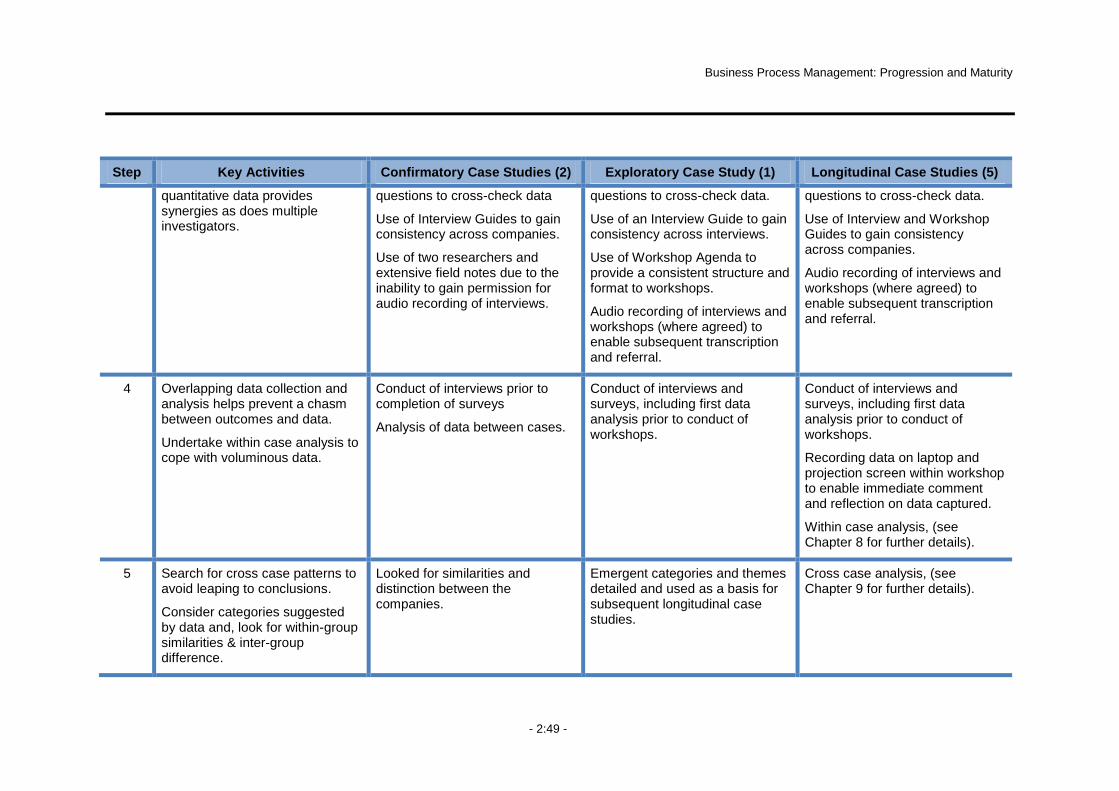
Business Process Management: Progression and Maturity
- 2:49 -
Step Key Activities Confirmatory Case Studies (2) Exploratory Case Study (1) Longitudinal Case Studies (5)
quantitative data provides synergies as does multiple investigators.
questions to cross-check data
Use of Interview Guides to gain consistency across companies.
Use of two researchers and extensive field notes due to the inability to gain permission for audio recording of interviews.
questions to cross-check data.
Use of an Interview Guide to gain consistency across interviews.
Use of Workshop Agenda to provide a consistent structure and format to workshops.
Audio recording of interviews and workshops (where agreed) to enable subsequent transcription and referral.
questions to cross-check data.
Use of Interview and Workshop Guides to gain consistency across companies.
Audio recording of interviews and workshops (where agreed) to enable subsequent transcription and referral.
4 Overlapping data collection and analysis helps prevent a chasm between outcomes and data.
Undertake within case analysis to cope with voluminous data.
Conduct of interviews prior to completion of surveys
Analysis of data between cases.
Conduct of interviews and surveys, including first data analysis prior to conduct of workshops.
Conduct of interviews and surveys, including first data analysis prior to conduct of workshops.
Recording data on laptop and projection screen within workshop to enable immediate comment and reflection on data captured.
Within case analysis, (see Chapter 8 for further details).
5 Search for cross case patterns to avoid leaping to conclusions.
Consider categories suggested by data and, look for within-group similarities & inter-group difference.
Looked for similarities and distinction between the companies.
Emergent categories and themes detailed and used as a basis for subsequent longitudinal case studies.
Cross case analysis, (see Chapter 9 for further details).

Chapter 2 – Research Design
- 2:50 -
Step Key Activities Confirmatory Case Studies (2) Exploratory Case Study (1) Longitudinal Case Studies (5)
6 Look for tentative themes, concepts and possible relationships.
Iteratively compare emergent theory to each case.
Refine constructs and measures.
Looked for conceptual issues that were likely to affect the progression and measurement of BPM Initiatives.
Refined constructs in the a priori model.
Identified the need to undertake further research relating to measures.
Emergent categories and themes detailed and used as a basis for subsequent longitudinal case studies.
Emergent themes included throughout Chapters 8 and 9.
These themes consolidate in the Theory Building chapter (i.e. Chapter 10).
7 Compare emergent theories with extant literature.
Examine conflicting literature for creative insights.
Examine similar literature in other contexts to elevate conceptual level of findings and confidence.
Revisited mapping of initial constructs identified from extant literature.
Refined constructs on this basis.
Targeted literature review to explore and identify extant theories that were potentially useful for explaining emergent themes.
Use of these theories in the design of subsequent longitudinal studies.
Use of punctuated equilibrium to explain theory on BPM Progression.
Development of BPM Typology to position BPM Initiatives using Porters Productivity Frontiers.
(see Chapter 10 for further details).
8 Stop adding cases upon theoretical saturation. i.e. where incremental learning is minimal.
Stop iterating between data and theory at the point where incremental improvement is minimal.
Two cases showed the need for identification of additional measures, resulting in a subsequent series of Delphi studies.
Only one case as emergent themes formed the basis for subsequent .
Includes 5 cases to extend and confirm findings from earlier case studies and enable the proposal of a theory on BPM Progression and a measurement model for BPM Maturity.
Provides direction for future research to continue refinement of the theory and measurement model.
Table 10: Building Theory from Case Study

Business Process Management: Progression and Maturity
- 2:51 -
2.4.2 Survey
In addition to building theory, an aim of this study is to propose a conceptual
measurement model for BPM Maturity. This introduces a positivistic aspect to
the study, reflecting a focus on the identification and definition of constructs for
use within a measurement model. This aspect, combined with the desire to
develop a theory that was somewhat generalisable, indicates that the use of
survey to complement the case study method would be beneficial to the study.
According to Pinsonneault and Kraemer (1993), surveys are a means of
collecting data from individuals using a predefined questionnaire. Fink and
Kosecoff (1985) suggest that surveys can be administered on-line, via face-to-
face or telephone interview or in a written document. Although mostly used in
quantitative studies, Colorado State University (2004) and Pinsonneault and
Kraemer (1993) claim surveys can also apply to qualitative studies. Similarly,
Newsted et al. (1998) suggest two purposes to which surveys are well suited: (1)
to gather data from large population and (2) where there is little theory.
Pinsonneault and Kraemer (1993, 77) make an important distinction between
surveys and survey research whereby surveys are a means of collecting data
from a population (i.e. a data collection instrument) and survey research aims to
advance scientific knowledge. In doing so, they distinguish between three types
of survey research being exploration, description or explanation whereby:
Exploratory Used to discover and refine measurement concepts and as a
precursor to more detailed descriptive or explanatory
surveys (Pinsonneault & Kraemer, 1993, 79).
Descriptive Used to discover facts about what is happening but not to
test theory (Pinsonneault & Kraemer, 1993, 80).
Explanatory18 Used to test theory and causal relationships (Pinsonneault &
Kraemer, 1993, 80).
18
Also known as confirmatory or theory testing survey research (Forza, 2002).
Chapter 2 – Research Design
- 2:52 -
Based on Newsted et al.‟s (1998) assertion of suitability for situations where
there is little theory, and Pinsonneault and Kraemer‟s (1993) definitions, this
study proposes the use of an exploratory survey research to extend the
conceptual a priori model derived from extant literature and refined using case
studies, as shown earlier in Figure 7.
In particular, the focus of the survey research in this study is to gain a better
understanding of the constructs of the a priori model, including the definition and
measurement of these. Forza (2002, 155) affirms the suitability of exploratory
survey research to studies such as this stating:
“…Exploratory survey research takes place during the early stages of
research into a phenomenon, when the objective is to gain
preliminary insight on a topic, and provides the basis for more in-
depth study. Usually there is no model, and concepts of interest
need to be better understood and measured. In the preliminary
stages, exploratory survey research can help to determine the
concepts to be measured in relation to the phenomenon of interest,
how best to measure them, and how to discover new facets of the
phenomenon under study. Subsequently, it can help to uncover or
provide preliminary evidence of association among concepts. Later
again, it can help to explore the valid boundary of a theory…”
This study has a number of elements that the design of the exploratory survey
research needs to address. First, there is the inconsistent use of terminology
and a lack of common language. This affects the definition of a unit of analysis,
the choice of participants and the sample size. In this instance, where even the
definition of BPM varies, the survey research needs to provide a mechanism for
making group decisions in a structured and objective manner to overcome and
agree on fundamental concepts and definitions. Second, there is the desire to
balance rigour and relevance, suggesting the inclusion of both academia and
practitioner input.
Business Process Management: Progression and Maturity
- 2:53 -
2.4.2.1 Delphi Technique
In an attempt to stop the control of decision-making being through interpersonal
interactions such as dominating personalities and an unwillingness to change a
publicly held position, the Rand Corporation developed the Delphi Technique in
the 1950s. Since that time, the Delphi Technique has become a recognised
method of survey research, traditionally used for forecasting and for adding
structure to discussion and group opinion (Goodman, 1987; Okoli & Pawlowski,
2004). Furthermore, Okoli and Pawlowski (2004) indicate that the Delphi
Technique is well suited to concept/framework development.
Use of the Delphi Technique is beneficial when (1) dealing with complex issues
(Ono & Wedemeyer, 1994); and (2) where there is a lack of empirical evidence
(Murphy et al., 1998). In particular, the Delphi Technique, and its inherent focus
on seeking consensus between experts, can facilitate overcoming the
idiosyncratic structure of a model. Other features of the Delphi Technique
include:
Anonymity leads to more creative outcomes and adds richness to data
(van de Ven & Delbecq, 1974)
Issues inherent in face-to-face groups such as dominate personalities,
conflict and group pressures are virtually eliminated (Murphy et al., 1998)
Geographic boundaries and associated travel and co-ordination factors
are essentially removed (Okoli & Pawlowski, 2004).
Furthermore, Okoli and Pawlowski (2004) indicate that a carefully designed
Delphi study is valuable for theory building. In particular, they state that the
Delphi Technique provides a number of benefits to theory building including:
Assisting in the selection of factors with the strongest effect
Increasing the generalisability of the theory
Asking respondents to justify their reasoning
Contributing to construct validity by validating initial responses and
clarifying definitions.
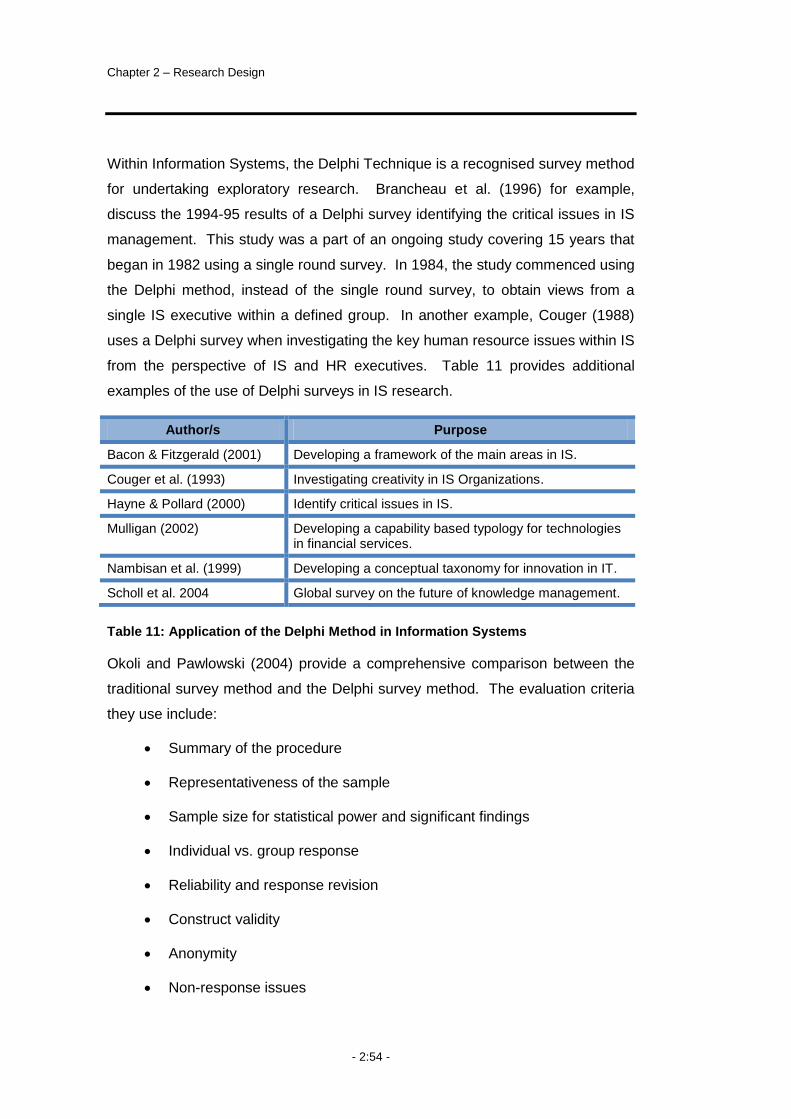
Chapter 2 – Research Design
- 2:54 -
Within Information Systems, the Delphi Technique is a recognised survey method
for undertaking exploratory research. Brancheau et al. (1996) for example,
discuss the 1994-95 results of a Delphi survey identifying the critical issues in IS
management. This study was a part of an ongoing study covering 15 years that
began in 1982 using a single round survey. In 1984, the study commenced using
the Delphi method, instead of the single round survey, to obtain views from a
single IS executive within a defined group. In another example, Couger (1988)
uses a Delphi survey when investigating the key human resource issues within IS
from the perspective of IS and HR executives. Table 11 provides additional
examples of the use of Delphi surveys in IS research.
Author/s Purpose
Bacon & Fitzgerald (2001) Developing a framework of the main areas in IS.
Couger et al. (1993) Investigating creativity in IS Organizations.
Hayne & Pollard (2000) Identify critical issues in IS.
Mulligan (2002) Developing a capability based typology for technologies in financial services.
Nambisan et al. (1999) Developing a conceptual taxonomy for innovation in IT.
Scholl et al. 2004 Global survey on the future of knowledge management.
Table 11: Application of the Delphi Method in Information Systems
Okoli and Pawlowski (2004) provide a comprehensive comparison between the
traditional survey method and the Delphi survey method. The evaluation criteria
they use include:
Summary of the procedure
Representativeness of the sample
Sample size for statistical power and significant findings
Individual vs. group response
Reliability and response revision
Construct validity
Anonymity
Non-response issues
Business Process Management: Progression and Maturity
- 2:55 -
Attrition effects
Richness of data.
Consequently, the Delphi Technique is an appropriate method for the exploratory
survey for a number of reasons. First, the iterative process of controlled
feedback will assist in refining and clarifying terminology issues and exploring
complex issues such as the identification of measurement items for BPM.
Second, the anonymity of experts will enable exploration of potentially
contentious issues such as the definition of factors contained in the conceptual
model, without undue influence of dominant personalities. Third, the ability to
access different geographic areas using electronic medium and without
significant cost will enable the inclusion of experts from a number of regions thus
increasing the generalisability of outcomes. Fourth, it enables the relative
importance of items to be determined in a group environment.
2.4.2.2 Addressing the Limitations of the Delphi Technique
There are a number of recognised criticisms of the Delphi Technique including:
Flexible nature of Delphi study design (van de Ven & Delbecq, 1974)
Discussion course is determined by the researchers (Dalkey & Helmer,
1963)
Accuracy and validity of outcomes (Ono & Wedemeyer, 1994).
Whilst these disadvantages arguably apply to some degree to many research
methods, the study aims to minimise their potential impact in a number of ways.
These include: (1) designing a plan for the Delphi Study; (2) using a Coding
Team to analyse data; and (3) applying Lincoln and Guba‟s (1985) criteria for
assessing qualitative research.
Delphi Study Plan
In a similar way to how Yin (1994) applies a protocol to conducting case studies,
the Researcher developed a detailed plan for conducting the Delphi studies. In
doing so, the aim was to introduce rigour to the application of the Delphi
Technique without inhibiting the qualitative nature of the data collection.

Chapter 2 – Research Design
- 2:56 -
Chapter 5 presents details of this plan however, Table 12 provides a summary of
Forza‟s (2002, 188) elements of effective exploratory surveys including how the
Researcher applied these elements in the design of the Delphi Studies.
Survey Element Exploratory Survey Delphi Study Design
Unit(s) of Analysis Clearly defined. BPM as a management practice.
Respondents Representative of the unit of analysis.
Participants invited from academia and industry.
Participants active in BPM research or in progressing BPM Initiatives within organisations.
Participants invited from a number of different regions.
Research Hypotheses
Not necessary. No research hypotheses.
Aims to extend the refined conceptual model by:
Agreeing common definitions of constructs
Identifying potential measurement items.
Representativeness of Sample Frame
Approximation. Inclusion of academic and industry experts from a number of different geographic areas to reflect the practice of BPM within organisations and contemporary BPM research.
Representativeness of the Sample
Not a criterion. N/a
Sample Size Sufficient to include the range of the interest phenomena.
Size of the sample in keeping with recommendations from other Delphi studies.
Pre-test of Questionnaires
With sub-sample of sample.
Questions tested on colleagues practicing BPM in industry and researching BPM in academia.
Response Rate No minimum. Endeavour to maintain participation above recommended levels for Delphi studies.
Invite and commence the study with more than required number of experts to account for expected attrition.
Use pilot study to streamline conduct of study and gain input from Expert Panel into timing and scheduling.
Use follow-up email reminders in each round.
Table 12: Requirements of Exploratory Survey

Business Process Management: Progression and Maturity
- 2:57 -
Use of a Coding Team
To limit the potential for bias from the Researcher being the sole coder and co-
ordinator of data, a Coding Team analysed data. In addition to the Researcher,
this team included two other individuals, each with an extensive knowledge of
BPM and a PhD in Information Systems. The Coding Team were not:
1. Able to participate in the expert panel at any stage
2. Aware of the identity of expert panel members
3. Advised of any demographic details of the expert panel members19.
In addition, the Coding Team were required to code responses independently
prior to consolidating the responses as a team. In this way, the discussion
course of the Delphi studies was less controlled by the Researcher and more
driven by the outcomes of the Expert Panel and the independent data analysis.
2.5 Data: Validity and Reliability
According to Leedy and Ormrod (2001, 31), validity of data considers whether the
data collected measures what the researcher set out to measure while reliability
requires consistency in the data. The focus of this study was exploratory,
investigating a complex phenomenon in an organisational setting, likely to result
in large volumes of qualitative data. Specific to qualitative data, Lincoln and
Guba (1985) propose alternative criteria being credibility, transferability,
dependability and confirmability where:
Credibility involves ensuring the results of the research are credible
from the perspective of research participants.
Transferability is the degree to which an individual can transfer the
results to other settings and contexts. Lincoln and Guba see this as the
responsibility of the individual doing the transferring but recommend
providing detailed descriptions of the context and assumptions to assist
in making such as a judgement.
19
Points 2 and 3 did not apply to the Principal Researcher.
Chapter 2 – Research Design
- 2:58 -
Dependability accounts for the fact that it will not be possible to
replicate or repeat the same context in another study by providing
detailed descriptions of the changing context and circumstances in
which each study was undertaken.
Confirmability is the extent to which the results can be supported and
collaborated by others and could include documenting data to enable
checking by participants prior to analysis.
This study applied Lincoln and Guba‟s criteria, due to the predominance of
qualitative data. There were instances where the collected data was quantitative
in nature (e.g. using surveys within the case studies to triangulate data and
findings). At these times, the purpose of the data and data analysis was more
descriptive than statistical.
In addition, to strengthen findings from the study the integrity and reliability of the
data use of triangulation enhanced the data analysis (Eisenhardt, 1989;
Handfield & Melnyk, 1998; Jick, 1979). To this end, all case studies used a
combination of data collection instruments including interviews, workshops,
surveys/questionnaires and documentation review.
2.5.1.1 Case Studies
Although there are three distinctive applications of case study, each with a
unique purpose, the approach to ensuring high levels of validity and reliability
was similar across the studies.
To ensure credibility of results, the basis for selecting organisations was primarily
their interest in, and practice of BPM. In the case of the longitudinal studies,
discussion of additional aspects that are important to achieving theoretical and
literal replication will occur within later chapters. Identification of potential
organisations was from participation in BPM forums, BPM network groups, BPM
consulting referrals or those known to the researchers through other means. The
designation of a Key Contact that held a senior BPM position assisted in the
selection of individuals for participation in the case studies to ensure the selection
of the most appropriate individuals for the purpose of the studies. The

Business Process Management: Progression and Maturity
- 2:59 -
Researcher advised participants of her background and experience, a summary
of the research, the ethical requirements that apply to the study and the aims of
the current phase of the study including their role in it.
To assist transferability the Researcher detailed the background and context of
the case studies and the participating organisations whenever discussing the
results and outcomes of the study. In doing this the Researcher relied on a
combination of publicly available information (e.g. annual reports and websites)
and data collected during the case studies, either during the interviews or using
the survey instruments described earlier.
To assist with the dependability multiple data collection instruments guided the
data collection process. The Researcher derived interview, workshop and survey
questions from key issues and themes identified in existing literature or from pre-
validated questions, where possible. Interview or Workshop Guides documented
questions for use when conducting the interviews and workshops to enable
consistency across applications. The views captured were the personal views of
participants. Survey questions supported the qualitative data collected during the
interviews and workshops.
Recording and transcribing interviews and workshops (where permitted)
improved the confirmability of results by providing an opportunity to review the
conversations verbatim rather than relying on an abbreviated text format. Where
not able to record, the Researcher used a second researcher (where possible) to
assist in note taking to enable crosschecking of key points. Participants received
a summary of case study outcomes in the form of a presentation, a report or
both. Participants were encouraged to provide feedback throughout the case
studies, including on any final presentations or reports. Data analysis included
the use of software tools such as N-Vivo where appropriate. The Researcher
undertook both structured and unstructured training to ensure appropriate skills
for using data analysis tools.

Chapter 2 – Research Design
- 2:60 -
2.5.1.2 Delphi Studies
Inviting Delphi study participants who are experts in the BPM domain increased
the credibility of results. The study invited academics, authors and industry
representatives with a high level of BPM experience and knowledge to participate
on the basis that their views were representative of contemporary BPM issues.
Furthermore, a Coding Team from three different geographic regions:
Australasia, Europe and the United States minimised the impact of any cultural
inferences with respect to wording during data analysis.
To assist with the transferability and dependability of results arising from the
Delphi studies a comprehensive documentation process was undertaken. The
Researcher communicated the outcomes of each Delphi Study round back to the
Panel using a consistent format. This included a summary of key points arising
from the past round and the data analysis outcomes of the current round. This
also disclosed mapping of all items during the data analysis process to enable
transparency, with the Expert Panel being able to follow their contributions
through to the presented outcomes. Such transparency enables other
researchers to understand the context and any assumptions made during the
data collection and analysis stages.
A number of methods contributed to the confirmability of results. First, a team of
independent coders used a consensus model when analysing data collected
during each round of the Delphi Studies. Each coder analysed the data
independently before meeting with the other coders. The Coding Team then
conferred and reached agreement before presenting the data analysis outcomes
back to the Expert Panel for review. The Expert panel rated and commented
upon the presented outcomes. The Coding Team used this feedback to improve
upon the data analysis and outcomes. This iterative cycle continued until
reaching predetermined criteria. At the completion of all Delphi studies, two
reports were prepared – a Delphi Study Executive Summary and Delphi Study
Series Summary. All participants of the Delphi study (including coders) had the
opportunity to provide feedback and comment on both reports.

Business Process Management: Progression and Maturity
- 2:61 -
2.6 Chapter Summary
This chapter presented the overall research design and justified its suitability for
this study. This section summarises the major aspects of the research design by
showing how the methods selected, the use of multi-methods and the overall
research design work together to provide strong and insightful research that
makes a valuable contribution to the BPM body of knowledge.
The aim of this research was to contribute to BPM research by proposing theory
on the progression of BPM within organisations. In this instance, the „how‟ is
pragmatic in that the study explores the journey of BPM Initiatives within
organisations rather than looking at specifically how (i.e. the strategies adopted
to make the journey occur) or why (i.e. the reasons why a particular strategy was
used in favour of another) a BPM Initiative has occurred within each organisation.
Due to a lack of appropriate, organisational level theory and inconsistent use of
terminology and language in the BPM domain, it was necessary to gain a deeper
understanding of BPM before being able to articulate BPM theory.
Consequently, the research design presents in two distinct stages whereby (1)
aimed to deepen the understanding of BPM as a discipline and at an
organisational level and (2) aimed to develop theory on BPM Progression and
propose a measurement model for BPM Maturity.
The first stage of the research included an extensive literature review to develop
the Initial Conceptual Model. This model was then refined in two case studies
with companies that had active BPM Initiatives. The Researcher then conducted
a series of Delphi studies to extend the conceptual model an increase the
understanding of how to measure the BPM factors. The Researcher then applied
the findings from the Delphi study in a practical setting in a single case study to
understand what was important to BPM Progression.
The second stage of the research included a series of longitudinal studies
designed to build upon the findings from the first stage. In doing so, the
Researcher aimed to increase the generalisability of the emerging theory
integrating the critical aspects identified throughout the study.


STAGE 1
Exploring the BPM Domain

Business Process Management: Progression and Maturity
- 3:65 -
3 Literature Review
onducting a literature review is essential to any program of research as
it provides an assimilation of extant literature, builds knowledge within
the researcher, and assists in positioning and scoping the research
(Leedy & Ormrod, 2001). In a thesis, the literature often appears as a single
phase, positioning the study. The reality is the literature review occurs
throughout the duration of a study. In an exploratory study, as new findings
emerge, there is a need to revisit and extend the literature review in order to
make sense of the findings. Furthermore, as many studies occur over an
extended time, there is the possibility of new publications that may be pertinent to
the case at hand. Consequently, there is a need to keep abreast of academic
and practitioner literature throughout all stages of the research. This study
involved multiple, targeted literature reviews to suit the purpose of the different
stages including:
Chapter 1: Problem statement and justification
Chapter 2: Research design including method selection
Chapter 3: Domain exploration including conceptual model building
Chapter 6: Capability area knowledge for instrument design
Chapter 10: Theory building.
3.1 Chapter Outline
The structure of this chapter is as follows. Section 2 provides a discussion of key
terms within the BPM domain. Section 3 details the development of the initial
C
Chapter 3 – Literature Review
- 3:66 -
conceptual model. Section 4 provides details of the investigation into the
measurement of BPM Maturity including a review and evaluation of select
measurement models. Section 5 presents early insights into the
operationalisation of the conceptual model. Section 6 presents a summary of the
chapter.
3.2 BPM Terminology
In Chapter 1, the Researcher contends that BPM is an emerging domain
whereby the inconsistent use of terminology or a lack of a common language
presents a number of issues for research. From a literature perspective,
inconsistent use of terminology makes comparing and contrasting extant
literature more complex as the exact meaning of a term, as used within an article,
may be open to interpretation. Pritchard and Armistead (1999, 14) highlight the
importance of addressing terminology issues, finding in their study of BPM within
organisations that:
“...a lack of understanding of BPM was regarded as the biggest
difficulty for organisations in the early stages of adopting a process
approach…”
Consequently, this section explores and clarifies BPM terms relevant to this
study.
3.2.1 Definitions of Process
An integral component of BPM is the concept of a process. Nickols (1998)
indicates that a difficulty in defining processes is that, to some, virtually anything
within an organisation can qualify as a process making the interpretation of a
process essentially meaningless. Within this study, understanding the potential
interpretations of the term process is important, as the Researcher uses the term
in data collection instruments within the case studies. In this case, understanding
whether the participating organisation‟s use of the term is consistent with the
Researcher‟s use avoids ambiguity within the data.
Hammer (2001) defines a process as an organised group of related activities that
together create customer value. Hammer indicates that the focus in a process is
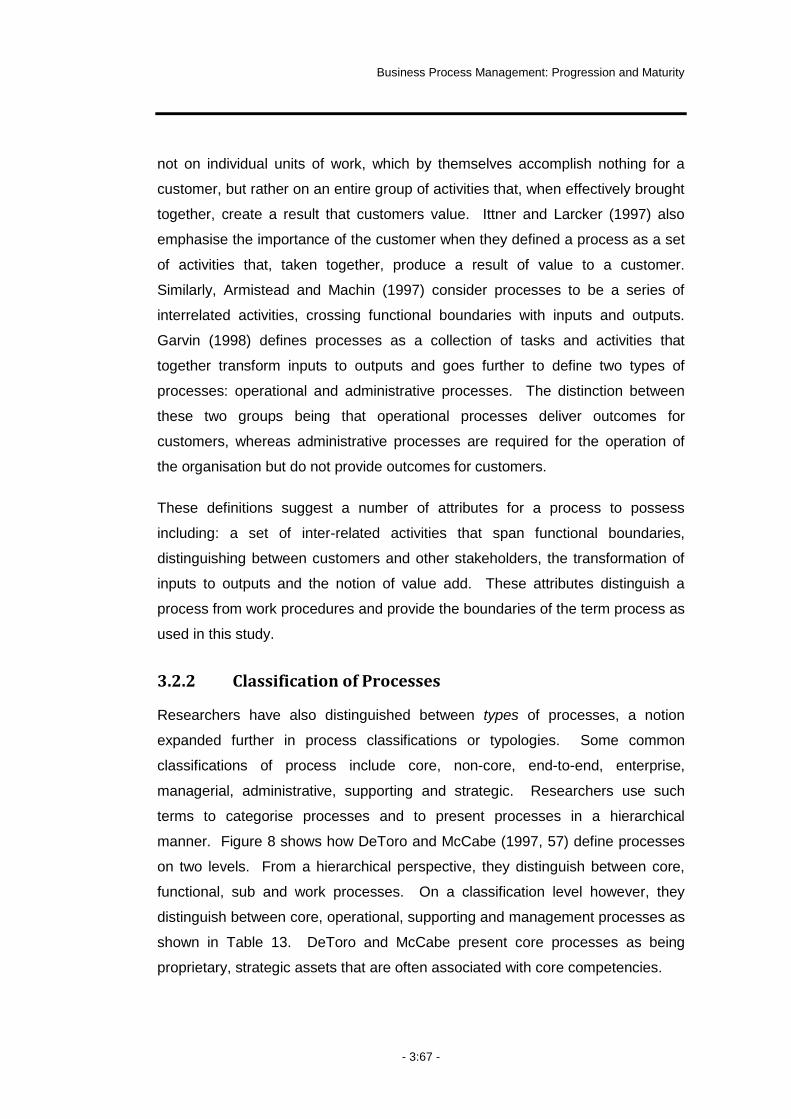
Business Process Management: Progression and Maturity
- 3:67 -
not on individual units of work, which by themselves accomplish nothing for a
customer, but rather on an entire group of activities that, when effectively brought
together, create a result that customers value. Ittner and Larcker (1997) also
emphasise the importance of the customer when they defined a process as a set
of activities that, taken together, produce a result of value to a customer.
Similarly, Armistead and Machin (1997) consider processes to be a series of
interrelated activities, crossing functional boundaries with inputs and outputs.
Garvin (1998) defines processes as a collection of tasks and activities that
together transform inputs to outputs and goes further to define two types of
processes: operational and administrative processes. The distinction between
these two groups being that operational processes deliver outcomes for
customers, whereas administrative processes are required for the operation of
the organisation but do not provide outcomes for customers.
These definitions suggest a number of attributes for a process to possess
including: a set of inter-related activities that span functional boundaries,
distinguishing between customers and other stakeholders, the transformation of
inputs to outputs and the notion of value add. These attributes distinguish a
process from work procedures and provide the boundaries of the term process as
used in this study.
3.2.2 Classification of Processes
Researchers have also distinguished between types of processes, a notion
expanded further in process classifications or typologies. Some common
classifications of process include core, non-core, end-to-end, enterprise,
managerial, administrative, supporting and strategic. Researchers use such
terms to categorise processes and to present processes in a hierarchical
manner. Figure 8 shows how DeToro and McCabe (1997, 57) define processes
on two levels. From a hierarchical perspective, they distinguish between core,
functional, sub and work processes. On a classification level however, they
distinguish between core, operational, supporting and management processes as
shown in Table 13. DeToro and McCabe present core processes as being
proprietary, strategic assets that are often associated with core competencies.
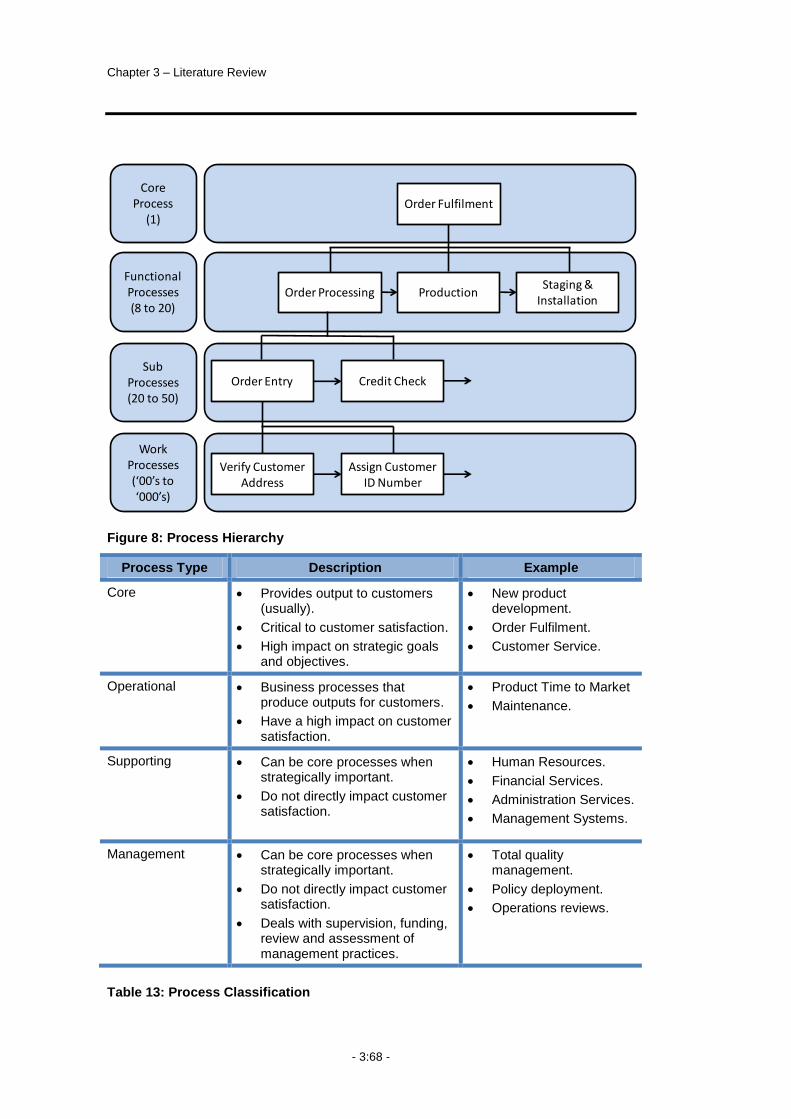
Chapter 3 – Literature Review
- 3:68 -
Figure 8: Process Hierarchy
Process Type Description Example
Core Provides output to customers (usually).
Critical to customer satisfaction.
High impact on strategic goals and objectives.
New product development.
Order Fulfilment.
Customer Service.
Operational Business processes that produce outputs for customers.
Have a high impact on customer satisfaction.
Product Time to Market
Maintenance.
Supporting Can be core processes when strategically important.
Do not directly impact customer satisfaction.
Human Resources.
Financial Services.
Administration Services.
Management Systems.
Management Can be core processes when strategically important.
Do not directly impact customer satisfaction.
Deals with supervision, funding, review and assessment of management practices.
Total quality management.
Policy deployment.
Operations reviews.
Table 13: Process Classification
Core Process
(1)
Functional Processes(8 to 20)
Sub Processes (20 to 50)
Work Processes (‘00’s to ‘000’s)
Order Fulfilment
Staging & Installation
Order Processing Production
Order Entry Credit Check
Verify Customer Address
Assign Customer ID Number
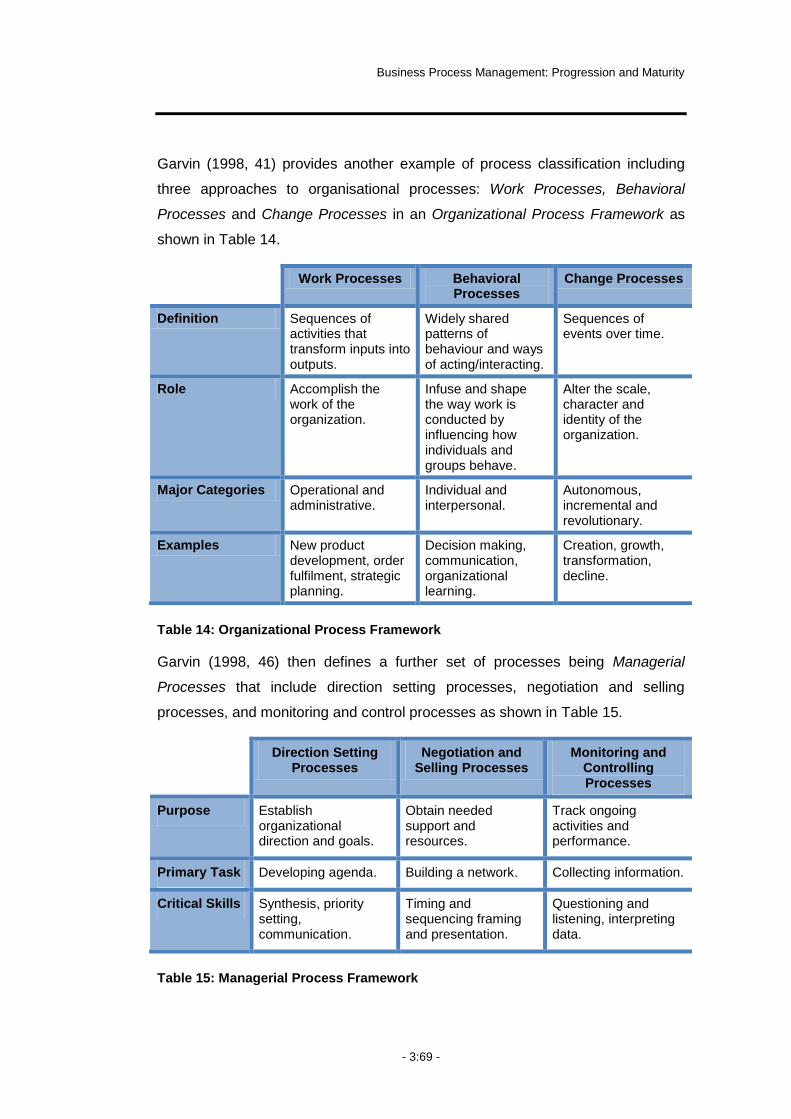
Business Process Management: Progression and Maturity
- 3:69 -
Garvin (1998, 41) provides another example of process classification including
three approaches to organisational processes: Work Processes, Behavioral
Processes and Change Processes in an Organizational Process Framework as
shown in Table 14.
Work Processes Behavioral Processes
Change Processes
Definition Sequences of activities that transform inputs into outputs.
Widely shared patterns of behaviour and ways of acting/interacting.
Sequences of events over time.
Role Accomplish the work of the organization.
Infuse and shape the way work is conducted by influencing how individuals and groups behave.
Alter the scale, character and identity of the organization.
Major Categories Operational and administrative.
Individual and interpersonal.
Autonomous, incremental and revolutionary.
Examples New product development, order fulfilment, strategic planning.
Decision making, communication, organizational learning.
Creation, growth, transformation, decline.
Table 14: Organizational Process Framework
Garvin (1998, 46) then defines a further set of processes being Managerial
Processes that include direction setting processes, negotiation and selling
processes, and monitoring and control processes as shown in Table 15.
Direction Setting Processes
Negotiation and Selling Processes
Monitoring and Controlling Processes
Purpose Establish organizational direction and goals.
Obtain needed support and resources.
Track ongoing activities and performance.
Primary Task Developing agenda. Building a network. Collecting information.
Critical Skills Synthesis, priority setting, communication.
Timing and sequencing framing and presentation.
Questioning and listening, interpreting data.
Table 15: Managerial Process Framework
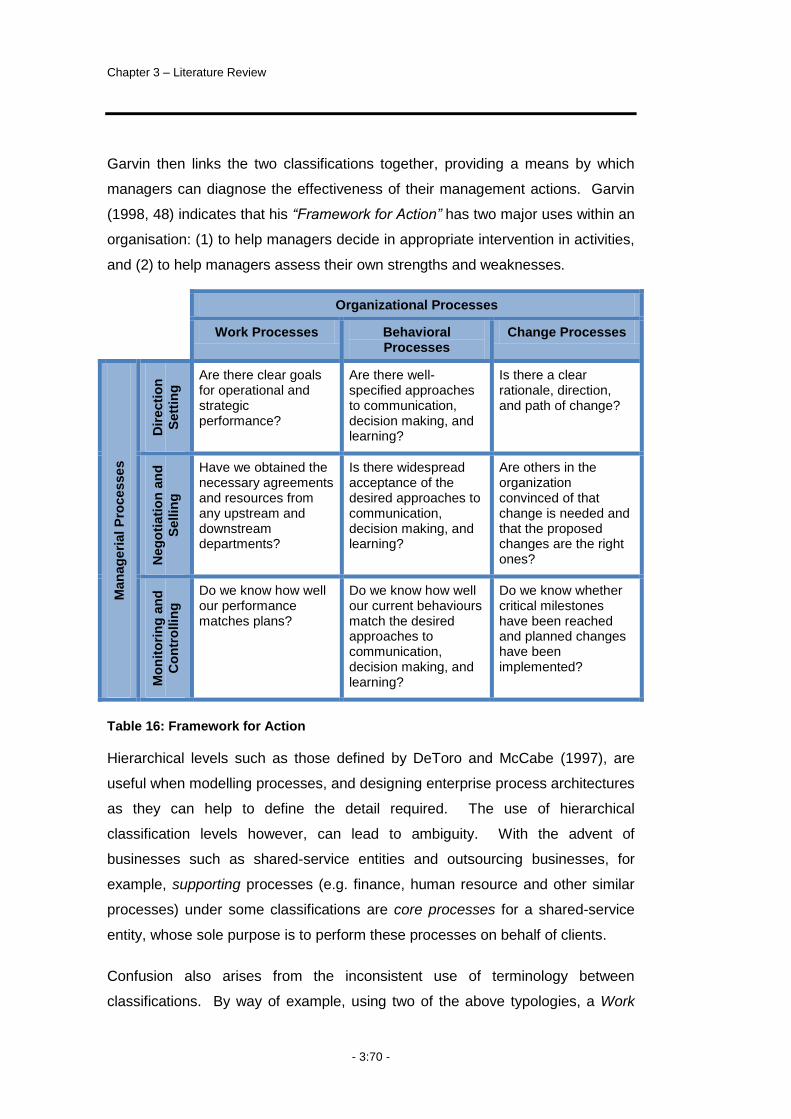
Chapter 3 – Literature Review
- 3:70 -
Garvin then links the two classifications together, providing a means by which
managers can diagnose the effectiveness of their management actions. Garvin
(1998, 48) indicates that his “Framework for Action” has two major uses within an
organisation: (1) to help managers decide in appropriate intervention in activities,
and (2) to help managers assess their own strengths and weaknesses.
Organizational Processes
Work Processes Behavioral Processes
Change Processes
Man
ag
eri
al
Pro
ce
sse
s
Dir
ecti
on
Sett
ing
Are there clear goals for operational and strategic performance?
Are there well-specified approaches to communication, decision making, and learning?
Is there a clear rationale, direction, and path of change?
Neg
oti
ati
on
an
d
Sellin
g
Have we obtained the necessary agreements and resources from any upstream and downstream departments?
Is there widespread acceptance of the desired approaches to communication, decision making, and learning?
Are others in the organization convinced of that change is needed and that the proposed changes are the right ones?
Mo
nit
ori
ng
an
d
Co
ntr
ollin
g
Do we know how well our performance matches plans?
Do we know how well our current behaviours match the desired approaches to communication, decision making, and learning?
Do we know whether critical milestones have been reached and planned changes have been implemented?
Table 16: Framework for Action
Hierarchical levels such as those defined by DeToro and McCabe (1997), are
useful when modelling processes, and designing enterprise process architectures
as they can help to define the detail required. The use of hierarchical
classification levels however, can lead to ambiguity. With the advent of
businesses such as shared-service entities and outsourcing businesses, for
example, supporting processes (e.g. finance, human resource and other similar
processes) under some classifications are core processes for a shared-service
entity, whose sole purpose is to perform these processes on behalf of clients.
Confusion also arises from the inconsistent use of terminology between
classifications. By way of example, using two of the above typologies, a Work
Business Process Management: Progression and Maturity
- 3:71 -
Process according to Garvin (1998) does not equate to a Work Process using
DeToro and McCabe‟s (1997) classification. Rather, it would equate to DeToro
and McCabe‟s Core Process or perhaps their Operational Process. Similarly,
Pritchard and Armistead (1999) refer to processes as Operational, Supporting or
Direction Setting. These appear to be similar to DeToro and McCabe‟s (1997)
Operational, Supporting and Management classifications, although Pritchard and
Armistead make no distinction of Core processes, which is included in DeToro
and McCabe‟s classification.
Within this study, the Researcher used the terms core and non-core processes in
the development of survey questions piloted during early case studies. This was
in an attempt to distinguish the processes within an organisation when measuring
the progression of the BPM Initiative and to ensure the comparison of the same
processes within different organisations. The use of these terms however
created confusion amongst participants and created replication in survey
questions. Consequently, during the exploratory case study, the Researcher
sought input into how to improve this approach and therefore gain consistency in
the data captured across organisations that may use different terminology.
Based on input from participants the Researcher devised a scale to capture
processes based on the origins of the process inputs and the destination of the
process outputs20.
3.2.3 Definitions of Business Process Management
As indicated in Chapter 1, the term BPM can have a different meaning depending
on the context in which it is used. Understanding the differences in the different
interpretations of BPM is critical to this study due to the potential impact on the
unit of analysis and subsequent data collection.
Common interpretations within extant literature include BPM as a:
1. Solution for a business using software systems or technology to automate
and manage processes
20
There is further discussion of this point in Chapter 4 and Chapter 6.
Chapter 3 – Literature Review
- 3:72 -
2. Approach to managing and improving processes that focus on the
process lifecycle
3. Approach to managing an organisation by taking a process-view or
orientation.
BPM as a Technology Solution
McDaniel (2001) used the term BPM to denote a technology solution for an
organisation. Before describing the “four tenets of BPM” (modelling, integrating,
monitoring and optimising) McDaniel (2001, 31) claimed:
“…BPM entails integrating the value of each asset, providing a
seamless interface, and coordinating the efforts of all assets to
achieve a goal, in a given sequence, within a set time…”
He went on to say:
“…BPM provides end-to-end life cycle management of information
requests or transactions made up on many steps…”
McDaniel (2001, 32) referred to the human element only in relation to the use of
technology to automate manual tasks stating:
“…executing a BPM solution is a pathway to internal employee
efficiency. Enterprises can eliminate costly and slow manual steps
that can be more effectively executed when automated (…)
automating saves time for current employees and saves training
costs for new employees…”
McDaniel‟s (2001, 33 – 35) 10 pillars provided further evidence of the technology
focus of his use of the term BPM. The pillars include: (1) unified process
automation and workflow model (2) direct model execution and manipulation (3)
state management (4) time-based exception management (5) robust process
monitoring and analysis (6) nested model support (7) concurrent model support
(8) standards based (9) high scalability and (10) high reliability.
Other examples of a technology-based use of the term BPM include Gartner

Business Process Management: Progression and Maturity
- 3:73 -
(2005) and Smith and Fingar (2002). Some software vendors still use the term
BPM in this narrow technology sense, however, it is becoming increasingly
common to refer to Business Process Management Systems (BPMS) or to
Process Aware Information Systems (PAIS).
BPM as a Lifecycle Approach
A number of researchers have used the term BPM to describe a lifecycle
approach to managing and improving processes. For example:
“…Business process management cannot be considered simply as
BPR. Rather it is concerned with how to manage processes on an
ongoing basis, and not just with the one-off radical changes
associated with BPR…” (Armistead & Machin, 1997, 887)
“…business process management (BPM) is a systematic, structured
approach to analyse, improve, control and manage processes with
the aim of improving the quality of products and services…” (Elzinga
et al., 1995, 119)
“…A systematic approach to designing, prioritising, managing,
controlling and monitoring business processes…” (Zairi, 1997, 70)
A common thread in these approaches was the view of BPM being from the
perspective of managing and/or improving the operation of a process. Garvin
(1998) highlighted a key limitation of a view that focuses on improving processes,
showing the neglect of ongoing management and operation of many redesigned
processes. In his study, Garvin found that a tendency to focus on work
processes led to administrative and supporting processes being overlooked
which ultimately ended in inconsistencies in information and planning.
An underlying assumption in the use of BPM as a lifecycle approach to managing
and improving processes is that a generic, systematic approach to BPM is
possible. From a theoretical perspective, Sabherwal et al. (2001) suggested that
taking such a view does not capture the dynamics of organisational operations
including the internal variances and external contextual situations.

Chapter 3 – Literature Review
- 3:74 -
BPM as an Organisational Approach
Pritchard and Armistead (1999) viewed BPM as an approach to managing the
organisation. Similarly, DeToro and McCabe (1997) indicated that BPM was a
new way of managing an organisation, which is different to a functional,
hierarchical management approach. At this level, Harmon (2003, 1) stated:
“…In the Nineties, a number of management gurus, for different
reasons, began to argue that it was more efficient to conceptualize a
company in terms of a set of value chains or business processes.
This approach has been given many names, but the most popular,
today, seems to be the Process-Centric Company…”
Harmon went further to define a process-centric organisation as one:
“…whose managers conceptualize it as a set of business processes.
Most process-centric companies, like most traditional organizations,
still have departments and divisions...”
In these examples, the emphasis was on the management of the organisation as
a whole, as opposed to the management of processes within the organisation.
Distinguishing between a Lifecycle and an Organisational Approach
Applying a systematic approach to the processes within an organisation (as is the
case in a BPM lifecycle approach) does not mean that individuals necessarily
view the organisation as being a set of processes (as is the case in a BPM
organisational approach). Consequently, the term BPM, when referring to the
management of processes, is fundamentally different than when using the term
to refer to the management of an organisation. The following example highlights
how this distinction could manifest within an organisation.
Consider the notion of “documenting or designing”, a step in all of the above BPM
as a Lifecycle Approaches. At this level, these steps lead to the visual
representation of a process. Potential issues that individuals would address
during this step could include:
Business Process Management: Progression and Maturity
- 3:75 -
What level of detail is the process representation at?
Who are the relevant process stakeholders?
How are the stakeholder requirements captured?
What technology is available for representing the process model?
With the interpretation of BPM as an organisational approach, a step of
„documenting or designing‟ processes would result in different considerations. As
the underlying view is of the organisation as a set of processes, the key issues in
„documenting and designing‟ could be:
What technology does the organisation need to make available to
employees to enable them to model and document processes?
Which people within the organisation need to have access to process
modelling technology?
Who, within the organisation, is going to be responsible for the on-going
maintenance of the process model library and technology?
Where are the funds for purchasing / maintaining the process modelling
technology going to come from?
This shows a distinct difference in the intent and consequence of these two uses
of the term BPM21. This distinction is not to imply that the two approaches are
mutually exclusive. Rather, it recognises that the decisions, practices and
consequences of each approach are different and acknowledges that this
distinction is important to this study. The Researcher contends that both
approaches may be more or less applicable in an organisation at a given point,
and one approach may evolve or be a sub-set of the other. Consequently, it may
not be appropriate to generalise theory from one approach to the other or that the
result of doing so may be spurious results. As indicated in Chapter 1, this study
includes organisations with BPM Initiatives using both interpretations and aims to
contribute new insights into the two approaches22.
21
Despite this difference, it is likely that the intended consequence of applying a BPM approach is the same (i.e. an improvement in organisational performance).
22 There is further discussion on this concept in the Chapter 10 Section 10.3.2.
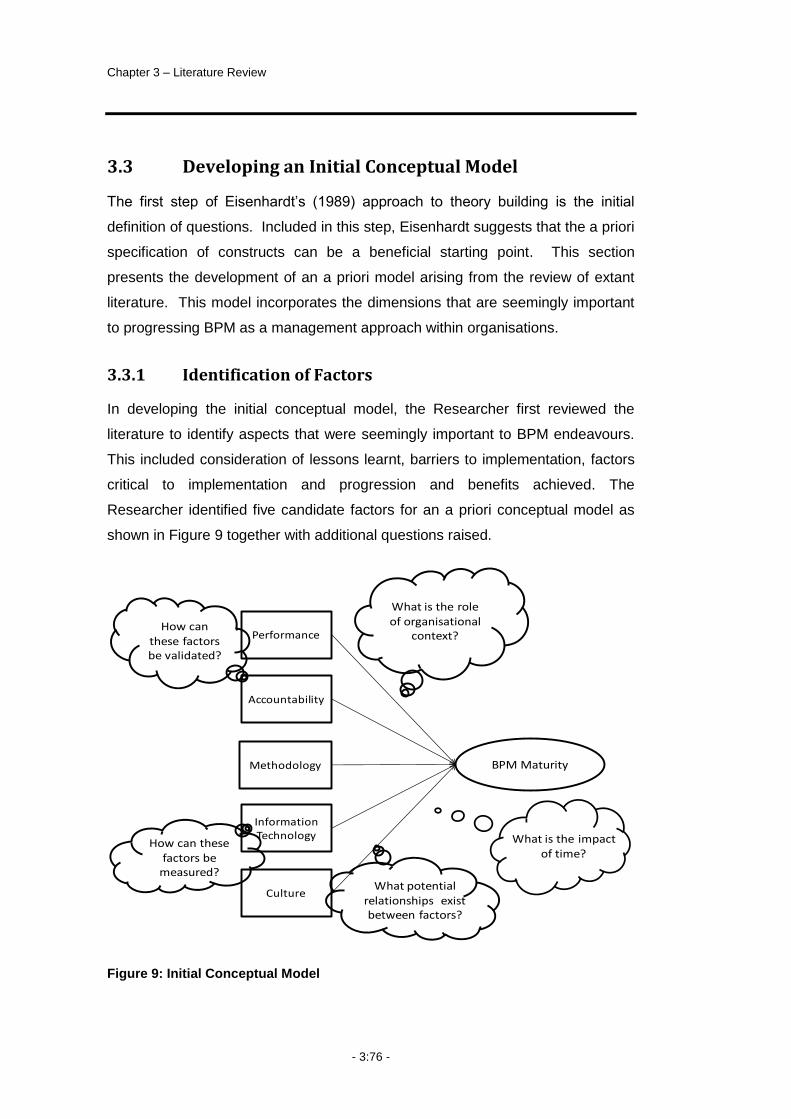
Chapter 3 – Literature Review
- 3:76 -
3.3 Developing an Initial Conceptual Model
The first step of Eisenhardt‟s (1989) approach to theory building is the initial
definition of questions. Included in this step, Eisenhardt suggests that the a priori
specification of constructs can be a beneficial starting point. This section
presents the development of an a priori model arising from the review of extant
literature. This model incorporates the dimensions that are seemingly important
to progressing BPM as a management approach within organisations.
3.3.1 Identification of Factors
In developing the initial conceptual model, the Researcher first reviewed the
literature to identify aspects that were seemingly important to BPM endeavours.
This included consideration of lessons learnt, barriers to implementation, factors
critical to implementation and progression and benefits achieved. The
Researcher identified five candidate factors for an a priori conceptual model as
shown in Figure 9 together with additional questions raised.
Figure 9: Initial Conceptual Model
Accountability
Performance
Methodology
Information Technology
Culture
BPM Maturity
What is the role of organisational
context?How can
these factors be validated?
What potential relationships exist between factors?
How can these factors be
measured?
What is the impact of time?
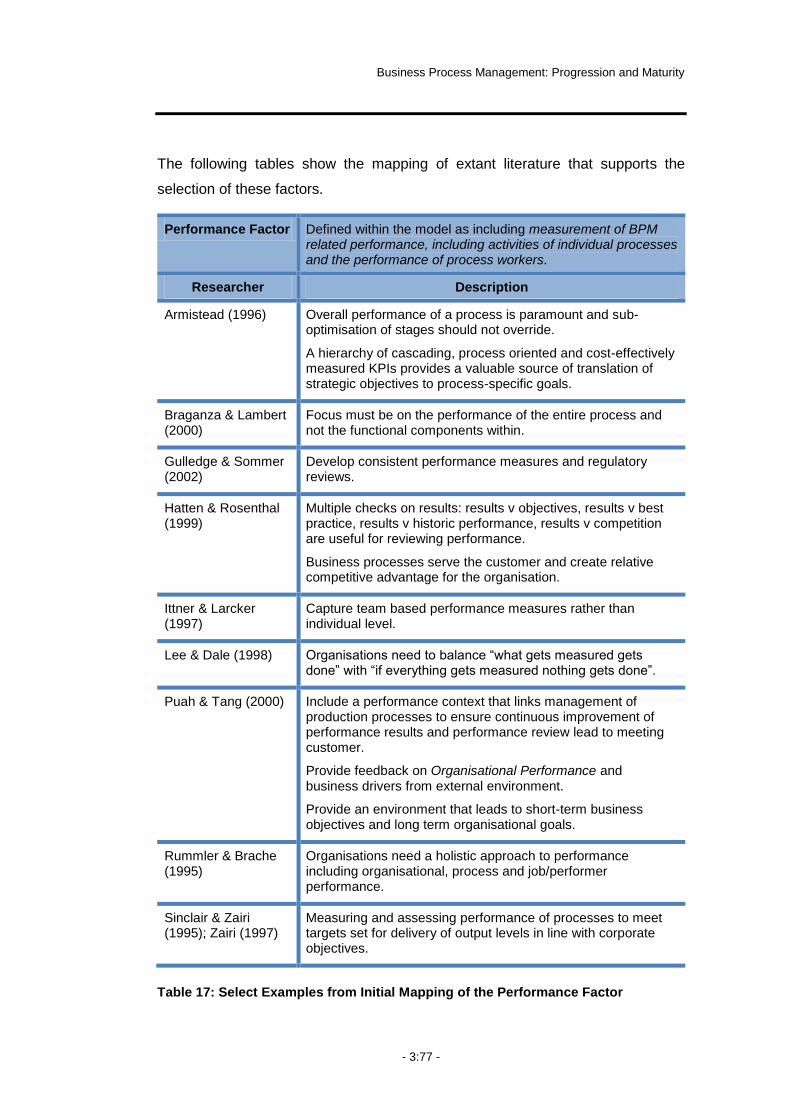
Business Process Management: Progression and Maturity
- 3:77 -
The following tables show the mapping of extant literature that supports the
selection of these factors.
Performance Factor Defined within the model as including measurement of BPM related performance, including activities of individual processes and the performance of process workers.
Researcher Description
Armistead (1996) Overall performance of a process is paramount and sub-optimisation of stages should not override.
A hierarchy of cascading, process oriented and cost-effectively measured KPIs provides a valuable source of translation of strategic objectives to process-specific goals.
Braganza & Lambert (2000)
Focus must be on the performance of the entire process and not the functional components within.
Gulledge & Sommer (2002)
Develop consistent performance measures and regulatory reviews.
Hatten & Rosenthal (1999)
Multiple checks on results: results v objectives, results v best practice, results v historic performance, results v competition are useful for reviewing performance.
Business processes serve the customer and create relative competitive advantage for the organisation.
Ittner & Larcker (1997)
Capture team based performance measures rather than individual level.
Lee & Dale (1998) Organisations need to balance “what gets measured gets done” with “if everything gets measured nothing gets done”.
Puah & Tang (2000) Include a performance context that links management of production processes to ensure continuous improvement of performance results and performance review lead to meeting customer.
Provide feedback on Organisational Performance and business drivers from external environment.
Provide an environment that leads to short-term business objectives and long term organisational goals.
Rummler & Brache (1995)
Organisations need a holistic approach to performance including organisational, process and job/performer performance.
Sinclair & Zairi (1995); Zairi (1997)
Measuring and assessing performance of processes to meet targets set for delivery of output levels in line with corporate objectives.
Table 17: Select Examples from Initial Mapping of the Performance Factor

Chapter 3 – Literature Review
- 3:78 -
Accountability Factor
Defined within the model as including the assignment and acceptance of responsibility for BPM practices.
Researcher Description
Armistead (1996) Change from functional to process base results in a change in the career paths and power base of senior management.
Need to designate a Process Champion that has responsibility for the entire process to avoid boundaries reappearing within the process.
Manage careers by align role with aspirations and ensuring cross-skilling and gaining wider business experience.
Booz et al. (2003) Provide examples of different structures of process roles and responsibilities that exist in a number of organisations.
Braganza & Lambert (2000)
BPM needs different modes of governance that involves decision-making and how people exert influence over others.
It is necessary to define process roles and responsibilities particularly for senior managers and business leaders.
Corrigan (1996) Resistance to change stemming from a lack of promotional prospects and perceived job insecurity is a major barrier.
DeToro & McCabe (1997)
Consider adopting a matrix style approach to management with both process and functional accountabilities.
Harmon (2005) Matrix management model to overcome the natural tension between function and process.
Executive officers who are focused on process.
Hatten & Rosenthal (1999)
Top management need to be involved in process change and not isolated from their operations.
CEOs need to be interested and committed to change and not give up before efforts pay dividends.
Jarrar et al. (2000) Need to put someone in charge and centralise the management structure of BPM to avoid duplication of effort.
Kirkham (1996) Organisational structure may become flatter.
Labovitz and Rosansky (1997)
Advocate the distribution of responsibility throughout the organisation.
Pritchard & Armistead (1999)
There is a need to use process owners and systems of reward and recognition, networks and matrix structures.
Puah & Tang (2000) Monitor and control individual processes through ownership and empowerment.
Stalk et al. (1992) CEO needs to have responsibility for building process capabilities, as it is only at this level that they can control the “everywhere and nowhere” nature of capabilities.
Table 18: Select Examples from Initial Mapping of the Accountability Factor

Business Process Management: Progression and Maturity
- 3:79 -
Methodology Factor
Defined within the model as including the adoption of recognised methodologies for use in BPM.
Researcher Description
Adesola & Baines (2005); Amaratunga et al. (2002); Biazzo (2000); Crowston (1997); Greasley (2003); Harrington (1991); Kettinger et al. (1997); Klein (1994); Smart et al. (1998)
Provide further examples of methods and methodologies in use within BPM and related fields.
Bandara (2007) Distinguish between a modelling methodology and a modelling tool.
Edwards et al. (2000) Any one methodology is unlikely to be sufficient for the breadth of definitions of process orientation.
Hatten & Rosenthal (1999)
A mistake is to make process improvements that have little strategic value because they were low value-add relative to others.
Ittner & Larcker (1997)
Processes must be under statistical control prior to commencing process improvement initiatives.
Methodologies to assist in the identification and elimination of waster and removal of process variability are beneficial.
Pritchard & Armistead (1999)
BPM is more than a series of techniques for improvements in process performance, lack of consistency in approach to BPM.
Puah & Tang (2000) Make process improvement an integral part of a BPM framework.
Robinson (2001) Distinguish between methodology and systems. A tool used to support a methodology is not a methodology in its own right.
Zairi (1997) BPM requires proper mapping and documentation of major process activities.
Discipline and repeatability of quality performance is important.
Extra benefits of BPM include problem solving and aspiring to best practice.
Approach to implementing continuous and break-through improvements at Ford Motors included a set of standardised tools and methodologies.
Table 19: Select Examples from Initial Mapping of the Methodology Factor

Chapter 3 – Literature Review
- 3:80 -
Information Technology (IT) Factor
Defined within the model as including the use of information technology resources in the implementation and conduct of BPM practices.
Researcher Description
Bandara (2007) Process modelling tool is critical to the success of process modelling.
Dumas et al. (2005) Process modelling tools can range in sophistication from relatively simple flow-charting tools to more comprehensive tools that use event-driven process chains.
Greasley (2003) Indicate that business process simulation technology can be used to analyse variability and interdependence of processes.
Gulledge & Sommer (2002)
Delivery of value to customer is a key requirement of an integrated BPM system.
Non-alignment of information systems will result in a stovepipe affect that will inhibit organisations from achieving benefits.
Hammer (2001) Process-oriented systems are required to integrate process activities though the sharing of data.
Harrington & Tumay (2000)
Propose a four-phase model for introducing process simulation tools.
Hatten & Rosenthal (1999)
Improvements in IT will continue to reward those who use it in the integrated management of business processes.
Lee and Dale (1998) Being able to respond quickly and provide appropriate decision-support information is essential to BPM.
Miers & Harmon (2005)
Provide a BPM continuum with a comprehensive view of categories of IT relevant to the BPM domain including languages (e.g. BPEL or Java), BPM Servers (e.g. EAI/BPM server platforms), Tools/Utilities (e.g. process modelling tools or business rules tools), BPM Suites, BPM Suites including frameworks, complete BPM systems or applications.
Pritchard & Armistead (1999)
BPM is more than a series of tools for improvements in process performance.
Puah & Tang (2000) Early IT efforts failed to consider soft issues.
Valiris & Glykas (1999)
BPM requires a holistic view of the organisation that combines people, processes and technology.
Zairi (1997) BPM relies on systems and documentation for consistency.
Table 20: Select Examples from Initial Mapping of the IT Factor

Business Process Management: Progression and Maturity
- 3:81 -
Culture Factor Defined within the model as including the acceptance, practice and promotion of BPM within the organisation.
Researcher Description
Box & Platts (2005) Leadership styles needs to create and foster team spirit and executives must be able to “walk the talk”.
Underlying change acceptance culture makes projects more likely to succeed.
Edwards & Braganza (1995)
A shared understand of the process management initiative is required and needs the support of an agreed change management plan.
Hammer (2001); Hammer & Stanton (1999)
Attitudes and behaviours of the front line personnel that effectively determine a process enterprise.
Adopting a culture removed from buck-passing and finger pointing, and that prioritises teamwork and customers.
Hatten & Rosenthal (1999)
Management need to be able to create a unifying vision and direct resources to achieve it.
Ittner & Larcker (1997)
A culture that is committed to teamwork and continuous improvement is required to succeed.
Melan (1987) Develop a process management philosophy and strategy that is in keeping with the existing organisational culture and values.
Molden & Symes (1999)
BPM purpose needs to be clear and adopted by all.
Pritchard & Armistead (1999)
Often requires a change in organisational culture.
Need to undertake initiatives to tackle cultural issues.
Ensure clarity around approach, address style and context.
Allow time to acquire a process perspective.
Puah & Tang (2000) Process change management has to be associated with the organisation‟s intents and purposes.
Consider soft issues such as quality, culture and the impact of change on the organisation and individuals.
Spanyi (2003); Spanyi 2004
Need to embed process change across the organization.
Focus on developing a set of values and beliefs to support process thinking.
Valiris & Glykas (1999)
BPM requires a holistic view of the organisation that combines people, processes and technology.
Zairi (1997) It is not enough to rely on having just good systems and the right structure but also on the adoption of a change culture.
Understanding BPM principles is required throughout the organisation.
Table 21: Select Examples from Initial Mapping of the Culture Factor

Chapter 3 – Literature Review
- 3:82 -
3.4 Operationalising the Conceptual Model
Considering how to operationalise the conceptual model in light of the insights
gained from the review of literature enables future testing of any theory arising
from this study23. In this sense, operationalisation refers to the development of
measurement questions for assessing the various factors of the model.
3.4.1 Identifying Perspectives
Earlier in this chapter, the Researcher recognised a number of interpretations of
BPM that could exist within organisations (i.e. technology, lifecycle and
organisational). At this time, how (or whether) progression differs between these
interpretations and the affect on measuring progression is largely unknown.
The inclusion of Information Technology as a factor in the initial conceptual
model incorporated the technology interpretation of BPM into future
operationalisation of the model. Further exploration of the effect of the two
management approaches (i.e. BPM as a lifecycle approach and as an
organisational approach) was required however, in order to understand the
potential implications on operationalisation of the conceptual model, especially
with regard to the potential relationships between the model components and
aspects such as time and context.
To gain additional insights into the potential impact of these two approaches,
during early efforts into the operationalisation of the model the Researcher
introduced the concept of a perspective to supplement the factors already
contained within the model. The purpose of the perspective concept was to allow
the Researcher to gather data and contemplate its implications, in a manageable
and structured manner. As a starting point, the stages from lifecycle and
organisational approaches (Elzinga et al., 1995; Gulledge & Sommer, 2002;
Lesser & McCormack, 2004; Pritchard & Armistead, 1999; Zairi, 1997) provided a
framework for application in future research.
23
The development of measurement questions is not a part of this thesis. Rather the intent at this time is to discuss the process of operationalisation, including the development of a framework for the subsequent development of measurement questions.

Business Process Management: Progression and Maturity
- 3:83 -
The initial perspectives arising from the review of literature are set out in Table
22.
Lifecycle Stages Organisational Stages24
Perspectives
(Elzinga, 1995; Gulledge & Sommer,
2002; Zairi, 1997)
(Lesser & McCormack, 2004; Pritchard & Armistead, 1999)
Design/Document Plan Design
Perform/Manage Do Execute
Control/Monitor Check Control
Improve Act Improve
Table 22: Initial Perspectives in Planning for Model Operationalisation
In addition to these stages, the concept of alignment was evident in the literature.
Align
The concept of aligning aspects of management is not new and was evident in
the quality management arena (Deming, 1986; Olian & Rynes, 1991).
Researchers in the BPM domain also recognise the importance of alignment (e.g.
Elzinga et al., 1995; Jarrar et al., 2000; Pritchard & Armistead, 1999; Puah &
Tang, 2000; Zairi, 1997; Zairi & Sinclair, 1995). Box and Platts (2005) indicate
that successfully aligning BPM projects enables maximum energy to be directed
into attaining desired outcomes and assisted in avoiding issues of misalignment
including waste of time, money and opportunity, internal conflicts and power
struggles, de-motivated individuals and teams, confusion and ultimately failure.
Collins and Porras (2000) also support the importance of this concept, finding
that within visionary and long-lasting companies, processes, practices and
behaviours are both mutually supporting and aligned.
Within the literature, there are specific organisational level alignment models,
such as Molden and Syme‟s (1999) Universal Alignment Model and Hatten and
Rosenthal‟s (1999) Enterprise Model. Hatten and Rosenthal (1999) see their
Enterprise Model as assisting organisations to improve their efficiency and
24
Other management frameworks such as COBIT also use similar groupings (Damianides, 2005, 80).
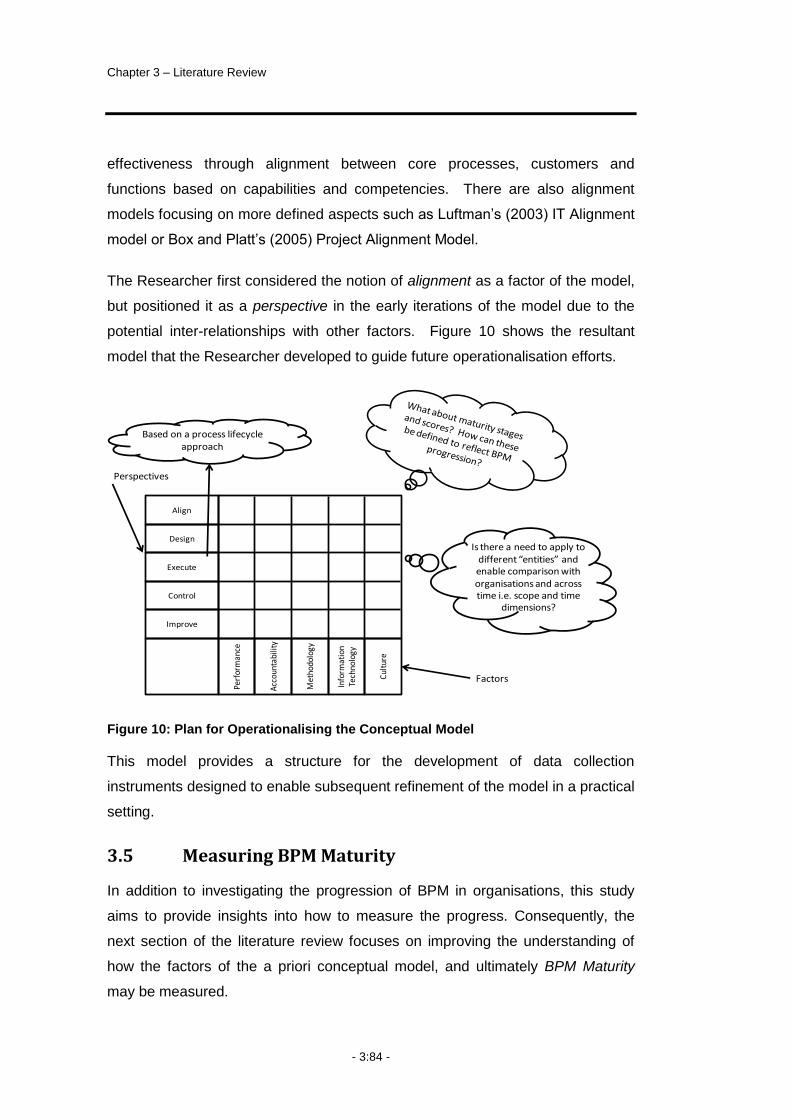
Chapter 3 – Literature Review
- 3:84 -
effectiveness through alignment between core processes, customers and
functions based on capabilities and competencies. There are also alignment
models focusing on more defined aspects such as Luftman‟s (2003) IT Alignment
model or Box and Platt‟s (2005) Project Alignment Model.
The Researcher first considered the notion of alignment as a factor of the model,
but positioned it as a perspective in the early iterations of the model due to the
potential inter-relationships with other factors. Figure 10 shows the resultant
model that the Researcher developed to guide future operationalisation efforts.
Figure 10: Plan for Operationalising the Conceptual Model
This model provides a structure for the development of data collection
instruments designed to enable subsequent refinement of the model in a practical
setting.
3.5 Measuring BPM Maturity
In addition to investigating the progression of BPM in organisations, this study
aims to provide insights into how to measure the progress. Consequently, the
next section of the literature review focuses on improving the understanding of
how the factors of the a priori conceptual model, and ultimately BPM Maturity
may be measured.
Perf
orm
ance
Acc
ount
abili
ty
Met
hodo
logy
Cul
ture
Info
rmat
ion
Tech
nolo
gy
Align
Design
Execute
Improve
Control
Factors
Perspectives
Based on a process lifecycle approach
Is there a need to apply to different “entities” and enable comparison with organisations and across time i.e. scope and time
dimensions?

Business Process Management: Progression and Maturity
- 3:85 -
Since the development of the Capability Maturity Model (CMM) by Carnegie
University in the early 1990‟s, maturity models have become an accepted means
by which organisations measure progress and gain direction for improving
defined areas. Table 23 provides select examples of maturity models in a number
of management disciplines.
Model Domain Developed Developed By
European Foundation for Quality Management
Business Management
Early 90‟s EFQM
Process Maturity Model Process Management
Early 90‟s Rummler-Brache Group
Project Management Maturity Model
Project Management
Early 90‟s Office of Government Commerce, UK
IT Strategic Alignment IT Management Early 00‟s Luftman (2003)
Enterprise Architecture Maturity Model
IT Management Early 00‟s National Association of State CIO‟s
Process Management Maturity Model
Process Management
Mid 00‟s Curtis & Alden (2006)
Process Enterprise Maturity Model
Process Improvement
Mid 00‟s Hammer (2007)
Table 23: Select Examples of Maturity Models
3.5.1 Measuring Maturity in the BPM Domain
Within the BPM domain, a number of researchers have attempted to measure
maturity using a range of measures such as time, stage of progression, number
of staff involved or budget. Maull et al. (2003) for example, attempt to measure
the maturity of BPR projects whilst Pritchard and Armistead (1999) aim to
measure the maturity of BPM. Furthermore, Ittner and Larcker (1997) provide
insights into how the context of organisations can affect progression. Reviewing
their work provides insights into potential issues with measuring BPM Maturity
that affect the development of a measurement model.

Chapter 3 – Literature Review
- 3:86 -
Maull et al. (2003) conduct a comprehensive study into the maturity of BPR
programmes. They group organisations into five categories based on the stage
organisations were at with their programme. Group 1 includes organisations at
the beginning of project planning. Group 2 includes organisations that had
progressed to the execution of their programme, whilst Group 3 organisations
had completed their programme or were close to completion. Group 4 includes
organisations in post-programme review and Group 5, organisations that were
actively using outcomes of the programme to re-engineer the entire business.
Despite these groupings, Maull et al. recognise a number of difficulties and
limitations with defining the notion of maturity.
The first issue Maull et al. (2003, 605) find was that they could not use objective
measures to measure maturity. They tried to define maturity using two
dimensions, an “objective measure” (time, team size, etc.) and a “weighting for
readiness to change”. They find this approach to be too complex to measure
however, stating:
“…For some this might be explained as a function of organisation
size, while for others, such variation may have more to do with an
organisation‟s readiness to change. In considering how maturity
might be measured, we toyed with the idea of combining elapsed
time, size of team, etc. with some weighting for readiness to change.
However, this led to even further definitional problems and would
have added considerable complexity to the research design and
resulting instrumentation…”
Therefore, they choose a phenomenological approach assessing the
organisation‟s perception of their maturity, using objective measures as a
guideline.
The second issue relates to the change in maturity over time. Whilst they
recognise a temporal aspect of maturity, Maull et al. also recognise that
progression over time is neither linear nor evenly distributed. Maull et al. (2003,
603-605) reflect on these issues stating:

Business Process Management: Progression and Maturity
- 3:87 -
“…We would have preferred to define maturity tightly using an
objective measure such as elapsed time, number of staff involved,
size of budget, etc. However, some organisations had been
considering their project plans and budgets, staffing facilities etc. for
many months, while others in the same timescale had pushed
through to implementation. Some organisations with large teams and
budgets were still at the outset, other organisations had a complete
implementation with a smaller tighter knit team…”
The temporal aspect of progression presents a challenge to the measurement of
maturity, affecting the design of measurement instruments and the
appropriateness of the research methods selected to measure progress.
Pritchard and Armistead (1999) use a combination of case study and survey
research to investigate the practice of BPM within European organisations. The
case studies provide rich evidence and contextual information about the
progression of BPM whilst the survey allows the study of differences in two
groups within the sample (Early Stage and Well Progressed).
In their study, Pritchard and Armistead (1999) attempt to divide organisations into
groups dependent upon their grade and progression of BPM implementation.
They start with five categories including not started, just starting, some way
progressed, well progressed and world class. There is no indication as to how
they derive this classification however – whether it was on the respondent‟s
subjective interpretation of the category, or whether it was on some objective
measure such as time, dollars/effort expended or best practice adoption.
During data analysis, Pritchard and Armistead reduce this classification to just
two groups being early stage and well progressed. Pritchard and Armistead
(1999) then examine the differences between the two groups with regard to how
they implemented BPM, including their motivations, difficulties encountered and
perceived success. The most notable difficulties in implementing BPM arising
from Pritchard and Armistead‟s study include the inconsistent approaches to
BPM within an organisation and poor understanding of BPM.

Chapter 3 – Literature Review
- 3:88 -
These two studies highlight the conflict between the temporal nature of
progression and the desire to measure progression at a single point in time. This
reflects in difficulties when attempting to create comparable categories due to the
different stages of progression at which organisations could be. Furthermore, the
studies highlight problems that arise in BPM research from the inconsistent use
of terminology and the affect on comparing and contrasting data collected.
Ittner and Larcker (1997) provide an example of how the contextual
environment can affect the progression of BPM practices and thus influence
measurement. Their study investigates the relationship between the use of
various BPM approaches and two indicators of Organisational Performance
(ROA: return on assets and ROS: return on sales). In discussing the analysis
process, Ittner and Larcker confirm the difficulty in establishing causal
relationships (an essential part of theory building at some stage). In particular,
they refer to a phenomenon commonly known as “equifinality” (Hackman, 1983;
cited in Ittner & Larcker, 1997, 530).
“…Influences on [performance] do not come in separate, easily
distinguishable packages. Indeed, to try to partial out and assess the
causal effects of each piece of a multi-faceted organisational change
may lead to the conclusion that nothing is responsible for an
observed improvement. If our attempt to understand [performance]
focuses on single causes, we are unlikely to generate a coherent
understanding of the phenomenon. There are simply too many ways
to get there from here, and the different routes do not necessarily
have the same causes…”
The principle of equifinality suggests that there are many possible approaches to
achieving the desired end means. Such thinking challenges the notion that there
is a single best practice approach to adopting a process view. Select findings
from Ittner and Larcker‟s study that show the affect of equifinality are summarised
in Table 24.

Business Process Management: Progression and Maturity
- 3:89 -
Industry High ROA requires… High ROS requires…
Automotive High level of customer and supplier involvement in strategy and process design.
High level of customer and supplier involvement in strategy and process design and medium use of data gathering and analysis tools.
Low customer and supplier involvement if high process-focused improvement methods.
High level of customer and supplier involvement in strategy and process design.
High level of customer and supplier involvement in strategy and process design.
Medium use of data gathering and analysis tools.
Low ROA requires… Low ROS requires…
Computer Low level of customer and supplier involvement in strategy and process design.
Low use of process-improvement methods.
Over-doing the continuous improvement focus.
Innovation-oriented strategies and high customer and supplier involvement in strategy process.
Innovation-oriented strategies and low customer and supplier involvement in strategy process.
Table 24: Select Findings from Ittner and Larcker (1997)
3.5.2 Maturity Models in the BPM Domain
A review of maturity or measurement models that incorporate processes and
process management provides four basic categories of models including:
Generic process maturity models (i.e. for use in the selection and/or
improvement of a processes)
Specific process maturity models (i.e. for use in measuring the maturity
of a defined process)
Generic management maturity models (i.e. for use in assessing the
maturity of general management processes)
Specific BPM maturity models (i.e. for use in assessing the maturity of
different BPM approaches).
The following sections discuss select examples from each of these categories.

Chapter 3 – Literature Review
- 3:90 -
Generic Process Maturity Models
DeToro and McCabe (1997) present a 5-stage approach for assessing the
condition of a process. The aim of this model is to assist an organisation in
choosing an appropriate approach for process improvement. DeToro and
McCabe‟s (1997, 59) model, shown in Figure 11, includes five stages of
unhealthy, non-competitive, competitive, best in class, and world class. DeToro
and McCabe distinguish between three strategies for process improvement
including replacement, redesign and repair. Furthermore, they assess the
condition of a process based on efficiency and effectiveness in order to
determine which approach to select for a particular process improvement project.
Efficiency (Internal process rating) Process condition rating Strategy
5
World class
The organisation is recognised as functionally superior by customers and competitors and is often benchmarked
Repair
4 Best in class
The company‟s outputs exceed customer expectations, and its processes outperform competitor‟s
Repair or redesign
3 Competitive
The organisation meets all customer and internal requirements (cost quality, return on assets)
Repair or redesign
2 Non-competitive
This company does not satisfy customer or internal requirements
Redesign or replace
1 Unhealthy
This organisation is ineffective, inefficient, and at risk of failing Replace
1 2 3 4 5
Effectiveness (Customer satisfaction rating)
Figure 11: Model for Rating a Process' Condition
This type of model is useful for selecting processes for improvement and for
matching an improvement strategy to the condition of the process.
Hammer‟s (2007) Process and Enterprise Maturity Model is an example of a
generic process maturity model for process improvement projects. This model
includes five process enablers and four enterprise capabilities. Hammer (2007,
113) defines these as follows:
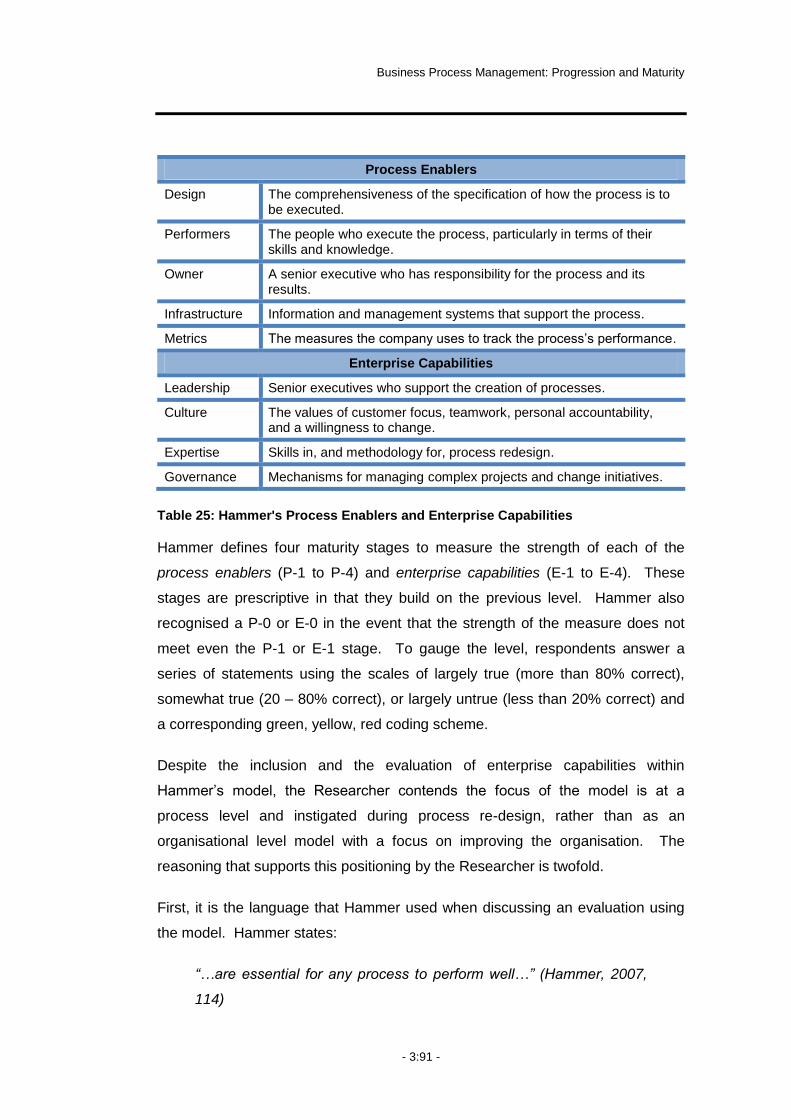
Business Process Management: Progression and Maturity
- 3:91 -
Process Enablers
Design The comprehensiveness of the specification of how the process is to be executed.
Performers The people who execute the process, particularly in terms of their skills and knowledge.
Owner A senior executive who has responsibility for the process and its results.
Infrastructure Information and management systems that support the process.
Metrics The measures the company uses to track the process‟s performance.
Enterprise Capabilities
Leadership Senior executives who support the creation of processes.
Culture The values of customer focus, teamwork, personal accountability, and a willingness to change.
Expertise Skills in, and methodology for, process redesign.
Governance Mechanisms for managing complex projects and change initiatives.
Table 25: Hammer's Process Enablers and Enterprise Capabilities
Hammer defines four maturity stages to measure the strength of each of the
process enablers (P-1 to P-4) and enterprise capabilities (E-1 to E-4). These
stages are prescriptive in that they build on the previous level. Hammer also
recognised a P-0 or E-0 in the event that the strength of the measure does not
meet even the P-1 or E-1 stage. To gauge the level, respondents answer a
series of statements using the scales of largely true (more than 80% correct),
somewhat true (20 – 80% correct), or largely untrue (less than 20% correct) and
a corresponding green, yellow, red coding scheme.
Despite the inclusion and the evaluation of enterprise capabilities within
Hammer‟s model, the Researcher contends the focus of the model is at a
process level and instigated during process re-design, rather than as an
organisational level model with a focus on improving the organisation. The
reasoning that supports this positioning by the Researcher is twofold.
First, it is the language that Hammer used when discussing an evaluation using
the model. Hammer states:
“…are essential for any process to perform well…” (Hammer, 2007,
114)
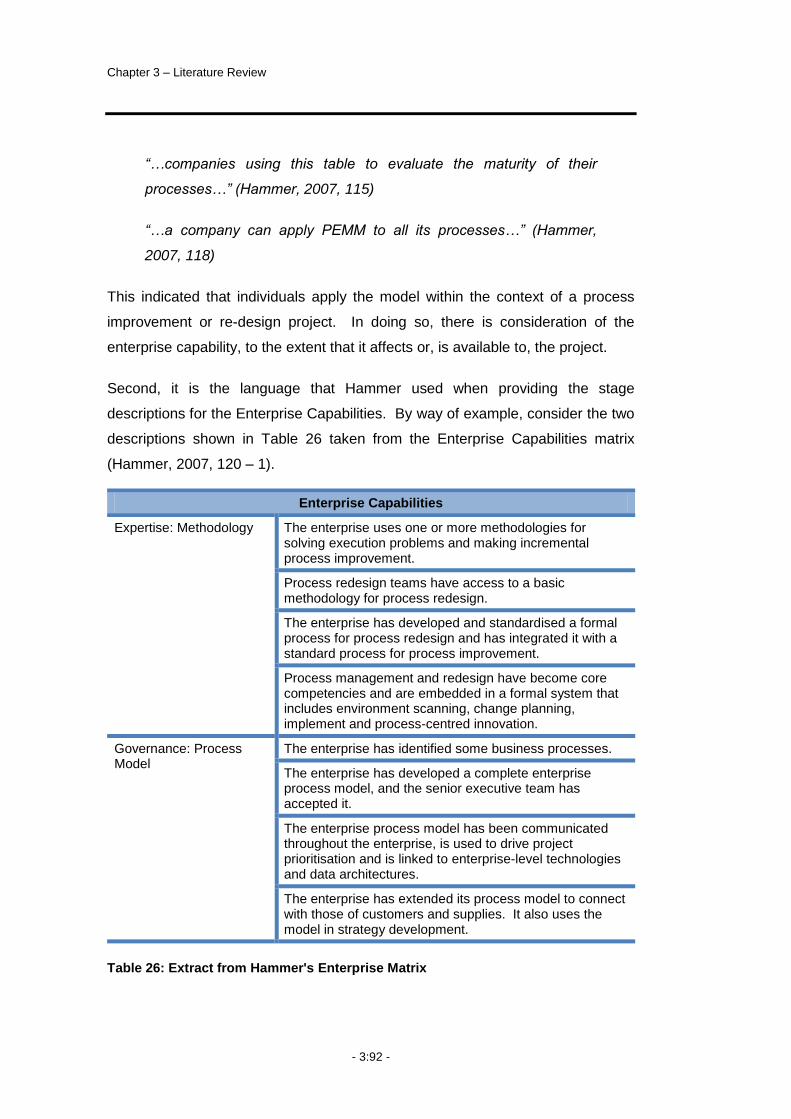
Chapter 3 – Literature Review
- 3:92 -
“…companies using this table to evaluate the maturity of their
processes…” (Hammer, 2007, 115)
“…a company can apply PEMM to all its processes…” (Hammer,
2007, 118)
This indicated that individuals apply the model within the context of a process
improvement or re-design project. In doing so, there is consideration of the
enterprise capability, to the extent that it affects or, is available to, the project.
Second, it is the language that Hammer used when providing the stage
descriptions for the Enterprise Capabilities. By way of example, consider the two
descriptions shown in Table 26 taken from the Enterprise Capabilities matrix
(Hammer, 2007, 120 – 1).
Enterprise Capabilities
Expertise: Methodology The enterprise uses one or more methodologies for solving execution problems and making incremental process improvement.
Process redesign teams have access to a basic methodology for process redesign.
The enterprise has developed and standardised a formal process for process redesign and has integrated it with a standard process for process improvement.
Process management and redesign have become core competencies and are embedded in a formal system that includes environment scanning, change planning, implement and process-centred innovation.
Governance: Process Model
The enterprise has identified some business processes.
The enterprise has developed a complete enterprise process model, and the senior executive team has accepted it.
The enterprise process model has been communicated throughout the enterprise, is used to drive project prioritisation and is linked to enterprise-level technologies and data architectures.
The enterprise has extended its process model to connect with those of customers and supplies. It also uses the model in strategy development.
Table 26: Extract from Hammer's Enterprise Matrix
Business Process Management: Progression and Maturity
- 3:93 -
The Researcher contends that these statements reflect the consequence of
having the capability developed and therefore whilst they may direct attention to
which capability needs attention, the statements do not guide the development of
the capability within the organisation. To develop BPM capability within the
organisation with regard to methodology, decisions may include:
What methods is the organisation going to select for use?
How do current technologies support these methods?
What standards need to be in place to guide use of the methods?
Who is going to be responsible for the implementation, training, budget
and assessment of the methods?
Similarly, decisions about a process model may include:
To what level does the organisation want to document processes?
What detail is going to be contained at each level?
How is the model going to connect with other enterprise models such as
the IT Architecture or the Risk Management Architecture?
This type of model is useful for improving the redesign process and for identifying
areas in which enterprise capability need to be improved25.
Specific Process Maturity Models
Arguably, the most well-recognised process-specific maturity model is the
Capability Maturity Model (CMM) developed by the Software Engineering
Institute (SEI) – Carnegie Mellon in the early 1990‟s26. Carnegie-Mellon
developed the CMM in conjunction with the American Defence Force to
25
This is not to say that an organisation does not benefit from application of such a model. Rather the point is that the primary intent of the model is to improve process redesign within the organisation and the attention directed to organisational capability is as an enabler of this. In a model that the Researcher describes as being BPM specific, the primary focus is on the management activities or development of capabilities and the assumed consequence on processes and process improvement projects. In the upcoming evaluation section (i.e. Section 3.4.3) this reflects in a half strength recognition of organisational aspect for the Hammer (2007) model.
26 A further example of a process-specific maturity model is Luftman‟s (2003) maturity model for IT
strategic alignment.

Chapter 3 – Literature Review
- 3:94 -
overcome a problem with the quality of software. The basic concept
underpinning the CMM was that the maturity of software organisations affected
the quality of their software development. Paulk et al. (1993, 5) confirm the basis
for applying the model is “an increase in the process capability of the
organisation”. The CMM is a prescriptive model that provides guidance to
improve a specific process (i.e. software development) 27.
The CMM introduces the concept of five maturity levels defined by special
requirements that are cumulative, an example of which is in Figure 12 (Paulk et
al., 1993, 6).
Figure 12: The Five Levels of CMM
Paulk et al. (1993) recommend that organisations avoid skipping levels as this
can have a “counterproductive” impact. Within the model, there are goals
defined for key process areas (KPA‟s). The model prescribes a number of
activities for each key process area that, when undertaken, lead to the attainment
of the maturity level. To attain a particular level of maturity all goals for the key
process areas have to be achieved (Paulk et al., 1993).
27
That is, it assumes acceptance of the notion of best practice and provides sequential and orderly directions for achieving higher levels of maturity.
Disci-
plined
pro-
cess
Predictable
process
Standard,
consistent
process
Continuously
improving
process
- not defined, ad-hoc processes
- success depends on individual persons - and their characteristics and
“heroic” dedication
- project management practices are established
- planning and managing is based on experience
- Earlier success is repeatable.
- organisation-wide CPI
- Use of feedback mechanisms for
processes and quality improvement
- defined, documented, stable and repeatable processes
(engineering and management)
- organisation-wide training programmes
- measuring of processes and products against
quantitative quality goals
- understanding and control of quality
1.
Initial
5.
Optimizing
2.
Repeatable
3.
Defined
4.
Managed
Business Process Management: Progression and Maturity
- 3:95 -
Since its inception, Carnegie Mellon has supplemented the CMM with additional
models such as the software acquisition (SA-CMM), integrated product
development (IPD-CMM) and system engineering (SE-CMM) (Huang & Han,
2006). More recently, Carnegie Mellon has replaced the CMM with the Capability
Maturity Model Integration (CMMI). A major difference between the CMM and
the CMMI is the ability to adopt either a staged approach (i.e. as in the original
CMM) or a continuous approach (whereby achievement of the KPA‟s can occur
over a number of different levels). Huan and Han (2006) have shown that factors
including project risks, resource availability and business objectives act to
influence the path taken by organisations. Consequently, building a formal model
that helps to prioritise the selection of KPA‟s, difficult.
Generic Management Maturity Models
An example of a generic management model is the Excellence Models that exist
in many regions including models such as the:
Australian Business Excellence Awards (ABEF)
European Foundation for Quality Management (EFQM)
CII Exim Bank Award (India)
Japan Quality Awards
Singapore Quality Awards (SQA)
Malcolm Baldrige National Quality Award (MBNQA) (United States).
The Global Excellence Model Council28 acts as the:
“…guardians of the Excellence Models across the world…”
28
The Global Excellence Model Council held its inaugural meeting in November 2006. Further details about the council and the excellence models are at http://www.excellencemodels.org/.

Chapter 3 – Literature Review
- 3:96 -
The aim of these models is to measure and improve business performance by
focusing on a number of aspects including leadership and management. The
official website (Accessed from http://www.efqm.org/) indicates:
“…Excellent results with respect to Performance, Customers, People
and Society are achieved through Leadership driving Policy and
Strategy that is delivered through People, Partnerships and
Resources, and Processes…”
A closer look at one of these models, the EFQM, provides further insights into
how excellence Models work.
The EFQM is comprised of eight “Fundamental Concepts of Excellence” and
three maturity levels supplement these concepts. The maturity levels (defined
as: start up, on the way and mature) apply to the understanding the organisation
has with respect to using the model (EFQM, 2005). Figure 13 shows the
assessment framework in 2008 (http://www.excellencemodels.org/
ExcellenceModels/). Table 27 details the eight concepts that underpin the model.
Figure 13: The European Foundation for Quality Management Model

Business Process Management: Progression and Maturity
- 3:97 -
Fundamental Concept Description
Results Orientation Excellence is achieving results that delight all the organisation's stakeholders.
Customer Focus Excellence is creating sustainable customer value.
Leadership & Constancy of Purpose
Excellence is visionary and inspirational leadership, coupled with constancy of purpose.
Management by Processes & Facts
Excellence is managing the organisation through a set of interdependent and interrelated systems, processes, and facts.
People Development & Involvement
Excellence is maximising the contribution of employees through their development and involvement.
Continuous Learning, Innovation & Improvement
Excellence is challenging the status quo and effecting change by using learning to create innovation and improvement opportunities.
Partnership Development
Excellence is developing and maintaining value-adding partnerships.
Corporate Social Responsibility
Excellence is exceeding the minimum regulatory framework in which the organisation operates and to strive to understand and respond to the expectations of their stakeholders in society.
Table 27: EFQM Fundamental Concepts
As seen in Figure 13, at the highest level the model consists of two categories:
enablers and results. Enablers assess the activities of the organisation whilst
results assess the achievements with respect to identified stakeholders. Each
category is broken down into nine criteria – 5 enabling criteria (leadership,
people, policy and strategy, partnership and resources and processes) and 4
results criteria (people, customers, society and key performance). These criteria
break down further into sub-criteria that provide a broader explanation and
guideline for assessment. Inherent in the model is the notion of a bi-directional
linkage between enablers and results whereby enablers drive results and results
feedback to improve enablers. Results are analysed using an assessment
method called RADAR (results, approach, deployment, assessment and review).
The „ADAR‟ assesses enablers, whilst the „R‟ assesses results.
Whilst business excellence models are useful for assessing organisational
outcomes, they do not provide comprehensive assistance in understanding the
specific requirements and complexities of BPM nor do they enable the
measurement of BPM practices. Such models do however, stress the

Chapter 3 – Literature Review
- 3:98 -
significance of process and contextualise these with other important factors for
corporate performance.
Specific Business Process Management Maturity Models
Models for measuring BPM have arisen from both industry and academia (e.g.
Curtis & Alden, 2006; Fisher, 2004; Harmon, 2004; Kiraka & Manning, 2005).
The following section discusses selected examples of BPM maturity models.
Fisher (2004) defines five “levers of change” important for understanding BPM.
Figure 14 shows how Fisher (2004, 1) relates these levels.
Figure 14: Fisher's Five Levers of Change
According to Fisher (2004), many organisations only focus on 3 of the 5 levers
which can lead to problems such as an efficient process that does not match
strategy. Similar to the CMM, Fisher identifies States of Process Maturity as
being siloed; tactically integrated; process driven; optimized enterprise and
intelligent operating network. Fisher (2004, 6) combines the five levers of change
with five “states of maturity” to asses the maturity of BPM. Figure 15 shows
Fisher‟s resultant model for BPM maturity. In developing this model, Fisher
stresses the need for a BPM model to be both non-linear and multi-dimensional.
Alignment
Technology
Strategic understanding of the role, positioning and focus for enterprise-wide decision-making in support of overall company objectives
Operating methods and practices, including policies and procedures, which determine the way activities are performed
The governance model for the management, administration, and evaluation of initiatives, with a strong focus on the appropriate metrics applied for measurement.
The human resource environment, including skills, organizational culture, and organizational structure
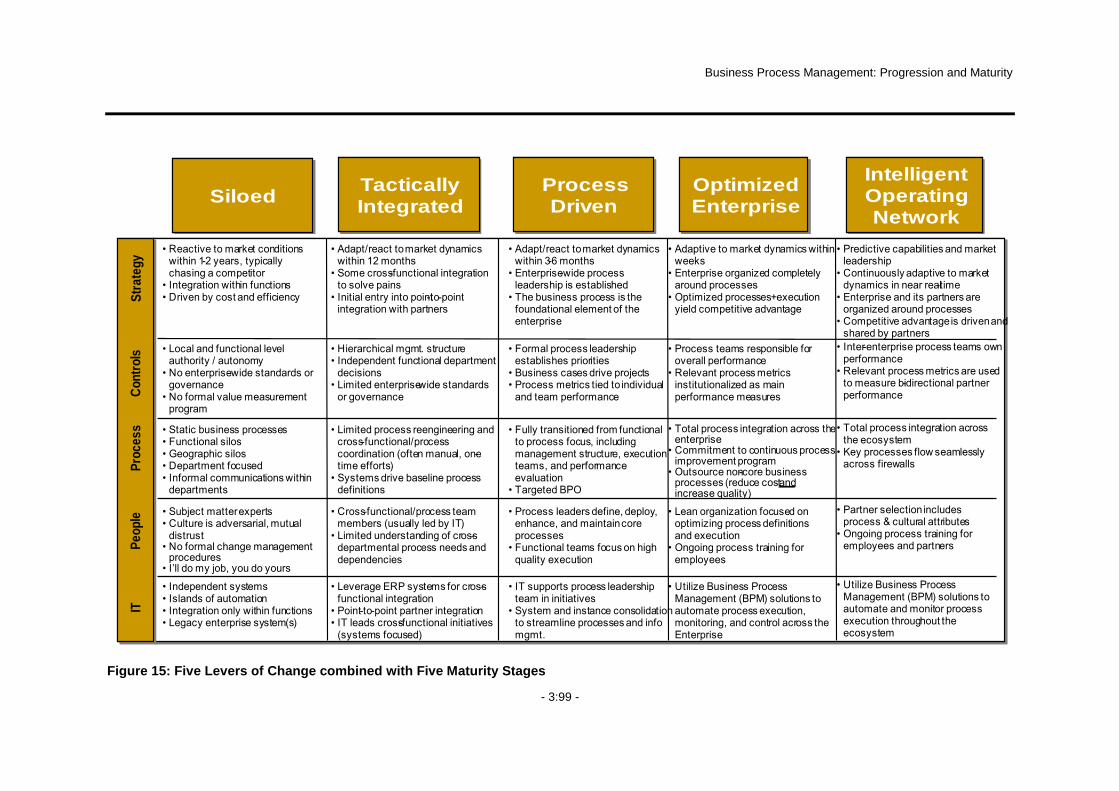
Business Process Management: Progression and Maturity
- 3:99 -
Figure 15: Five Levers of Change combined with Five Maturity Stages
• Static business processes• Functional silos• Geographic silos• Department focused• Informal communications within
departments
Process
Driven
Process Driven
Optimized
Enterprise
Optimized Enterprise
Intelligent
Operating Network
Intelligent Operating Network
Tactically
Integrated
Tactically
IntegratedSiloedSiloed
• Reactive to market conditions within 1-2 years, typically chasing a competitor
• Integration within functions• Driven by cost and efficiency
• Subject matter experts• Culture is adversarial, mutual
distrust• No formal change management
procedures• I’ll do my job, you do yours
• Independent systems• Islands of automation• Integration only within functions• Legacy enterprise system(s)
• Local and functional level authority / autonomy
• No enterprise-wide standards or governance
• No formal value measurement program
• Adapt/react to market dynamics within 12 months
• Some cross-functional integration to solve pains
• Initial entry into point-to-point integration with partners
• Limited process reengineering and cross-functional/process coordination (often manual, one-time efforts)
• Systems drive baseline process definitions
• Cross-functional/process team members (usually led by IT)
• Limited understanding of cross-departmental process needs and dependencies
• Leverage ERP systems for cross-functional integration
• Point-to-point partner integration• IT leads cross-functional initiatives
(systems focused)
• Hierarchical mgmt. structure• Independent functional department
decisions• Limited enterprise-wide standards
or governance
• Adapt/react to market dynamics within 3-6 months
• Enterprise-wide process leadership is established
• The business process is the foundational element of the enterprise
• Fully transitioned from functional to process focus, including management structure, execution teams, and performance evaluation
• Targeted BPO
• Process leaders define, deploy, enhance, and maintain core processes
• Functional teams focus on high quality execution
• IT supports process leadership team in initiatives
• System and instance consolidation to streamline processes and info mgmt.
• Formal process leadership establishes priorities
• Business cases drive projects• Process metrics tied to individual
and team performance
• Adaptive to market dynamics within weeks
• Enterprise organized completely around processes
• Optimized processes+execution yield competitive advantage
• Total process integration across the enterprise
• Commitment to continuous process improvement program
• Outsource non-core business processes (reduce cost andincrease quality)
• Lean organization focused on optimizing process definitions and execution
• Ongoing process training for employees
• Utilize Business Process Management (BPM) solutions to automate process execution, monitoring, and control across the Enterprise
• Process teams responsible for overall performance
• Relevant process metrics institutionalized as main performance measures
Str
ate
gy
Co
ntr
ols
Pro
ce
ss
Pe
op
leIT
• Predictive capabilities and market leadership
• Continuously adaptive to market dynamics in near real-time
• Enterprise and its partners are organized around processes
• Competitive advantage is driven and shared by partners
• Total process integration across the ecosystem
• Key processes flow seamlessly across firewalls
• Partner selection includes process & cultural attributes
• Ongoing process training for employees and partners
• Utilize Business Process Management (BPM) solutions to automate and monitor process execution throughout the ecosystem
• Inter-enterprise process teams own performance
• Relevant process metrics are used to measure bi-directional partner performance
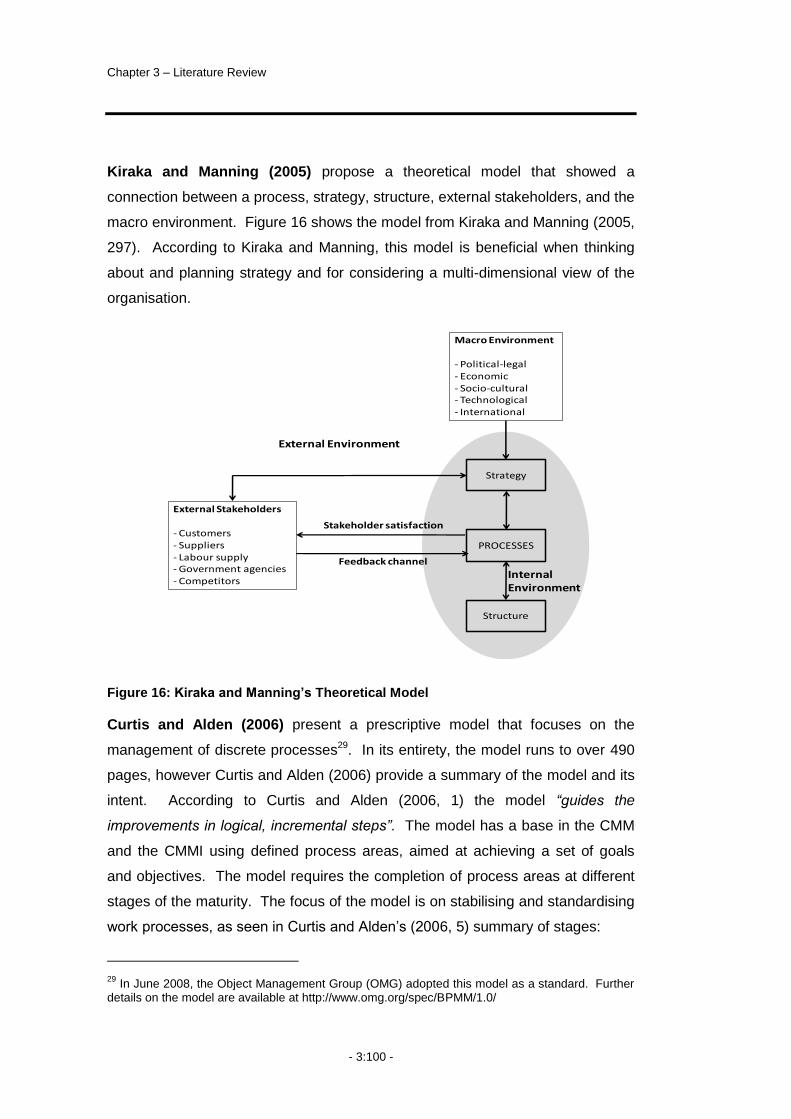
Chapter 3 – Literature Review
- 3:100 -
Kiraka and Manning (2005) propose a theoretical model that showed a
connection between a process, strategy, structure, external stakeholders, and the
macro environment. Figure 16 shows the model from Kiraka and Manning (2005,
297). According to Kiraka and Manning, this model is beneficial when thinking
about and planning strategy and for considering a multi-dimensional view of the
organisation.
Figure 16: Kiraka and Manning‟s Theoretical Model
Curtis and Alden (2006) present a prescriptive model that focuses on the
management of discrete processes29. In its entirety, the model runs to over 490
pages, however Curtis and Alden (2006) provide a summary of the model and its
intent. According to Curtis and Alden (2006, 1) the model “guides the
improvements in logical, incremental steps”. The model has a base in the CMM
and the CMMI using defined process areas, aimed at achieving a set of goals
and objectives. The model requires the completion of process areas at different
stages of the maturity. The focus of the model is on stabilising and standardising
work processes, as seen in Curtis and Alden‟s (2006, 5) summary of stages:
29
In June 2008, the Object Management Group (OMG) adopted this model as a standard. Further details on the model are available at http://www.omg.org/spec/BPMM/1.0/
Macro Environment
- Political-legal- Economic- Socio-cultural- Technological- International
Strategy
PROCESSES
Structure
External Stakeholders
- Customers- Suppliers- Labour supply- Government agencies- Competitors
External Environment
Stakeholder satisfaction
Feedback channel
Internal Environment

Business Process Management: Progression and Maturity
- 3:101 -
“…Level 2 is characterized by stable work units performing
repeatable local procedures
Level 3 is characterized by standard, integrated, end-to-end business
processes
Level 4 is characterized by statistically stable processes with
predictable outcomes
Level 5 is characterized by proactive improvement actions to achieve
the process capability required to meet changing business
objectives…”
According to Garvin (1998), a strong focus on work processes raises the
possibility that an organisation overlooks managerial and organizational
processes. A strong focus on standardising current practice assumes that the
practice is itself, strategically aligned, or that it is worth spending resources
improving practices that are not. Fisher (2004) indicates this is not always so.
3.5.3 Evaluating Measurement Models
Existing literature provides insights into how different criteria can apply when
measuring the progression of BPM Initiatives within organisations. Combining
the goals of this study with the issues identified in progressing BPM and those in
measuring maturity provides a basis for evaluating measurement models. This
section evaluates select models using the criteria of Unit of Analysis, Primary
Aim, Maturity Stages, Basis for Stage Progression, Foundation and Application.
A discussion of the origin and intent of these criteria follows.
Eisenhardt (1989) indicates that when the unit of analysis is at an individual or
process level, a potential limitation is that findings do not translate to
organisational level research. Consequently, measurement models that have a
base in discrete processes are not appropriate for the measurement of BPM at
an organisational level. This results in criteria for the Unit of Analysis being
Technology, Process or Organisation.
The aims of this study, including the distinction drawn earlier regarding the
Chapter 3 – Literature Review
- 3:102 -
various interpretations of BPM, result in criteria for the Primary Aim of the model
being Process Improvement and Lifecycle or Organisational Management.
Sabherwal et al. (2001) argue that models presenting a single way of performing
management and viewing the same approach as useful in all situations do not
cater to multiple approaches and alternate contexts. Similarly, Smith and Fingar
(2004) argue that a CMM-based maturity model that postulates well-organised
and repeatable processes does not capture the need for business process
innovation. Garvin (1998) highlight the limitations of simple staged models for
capturing the richness at organisational levels. Consequently, models that have
pre-defined stages and a single, standard way of performing (i.e. using a staged
approach such as the CMM) are not appropriate to the organisational context.
This results in criteria for Maturity Stages being Prescriptive (single best
practice), Descriptive (multiple acceptable practices) or Undefined.
Ittner and Larcker (1997) showed that the selection of BPM methods was not
universal and that different strategies could be appropriate in different
circumstances. Sabherwal (2001) argued that lifecycle models take a more
dynamic view but assume that changes in all organisations occur along the same
path. Furthermore, they found that such models assumed movement is linear
and in a forward direction and that, all organisations follow the same path.
Consequently, lifecycle models are not appropriate for representing the variation
arising from changing organisational context. This resulted in a criterion for the
Basis for Stage Progression being Staged (linear), Continuous (linear with some
variation for context) and Contextual (non-linear, dependent on context)
Finally, this study aims for a balance of rigour and relevance indicating that
additional criteria worth evaluating includes the models‟:
Foundation being Theoretical, Practical or a Combination
Application being Self Assessed, Independent or a Combination.
Table 28 maps a number of existing models to the criteria. In this table, is
indicative of a primary focus and denotes what the Researcher sees as a
secondary focus of the model. The highlighted sections of Table 28 show the
aspects addressed by this study.

Business Process Management: Progression and Maturity
- 3:103 -
Model
Unit of Analysis Primary Aim Maturity Stages Basis for Maturity Stage Progression
Foundation Application
Tech
no
log
y
Pro
cess
Org
an
isati
on
Pro
cess
Imp
rovem
en
t
Lif
ecycle
Man
ag
em
en
t
Org
an
isati
on
Man
ag
em
en
t
Pre
sc
rip
tive
Desc
rip
tive
No
t D
efi
ned
Sta
ged
Co
nti
nu
ou
s
Co
nte
xtu
al
Th
eo
reti
ca
l
Pra
cti
cal
Co
mb
inati
on
Self
Asse
ssed
Ind
ep
en
den
t
Co
mb
inati
on
DeToro & McCabe
Hammer
CMM/CMMI* *
Business Excellence Models
Curtis & Alden
This Study
Table 28: Evaluating Models against Selected Criteria
Chapter 3 – Literature Review
- 3:104 -
3.6 Chapter Summary
This chapter commenced with a review of literature that addressed the
progression of BPM within organisations. This review found variation in common
BPM terms. The result was the recognition of different interpretations of the term
BPM within the literature, including those that limit the term to include only
technological solutions, those focused on the management of the process
lifecycle and those focused on the management of the organisation.
Furthermore, the review found that whilst a number of researchers provided
examples of rules and lessons about the progression of BPM, in themselves
these did not constitute theoretical constructs.
Following this, the review focused on measuring BPM Progression. A number of
studies in the BPM domain used the concept of maturity. There was not a clear
definition of maturity however, leading the Researcher to undertake a deeper
review of measurement models. The evaluation of these models, against criteria
arising from the study into progression, showed the importance of this study.
The Researcher proposed an a priori model for BPM Maturity including five
factors of performance, accountability, methodology, information technology and
culture. Further investigation into the operationalising of this model led to the
further inclusion of five perspectives including align, design, execute, control and
improve.
Next, the Researcher identified issues from extant literature that will affect the
measurement of maturity in the BPM domain. The Researcher then evaluated
select maturity models against a range of criteria derived from the literature
review. This evaluation resulted in verification of the need for a BPM Maturity
model.
The next chapter presents two case studies, undertaken to test and refine the a
priori conceptual model in a practical setting.

Business Process Management: Progression and Maturity
- 4:105 -
4 Conceptual Model Refinement
he focus of this chapter is on testing the Initial Conceptual Model,
developed in Chapter 3, within a practical setting. In doing so, the
Researcher aims to refine the Initial Conceptual Model using the
insights gained from the practical application. Of interest at this stage are issues
such as:
What is seemingly important to organisations adopting a BPM
approach?
How well does the Initial Conceptual Model capture these elements?
What practical issues exist that are likely to affect the future
operationalisation of the model?
How does the Initial Conceptual Model need to change to suit the needs
of current practice?
The refinement phase includes case studies with two companies that had
recognised BPM Initiatives.
4.1 Chapter Overview
The structure of this chapter is as follows. Section 2 details the design of the
case studies including the selection of companies and the data collection
instruments. Section 3 details the conduct of the case studies, including a
summary of the BPM Initiatives for each organisation. Section 4 details the data
T
Chapter 4 – Conceptual Model
- 4:106 -
analysis phase including the resultant Refined Conceptual Model. Section 5
discusses the consequences on the study of undertaking the two case studies
including a discussion of the next steps. Section 6 concludes with a summary of
the chapter.
4.2 Case Study Design
The desire to conduct highly relevant research and the early exploratory stage of
the BPM domain, led to the conduct of case studies for testing the Initial
Conceptual Model30. This phase included two case studies to reduce single case
bias, and to strengthen the generalisability of the outcomes (Gable, 1994; Yin,
2003).
4.2.1 Unit of Analysis
Yin (2003) indicated that within a case study the unit of analysis can be holistic
(i.e. the entire case) or embedded i.e. with multiple units of analysis within a
single case. In this case, the unit of analysis is holistic, exploring the BPM
Initiative at an organisational level.
4.2.2 Case Selection
Company A and B, were selected for this stage of the research. The selection of
the two companies arose from a number of considerations including:
It was critical that the organisations had a demonstrated commitment to
BPM principles and practices. The Key Contacts were regular
participants in local BPM Chapter meetings and known for their
experience in BPM. Furthermore, both Key Contacts had conducted
presentations on their company‟s BPM Initiatives at BPM industry
conferences.
Due to the exploratory nature of the research, it was preferable that the
organisations had a prior relationship with research and an
understanding of research processes and potential outcomes. This
30
Chapter 2 provides justification for the selection of case studies for this phase of the research.
Business Process Management: Progression and Maturity
- 4:107 -
included a willingness to invest resources in the case studies to ensure
sufficient time and energy for the data collection sessions.
Due to budgetary constraints, it was necessary for the geographical
location to be readily accessible to the researchers.
The Researcher invited both companies to participate in the research and
provided the Key Contact with details of the study and the ethical requirements
relating to the conduct of the study. Examples are in:
Appendix 13.1.1 – Invitation to Participate
Appendix 13.1.2 – Information Sheet and Informed Consent.
The two companies selected each had a recognised BPM Initiative driven by a
small team of staff. The companies were looking to embrace BPM as an
enterprise-wide approach to business operations. Both companies had Head
Offices located in Brisbane, Australia and operate as Government Owned
Corporations (GOCs) within the Queensland State Government.
4.2.3 Data Collection Instruments
Jick (1979) indicated that the use of complementary data collection instruments
strengthens the triangulation of data. In these case studies, the Researcher used
a combination of interviews, surveys and a review of documents as the primary
data collection instruments.
An Interview Guide ensured consistency in the questions asked across the
participating companies. The Researcher derived questions from concepts in the
literature, mapping them to the framework discussed in Chapter 3. The interview
questions were semi-structured and aimed at gathering data regarding each of
the factors contained in the conceptual model. There was a separate Interview
Guide for each factor with a sample in:
Appendix 13.1.3. – Interview Guide: Performance.

Chapter 4 – Conceptual Model
- 4:108 -
The Establishment Survey gathered background information about the
companies including their motives and expectations with respect to BPM. This
survey gathered details about the context in which the BPM Initiative was
occurring. The Researcher asked the Key Contact to complete this survey
because of their knowledge and involvement in the company‟s BPM Initiative. As
an example, the completed Establishment Survey for Company B is in:
Appendix 13.1.4 – Establishment Survey: Completed by Company B.
The Feedback Survey collected data about the design of the conceptual model
including an assessment of the relevance and completeness of the factors
selected for inclusion in the conceptual model. This survey included rating scales
for the factors and perspectives and semi-structured questions to elicit other
feedback regarding the model. All participants of the case studies completed the
Feedback Survey, a copy of which is in:
Appendix 13.1.5 – Feedback Survey.
The Maturity Survey explored the future operationalisation of the conceptual
model31. Concepts from existing literature led to the questions within the Maturity
Survey. During the case study with Company A, participants reviewed the
proposed Maturity Survey questions and provided the Researcher with feedback
on their clarity and relevance. This feedback led to the refinement of the
questions and their presentation. During the second case study, Company B
piloted the revised questions of the Maturity Survey. In this pilot, a small number
of participants from three business areas within Company B completed the
survey questions based on BPM practices within their area32. An example of the
questions and responses to these questions is in:
Appendix 13.1.6 – Maturity Survey Questions: Culture Factor.
31
As indicated in earlier Chapters, the questions themselves are outside of the scope of this thesis, rather the intent was to use the surveys with a view to identifying practical issues in the completion of the survey and for understanding issues in the process of measuring progression.
32 Doing this enabled comparison of BPM between the three business units, effectively treating
them as embedded units of analysis within Company B.

Business Process Management: Progression and Maturity
- 4:109 -
4.3 Conduct of the Case Studies
Both case studies occurred in the first half of 2004 with the final presentations
taking place in June 2004 for Company A and August 2004 for Company B. The
data collection for Company A occurred from February to April and for Company
B, from April to June 2004.
The Key Contact acted as a single point of contact for arranging the research
activities within each company. The Key Contact was responsible for completing
relevant ethics documents and internal communication, co-ordination, scheduling
and introductions with participants for all data collection sessions. The Key
Contact selected participants based on his/her knowledge of the organisation and
the individuals. For the interviews and surveys (other than the Maturity Survey),
participants were members of the core BPM teams or were highly knowledgeable
about the BPM Initiative. Participants completing the Maturity Survey were from
operational business areas within Company B.
Interviews were between 1.5 and 2 hours long and conducted on company
premises. Interviews with Company A included a single representative in each
interview. Interviews with Company B included two representatives in each
interview due to the centralised nature of the BPM Initiative and the broader
development of skills and knowledge within this team. Participants received a
copy of the Interview Guide at the commencement of the interview.
The Feedback Survey completion occurred at the end of the interviews. For
Company A, the review of the Maturity Survey questions occurred at the end of
the interview. For Company B, completion of the Maturity Surveys occurred in
the two weeks following interviews to fit with work commitments of participants.
The recording of interviews acts to support data collection – however, neither
company in the two case studies agreed to record the interviews33. This
increased the reliance on the Researcher‟s field notes and observations.
33
Both organisations were experiencing a level of conflict and resistance to the introduction of BPM and the Key Contacts did not want to do anything that may have put further pressure on this by asking participants to record interviews.
Chapter 4 – Conceptual Model
- 4:110 -
Consequently, a second researcher supported data collection during the
interviews by acting as an observer and scribe34. At the completion of the
interviews, both researchers transcribed their notes independently before coming
together for comparison and integrating prior to data analysis. An example of the
field notes from an interview is contained in:
Appendix 13.1.7 – Write up of Interview Notes: Company A.
At the completion of each study, there was a presentation to participants to share
and discuss the results. The presentations lasted one hour and included the
opportunity for participants to provide further feedback and to ask questions of
the case study outcomes.
4.3.1 Case Study: Company A
In 1999, the Queensland Government rationalised its operations in the utilities
industry, combining a number of independent entities in the creation of Company
A. The independent entities included the six regional Queensland electricity
distributors and their subsidiary retailer. At this time, Company A had an asset
base of $7.7 billion, consisting of approximately 150,000 kilometres of
powerlines, over one million power poles, associated infrastructure including
major substations and power transformers and 33 stand-alone power stations
supplying isolated communities. The combined entity serviced approximately
600,000 customers across regional Queensland, extending around 1.7 million
square kilometres to capture 97% of Queensland. Seen as one of Australia‟s
largest purchasers of renewable energy Company A was actively involved in the
generation of solutions for alternative energy. Company A‟s vision was:
"…To be a world-class, customer-driven energy business…"
At the time of the case study (2004), Company A had two major business areas –
distribution and retail. The distribution business accounted for 80% of Company
A‟s profit and 60% of staff, with retail accounting for the remaining 20% of profit
34
The second researcher was a Masters student undertaking a project in BPM.

Business Process Management: Progression and Maturity
- 4:111 -
and 40% of staff35. Table 29 summarises key dimensions of Company A at the
time of conducting the case study.
Company Sector Industry Employees Asset Base Company Start Date
A Public GOC Utilities 4,000 $7.7 Billion 1999
Table 29: Company A – Key Organisational Dimensions
BPM within Company A
From 2001, Company A commenced its BPM Initiative as a means of overcoming
the duplication and inconsistency that arose from merging the six entities.
According to participants, the separate entities had been “playing together” for 3
years and were looking for “unification”. The organisation was looking for “new
efficiencies, reduced duplication of process documentation, no forced staff
reduction and common core processes”.
The CIO had responsibility for the BPM Initiative although he directly reported to
the CFO, making the Finance Department ultimately responsible for the initiative.
A core BPM team reported to the CIO. This team was centralised with distributed
authority for process management residing within the wider business.
The Key Contact (i.e. the CIO) selected participants but did not participate in the
data collection due to existing work commitments. The study included five 1.5 to
2 hour sessions with five key personnel. During these sessions, participants
responded to questions in the Interview Guide for a given factor, provided
feedback on the Maturity Survey questions for that factor and completed the
Feedback Survey. Table 30 summaries the participation from Company A.
35
The source of the information in this section was the Establishment Survey (2004) completed by the Key Contact.
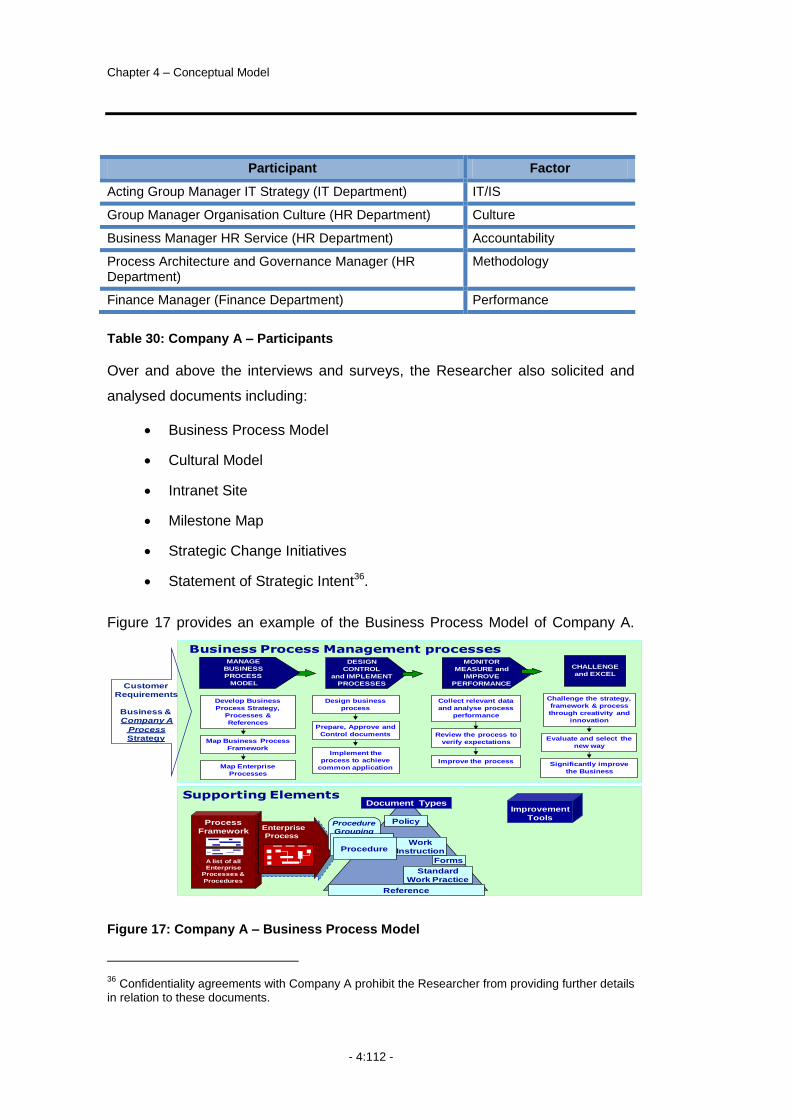
Chapter 4 – Conceptual Model
- 4:112 -
Participant Factor
Acting Group Manager IT Strategy (IT Department) IT/IS
Group Manager Organisation Culture (HR Department) Culture
Business Manager HR Service (HR Department) Accountability
Process Architecture and Governance Manager (HR Department)
Methodology
Finance Manager (Finance Department) Performance
Table 30: Company A – Participants
Over and above the interviews and surveys, the Researcher also solicited and
analysed documents including:
Business Process Model
Cultural Model
Intranet Site
Milestone Map
Strategic Change Initiatives
Statement of Strategic Intent36.
Figure 17 provides an example of the Business Process Model of Company A.
Figure 17: Company A – Business Process Model
36
Confidentiality agreements with Company A prohibit the Researcher from providing further details in relation to these documents.
Supporting Elements
Business Process Management processesDESIGN
CONTROL
and IMPLEMENT
PROCESSES
Design business
process
Prepare, Approve and
Control documents
Implement the
process to achieve
common application
MONITOR
MEASURE and
IMPROVE
PERFORMANCE
Review the process to
verify expectations
Improve the process
Collect relevant data
and analyse process
performance
CHALLENGE
and EXCEL
Significantly improve
the Business
Evaluate and select the
new way
Challenge the strategy,
framework & process
through creativity and
innovation
Improvement
ToolsProcess
Framework
A list of all Enterprise
Processes &
Procedures
Enterprise
Process
Customer
Requirements
Business &
Company A
Process
Strategy
Policy
Reference
Standard
Work Practice
Forms
Document Types
Work
Instruction
Procedure
Grouping
ProcedureProcedure
MANAGE
BUSINESS
PROCESS
MODEL
Map Business Process
Framework
Map Enterprise
Processes
Develop Business
Process Strategy,
Processes &
References

Business Process Management: Progression and Maturity
- 4:113 -
As can be seen from this model the BPM Initiative within Company A is
consistent with a lifecycle view of BPM as its focus is on the management of
processes within the organisation. The supporting elements reflect the
recognition of aspects of an organisational view, recognising the development of
a process framework, including an enterprise process model, a repository of
standards governing process work and a toolbox of process improvement tools.
4.3.2 Case Study: Company B
Company B was a government owned corporation (GOC) that operated
predominantly in the transport industry. Company B commenced operations in
1864, giving it a rich history. In the financial period 2002/03, the company had
total revenue of approximately $2 billion, assets of $7.8 billion, slightly less than
14,000 employees and four lines of business. The nature of each line of
business varied, with customers ranging from large multi-national mining
companies to everyday commuters. Table 31 summarises the key dimensions of
Company B at the time of conducting the case study37.
Company Sector Industry Employees Asset Base Start Date
B Public GOC Transport 13,700 $7.8 billion 1864
Table 31: Company B – Key Organisational Dimensions
BPM within Company B
According to the Key Contact, in 2002 the BPM Initiative within Company B
became a key concept used to manage the business. The importance of the
efficient management of processes was recognised and BPM principles
underpinned a newly implemented business model. Dissatisfied stakeholders
and customers, combined with increasing competition resulting from regulatory
changes in the industry, were driving Company B‟s BPM Initiative. The initiative
was characterised by a project that had a timeframe of three years, a team of 10
full-time staff and expected to deliver results in terms of profitability and value.
37
The source of the information in this section was the Establishment Survey (2004) completed by the Key Contact.

Chapter 4 – Conceptual Model
- 4:114 -
Initially the majority of people involved in Company B‟s BPM Initiative were from
Information Systems. Six months into the 3-year project, the size of the
community began to decrease as staff became involved in other projects.
Consequently, the team disbanded for a period of six months whilst the Business
Process Design Advisor (i.e. the Key Contact) researched BPM further. After six
months, the Business Process Design Advisor recommenced the project, armed
with deeper knowledge of BPM and a new focus for progressing.
The Key Contact selected participants for the study and participated in data
collection. The study included five 1.5 to 2 hour sessions with six key personnel.
As in the first case, participants responded to questions in the Interview Guide for
a given factor, provided feedback on the Maturity Survey questions for that factor
and completed the Feedback Survey. Table 32 summarises the participation
from Company B.
Participant Factor
Consultant: IT Alignment – Shared Services IT/IS
Principal Consultant: IT Alignment – Shared Services IT/IS
Acting Manager – Business Information Services
Accountability Culture Methodology
Manager HR Business Services & Development – HR Department
Culture
Integrated Business Systems Advisor – Strategy Unit Accountability Methodology Performance
Programme Officer – Strategy Unit Performance
Table 32: Company B – Participants
Over and above the interviews and surveys, the Researcher also solicited and
analysed documents including:
BPM Concept document
Business Model
Intranet Site
Selected process models
Internal presentations and publications.

Business Process Management: Progression and Maturity
- 4:115 -
4.3.3 Summarising BPM Initiatives in Company A and B
In summary, both Company A and Company B had a core BPM team responsible
for implementing BPM throughout the entire organisation. The BPM team within
Company A did not have the authority to enforce BPM within any area of the
organisation however and the team in Company B did. Table 33 summaries the
key dimensions of the two BPM Initiatives.
Company BPMI Resources
BPMI Scope BPMI Authority
BPMI Responsibility
BPM Approach
A
Core Team Whole Organisation
Distributed CIO reporting to CFO
Lifecycle
B Core Team Whole Organisation
Centralised Chief Strategy Officer
reporting to the CEO
Organisational
Table 33: Company A and Company B – Key BPM Dimensions
4.4 Refining the Conceptual Model
The analysis of data collected during the study led to a number of changes in the
Initial Conceptual Model resulting in a Refined Conceptual Model. This section
details the data analysis for each factor including the changes to the model.
To assess the perceived relevance of each factor to the progression of BPM
Initiatives, participants of Company A and Company B were asked to rate the
identified factors on a 1 to 5 scale, with (1) being Not Important and (5) being
Very Important. Table 34 shows the average results across the two case studies.
Performance Accountability Methodology Information Technology
Culture
Average 4.75 4.5 3.75 3.00 5.00
Table 34: Company A and Company B – Combined Factor Relevance
This outcome indicated that the participants viewed Information Technology as
being of neutral relevance, which was consistent with findings from the earlier
literature review. According to the participants, the most relevant factor was
Culture, followed by Performance, Accountability and Methodology.

Chapter 4 – Conceptual Model
- 4:116 -
4.4.1 Performance
The term performance (as used within the conceptual model) included the
measurement, assessment and actioning of BPM related performance. The
Performance factor received an average relevance score of 4.75.
Both organisations were using the Balanced Score Card (BSC) (Kaplan and
Norton, 1993) to set goals and objectives and to promote these through the
organisation. For Company A this resulted in measures being set within (not
across) functional areas with a participant stating:
“…a problem here is that we have functional management and end-
to-end processes that cut across a number of functional areas (…) we
don‟t measure process efficiency…”
According to a Company A participant, this resulted in a situation whereby:
“…there is no use of performance measures to improve processes
(…) we do measure but we don‟t do anything about it…”
Furthermore, a Company A participant indicated:
“…where we need to get to now is on measuring the process itself
rather than just focusing on the outcomes…”
Company B also used Balance Scorecard with a participant noting:
“…Balanced Score Card is based on historical issues and known
issues, arising from surveys on customer satisfaction and internal
surveys (…) although there are no resources to check how well
business units apply this…”
The result in Company B was that:
“…high-level management reports on a cross section, not on process
outputs as such, more on the outcome of the interaction of a whole lot
of processes. If it indicates poor performance they look at why things
have occurred…”
Business Process Management: Progression and Maturity
- 4:117 -
Furthermore, a Company B participant indicated:
“…this makes us reactive to some things (…) those that are more
visible get action (…) safety and the operation of trains gets the
focus…”
“…we have tended to be more worried about financial aspects and
cost drivers than performance management (…) we need to find a
balance between the two…”
Similarly, a Company A participant highlighted a need to consider future
requirements indicating:
“…policies and procedures have become more bureaucratic as we
have focused on risk management too heavily and not on process
efficiency (…) we have enormous maintenance and capital
expenditure coming up (…) we have limited financial and human
resources so efficiency is critical to future operations and we need
process effectiveness to cope…”
In doing this the Company A participant suggested that:
“…to improve processes, we need to improve the management of
information around processes (…) now to get funding you need to
say what the benefits are and how they are going to be measured…”
The management of the performance of individuals was also notable in both
organisations, as evidenced by the development of Performance Management
Plans and the use of individual KPI‟s. A Company A participant indicated:
“…no performance measures on the process are related to their KPI‟s
or bonuses on their roles within the process (…) for each person
there are KPI‟s around the management of their section of the
process…”
Chapter 4 – Conceptual Model
- 4:118 -
A Company B participant indicated:
“…a number of initiatives are run outside of accepted practices (…)
this gives us internal performance issues…”
This indicated that despite the use of KPI‟s and Performance Measurement
Plans, measures for individual performance did not necessarily relate individual
effort to process performance.
The Researcher noted that participants discussed the need to align performance
with other areas such as governance, risk and finance systems. In discussing
performance for example, a Company B participant stated that it:
“…ties to Governance framework – if new legislation comes in, the
BPM unit is responsible for controlling and co-ordinating the changes
throughout the business…”
When discussing process performance a Company A participant indicated:
“…we still need to look at priorities and plan these in the future –
working from a risk management perspective…”
Within Company B a participant indicated:
“…when reporting on the performance of a process improvement
project it needs to be aligned with the budget and have a variance
analysis done (…) variance analysis within SAP is being aligned with
the end-to-end process… ”
As a further practical example of aligning process performance with strategic
issues, a Company A participant indicated:

Business Process Management: Progression and Maturity
- 4:119 -
“…we had 6 ways of doing asset management, from reasonable
systems to no systems, we didn‟t know how many poles we had,
where they are, what condition they are in (…) this presents
significant risk and litigation issues. Being able to locate the poles
and knowing where the defects were enabled us to undertake a
defect identification project to find them and within 6 months, we fixed
them all. Now we meet statutory requirements and have an Asset
Inspection and Defect Management Process to ensure this
continues...”
Furthermore, in analysing the case study data, the Researcher noted an overlap
between the methods detailed for the Alignment perspective and details provided
by participants when discussing Performance. The highlighted sections of Table
35 show this overlap.
Company A Company B
Process and Quality Strategy
Balanced Score Card
Benchmarking – UMS (utilities) benchmarking
Customer Surveys
- Once a year
Process Management Manual
BPM Methodology
- Aligning Government Management Framework to this
Performance Measurement Framework
Balance Score Card
- To align measures with goals and objectives
SCOR process model
Project Management Framework
Table 35: Company A and Company B – Select Methods for Alignment
Based on these aspects, the Researcher extended the Performance factor
to incorporate the two concepts of Alignment (i.e. originally a
perspective) and Performance. Furthermore, because of the need to
align performance with strategic goals and objectives, budgets,
governance and legislative drivers the Researcher modified the name of
the factor to Strategic Alignment.
Chapter 4 – Conceptual Model
- 4:120 -
4.4.2 Accountability
Accountability, as used within the conceptual model, included the assignment of
responsibility and accountability to personnel within the organisation. There was
affirmation for the inclusion of the Accountability with it receiving a relevance
score of 4.5 making it one of the top three factors.
Within both companies, there was high-level assignment of accountability for
processes but there was little assignment of accountability below the executive
and senior management level. A participant from Company B stated:
“…we are currently doing accountabilities for Senior Executives and
aligning them with processes (…) at this stage just to Senior
Executive level, the others will happen over time…”
Similarly, a participant from Company A indicated:
“…there are various levels of accountability especially in finance
where it is quite rigorous however it is aligned with operations not the
strategic accountability tree…”
“…other than finance, there is no alignment between accountability
and goals (…) with the exception of the senior executive level where
there is a little in the strategic area…”
Both companies assigned process accountability within existing functional silos
and did not assign accountability based on end-to-end processes. A participant
from Company B indicated:
“…accountability is aligned to silos with managers assessed on
individual business units not within the value chain, therefore they are
not strategically aligned (…) individual goals are not the same as
process goals as they only look at one part of the process and not the
whole process…”
Business Process Management: Progression and Maturity
- 4:121 -
A participant from Company A stated:
“…the process the business goes through is key deliverables and key
results areas are pushed down from the top and all managers have
key deliverables that are tied back to this (…) this is not related to
processes (…) it is still a functional based approach at most levels
with lower levels being more procedural…”
Participants within both companies indicated that accountability by itself was not
sufficient for achieving the desired actions from individuals within the
organisation. A participant from Company B indicated:
“…the employee‟s hands are tied as the authority to change lies with
accountability and at best they have responsibility…”
An issue arising from the lack of a formal accountability framework was the
dependence on the motivation of the individuals. Participants from Company A
indicated:
“…there isn‟t much direct accountability for process in Company A,
lots of work is being done but when it falls over there is a blameless
society that doesn‟t accept responsibility (…) what is missing is that
we don‟t hold people accountable…”
“…people just do their own thing, they don‟t accept new guidelines,
there is no acceptance of responsibility…”
Similarly, a participant from Company B stated:
“…there is a formal accountability framework versus the informal
accountability framework, some managers make themselves
accountable for the execution of processes, these show responsibility
that lead to efficiency gains but it depends on the individual (…)
consequently results fluctuate dependent on the areas where the
managers have self imposed accountability…”

Chapter 4 – Conceptual Model
- 4:122 -
Participants within the two companies indicated a need to improve the
accountability for process. Comments from Company A participants included:
“…the entire process is not satisfactory, people at the bottom end
don‟t know what deliverables are or are not accountable for the
outcomes…”
“…there is a lack of understanding and a poor reaction, we seem to
be falling short of doing anything about it (…) there is a real
commercial need to deliver in the Distribution area, Retail is a bit
better but it really comes back to the maturity of the organisation…”
“…a manager can have up to 25 key deliverables (…) best practice
indicates they should have 5 to 6 so they are defeated before they
even start (…) this affects their ability to prioritise as they have an
inability to know what is important…”
“…we are definitely lacking, not motivating to perform at a level, we
need to create an attitude that less is more with regard to the number
of key result areas…”
Participants from Company B also identified areas of deficiency in their approach
indicating:
“…no one has accountability for things like the provision of tools…”
“…there is no accountability for improvement of BPM. It is pretty
much just whatever is flavour of the month…”
“…accountability for processes is weak, systems people have
responsibility for audit but no-one is overseeing it to ensure anything
is done about it…”

Business Process Management: Progression and Maturity
- 4:123 -
A participant at Company B highlighted one potential source of this lack of
accountability indicating:
“…85% of the company is covered by a union (…) if we try to change
anything the union will become involved and Company B gets gun-
shy (…) as a result there doesn‟t seem to be any accountability…”
In an attempt to address the lack of accountability, a participant at Company B
indicated that:
“…the new Business Model based on process orientation will change
practices and documentation (…) it details the organisation (structure,
corporate performance and accountability), the strategic processes
(planning, management and reporting), the people (role definitions,
capability and reward and recognition) and the systems (all
systems)…”
Like Company B, participants at Company A highlighted areas of difficulty in
modifying the accountability structures indicating:
“…if it is a non-award person it possibly leads to reward and bonus
(…) however if it is an award person it is linked to an Enterprise
Bargain Agreement that has automatic increases (…) the ability to
measure performance is hard to do within the industrial sector…”
and
“…we need to balance what is done with a culture of risk aversion
(…) we had a project to look at how we employ contractors and
expert consultants as we couldn‟t identify contractors within the
company. We spent 18 months to 2 years working to develop a
process that is so well documented but it is too unwieldy to use
because we tried to overprotect with good governance principles so
wrote a process that would never get us into trouble but was
completely unworkable…”
and
Chapter 4 – Conceptual Model
- 4:124 -
“…retail thinking and deliverables is much more commercially driven
and better at accepting responsibility but not necessarily
accountability (…) they are less unionised, they are a newer arm of
the business with less history and are more commercially driven…”
Furthermore, the need to focus on decision-making was evident in a number of
comments. Comments from Company A included:
“…lots of people are too frightened to make decisions or do
something. There is lots of arse covering to ensure nobody is at
fault…”
“…there is no specificity (…) if managers are less specific it makes
their life easier, it is a self-serving principle (…) accountability needs
to be driven much harder from the top…”
“…there is a lack of co-ordination between projects and policies, and
practices are determined by sticking a finger in the air (…) we use
consultants and contractors that do things their own way…”
Other issues with decision making at Company A included:
“…the new CEO is looking to devolve the business from being
autocratic and bureaucratic which is seen to slow things down and
make us less reactive competitively…”
“…we have adopted a federal model of centralised process
management and decentralised areas have a stake in process
outcomes…”
In analysing the case study data, it became apparent to the Researcher that
assigning accountability was only a sub-set of a larger issue and in itself, was not
sufficient for promoting desirable behaviours. Both companies faced issues with
changing the culture and people within the company through a lack of authority
and influence. Evidence supporting this view included reports of a lack of
empowerment, the need to change from a control and command environment,
over reliance on compliance and an inability to affect reward and remuneration

Business Process Management: Progression and Maturity
- 4:125 -
structures in order to address performance issues within people and ultimately
within processes. Furthermore, there was evidence that there was a lack of
process-based decision making within the companies and an absence of
direction in some aspects such as authority for the selection of tools.
4.4.3 Methodology
Within the initial conceptual model, the Methodology factor encapsulated the
adoption of recognised methodologies for use in BPM. The relevance score for
Methodology of 3.75 indicated that participants did not rate this factor as being as
important as Performance, Accountability and Culture but that it was more
relevant than IT/IS.
A Company B participant noted the importance of methodologies for gaining
consistency, indicating:
“…methodologies enable the comparison of apples and apples and
have a lot of supporting documentation that enables self education…”
Similarly, a Company A participant indicated:
“…methodologies have led to consistent ways of producing (…) audit
indicated that there was a degree of understanding regarding
process…”
The case study showed that companies use a range of methods and
methodologies in their BPM Initiative. Company B used Six Sigma as a method
for process improvement, but it also had a BPM Methodology that links with its
governance framework to link decision making and accountability. A participant
Consequently, the Researcher extended the Accountability factor to
include decision-making, authority and compliance. To recognise this
broader intent, the Researcher subsequently renamed the factor
Governance.

Chapter 4 – Conceptual Model
- 4:126 -
from Company B however, indicated:
“…Six Sigma provides a standard approach to implementation but
doesn‟t measure the actual improvements (…) we currently have no
means of determining how effective Six Sigma is…”
This highlighted a need to consider the management of the methods themselves
and not just the use of the methods.
In a similar vein, a Company A participant noted:
“…the governance role is important for getting consistency, it controls
whether things get published on the intranet…”
Furthermore, in discussing methodologies the Company A participant discussed
the role of the Business Unit Working Group that consisted of the Process
Managers. This group was responsible for:
“…formal updates, quality of content, new frameworks and interface
agreements…”
This indicated to the Researcher that there was a potential connection or overlap
between the Methodology factor and the Accountability factor. Consequently, the
Researcher reconsidered the name and intent of the Methodology factor to
ensure clarity. In doing so, the Researcher noted an important distinction
between the terms methodology and method. This distinction was that method
refers to the procedures and techniques whilst methodology includes the
principles that guide the deployment and integration of the methods.
Considering this distinction in light of the case study data, the Researcher
contends that something can be a method or a methodology dependent on the
context of its use. One could argue that Six Sigma is a methodology for process
improvement because it provides guidance on how to combine different methods
(such as DMAIC, fishbone diagrams and other similar methods) when improving
processes, for example. This study is considering BPM and not process
improvement, however.

Business Process Management: Progression and Maturity
- 4:127 -
From a BPM perspective where the focus is on management of the process
lifecycle or the organisation, Six Sigma is one of a number of approaches that a
company can include (along with other approaches such as Lean) in an
overarching toolbox. From a BPM perspective, the principles associated with
deploying and using approaches such as Six Sigma and Lean become different
to the principles for deploying the same approach for process improvement. A
BPM methodology may include deployment issues as:
Which methods does the organisation use for process improvement – Six
Sigma, Lean, an in-house development, or other similar methods?
Which methods does the organisation use for modelling processes? Is it
BPMN, IDEF0 or other similar methods?
Are the same methods used within all business entities, or is Lean used in
the manufacturing arm of the business and Six Sigma in the services
area?
Consequently, from a BPM perspective, Six Sigma and Lean (and other
approaches and techniques applied to various stages of the process lifecycle)
are methods and not methodologies. Table 36 shows the methods used within
the BPM Initiatives of the two companies.
The concurrent review of the Accountability factor and the extension of this factor
meant that the new Governance factor would encompass BPM decision-making
and principle setting. The need to make factors independent of each other led
the Researcher to refine the intent of the Methodology factor to include the
application and use of the methods but to exclude the principle setting associated
with deployment.
Consequently, the Researcher decided to keep the Methodology factor but
to rename it Methods to reflect the separation of usage from decision-
making and principle setting which would be included in Governance.

Chapter 4 – Conceptual Model
- 4:128 -
Perspective Company A Company B
Alignment Process and Quality Strategy
Developing a new process framework but this needs buy-in
Balanced Score Card
Benchmarking – UMS (utilities) benchmarking
Customer Surveys
Once a year
Process Management Manual
Custom methodology
Available to everybody on the intranet
Provide training in the methodology
BPM Methodology
Plan, do, check, act cycle
Aligning Government Management Framework to this
Takes into account Process Owners, cross functional teams and a tool kit with the steps to go through
Performance Measurement Framework
Balance Score Card
To align measures with goals and objectives
SCOR process model
Used to align process models internally
Change Management Programme
Project Management Framework
Design
Accenture Reference Model
Processes for the Utilities industry
Anyone can design a process
IDEF and IDEF0
Process Flow Diagrams
Value Chains
AS-IS and TO-BE modelling
Execution
Just part of what is done
Have to follow methodology as it is gate controlled
Integrated total quality management system
Benchmarking

Business Process Management: Progression and Maturity
- 4:129 -
Perspective Company A Company B
Formal change process owned by HR
Process people (i.e. employee and organisational services) are more closely aligned with the change area
Applied inconsistently
Control
ISO 9000 Compliance Service Level Agreements
Being used to align performance with measures
Link to Intranet site for information
Opportunity Improvement Register
Reviews policies and processes for compliance within each business area
Channels information
Internal Audit, Post Implementation Reviews and Full-ups
Improve
None in use
Will be considered in the next stage
Design, control and implement all joined
Starting to look at ABEF
Six Sigma
Motorola Methodology
For AS-IS and TO-BE
Integrated Quality Management System
Gives consistent approach
Table 36: Company A and B – Methods used within the BPM Initiatives
Chapter 4 – Conceptual Model
- 4:130 -
4.4.4 Information Technology
Within the initial conceptual model, this factor included the use of IT resources in
the implementation and conduct of BPM. Participants from both companies
indicated that IT was vital to the operation of the companies. Despite this, IT
received the lowest relevance score during the case studies, averaging a score
of 3.
According to a Company A participant, the BPM Initiative had not resulted in
improvement in the suitability of IT functionality, indicating:
“…it‟s not thought through that way (…) processes still live in silos
(…) at a high level people talk about process but a low level the
thinking is about functions…”
This manifested in passive resistance to technology changes and a division
between the process area and the business, evident in the statement by a
Company A participant that:
“…people don‟t understand what is being pushed from the process
area (…) it‟s a change management issue whereby they agree on the
surface but resist in strange ways…”
Similarly, within Company B a participant stated that:
“…all new IT projects should go through a business process analyst,
however this is sometimes skipped for urgency and the business
requirements are done and signed-off by the Process Owner…”
This caused problems however because the:
“…business understanding of the process is not good and there is a
reliance on user acceptance testing to pick things up…”
Within Company B, a participant indicated:
“…there is a bottom-up approach to IT planning (…) it is done as a
part of the Corporate Budget and Planning…”
Business Process Management: Progression and Maturity
- 4:131 -
This approach resulted in mixed results. According to a participant within
Company A, the use of IT in automating processes was not always beneficial due
to a lack of supporting methods for undertaking the analysis. For example:
“…processes are not looked at deeply enough and changes do not
always incorporate needs of all business areas (…) the automated
timesheets have become less efficient but the travel system more
efficient…”
Similarly, within Company B a participant indicated:
“…no-one really thinks about the solution, what value it is going to
add, why it‟s being done (…) cost and time is more important than
business fit...”
Company A had found that the use of IT in the design of processes led to
improvements with a participant stating:
“…we just released a new Contractors and Consultancy process,
taking six processes and merging into one. One thing that helped
enable this was the level of duplication evident in search returns
leading to an increased awareness of the duplication…”
Similarly, within Company B, a participant indicated that the use of System
Architect had:
“…established control, structure and rules, everyone must follow the
methodology and it ensures a consistent approach although some
areas are better than others…”
Company A found success stories to be beneficial in helping to build future
systems around processes. A participant indicated:
“…we used SAP to implement the Pole Inspection process and
replace the manual system. This enabled asset identification when
inspecting the poles. This was the first thing, but now the thinking is
spreading into a more integrated system project to build on this…”
Chapter 4 – Conceptual Model
- 4:132 -
Company B had similar evidence of success with automating aspects of a
process with a participant indicating that the use of capacity planning tools was
critical:
“…we couldn‟t survive without the capacity planning tools, the running
of the monthly reports (…) used to take 3 or so weeks, the new
system takes half an hour…”
Table 37 shows the IT in use within the two companies. This data showed that
despite a multitude of systems in evidence, these rarely corresponded to end-to-
end processes, thereby creating the need for interfaces or integration. In both
companies, email featured heavily as a means of communicating BPM practices,
with both companies having intranet sites with dedicated BPM areas. Company
A‟s intranet site was the third most visited site next to the telephone directory and
job vacancies. Aside from benefits to the improvement of specific processes,
Company A and B displayed IT benefits in the automation and standardisation of
BPM tasks, improved access and governance of consistent information, and as a
means of communication.
Consequently, the Researcher decided to retain the Information
Technology factor within the model.

Business Process Management: Progression and Maturity
- 4:133 -
Perspective Company A Company B
Alignment Process Document System
A web based system on the intranet that everyone can access
Stores all forms and process documents
Integral to the orientation of new staff to processes
Use a Systems Agreement to guide desirable behaviour
Email System
Solicit feedback on particular topics
Website for Process Management
Communication of guidelines and specifications for processes
Quarterly updates of what BPM group is doing
Design
4TQ
Flowchart software used to model inputs and outputs of the process
User friendly
Access given to those who want it
Cheap/local product that may not be supported
Thinking of using ARIS
System Architect
Visio
Execution
Significant but disjointed
1000 systems, 800 desktop applications
Looking to integrate ERP system rather than best of breed
Expected to capture about 50% of existing systems
SAP R 2 (but heavily customised)
Prolific number of MS-Access databases
Majority developed in-house
Starting to use integration tools to build interfaces and the human integration is to be replaced with system integration
HEAT Workflow (Call Centre)

Chapter 4 – Conceptual Model
- 4:134 -
Perspective Company A Company B
Staffware
Processes often aren‟t designed so ad hoc workflow prevalent
Refusal to use and going outside of system with emails
Control
Intranet
Approval names automatically put on process documents
38 separate and disjointed Incident Management Systems as a risk adverse organisation
Low levels of IT usage - unless functionality within the standard system this is not done
SAP for Procurement process
Authorisation held within process
Very locked down
Delegation tightly controlled
Track maintenance, alerts for problems done by fax and email
Improvement
Intranet
Use intranet portal to identify process owner, download process model, change model and submit for update
Access list of System Owners
Business Process Document Co-ordinator manages
Some capacity tools
Within certain areas such as Product X Haulage Simulation, Track Planning Capacity, Capacity Dynamics Project
Table 37: Company A and Company B – IT used within the BPM Initiatives

Business Process Management: Progression and Maturity
- 4:135 -
4.4.5 Culture
Within the model, the Researcher initially defined Culture as the acceptance,
practice and promotion of BPM within the organisation. The Culture factor
received a relevance score of 5.0, making it the highest rated factor and affirming
its importance to the model.
The range of comments from participants showed the effect and potential
consequence of culture on the progression of BPM supported this rating. The
challenges of changing culture were also notable however. A Company A
participant, for example, claimed:
“…the process side is reasonably straight forward, the soft bit is the
hard bit and requires considerable negotiation and compromise (…)
realisation about the behaviour, beliefs and mind sets of
organisations (…) the socialisation impact…”
The data showed the effect that the existing organisational culture had on the
ability to progress with the BPM Initiative. The Key Contact at Company A
indicated that there was “opposition”, “avoidance” and “conventional” cultural
divisions towards the BPM Initiative. This led to a level of resistance expressed
in comments from a Company A participant that:
“…there is an attitude of, this is the way things are done so don‟t rock
the boat…”
Similarly, in Company B, the Key Contact described the organisation as
consisting of three distinct groups with respect to the adoption of the BPM
Initiative:
“…we have three groups (…) the coalition of the willing, this is the
younger people under 35 that are frustrated by being hampered (…)
the old school Company B who have seen it all before and want to
know why are we doing this (again) (…) and the innocent bystanders
(…) those that have no idea about what‟s going on and just want to
take the path of least resistance…”
Chapter 4 – Conceptual Model
- 4:136 -
There were numerous consequences arising from the culture of the organisation.
With regard to resourcing of projects within the BPM Initiative, a Company B
participant indicated that:
“…if it is a special project some areas will put their „finest‟ on it (…)
others give resources to get them out of their own backyard and not
because of the expertise (…) suitability comes when self-driven and
the areas start something themselves…”
Whereas, with regard to advancing processes through innovative thinking, a
participant from Company A stated that:
“…generally there are low levels of innovation as this is not a natural
reaction of the operation…”
Similarly, within Company B a participant indicated:
“…people just focus on the part that suits their own agenda (…) there
is no real control over process outcomes, change is not happening
across the silos (…) there is a mentality of „we do everything
differently‟(…) most areas only look at own areas and don‟t look at
end-to-end…there is no consistency and no common goal…”
Both companies experienced consequences with regard to how people respond
to process change. In Company A, this reflected in disparate views with a
participant indicating:
“…there is avoidance, whereby there is a sense of „its just going to
change so don‟t worry about it‟ (…) and there is conventional,
whereby individuals say they are „just following policy or process
procedure‟…”
Within Company B, it reflected in a lack of knowledge sharing and the protection
of self-interest, with participants indicating:

Business Process Management: Progression and Maturity
- 4:137 -
“…an attitude of looking for „what‟s in it for me‟ not how can they
improve the process (…) in general they will only do it if they see
personal value (…) the exception is those with personal values…”
“…people have their pet way of doing things and they don‟t like to
share, knowledge is power so there is no knowledge transfer, no
working to a common goal…”
For Company B this resulted in a number of consequences, for example a
participant stated:
“…we need to really look at cultural issues. There is no focal point in
the organisation, no common corporate direction. The result is poor
resource allocation, poor budget allocation, lack of clarity and
understanding…”
“…there is an issue with Company B demographics and with
centralised management rather than regional management (…) need
strong presence to change…”
This highlighted the role of change management with regard to progressing BPM
Initiatives. To address these problems, a participant within Company B stated:
“…change management is being used with the Business Model
implementation, also we have implemented values and behaviours
based on the results of employee survey which shows we have gaps
in leadership and innovation…”
Similarly, a participant with Company A indicated:
“…when change management aspects are done well people‟s
acceptance of process change is pretty good, when change
management is not done well acceptance is not good…”
Communication was another way in which companies sought to advance their
BPM Initiatives. A participant from Company B suggested that:

Chapter 4 – Conceptual Model
- 4:138 -
“…there is some corporate strategy on the Intranet but no central hub
of information (…) this would be nice to have (…) however improved
communication is leading to greater acceptance…”
Participants from Company A also discussed the role of communication, looking
at the effectiveness of communication and indicating:
“…there is an issue with how organisation is informed, we use
communication up-dates which is an email on a monthly basis
regarding the process/procedure that is being worked on (…) they
look at end-gain but they are not really listening…”
Furthermore, participants from both companies indicated that implementing BPM
requires a long-term commitment, with Company B stating:
“…it is only early days (…) only 18 months old and we are expecting
that it will take 3-5 years to show real success (…) initial response
has been positive…”
Similarly, a participant from Company A indicated that:
“…there has been bottom-up ground swell from people not being able
to do their job (…) it has been 12-18 months with no discussion but
now the tides are turning and it is a key topic of discussion (…)
people are fighting back…”
Both organisations felt that leadership was critical to overcoming cultural issues
and was essential to progression. A participant from Company B for example,
stated that:
“…leadership from the top is seen as vital and need to be actively
supporting / committing (…) we are using a senior executive change
team…”
A participant from Company A however, highlighted the need to recognise the
affect of different leadership styles, indicating that:

Business Process Management: Progression and Maturity
- 4:139 -
“…personality and leadership is important, different styles of people
can result in a sub-optimal approach…”
When discussing how they sought to progress their BPM Initiatives, there was
further evidence of the importance of addressing leadership. A participant from
Company A indicated that:
“…we need to adopt psychological principles of acceptance of
responsibility (…) coaching, mapping leader profiles, to impact of the
organisation…”
Similarly, a Company B participant stated that:
“…we address silo mentality with leadership programs, training
schemes, reviewing recruitment and selection to include values as
well as technical…”
The vital role of Culture on the progression of BPM Initiatives was obvious
throughout the data. Recognition of the existing culture and the need to change
the culture to ensure the progression of BPM Initiatives by changing attitudes and
behaviours and improving the clarity of the initiatives was apparent during the
early stages for both companies. Furthermore, the need to take a long-term
approach and to address different leadership styles to ensure optimal results was
also evident.
Through the case studies, there was recognition of a need to focus on the skill
sets within the company and addressing shortcomings by teaching people within
the organisation. This was apparent in the statements that participants made
regarding other potential areas for measurement, including a Company B
participant asking:
“…should we invest more in Education and Training…”
Similarly, Company A participants raised questions including:
“…do we have the right skill sets in the right places…”
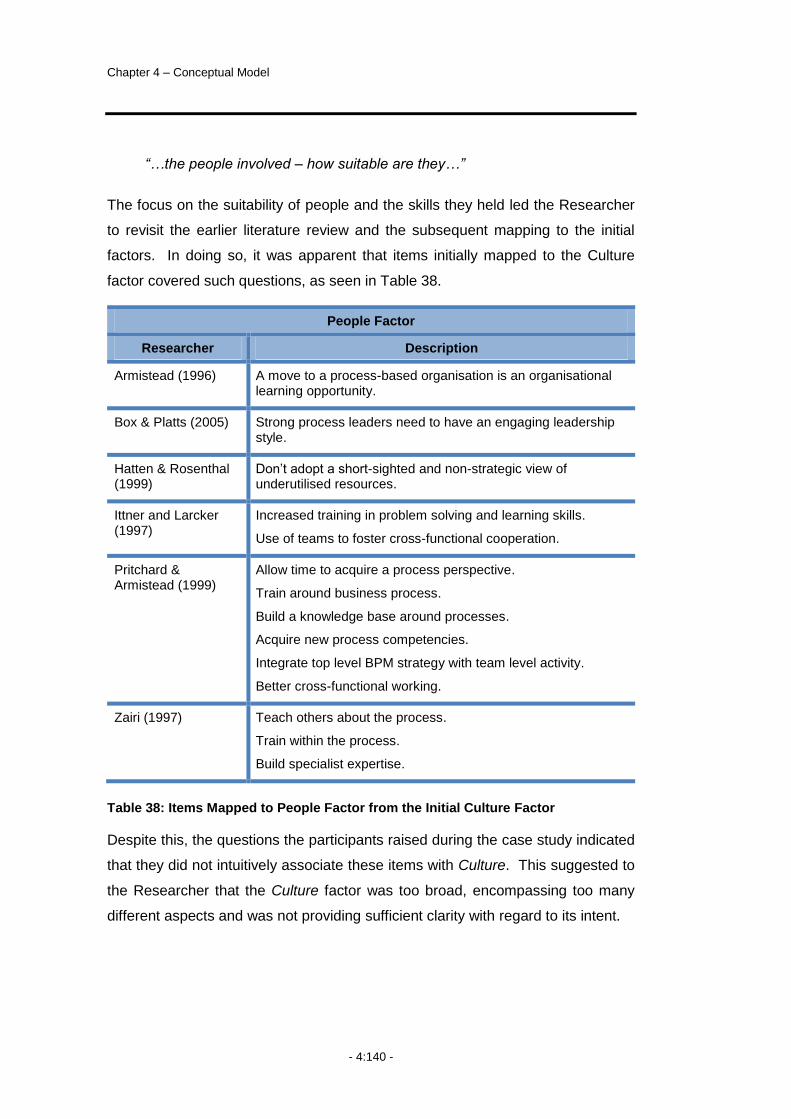
Chapter 4 – Conceptual Model
- 4:140 -
“…the people involved – how suitable are they…”
The focus on the suitability of people and the skills they held led the Researcher
to revisit the earlier literature review and the subsequent mapping to the initial
factors. In doing so, it was apparent that items initially mapped to the Culture
factor covered such questions, as seen in Table 38.
People Factor
Researcher Description
Armistead (1996) A move to a process-based organisation is an organisational learning opportunity.
Box & Platts (2005) Strong process leaders need to have an engaging leadership style.
Hatten & Rosenthal (1999)
Don‟t adopt a short-sighted and non-strategic view of underutilised resources.
Ittner and Larcker (1997)
Increased training in problem solving and learning skills.
Use of teams to foster cross-functional cooperation.
Pritchard & Armistead (1999)
Allow time to acquire a process perspective.
Train around business process.
Build a knowledge base around processes.
Acquire new process competencies.
Integrate top level BPM strategy with team level activity.
Better cross-functional working.
Zairi (1997) Teach others about the process.
Train within the process.
Build specialist expertise.
Table 38: Items Mapped to People Factor from the Initial Culture Factor
Despite this, the questions the participants raised during the case study indicated
that they did not intuitively associate these items with Culture. This suggested to
the Researcher that the Culture factor was too broad, encompassing too many
different aspects and was not providing sufficient clarity with regard to its intent.
Business Process Management: Progression and Maturity
- 4:141 -
4.4.6 Role of Context
Analysis of the case study data highlighted the role of an organisation‟s
contextual environment on the progression of BPM. This environment can act to
(a) affect the progression of the BPM Initiative and (b) affect the ability to
advance appropriate practices within the BPM Initiatives, or both, as the following
examples show.
When asked to nominate other potential factors for inclusion in the model, a
number of participants mentioned leadership, as evidenced by the comment by a
Company B participant that:
“…Leadership could be another one if not already included in the
Accountability factor...”
In a similar vein, a Company A participant suggested that another factor could
be:
“…Leadership (…) as distinct from Culture…”
In other case study data, comments by Company B participants regarding the
consequence of leadership included:
“…it depends on leadership (…) they don‟t look at what‟s best for
Company B but rather what is best for their area…”
Consequently, the Researcher created a new factor of People to
encompass the more tangible aspects relating to the people within the
organisation.
The Culture factor would remain and would encompass the less tangible
aspects associated with the people and environment of the organisation
(such as mindset and attitude).

Chapter 4 – Conceptual Model
- 4:142 -
“…it would be nice to have a consistent approach through leadership
and a common understanding of the end result…”
The critical role of leadership was evident with a Company A participant stating:
“…the CEO was quite process oriented, being from a process
reengineering background, however although he had a high level
background, this didn‟t flow through to practice due to a laissez-faire
attitude (…) success factors are skewed to top level support having
knowledge AND doing something…”
These comments showed that leadership is a critical aspect for progressing BPM
Initiatives. They also showed however, that the notion of leadership crosses over
multiple areas. A Company B participant suggested that leadership was
separate to Accountability, whilst a Company A participant indicated that it was
separate to Culture. Other comments showed that leadership affects the
consistency of the approach to the BPM Initiative itself, as well as to the adoption
of practices within the initiative. The contrasting views caused the Researcher to
revisit the notion of leadership.
Leadership has the potential to affect a BPM Initiative in multiple ways. First, it
can affect whether or not an initiative exists. Second, it can affect what the
initiative looks like, that is, the areas of the organisation to which the initiative
applies (i.e. its scope) and the manner in which the initiative progresses (i.e. the
approach taken to implementation). Third, it can affect the selection of practices
when looking to progress the initiative. Due to its critical role, if leadership of a
BPM Initiative is poor, there may be a need to improve this before focusing on
other areas. Alternatively, without strong leadership, the ability to change certain
practices may be limited, as seen in the case studies with regard to
Accountability and Culture. Furthermore, as evidenced by comments from a
Company A participant, it is not just having the knowledge but also actioning that
knowledge that is critical. Consequently, the Researcher favoured the use of a
term that conveys a strong and dedicated commitment from executives such as
Executive Buy-In.

Business Process Management: Progression and Maturity
- 4:143 -
At this stage however, Executive Buy-In was not a separate factor within the
proposed in the model. This was because the practices and actions (both
existing and possible) within other factors are in part due to, or affected by, the
level of Executive Buy-In that exists within the organisation. To this end,
Executive Buy-In represented an important component of the contextual
environment in which a BPM Initiative exists. The potential for Executive Buy-In
to shape the BPM Initiative with respect to its scope and approach also
suggested to the Researcher that it might be more significant than other
contextual variables found to affect progression.
A major driver for the BPM Initiative within Company A was the integration of six
companies into one. According to one participant, this resulted in the use of:
“…an inordinate number of policies and practices…”
According to a participant, in some cases Company A had:
“...7 (policies) doing the same thing…”
This led to Company A adopting a strong focus on governance to enforce a:
“…single source of truth…”
Similarly, within Company B one participant articulated the initial drivers:
“…we are very compliance focused and do risk assessments to the
nth degree (…) we also have a strong safety culture (…) would be
good if we could harness that and push to other areas…”
Consequently, Executive Buy-In was important to the progression of BPM
Initiatives but further investigation was required to confirm its position
within the Initial Conceptual Model.

Chapter 4 – Conceptual Model
- 4:144 -
One participant in Company A indicated:
“...the bureaucratic nature of the organisation has lead to a (too
heavy) focus on risk management and not on process efficiency...”
Another Company A participant commented that:
“...the pendulum has swung too far (…) and a detailed procedure is
being written to micro-manage the process…”
Yet another Company A participant indicated:
“…execution in many instances has failed as it is a product of the
culture and the environment and a failure to change with the times…”
Similarly, a participant within Company B suggested:
“…one of our biggest problems is that we reward fire-fighters but
these are also the fire-starters (…) we reward for the wrong
reasons…we don‟t look at proactive issues (…) we have awards that
are focused on operational issues…”
This suggested to the Researcher that, over time, an organisation needs to
adjust its response to the contextual environment, and its adoption of
BPM practices, to ensure they remain aligned and balanced over time.
This indicated to the Researcher that the initial drivers of the BPM
Initiative are likely to influence the adoption of BPM practices at the
beginning of implementation.

Business Process Management: Progression and Maturity
- 4:145 -
Both companies indicated an inability to progress practices in certain areas due
to the level of unionisation that existed within the Company. A participant within
Company A stated:
“…the union environment is very much about one way to do things
versus allowing variation (…) it results in an authoritative approach –
does it become or is it a factor (…) it‟s a bit of chicken and egg, rather
than constructive / consulting approach there is the use of blame /
allocation, a heavy focus on blame…”
Similarly, a Company B participant indicated that:
“…skills and knowledge are in isolated pockets, we have an internal
labour market (…) it is hard to get new skills into the organisation due
to the recruitment of internal applicants and union involvement…”
Consequently, following the case studies the initial conceptual model was refined
as shown in Figure 18.
Consequently, the Researcher contends that the existence of some
contextual variables (such as the level of unionisation), can affect an
organisation’s ability to advance the development of capabilities that
are important to progressing BPM Initiatives.
This study includes investigation of the role and affect of contextual
variables but the identification of all possible contextual variables is
outside of the scope of the study.

Chapter 4 – Conceptual Model
- 4:146 -
Figure 18: Refined Conceptual Model
4.5 Consequence of the Case Studies
During the case studies, the Researcher identified two further areas that
influenced the progression of the study:
1. Need to extend the model
2. Need to address terminology issues.
The next sections provide further discussion on these points.
4.5.1 Model Extension
To assess the completeness of the proposed factors, participants from Company
A and Company B had the opportunity to comment on the five factors included
and to identify other factors they believed to be critical to the progression of BPM
Initiatives within organisations.
Organizational Context•Leadership?•Demographics? •Unionization?
Strategic Alignment
Measures
GovernanceMeasures
MethodsMeasures
Information Technology
Measures
PeopleMeasures
CultureMeasures
BPM Maturity
What are the relationships
between these?
Are there more?
What is the implication of ‘time’?
What role do these
play?
What are these?

Business Process Management: Progression and Maturity
- 4:147 -
A number of participants commented with respect to the proposed five factors
with one Company B participant stating:
“…the five chosen are believed to be the appropriate factors…”
Others extended or clarified dimensions within these factors. With regard to the
Performance factor, a Company A participant suggested that there be:
“…some effort to identify measures up front and to consider both the
current and desired future state…”
Another Company A participant suggested that the Culture factor include:
“…consideration of both internal and external factors (...) and the
inclusion of environmental issues such as industry and sector, the
role of government controls, and tight industry regulation and
intervention…”
A Company B participant suggested providing further clarity around the factors,
as evidenced in the comment:
“…further expansion of the Performance and Culture factors would be
useful...”
Whilst a Company A participant queried the inclusion of:
“…stakeholders, other than customers…”
Together with the changes resulting in the Refined Conceptual Model,
these remarks indicated to the Researcher that further clarification and
definition of the factors would be beneficial.

Chapter 4 – Conceptual Model
- 4:148 -
4.5.2 Terminology Issues
In undertaking the case studies with Company A and Company B, the
Researcher became increasingly aware of the affect of terminology. This had the
potential to influence not only the design of data collection and assessment
instruments but also the ability to gain comparable information across
companies.
With regard to the BPM Initiative, a participant within Company A indicated that:
“…the ambiguity of the issue means it takes 2 years for senior
managers to get it…”
Whilst within Company B a participant stated:
“…we do have a BPM Intranet site but a lot of BPM initiatives are not
recognised as BPM (…) it is not communicated well and often
depends on the business unit…”
This reflected in participants from both companies stating that they were not
comfortable with using the term BPM within the case studies. Company B
participants however, were more vocal about its use, with one participant
indicating that:
“…the IT unit had taken the term and run with it but their definition
only uses BPM in a strict IT sense…”
A replacement term suggested by a number of participants from Company B
was:
“…process-oriented approach…”
Within Company A, employees used the term process when referring to work
procedures applied to tasks within functional departments. The Business
Process Model however, used the term process in a broader context, capturing
the end-to-end process for the company. To address inconsistent terminology,
Company A had built definitions of the terms into their Business Process Model.
Business Process Management: Progression and Maturity
- 4:149 -
In another example, during the case studies, both companies indicated that they
used slightly different terms and definitions for the perspectives38. In one case, a
Company A participant queried the absence of an analysis phase. Whilst
another participant in Company B indicated:
“…The five perspectives; Align, Design, Execute, Control and
Improve are sufficient. Company B may not exactly call them exactly
that but the meaning is the same…”
During the review of the Maturity Survey questions, participants had issues with
the use of the terms core and non-core processes. Within the survey, the
Researcher had distinguished between core and non-core processes in an effort
to explore whether companies varied the application of practices dependent on
the significance of the process to the company. Participants acknowledge that
this was the case, however they also reported being confused as to which
processes the survey was referring to, as they did not classify processes on the
basis on core and non-core.
Within the Maturity Survey, the Researcher had mapped questions to the
perspectives. Participants reported however that this added too much repetition.
38
During the case study the term „perspective‟ was used to refer to the management stages of Align, Design, Execute, Control and Improve.
This led the Researcher to reconsider the affect of terminology when
attempting to measure the factors. Understanding the effect of
terminology was important to the study in order to gain consistent and
relevant measurements and avoid spurious results brought about by
ambiguous terms.
Consequently, clearing defining the factors and identifying potential
measurement items was necessary to progress the study.

Chapter 4 – Conceptual Model
- 4:150 -
4.6 Next Steps
Refining the Initial Conceptual Model and gaining additional insights into potential
measurement issues provided the Researcher with direction for the study. In
particular, the Researcher saw value in:
(1) Agreeing a common definition for the factors
(2) Identifying measurement items for the future operationalisation of the
factors.
Furthermore, the desire to produce a generalisable theory meant gathering views
from a wider audience would be valuable in building on the work of the case
studies. An alternative research method such as a survey was potentially
beneficial for this purpose: in particular, conducting a survey would assist in
overcoming geographic and cost constraints. The terminology issues inherent in
the domain however meant that it might be difficult to get quality, comparable
data from a broad reaching survey. The Delphi Technique however is a
recognised method for undertaking exploratory survey research. Consequently,
following further investigation the Researcher determined the Delphi Technique
to be a suitable method for undertaking further exploration of the factors39. The
design, conduct and outcomes from applying the Delphi technique are the focus
of the subsequent chapter.
4.7 Chapter Summary
This chapter presented the findings from two case studies undertaken to test the
conceptual model in a practical setting. The case studies were with two
Australian organisations, based in Brisbane, which had current BPM Initiatives.
The Researcher used a combination of interviews, surveys and a review of
relevant documentation to explore the BPM Initiatives with key BPM personnel.
Analysis of case study data showed that there was a degree of overlap between
39
Chapter 2 provides justification for the selection of the Delphi Technique for this phase of the study.
Business Process Management: Progression and Maturity
- 4:151 -
some factors of the Initial Conceptual Model, blurring the lines of independence
and resulting in changes to the name of some factors. Furthermore, the intent
and scope of a number of factors required additional clarification.
The Accountability factor expanded to become Governance, incorporating
decision making and compliance aspects. The Methodology factor constricted to
become Methods in order to separate decision-making from usage. The
Performance factor expanded to become Strategic Alignment, integrating aspects
previously captured within the Alignment perspective in addition to the original
performance focus. The Culture factor split giving an additional factor called
People, in order to recognise the less tangible aspects such attitudes and beliefs
separately to the more tangible aspects such as training and skills. These
changes led to a Refined Conceptual Model.
In addition to refining the conceptual model, the findings from the case studies
provided direction to the study. The refinements and the requests for additional
clarity resulted in the need to redefine the factors. Furthermore, plans for the
future operationalisation of the model, terminology issues and a desire to
increase generalisability resulted in plans to extend the Refined Conceptual
Model by identifying measurement items within the factors from a wider
audience.
Consequently, the following chapter details the series of Delphi Studies
undertaken to extend the Refined Conceptual Model.


Business Process Management: Progression and Maturity
- 5:153 -
5 Delphi Studies
his chapter aims to extend the refined conceptual model by further
defining the factors and identifying those items whose measurement is
seen to be indicative of advancing maturity in the factor. The Delphi
technique provides the ability to access geographically dispersed experts in a
cost effective manner and the ability to break down comprehensive issues using
an iterative approach. This makes it a suitable method for undertaking this
exploratory research40. This chapter details the design, conduct and outcomes of
a series of Delphi studies conducted from February to September 2005.
5.1 Chapter Overview
The structure of this chapter is as follows. Section 2 details the initial planning for
the Delphi studies. This includes consideration of the questions, the planned
approach including the number of studies, the number of rounds, determining
and inviting experts, conducting a pilot study and revising the plan accordingly.
Section 3 details the conduct of the Delphi studies including the collection and
analysis of data. Section 4 provides details of the outcomes of the studies being
the final factor definitions and the so-called capability areas identified during each
study. Section 5 includes consideration of the consequences of the studies and
the next steps. Section 6 summarises the chapter.
40
Chapter 2 contains further details on the selection of the Delphi Technique for this purpose.
T

Chapter 5 – Delphi Studies
- 5:154 -
5.2 Delphi Study Plan
Following the selection of the Delphi technique, a number of decisions regarding
the use of the technique were necessary. Powell (2003) indicated that the
selection of the Expert Panel would potentially determine the success of a Delphi
study. Furthermore, whilst the aim of a Delphi study is often to reach consensus
Richard and Curran (2002) caution that there are times when consensus
between panellists is not always possible. Hence, the design of the Delphi
studies needs to first determine the questions to be addressed, before
determining the most appropriate panel for addressing the questions and a
control mechanism for progressing the study through the desired number of
iterations. Figure 19 summarises the major steps the Researcher undertook in
planning for the Delphi studies.
Figure 19: Planning for the Delphi Studies
Determine DS questions
Determine participants
Number of participants?Who to invite?How to invite?
Determine approach
Number of studies?Number of rounds?
Decision rules?
Design Plan for Studies
Integrate rounds and questions
Design forms for feedback & communication
Invite participants
Send invitationsFollow up & additional invites if requiredFinalise participation
Conduct pilot study
Document lessons learnedDiscuss conduct as group
Revise DS Plan
Conduct remaining
studies
Business Process Management: Progression and Maturity
- 5:155 -
5.2.1 Determine the Delphi Study Questions
Building on the outcomes of the earlier case studies, the aim of the Delphi
studies was to (1) agree on a definition for each factor and (2) to identify key
items that, when measured, indicated increasing maturity of the factor. With
regard to the definitions, in the first round of the study the Researcher asked
panellists:
In the context of Business Process Management, how do you
define factor x?
List (up to) 5 terms that you believe are vital to any definition of
factor x (in the context of Business Process Management).
Please provide a brief explanation of these terms.
Similarly, with regard to identifying measurement items, the Researcher asked
panellists to:
List (up to) 7 major items within factor x that you would like to be
able to assess by applying a new BPM Maturity measurement
model41.
5.2.2 Determine the Approach
To answer the proposed questions, the Researcher needed to design an
approach to the study that would enable participation from a suitable panel and
subsequently to compose the panel of experts. In reality, the Researcher made
decisions on the approach in conjunction with decisions on the panellists, as the
decisions were interrelated. This section details the approach to the studies.
Consequently, this section includes (1) planning the conduct of the studies
including the decision to conduct a pilot study and (2) determining an end-point
for the studies.
41
When looking to identify issues within an area, Schmidt (1997) recommends asking for at least 6. Whilst this study focuses on measurement items as opposed to issues, this provided a guide for the number of items to identify from panellists.

Chapter 5 – Delphi Studies
- 5:156 -
Planning the Conduct of Study
The Researcher considered two alternative approaches: (1) conducting a single
study covering all factors or (2) conducting a series of studies looking at one
factor at a time. In light of the independence of the factors, and a desire to match
experts with each factor, the Researcher decided on the second of these options.
This resulted in the conduct of a series of studies, with a separate study for each
factor of the refined conceptual model (i.e. Strategic Alignment, Governance,
Methods, Information Technology, People and Culture).
The Researcher had to determine how then to conduct the studies. The options
were to conduct them consecutively, in parallel, or using a combination of these
two approaches. Initially, the plan was to run the studies consecutively but to
stagger the start dates so that there was some overlap in the studies in order to
shorten the overall timeframe. A potential shortcoming of this approach was that,
where experts participated in more than one study, response fatigue could lead
to increased levels of discontinuity in later rounds and/or studies. Consequently,
finding the best approach to the conduct and timing of the studies was important
in order to minimise potential attrition rates.
A pilot study would assist the Researcher in streamlining the conduct of the
studies but could add to the response fatigue. This was due to the difficulty in
replicating the work commitments and experience of potential panellists without
using the expert panel itself. Consequently, the Researcher decided to use one
of the factor studies as the pilot study and selected the Strategic Alignment factor
for this purpose.
Determining an End-Point for the Studies
Schmidt (1997) indicates that it is important to know when to stop a study.
According to Schmidt, stop too soon and outcomes may not be meaningful,
continue too long and it will waste the time of the panel and the Researcher‟s
resources. Therefore, in designing a study it is necessary to consider what
distinguishes the completion of the study. This means giving consideration to (1)
what constitutes consensus, in the context of the study, and (2) what happens if
the study does not reach consensus.

Business Process Management: Progression and Maturity
- 5:157 -
Modified Delphi studies that rank outcomes often use Kendall‟s W coefficient,
whereby concordance above 0.7 indicates provides a satisfactory result
(Brancheau & Wetherbe, 1987; Okoli & Pawlowski, 2004; Schmidt, 1997). In this
study however, there was a focus on the development of definitions, which are
less suited to application of a ranking-based assessment. To the best knowledge
of the Researcher, there was little guidance in prior studies on what constitutes
consensus, or measures that were useful in determining consensus, for modified
Delphi studies that rate outcomes as opposed to the traditional ranking of
outcomes.
Consequently, the Researcher established criteria for consensus within the study
using similar principles to those applied within a ranking study. In doing so, the
Researcher made use of mean rating scores and standard deviation in
responses, and set benchmarks to guide the achievement of satisfactory levels.
The approach included using a satisfaction scale and establishing a minimum
level for consensus. The satisfaction scale included asking experts to rate their
level of satisfaction with both the proposed definition and the capability areas in
each round using a 10-point scale (1 – Not Satisfied and 10 – Very Satisfied).
The minimum level for consensus included:
An average satisfaction rating of not less than 7.5
Having minimal variance between responses (defined as attaining a
standard deviation of 1.5 or less)
All individual ratings being at least a 5.
In addition to the minimum level for consensus, the Researcher set a maximum
number of rounds to govern the maximum duration of the studies. In doing so,
the Researcher defined an end-point of the study (in the event that a study did
not reach consensus). This enabled the Researcher to communicate to the
panellists regarding their expected involvement. In doing so, the Researcher
aimed to minimise attrition rates by giving surety to panellists in terms of their
maximum commitment.

Chapter 5 – Delphi Studies
- 5:158 -
To determine the appropriate number of rounds for the proposed Delphi studies,
there was consideration of both the aim of this study and the experiences of other
similar studies. In a study into the optimal number of rounds, Erffmeyer et al.
(1986) achieved stability after the fourth round. In more recent studies, Mulligan
(2002), Powell (2003), and Richards and Curran (2002) considered three rounds
were appropriate. Alternatively, Murphy et al. (1998) and van de Ven and
Delbecq (1974) suggested two or more and Loo (2002), three to four.
Consequently, the Researcher decided to impose a maximum of four rounds for
each study, in the event that the decision rules for consensus were not satisfied
prior to that point.
5.2.3 Initial Plan for the Delphi Studies
Based on these decisions, the Researcher derived a plan for the conduct of the
Delphi Study series. As shown in Table 39, the initial plan was for the studies to
commence with the pilot study in February 2005 with completion of the last study
by mid-November 2005.
Factor Start Finish
Strategic Alignment 21st February 2005 17
th April 2005
Governance 4th April 2005 29
th May 2005
Method 16th May 2005 10
th July 2005
IT/IS 27th June 2005 28
th August 2005
People 8th August 2005 2
nd October 2005
Culture 19th September 2005 13
th November 2005
Table 39: Initial Timeline for Conducting the Delphi Study Series
The Researcher developed a schedule for the tasks required in the study, and
proposed times for the completion of these tasks. From this, the Researcher
established a timeframe for each study allowing eight weeks for each study.
Table 40 shows this timeframe, including the major tasks for each week.
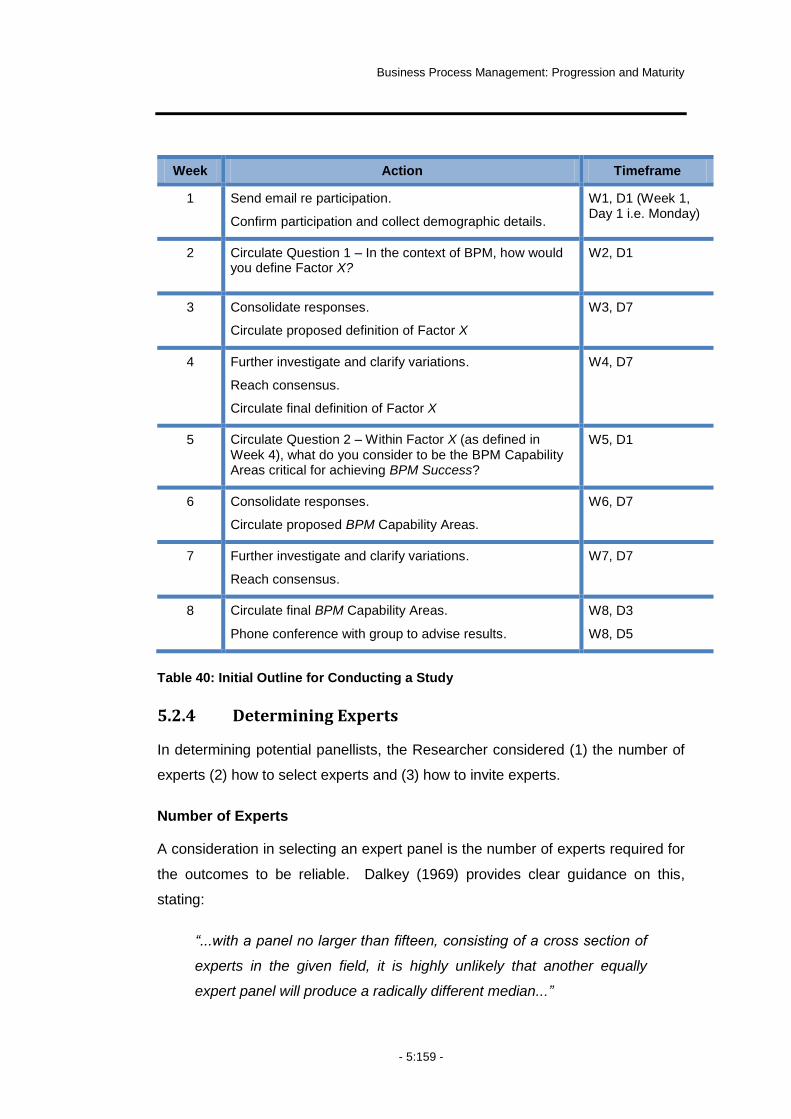
Business Process Management: Progression and Maturity
- 5:159 -
Week Action Timeframe
1 Send email re participation.
Confirm participation and collect demographic details.
W1, D1 (Week 1, Day 1 i.e. Monday)
2 Circulate Question 1 – In the context of BPM, how would you define Factor X?
W2, D1
3 Consolidate responses.
Circulate proposed definition of Factor X
W3, D7
4 Further investigate and clarify variations.
Reach consensus.
Circulate final definition of Factor X
W4, D7
5 Circulate Question 2 – Within Factor X (as defined in Week 4), what do you consider to be the BPM Capability Areas critical for achieving BPM Success?
W5, D1
6 Consolidate responses.
Circulate proposed BPM Capability Areas.
W6, D7
7 Further investigate and clarify variations.
Reach consensus.
W7, D7
8 Circulate final BPM Capability Areas.
Phone conference with group to advise results.
W8, D3
W8, D5
Table 40: Initial Outline for Conducting a Study
5.2.4 Determining Experts
In determining potential panellists, the Researcher considered (1) the number of
experts (2) how to select experts and (3) how to invite experts.
Number of Experts
A consideration in selecting an expert panel is the number of experts required for
the outcomes to be reliable. Dalkey (1969) provides clear guidance on this,
stating:
“...with a panel no larger than fifteen, consisting of a cross section of
experts in the given field, it is highly unlikely that another equally
expert panel will produce a radically different median...”
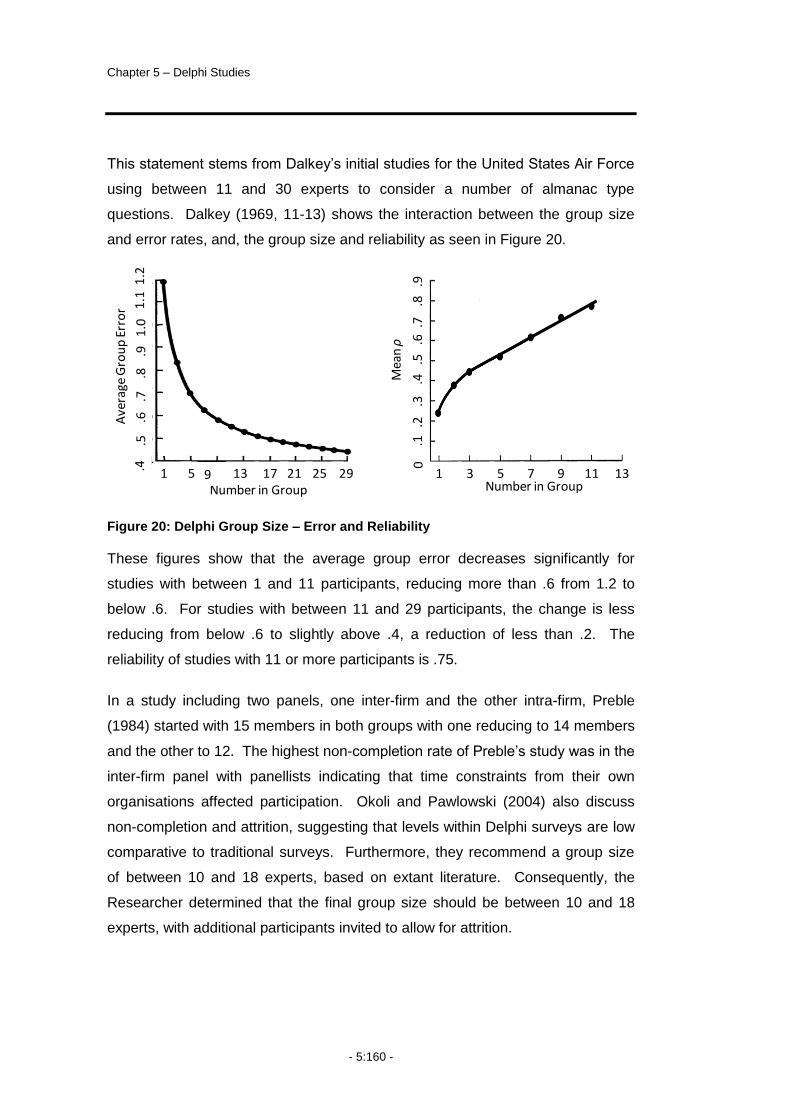
Chapter 5 – Delphi Studies
- 5:160 -
This statement stems from Dalkey‟s initial studies for the United States Air Force
using between 11 and 30 experts to consider a number of almanac type
questions. Dalkey (1969, 11-13) shows the interaction between the group size
and error rates, and, the group size and reliability as seen in Figure 20.
Figure 20: Delphi Group Size – Error and Reliability
These figures show that the average group error decreases significantly for
studies with between 1 and 11 participants, reducing more than .6 from 1.2 to
below .6. For studies with between 11 and 29 participants, the change is less
reducing from below .6 to slightly above .4, a reduction of less than .2. The
reliability of studies with 11 or more participants is .75.
In a study including two panels, one inter-firm and the other intra-firm, Preble
(1984) started with 15 members in both groups with one reducing to 14 members
and the other to 12. The highest non-completion rate of Preble‟s study was in the
inter-firm panel with panellists indicating that time constraints from their own
organisations affected participation. Okoli and Pawlowski (2004) also discuss
non-completion and attrition, suggesting that levels within Delphi surveys are low
comparative to traditional surveys. Furthermore, they recommend a group size
of between 10 and 18 experts, based on extant literature. Consequently, the
Researcher determined that the final group size should be between 10 and 18
experts, with additional participants invited to allow for attrition.
Ave
rage
Gro
up
Err
or
Number in Group1 5 9 13 17 21 25 29.4
.5.6
.7.8
.91
.01
.11
.2
Mea
n ρ
.1.2
.3.4
.5.6
.7.8
.90
1 3 5 7 9 1311Number in Group

Business Process Management: Progression and Maturity
- 5:161 -
How to Invite Experts
To determine how to invite experts, the Researcher used an approach similar to
the iterative 5-step approach proposed by Okoli and Pawlowski (2004) including:
1. Preparing a worksheet that identifies potential classifications
2. Populating the worksheet with potential experts
3. Evaluating experts
4. Inviting experts
5. Nominating additional experts (using referrals from invited experts and
further investigation).
Classification of Experts
In considering the outcomes across two different panels addressing similar
questions, Martino (1972) concluded that there was consistency in outcomes
across the panels. Preble (1984) provides empirical support for Martino‟s
findings showing in his study consistency between inter-firm and intra-firm panels
whereby the two panels chose the same or the next closest category in 95 out of
96 comparisons. This indicates that there may be no significant value in having
separate panels for different groups of experts (e.g. industry and academia or
different regions). The inclusion of experts with a range of experiences will
increase the generalisability of the outcomes from the studies.
Consequently, in determining a list of potential panellists, the Researcher
considered an individual‟s category, region, and expertise (in a given factor).
Classification by category enabled representation of views from both theoretical
and practical perspectives by including experts based on academia and industry.
Classification by region allowed for consideration of regional differences, whilst
classification by expertise, enabled matching of experts with the six factors
contained in the model.
What denotes an expert is arguably subjective, thus the Researcher set minimum
criteria to apply to the selection of experts in these studies. Academic experts
were required to have a minimum of a PhD qualification or Professorial position

Chapter 5 – Delphi Studies
- 5:162 -
and be active in BPM research and/or teaching. Industry experts were required
to hold a senior position, with a key role in the BPM Initiative in their organisation
or be a recognised figure in the BPM community (e.g. an author of BPM
literature). In determining potential panellists, the Researcher considered an
individual‟s expertise; however, the Researcher also asked each panellist to
nominate the studies in which they were comfortable participating. A perceived
benefit of self-nomination was that it would increase motivation and commitment
to the studies, thereby assisting in minimising attrition rates.
5.2.5 Inviting Potential Participants
In January 2005, 30 potential experts and 2 coders received an email inviting
their participation in the studies42. This initial email included a proposal for the
Delphi study series that contained (1) a proposed outline of the study, (2) a
request for participation, (3) a form for self-nomination for individual studies and
(4) a request for notification of other individuals who might be suitable for
participating in the studies43. A copy of the email and proposal are in:
Appendix 13.2.1 – Email Invitation Sent to Prospective Participants
Appendix 13.2.2 – Proposal Sent to Prospective Participants.
The self-nominating approach resulted in a number of experts electing to
participate in all six studies whilst others elected to participate in select studies.
Consequently, there was a common core of experts participating in all studies,
supplemented by new experts entering each study. The common core of experts
provided a level of continuity and consistency across the studies, whilst experts
participating in only select studies ensured a degree of independence between
factors and in the input to each factor.
Table 41 shows the distribution of experts across the three classifications of
Category (I = Industry; A = Academia), Region and (Factor) Expertise. As seen,
there was a predominance of experts from western regions leading to a potential
42
There were 3 coders for the study with one being the Researcher.
43 This process led to the invitation of an additional 4 experts.
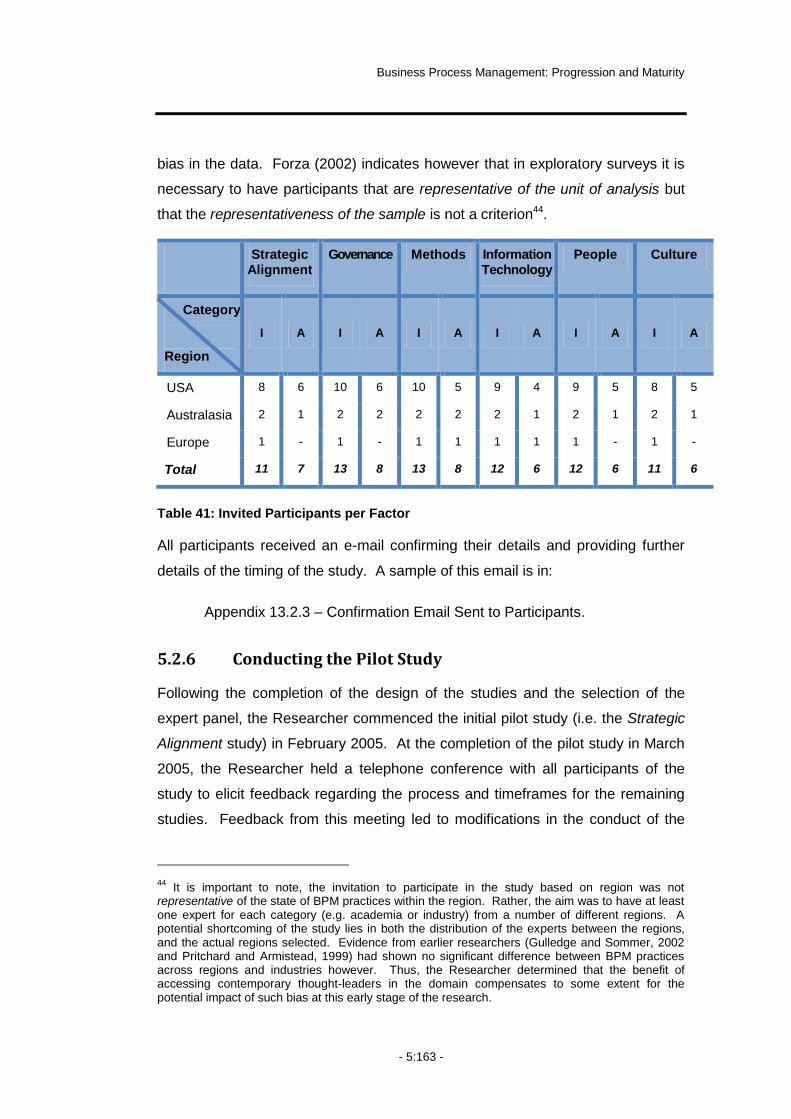
Business Process Management: Progression and Maturity
- 5:163 -
bias in the data. Forza (2002) indicates however that in exploratory surveys it is
necessary to have participants that are representative of the unit of analysis but
that the representativeness of the sample is not a criterion44.
Strategic Alignment
Governance Methods Information Technology
People Culture
Category
Region
I A I A I A I A I A I A
USA 8 6 10 6 10 5 9 4 9 5 8 5
Australasia 2 1 2 2 2 2 2 1 2 1 2 1
Europe 1 - 1 - 1 1 1 1 1 - 1 -
Total 11 7 13 8 13 8 12 6 12 6 11 6
Table 41: Invited Participants per Factor
All participants received an e-mail confirming their details and providing further
details of the timing of the study. A sample of this email is in:
Appendix 13.2.3 – Confirmation Email Sent to Participants.
5.2.6 Conducting the Pilot Study
Following the completion of the design of the studies and the selection of the
expert panel, the Researcher commenced the initial pilot study (i.e. the Strategic
Alignment study) in February 2005. At the completion of the pilot study in March
2005, the Researcher held a telephone conference with all participants of the
study to elicit feedback regarding the process and timeframes for the remaining
studies. Feedback from this meeting led to modifications in the conduct of the
44
It is important to note, the invitation to participate in the study based on region was not representative of the state of BPM practices within the region. Rather, the aim was to have at least one expert for each category (e.g. academia or industry) from a number of different regions. A potential shortcoming of the study lies in both the distribution of the experts between the regions, and the actual regions selected. Evidence from earlier researchers (Gulledge and Sommer, 2002 and Pritchard and Armistead, 1999) had shown no significant difference between BPM practices across regions and industries however. Thus, the Researcher determined that the benefit of accessing contemporary thought-leaders in the domain compensates to some extent for the potential impact of such bias at this early stage of the research.

Chapter 5 – Delphi Studies
- 5:164 -
remaining studies. The outcomes and other sample documentation from
conducting the pilot study is in:
Appendix 13.2.4 – Report to Panel Following Pilot
Appendix 13.2.5 – Diary Note: Pilot Study.
5.2.7 Revising the Plan
One change to the plan for the remaining studies was the shortening of the
overall timeframe and the decision to run a number of studies in parallel45. This
change occurred primarily due to feedback from the panellists who indicated
there was a greater likelihood they would discontinue if the studies went too long.
Another change was to introduce the „item‟ question in the first round rather than
delaying it to a subsequent round46. This change occurred due to the number of
iterations it took to reach required levels of consensus within the Strategic
Alignment study. Had the change not occurred, it was likely that an additional
round would have been necessary for the studies in order to reach consensus, or
that the Researcher would have imposed the maximum number of rounds,
potentially weakening the overall results (Schmidt, 1997).
A further modification related to the data analysis and outcomes. When
conducting the Strategic Alignment study the initial short-list of capability areas
included seven items. During the last round of the study, the Researcher asked
panellists to rate the list of capability areas with regard to their perceived
importance by allocating a total of 10 points between all items. Two of the
capability areas received a rating of zero from more than 30% of the expert
panel. This resulted in the average perceived importance score for the two areas
being notably less than the other five capability areas. Table 42 details these
outcomes, showing the two areas at the bottom of the table.
45
Initially the studies were scheduled to run sequentially so as not to over-burden experts.
46 Initially the question was in the second round so that the list of items provided was in keeping
with the first round consolidated definition. The use of ratings in each round aimed to minimise any potential negative effects of concurrent development.

Business Process Management: Progression and Maturity
- 5:165 -
Capability area Average Perceived
Importance
Standard Deviation
Highest Score
Number of 0‟s
Scored
Process Improvement Plan 1.77 0.83 4 0
Strategy and Process Capability Linkage
1.77 1.17 4 2
Enterprise Process Architecture 1.69 1.03 4 2
Process Measures 1.46 0.97 3 3
Process Customers and Stakeholders
1.30 1.18 4 3
Strategic Priorities 1.08 0.86 2 4
Operational Translation 0.92 0.86 2 4
Table 42: Capability Area Ratings from Pilot Study
In the telephone conference held at the completion of the pilot study, panellists
confirmed that the two areas (i.e. Strategic Priorities and Operational Translation)
contained a level of redundancy and overlap with the remaining five capability
areas. Furthermore, there was agreement within the group that the removal of
the two areas would not diminish the comprehensiveness of the final list.
Consequently, the Researcher removed the two areas from the final list. To
maintain the chain of evidence in the data, the Researcher mapped all items from
these two areas to the remaining five areas. Panellists were able to review this
mapping in the final report for the studies.
Following input from the telephone conference, the Researcher considered
restricting the final list of capability areas in the remaining studies to a maximum
of five items. Ahrens and Dent (1998) caution that there is a possibility that
making such a decision will limit the study outcomes, however, Whetten (1989)
cautions against the inclusion of factors found to add little value. Consequently,
the Researcher decided to limit future lists to no more than five items. There was
support for this decision with no zero ratings in future studies and a significant
reduction in the deviation of the perceived importance ratings within each study.
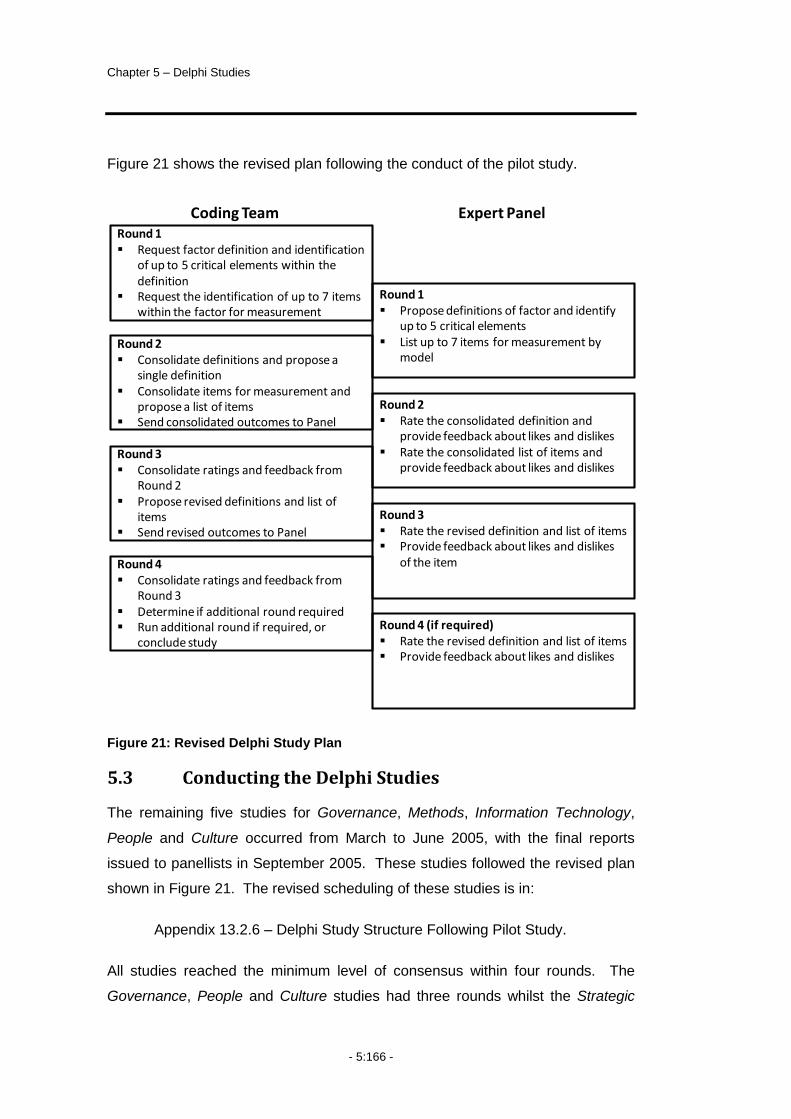
Chapter 5 – Delphi Studies
- 5:166 -
Figure 21 shows the revised plan following the conduct of the pilot study.
Figure 21: Revised Delphi Study Plan
5.3 Conducting the Delphi Studies
The remaining five studies for Governance, Methods, Information Technology,
People and Culture occurred from March to June 2005, with the final reports
issued to panellists in September 2005. These studies followed the revised plan
shown in Figure 21. The revised scheduling of these studies is in:
Appendix 13.2.6 – Delphi Study Structure Following Pilot Study.
All studies reached the minimum level of consensus within four rounds. The
Governance, People and Culture studies had three rounds whilst the Strategic
Round 1 Request factor definition and identification
of up to 5 critical elements within the definition
Request the identification of up to 7 items within the factor for measurement
Round 1 Propose definitions of factor and identify
up to 5 critical elements List up to 7 items for measurement by
modelRound 2 Consolidate definitions and propose a
single definition Consolidate items for measurement and
propose a list of items Send consolidated outcomes to Panel
Round 2 Rate the consolidated definition and
provide feedback about likes and dislikes Rate the consolidated list of items and
provide feedback about likes and dislikesRound 3 Consolidate ratings and feedback from
Round 2 Propose revised definitions and list of
items Send revised outcomes to Panel
Round 3 Rate the revised definition and list of items Provide feedback about likes and dislikes
of the itemRound 4 Consolidate ratings and feedback from
Round 3 Determine if additional round required Run additional round if required, or
conclude study
Round 4 (if required) Rate the revised definition and list of items Provide feedback about likes and dislikes
Coding Team Expert Panel

Business Process Management: Progression and Maturity
- 5:167 -
Alignment, Methods and IT studies required four rounds to reach required levels
of consensus. The results of the six studies (including the pilot) are summarised
in Section 5.4, whilst the next sections detail the data collection and analysis
process that led to these outcomes.
5.3.1 Data Collection
In an attempt to maintain high response rates, the Researcher provided panellists
with two avenues for providing feedback during each round. On the one hand,
details were summarised in an email to which panel members could simply insert
their feedback and return. The Researcher also attached a more comprehensive
document to the email, for those interested in additional detail. This document
(referred to as a Round Report) included additional commentary and supporting
evidence detailing how the coding team arrived at the proposed definitions and
capability areas. The report included a number of highlighted areas where the
panel member could insert their answer before returning the completed report.
This provided a strong chain of evidence between the data provided by the
expert panel and the subsequent proposals provided by the coding team, thus
increasing the transparency of the coding and data reduction process. Samples
of the emails sent to experts are in:
Appendix 13.2.7 – Email to Panel Member for Round
Appendix 13.2.8 – Follow-up Emails Sent to Participants.
Maintaining Anonymity
According to Murphy et al. (1998), a recognised strength of the Delphi Technique
is the ability to minimise the impact of dominant personalities and group pressure
by enabling anonymity and equal weighting of participants. Furthermore, van de
Ven and Delbecq (1974) suggest that anonymity adds richness to data and
results in more creative outcomes. The Researcher ensured anonymity
throughout the series by only referencing panellists using an allocated number
and not their name; personalizing emails; and coordinating questions between
the coding team and the panellists through a central point (i.e. the Researcher).
Details of all experts who participated were included however, in both the

Chapter 5 – Delphi Studies
- 5:168 -
Executive Summary and the Series Summary. The Researcher provided these
reports to all participants for comment and sign-off at the completion of the series
to increase the credibility of results. At no time during the studies were direct
connections made between panellists and specific data.
5.3.2 Data Analysis
The Delphi studies generated a combination of qualitative and quantitative data.
The qualitative data provided a rich source from which to identify common
themes and concepts. The quantitative data meanwhile, provided a means of
determining an appropriate end-point using pre-defined guidelines for acceptable
levels of outcomes. The Researcher‟s aim during all studies was to maintain
maximum transparency of data analysis to ensure quality outcomes in a timely
manner. Consequently, the Researcher developed and refined a standard
process for managing each round of the Delphi studies, as detailed in the
following paragraphs.
Following the distribution of the initial questions, the Researcher received all
responses for each round. The Researcher collated all responses (including any
ratings and comments) into a MS-Excel spreadsheet, removing all personal
details of participants and replacing them with the unique identification tag
assigned to the participant. The Researcher then sent the spreadsheet of the
summarised, anonymous responses to the remaining members of the Coding
Team for analysis. A sample of the summarised responses is in:
Appendix 13.2.9 – Summary of Responses from Delphi Study Round.
The Coding Team had access to N-Vivo to assist in data analysis. It was not
mandatory that they use this (or any other) software however. As all members of
the Coding Team were familiar with qualitative data analysis techniques, they
were able to use their own preferred means of analysis. Due to the small number
of participants and the non-voluminous data, the Researcher used a combination
of simple, manual methods such as highlighting and underlying key words,
identifying categories, mapping items to categories, and using a word processing
package. During the coding process, members of the Coding Team were able to
ask for further clarification from members of the Expert Panel if necessary. In
Business Process Management: Progression and Maturity
- 5:169 -
this case, all communication was co-ordinated by the Researcher to maintain the
anonymity of the Expert Panel. At the end of coding, Coding Team members sent
their input to the Researcher in time for a regular meeting. A sample of coding
from a round of the study is in:
Appendix 13.2.10 – Coding From Delphi Study Round.
The Researcher consolidated and circulated the combined results of coding to
the Coding Team prior to the meeting. The team then met (virtually) to discuss
and agree on the definition and items to propose back to the Expert Panel.
During the consolidation process, there was a rule that within the coding team at
least two of the team had to agree on the proposal before returning results to the
panel. Once the Coding Team was in sufficient agreement, the Researcher
prepared a standard Round Report for circulation back to the panel.
In the Round Report, the panellists received (1) the previous proposed definition
and list of capability areas; (2) a summary of comments and ratings arising from
the prior round; (3) a revised definition and list of capability areas based on
feedback received during the prior round; and (4) a full mapping of all items to the
proposed capability areas. A sample of a Round Report is in:
Appendix 13.2.11 – Round Report to Panel: Completed by Expert.
The panellists rated and commented on the proposed definitions and list of
capability areas including the associated mapping before returning their
responses to the Researcher47. The Coding Team then used the ratings and
comments to improve the definition, the list of items and the associated mapping
that supported them. Subsequent rounds of the Delphi study followed a similar
pattern with the aim of increasing the average satisfaction, whilst reducing the
standard deviation, of panellist ratings. Rating and comment by the panellists
continued until the study met the minimum level of consensus, or the maximum
number of rounds.
47
Documentation of the item mapping provides a basis for further development of each capability area. In later stages of the research, this mapping combines with a targeted literature review to establish support for each capability area and to guide the future operationalisation of the model.

Chapter 5 – Delphi Studies
- 5:170 -
5.4 Delphi Study Outcomes
This section presents a consolidation of the outcomes from all six Delphi studies.
Further details on each study, including the discussion of major themes, specific
comments from the expert panel and progression in each of the round, including
Final Report summaries are in Appendices:
13.2.12 - Strategic Alignment Delphi Study
13.2.13 - Governance Delphi Study
13.2.14 - Methods Delphi Study
13.2.15 - Information Technology Delphi Study
13.2.16 - People Delphi Study
13.2.17 - Culture Delphi Study
13.2.18 Final Executive Summary: Table of Contents
13.2.19 Final Series Summary: Table of Contents & Appendix.
5.4.1 Participation
Participation in the Delphi studies including completion rates is in Table 43. The
final figures do not include Panellists that did not complete all rounds, although
their input has been included for the rounds in which they did participate.
Industry Academia Total
Invited Completed Invited Completed Invited Completed
Strategic Alignment
11 9 82% 7 6 86% 18 15 83%
Governance 13 6 46% 8 5 63% 21 11 52%
Methods 13 6 46% 8 6 75% 21 12 57%
Information Technology
12 6 50% 6 5 83% 18 11 61%
People 12 8 67% 6 6 100% 18 14 78%
Culture 11 6 55% 6 5 83% 17 11 65%
Table 43: Expert Panel - Invited and Completed
Business Process Management: Progression and Maturity
- 5:171 -
5.4.2 Definitions
The final definitions for the six factors derived from the Delphi studies were:
In the context of BPM:
Strategic Alignment is the continual tight linkage of organisational
priorities and enterprise processes enabling achievement of business
goals.
Governance establishes relevant and transparent accountability and
decision-making processes to guide and reward actions.
Methods are the approaches and techniques that support and enable
consistent process actions and outcomes.
Information Technology is the software, hardware and information
management systems that enable and support process activities.
People are the individuals and groups who continually enhance and
apply their process-related expertise and knowledge.
Culture is the collective values and beliefs that shape process-
related attitudes and behaviours.
Figure 22 shows the high level of average satisfaction with the final definitions,
with all factors having an average score greater than eight (with 10 being very
satisfied). The standard deviation in responses is low, being below 1.2 for all
final factor definitions. Furthermore, across all studies, there was no response (in
the final round) below a five48.
48
The Final Report for each study (see Appendix) provides details of the changes in the average scores and the changes in the standard deviation for each round.
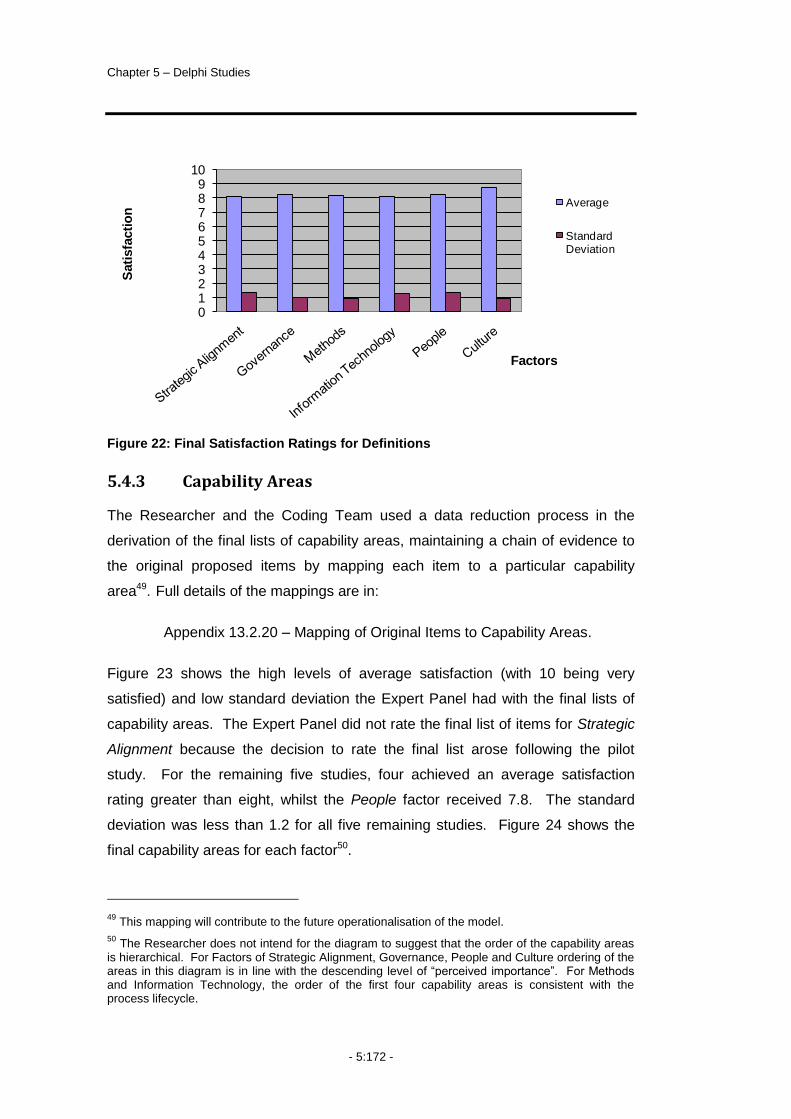
Chapter 5 – Delphi Studies
- 5:172 -
Figure 22: Final Satisfaction Ratings for Definitions
5.4.3 Capability Areas
The Researcher and the Coding Team used a data reduction process in the
derivation of the final lists of capability areas, maintaining a chain of evidence to
the original proposed items by mapping each item to a particular capability
area49. Full details of the mappings are in:
Appendix 13.2.20 – Mapping of Original Items to Capability Areas.
Figure 23 shows the high levels of average satisfaction (with 10 being very
satisfied) and low standard deviation the Expert Panel had with the final lists of
capability areas. The Expert Panel did not rate the final list of items for Strategic
Alignment because the decision to rate the final list arose following the pilot
study. For the remaining five studies, four achieved an average satisfaction
rating greater than eight, whilst the People factor received 7.8. The standard
deviation was less than 1.2 for all five remaining studies. Figure 24 shows the
final capability areas for each factor50.
49
This mapping will contribute to the future operationalisation of the model.
50 The Researcher does not intend for the diagram to suggest that the order of the capability areas
is hierarchical. For Factors of Strategic Alignment, Governance, People and Culture ordering of the areas in this diagram is in line with the descending level of “perceived importance”. For Methods and Information Technology, the order of the first four capability areas is consistent with the process lifecycle.
0123456789
10
Sati
sfa
cti
on
Factors
Average
Standard Deviation
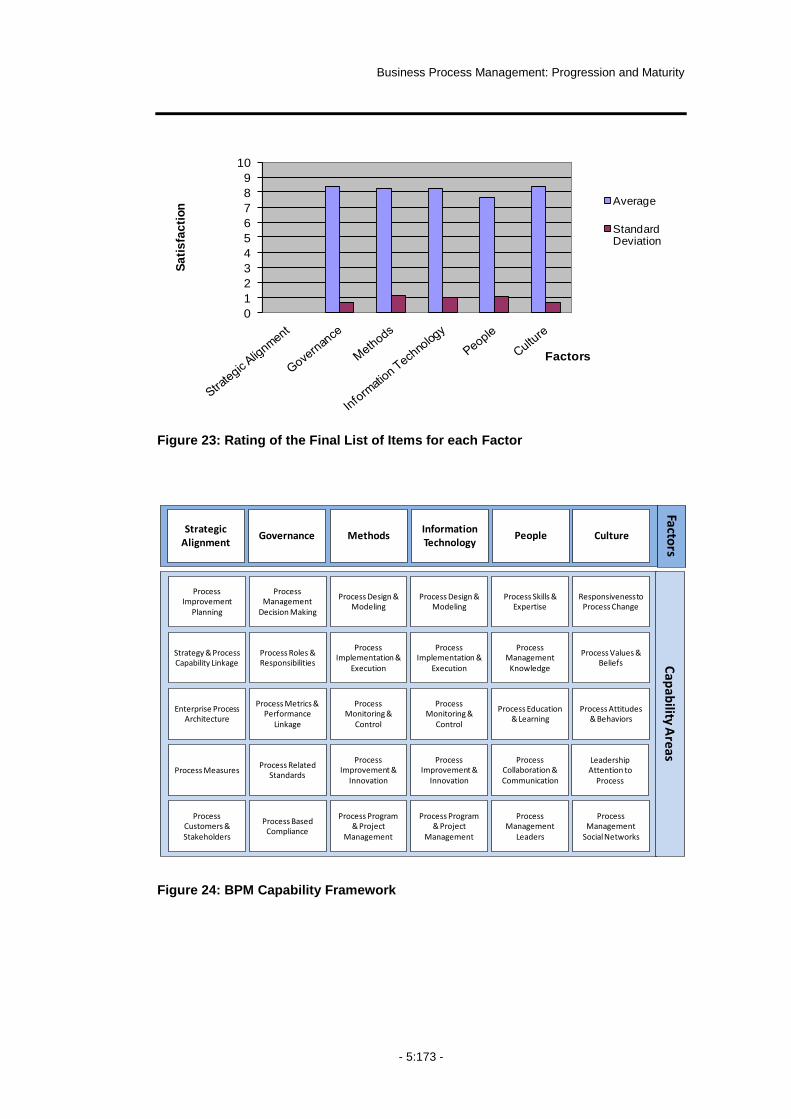
Business Process Management: Progression and Maturity
- 5:173 -
Figure 23: Rating of the Final List of Items for each Factor
Figure 24: BPM Capability Framework
0
1
2
3
4
5
6
7
8
9
10
Sa
tis
fac
tio
n
Factors
Average
Standard Deviation
Process Improvement &
Innovation
Process Management
Decision Making
Process Measures
Process Improvement
Planning
Process Management
Knowledge
Process Skills & Expertise
Process Values & Beliefs
Responsiveness to Process Change
Process Management
Leaders
Process Collaboration & Communication
Leadership Attention to
Process
Process Related Standards
Process Metrics & Performance
Linkage
Process Roles & Responsibilities
Enterprise Process Architecture
Strategy & Process Capability Linkage
Process Customers & Stakeholders
Process Monitoring &
Control
Process Implementation &
Execution
Process Design & Modeling
Process Monitoring &
Control
Process Implementation &
Execution
Process Design & Modeling
Process Education & Learning
Process Attitudes & Behaviors
Process Program & Project
Management
Process Improvement &
Innovation
Process Program & Project
Management
Process Management
Social Networks
Process Based Compliance
Governance MethodsStrategic
AlignmentInformation Technology
People Culture
Factors
Cap
ability A
reas

Chapter 5 – Delphi Studies
- 5:174 -
5.5 Discussion and Next Steps
Despite comprehensive efforts in the design and conduct of the Delphi studies,
there are still inherent limitations in the outcomes that affect the direction of the
overall study.
Firstly, whilst defining the factors, the Delphi studies have not provided clear
definitions and an in-depth understanding of the capability areas: they merely led
to their identification. Whilst mapping the original data items during each round
provides a starting point, further work is required to define and articulate the
intent of each capability areas.
Secondly, whilst the Delphi studies identified the capability areas as a means of
measuring the factors, in their current form, the capability areas are not, in
themselves, measures. Therefore, although the identification of measurement
items for the factors was one of the original intentions of the Delphi study series,
the extent of the capability area mapping indicates that the identified items
represent sub-constructs rather than measurement items. Consequently, further
research on the measures is required before it is possible to operationalise the
Extended conceptual Model.
Thirdly, whilst the Delphi studies identified the capability areas, it did not provide
insights into potential relationships between them. Therefore, additional work is
required to understand more about potential relationships between the capability
areas, and to guide the proposal of a measurement model.
To address these issues, the Researcher used a combination of literature review
and exploratory case study and literature review. The aim of the literature review
was to develop a framework for exploring the areas within a practical
environment. The literature review was fundamental to the design of the case
study data collection instruments. In selecting the case study method, the
Researcher aimed to gain a deeper understanding of the capability areas and
their role in the progression of BPM within a contemporary setting51.
51
Chapter 2 provides details on the selection of the case study method for this phase.

Business Process Management: Progression and Maturity
- 5:175 -
5.6 Chapter Summary
This chapter included details of the design, conduct and outcomes of a series of
Delphi studies undertaken to extend the Refined Conceptual Model.
First, there were details of the overall plan for the Delphi series, the conduct of
the pilot study (i.e. into Strategic Alignment) and a discussion of how this study
led to changes in the conduct of the remaining five studies.
The next sections detailed the conduct of the five remaining studies, concluding
with a summary of the outcomes from all six studies. The outcomes of the Delphi
studies included the BPM Capability Framework (i.e. the Extended Conceptual
Model) and definitions for each of the six factors being Strategic Alignment,
Governance, Methods, Information Technology, People and Culture.
The chapter concluded with contemplation of the steps required to progress the
study, based on the Delphi study outcomes.
Consequently, the next chapter details the design and conduct of an exploratory
case study that aims to (1) deepen the understanding of the newly identified
capability areas and (2) further explore the progression of a BPM Initiative using
the BPM Capability Framework as a base.


Business Process Management: Progression and Maturity
- 6:177 -
6 Exploratory Case Study
his chapter details a single, exploratory case study conducted with
Company M in 200652. The aim of this case study was to gain deeper
insights into the progression of BPM Initiatives and to test the
extended conceptual model within a practical setting. This chapter focuses
primarily on presenting the outcomes relating to the first aim of the case study,
providing insights into the progression of the BPM Initiative. A summary of the
application of the Extended Conceptual Model is also included, with additional
details available in Appendix:
13.3.1 – Testing the Extended Conceptual Model53.
6.1 Chapter Overview
The structure of this chapter is as follows. Section 2 details the case study
design including the unit of analysis, case selection and the data collection
52
The removal of the company name is to protect the identity of the participating organisation. The Researcher used the name – Company M – in preference to the next sequential naming of Company C to reinforce the segregation of the three case study applications and their distinct purposes within the study.
53 The outcomes relating to the second aim of the study, testing the extended conceptual model,
are important to the development and testing of a measurement model in subsequent future studies, but secondary to the theory building focus of this thesis. Consequently, Appendix 13.3.1 provides in-depth details and support for the summary of outcomes provided in this Chapter.
T
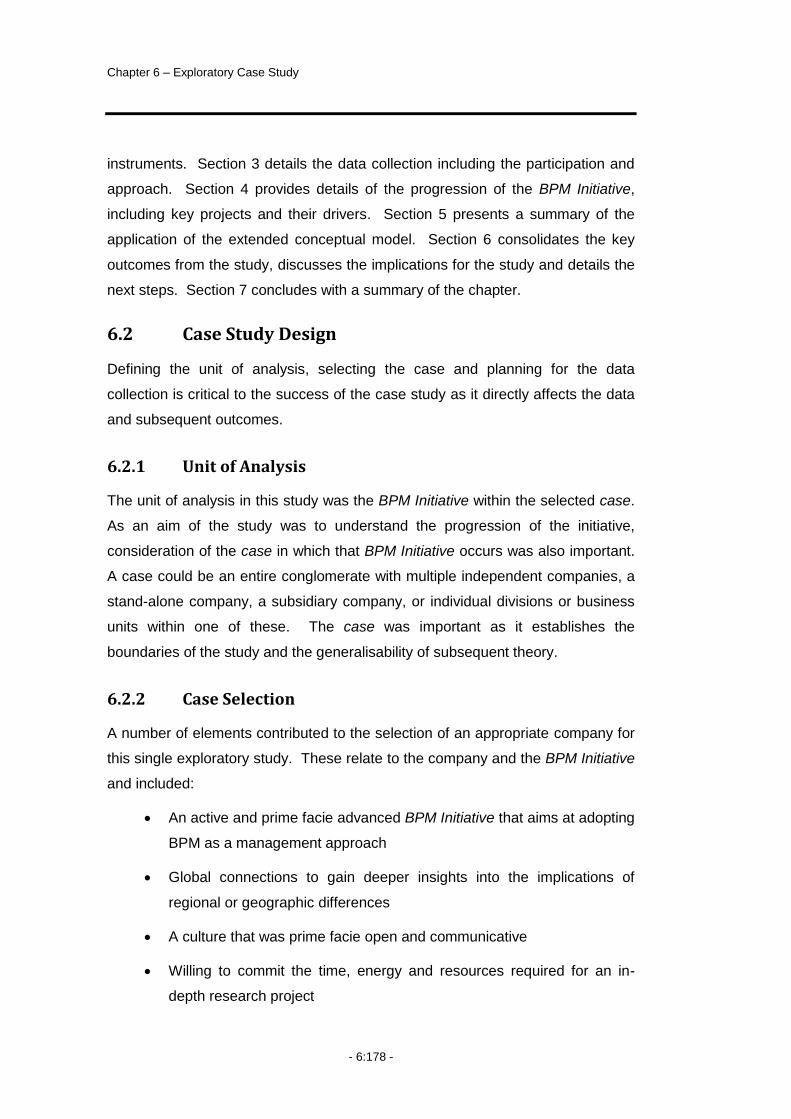
Chapter 6 – Exploratory Case Study
- 6:178 -
instruments. Section 3 details the data collection including the participation and
approach. Section 4 provides details of the progression of the BPM Initiative,
including key projects and their drivers. Section 5 presents a summary of the
application of the extended conceptual model. Section 6 consolidates the key
outcomes from the study, discusses the implications for the study and details the
next steps. Section 7 concludes with a summary of the chapter.
6.2 Case Study Design
Defining the unit of analysis, selecting the case and planning for the data
collection is critical to the success of the case study as it directly affects the data
and subsequent outcomes.
6.2.1 Unit of Analysis
The unit of analysis in this study was the BPM Initiative within the selected case.
As an aim of the study was to understand the progression of the initiative,
consideration of the case in which that BPM Initiative occurs was also important.
A case could be an entire conglomerate with multiple independent companies, a
stand-alone company, a subsidiary company, or individual divisions or business
units within one of these. The case was important as it establishes the
boundaries of the study and the generalisability of subsequent theory.
6.2.2 Case Selection
A number of elements contributed to the selection of an appropriate company for
this single exploratory study. These relate to the company and the BPM Initiative
and included:
An active and prime facie advanced BPM Initiative that aims at adopting
BPM as a management approach
Global connections to gain deeper insights into the implications of
regional or geographic differences
A culture that was prime facie open and communicative
Willing to commit the time, energy and resources required for an in-
depth research project
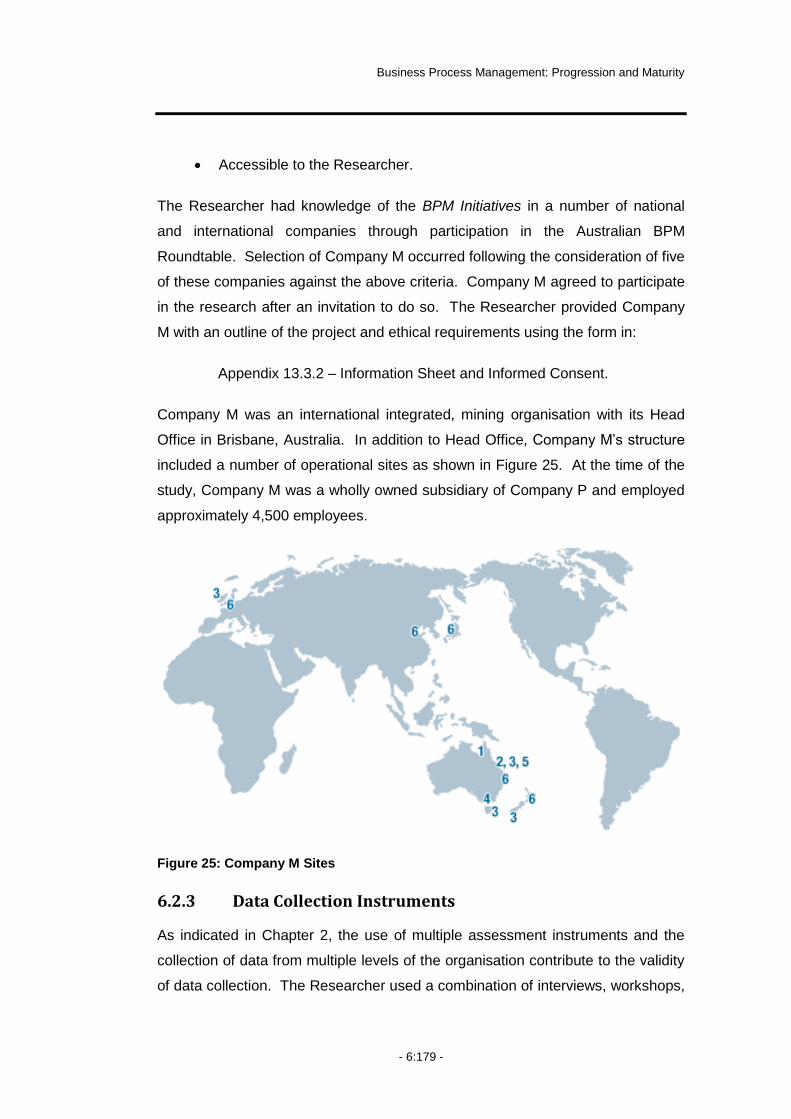
Business Process Management: Progression and Maturity
- 6:179 -
Accessible to the Researcher.
The Researcher had knowledge of the BPM Initiatives in a number of national
and international companies through participation in the Australian BPM
Roundtable. Selection of Company M occurred following the consideration of five
of these companies against the above criteria. Company M agreed to participate
in the research after an invitation to do so. The Researcher provided Company
M with an outline of the project and ethical requirements using the form in:
Appendix 13.3.2 – Information Sheet and Informed Consent.
Company M was an international integrated, mining organisation with its Head
Office in Brisbane, Australia. In addition to Head Office, Company M‟s structure
included a number of operational sites as shown in Figure 25. At the time of the
study, Company M was a wholly owned subsidiary of Company P and employed
approximately 4,500 employees.
Figure 25: Company M Sites
6.2.3 Data Collection Instruments
As indicated in Chapter 2, the use of multiple assessment instruments and the
collection of data from multiple levels of the organisation contribute to the validity
of data collection. The Researcher used a combination of interviews, workshops,

Chapter 6 – Exploratory Case Study
- 6:180 -
surveys and a review of relevant documentation as the primary data collection
instruments.
One-on-one interviews were conducted with executives and senior
management who held (or had held) a recognised process-based role within the
company. The Researcher used an Interview Guide to maintain consistency
between interviews.
The Interview Guide contained two sections including: (1) a brief description of
the interview purposes and ethical requirements; and (2) questions relating to
each of the factors contained within the Extended Conceptual Model. Questions
in the second section were semi-structured and arose from a review of extant
literature. To capture the unique experiences and views of interviewees, the
Researcher asked participants to provide their view of the BPM Initiative. A
sample of the form is included in:
Appendix 13.3.3 – Interview Guide.
Workshops captured detailed information regarding the BPM Initiative within
Company M. There was a separate workshop for each factor contained within
the Extended Conceptual Model. A Workshop Guide assisted with the
collection of data.
The Workshop Guide included three sections. Section 1 provided a summary of
the intent of the workshop, including the ethical requirements relating to the
study. Section 2 provided the agenda for the workshop. Section 3 contained
questions relating to the capability areas for each of the factors, contained in the
Extended Conceptual Model. The questions in Section 3 were semi-structured
and open-ended. The questions derived from an extant review of literature and
the mapping from the Delphi studies. In each workshop, questions focused on
the practices within each capability area. An example of the Workshop Guide for
Strategic Alignment is included in:
Appendix 13.3.4 – Workshop Guide: Strategic Alignment.

Business Process Management: Progression and Maturity
- 6:181 -
Surveys captured additional data from all participants to support the qualitative
data gathered during the interviews and workshops. The Researcher used two
different surveys to capture data during the case study – a so-called Background
Survey and the latest version of the Maturity Survey.
The embedded Background Survey included two sections (1) demographics
and (2) questions about the BPM Initiative within the organisation, including the
drivers, benefits, lessons learned and key projects undertaken. Examples of the
Background Survey are in:
Appendix 13.3.5 – Background Survey
Appendix 13.3.6 – Background Survey: Governance Participants.
The Maturity Surveys represented the latest version of the operationalised
model54. Before conducting the exploratory case study, the Researcher revisited
the Maturity Surveys trialled in the earlier studies to refine the questions and
format of the survey. To do this, the Researcher conducted a targeted literature
review using the capability area mapping from the Delphi studies to identify major
concepts, insights gained from piloting earlier versions of the surveys to
formulate the questions and the framework developed in Chapter 355.
During this case study, the aim in applying the Maturity Surveys was twofold.
First, calculating a maturity score enabled the Researcher to quantify the data
collected with the survey. In doing so, the Researcher was able to compare the
quantitative maturity scores with the qualitative data gathered during the
workshops and interviews. Consequently questions within the Maturity Survey
were assessed using a 5-point scale with 1 representing low maturity and 5, high
maturity.
In calculating maturity scores the Researcher used a bottom-up approach
calculating scores at the lowest level first and then rolling these up to provide
54
There was a separate survey for each of the factors within the conceptual model.
55 For example, Pritchard and Armistead (1999) indicated 10 lessons learned that map to various
capability areas, whereas validated questions from IT and Corporate Governance may be applicable to some areas of BPM Governance.

Chapter 6 – Exploratory Case Study
- 6:182 -
scores at the higher level. This meant that the scores for proficiency and
coverage combined to give a score for each capability area and that the scores
for the five capability areas combined to give a score for the factor, as seen in
Figure 26.
Figure 26: Calculation of Maturity Scores
Proficiency considered practices adopted compared to exemplary practice,
whereas coverage captured the scope of practices as evidenced by the classes
of individuals and processes to which the company applied them. This additional
granularity removed the potential for losing insights and context from only viewing
a single rolled-up figure for each factor. Equal weighting was applied to the
measures of proficiency and coverage and to all capability areas and factors as
there was no clear evidence from existing research that any one was more or
less significant than the other56. Table 44 shows a sample of subsequent
questions for the capability area: Methods – Process Design and Modelling.
56
The Researcher recognises that this may not always be the case, but further research is required in this area before a weighted approach is justified.
Capability Area 1 Maturity Score
Proficiency
• Plan• Do• Check• Act
Coverage
• Processes• People
Proficiency
• Plan• Do• Check• Act
Coverage
• Processes• People
Proficiency
• Plan• Do• Check• Act
Coverage
• Processes• People
Factor 1
Capability Area 2 Maturity Score
Capability Area n Maturity Score

Business Process Management: Progression and Maturity
- 6:183 -
Methods – Process Design and Modelling
Maturity (Proficiency)
The intended purpose of the process design or model is clearly established and scoped.
Process designs and models are developed from a base such as a pre-defined reference model or similar.
Process designs and models are assessed against the expectations of stakeholders.
Process designs and models are assessed against approved modelling conventions.
Scale 1 Rarely, 2 Occasionally, 3 Neutral, 4 More Often than Not, 5 Almost Always (options of N/A and Unknown also provided)
Maturity (Coverage)
Approved methods are routinely used when modelling which groups of processes?
Which groups use approved methods for designing and modelling processes?
Scale Pre-defined groups of processes and people (see Appendix 13.3.7 for further details)
Table 44: Sample Maturity Survey Questions
The survey was available on-line using a standard internet connection. The
Researcher provided each user with a unique login and password. Company M
provided access to computers with internet connectivity in a training room
adjoining the room in which the workshop occurred. A sample of screen shots
from the survey is in:
Appendix 13.3.8 – Maturity Survey: Sample Screen Shots.
To assist participants with access and completion of the survey the Research
developed instructions, a copy of which is in:
Appendix 13.3.9 – Instructions for Maturity Survey.
Additionally, a range of documents were reviewed including presentations,
newsletters, process models, process architecture, strategic planning documents,
project documentation, summaries of Six Sigma projects, and corporate vision
and mission statements57.
57
The Researcher has removed company identification and other sensitive details from figures and no direct references to the source documents is included in this thesis in accordance with a Non-disclosure Agreement.
Chapter 6 – Exploratory Case Study
- 6:184 -
6.3 Data Collection
The case study with Company M occurred from February to December of 2006.
Following the agreement to participate, the Researcher met with the Key Contact,
who was the CIO of Company M, to plan the conduct of the study. The
Researcher briefed the Key Contact on the aims of the study in order to enable
the selection of the most appropriate individuals for participation in the study. As
the intent was to gain insights into the progression of the BPM Initiative, it was
important to the Researcher that participants be knowledgeable about the history
of the BPM Initiative within the company. Furthermore, to explore the capability
areas of the Extended Conceptual Model in a practical setting, it was important
that participants be experienced with the development of capability within the
BPM Initiative.
The Key Contact invited individuals to participate in the study via email. This
email included a copy of the documentation the Researcher had previously
provided to the company. Individuals were not obliged to accept this invitation
although all those invited did agree to participate. With the permission of
Company M and each individual participant, the Researcher recorded all
interviews and workshops and subsequently transcribed them for data analysis.
The Researcher conducted interviews with key executives and senior
management to capture their views on the progression of the BPM Initiative. This
included interviews with the seven Process Custodians58. The Key Contact
scheduled all interviews and personally introduced the Researcher to each
participant at the commencement of each interview. The Key Contact was not
present during the conduct of the interviews. Each interview occurred in the
participant‟s office. In total seven interviews were conducted ranging in duration
from just under 2 hours to almost 3 hours.
The Key Contact selected participants for the workshops based on their
knowledge of the factor under discussion and their understanding of practices in
58
Company M used the term Process Custodian to denote the executive or senior manager with accountability for each of Company M‟s seven core processes.

Business Process Management: Progression and Maturity
- 6:185 -
the company relevant to the BPM Initiative. In total 18 people participated in the
workshops. Most participants attended a single workshop, however two
participants attended two workshops and one participant attended three.
Participants in the workshops were key BPM personnel including Six Sigma
Black Belts, Subject Matter Experts, Process Improvement Managers and the
CIO. The workshops occurred in a designated conference room on Company M
premises. In total, the Researcher conducted six workshops, each lasting
approximately 4 hours and containing 3 or 4 participants.
Of the 18 workshop participants, 15 completed the Maturity Survey for the
relevant factor, with 13 completing the surveys immediately following the
workshops59. Two participants completed the survey in the following week, due
to work commitments and three participants did not complete any surveys due to
conflicting work commitments. No participants saw or completed the survey prior
to the workshop, thus the survey questions did not influence the direction or
content raised during the workshops.
Furthermore, all interview and workshop participants completed the Background
Survey either at the end of their interview or at the beginning of the workshop.
Completion took between 15 and 20 minutes. During the workshop, a Research
Assistant collated the survey responses from all participants into a single
document. At the end of the workshop, the Researcher and the participants
reviewed the combined responses to discuss any differences and to verify
completeness.
Table 45 summarises the participation based on the data collection instruments
applied whilst Table 46 provides details of the participants.
59
This means that 3 – 5 participants completed each survey, not that all 18 participants completed every survey. This presents a potential limitation for the data collected, as only people considered knowledgeable about the subject matter complete each survey. However, as the purpose of the study is to gain insights from such knowledge, the Researcher considered the use of a small number of highly knowledgeable participants suitable for the purpose of the workshops.
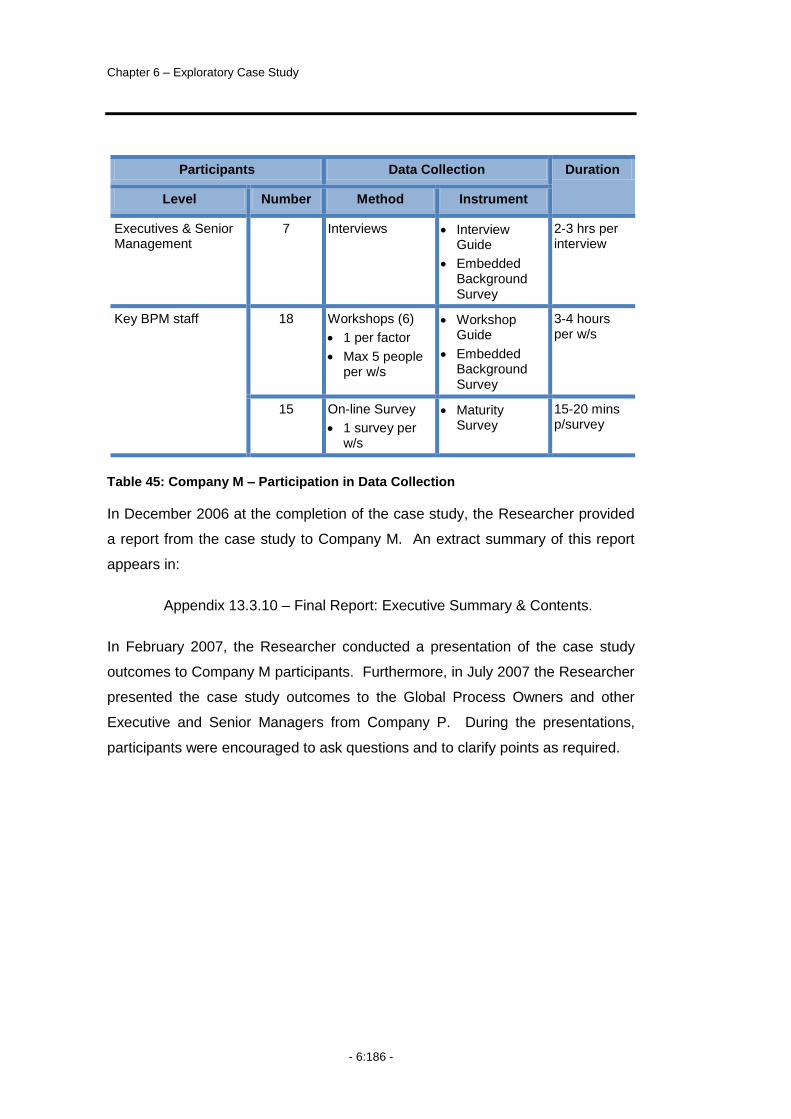
Chapter 6 – Exploratory Case Study
- 6:186 -
Participants Data Collection Duration
Level Number Method Instrument
Executives & Senior Management
7 Interviews Interview Guide
Embedded Background Survey
2-3 hrs per interview
Key BPM staff 18 Workshops (6)
1 per factor
Max 5 people per w/s
Workshop Guide
Embedded Background Survey
3-4 hours per w/s
15 On-line Survey
1 survey per w/s
Maturity Survey
15-20 mins p/survey
Table 45: Company M – Participation in Data Collection
In December 2006 at the completion of the case study, the Researcher provided
a report from the case study to Company M. An extract summary of this report
appears in:
Appendix 13.3.10 – Final Report: Executive Summary & Contents.
In February 2007, the Researcher conducted a presentation of the case study
outcomes to Company M participants. Furthermore, in July 2007 the Researcher
presented the case study outcomes to the Global Process Owners and other
Executive and Senior Managers from Company P. During the presentations,
participants were encouraged to ask questions and to clarify points as required.
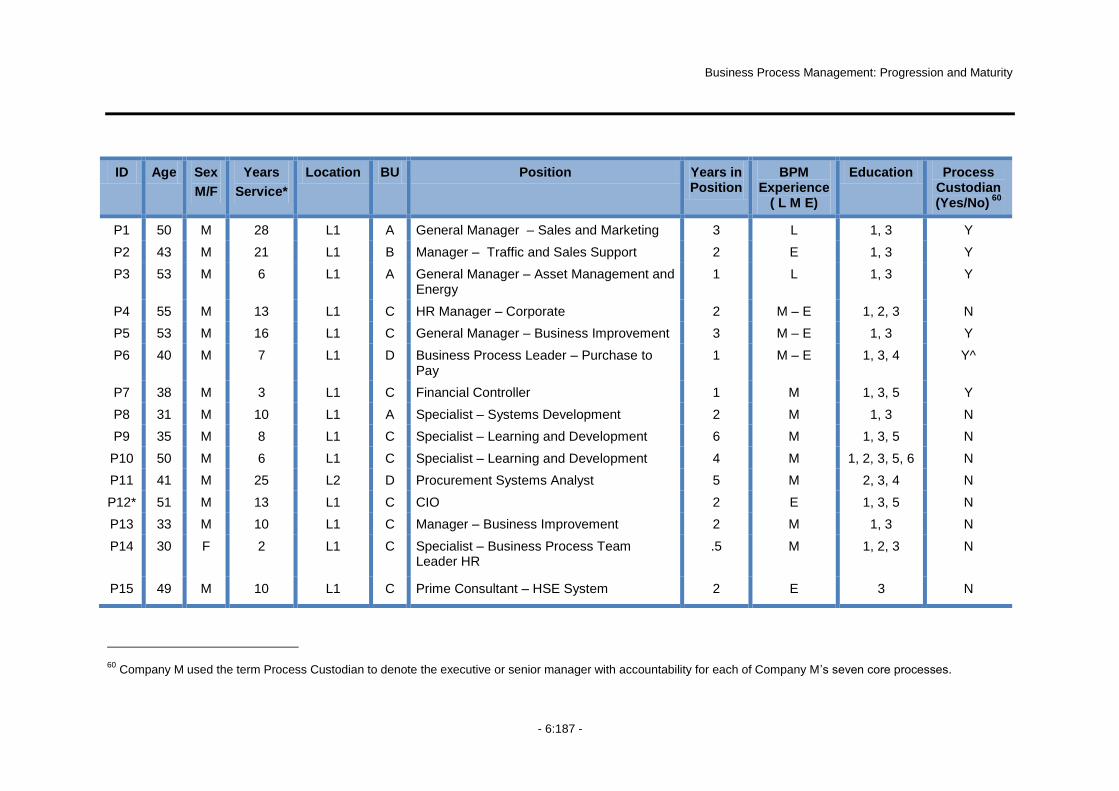
Business Process Management: Progression and Maturity
- 6:187 -
ID Age Sex
M/F
Years
Service*
Location BU Position Years in Position
BPM Experience
( L M E)
Education Process Custodian (Yes/No)
60
P1 50 M 28 L1 A General Manager – Sales and Marketing 3 L 1, 3 Y
P2 43 M 21 L1 B Manager – Traffic and Sales Support 2 E 1, 3 Y
P3 53 M 6 L1 A General Manager – Asset Management and Energy
1 L 1, 3 Y
P4 55 M 13 L1 C HR Manager – Corporate 2 M – E 1, 2, 3 N
P5 53 M 16 L1 C General Manager – Business Improvement 3 M – E 1, 3 Y
P6 40 M 7 L1 D Business Process Leader – Purchase to Pay
1 M – E 1, 3, 4 Y^
P7 38 M 3 L1 C Financial Controller 1 M 1, 3, 5 Y
P8 31 M 10 L1 A Specialist – Systems Development 2 M 1, 3 N
P9 35 M 8 L1 C Specialist – Learning and Development 6 M 1, 3, 5 N
P10 50 M 6 L1 C Specialist – Learning and Development 4 M 1, 2, 3, 5, 6 N
P11 41 M 25 L2 D Procurement Systems Analyst 5 M 2, 3, 4 N
P12* 51 M 13 L1 C CIO 2 E 1, 3, 5 N
P13 33 M 10 L1 C Manager – Business Improvement 2 M 1, 3 N
P14 30 F 2 L1 C Specialist – Business Process Team Leader HR
.5 M 1, 2, 3 N
P15 49 M 10 L1 C Prime Consultant – HSE System 2 E 3 N
60
Company M used the term Process Custodian to denote the executive or senior manager with accountability for each of Company M‟s seven core processes.

Chapter 6 – Exploratory Case Study
- 6:188 -
ID Age Sex
M/F
Years
Service*
Location BU Position Years in Position
BPM Experience
( L M E)
Education Process Custodian (Yes/No)
60
P16 52 M 23 L1 C Manager – Project Services 1 M 3 N
P17 57 F 6 L1 C Manager –Document Management Programme
1 E 3 N
P18 32 M 10 L1 D Manager – Process Improvement 1 M – E 3, 5 N
P19 37 M 14 L1 C Manager – Business Improvement 2 M 3, 5 N
P20* 29 M 10 L1 C Manager – Human Resources 1 L 1, 3, 5, 6 N
P21 41 F 4 L1 C Manager – Business Systems 1 M 1, 3 N
P22 48 M 26 L1 D Manager – IT Service Delivery 1 E 1, 3, 5 N
P23 28 F 4 L1 C Specialist – Software Development 4 L 1, 3 N
Legend
* Years Service shows combined Company M and Company P service ^ Past Process Custodian
Business Unit: A – Process A Location: L1 – Head Office BPM Exp: L – Low Education: 1 – Year 12 (equiv)
B – Process B L2 – Processing Site M – Medium 2 – TAFE
C – Head Office E – Extensive 3 – University
D – Company P 4 – Apprenticeship
5 – Professional
6 – Other
Table 46: Company M – Participant Details

Business Process Management: Progression and Maturity
- 6:189 -
6.4 Company M’s BPM Initiative
Company M was a wholly owned subsidiary of Company P operating in the
mining and resource sector. Company M consisted of a number of operational
sites located around the world, with a corporate head office based in Brisbane61.
All sites and corporate head office had „value delivery strategies‟ to guide
performance. For the sites, these strategies focused on the sustainable
improvement of production, and the cost and revenue capability of existing
assets. To achieve operational excellence and to maximise the value-added
production and customer satisfaction, the sites applied, or had access to, proven
world class operating, maintaining and improvement methodologies, core
technology and knowledge. The sites had a highly skilled and motivated all-staff
workforce empowered to perform and highly qualified HSEC management62.
The role of corporate head office was to support and service the sites in these
endeavours. This included providing context and strategic direction, providing
strategy, policy and practices to maximise the potential and satisfaction of
employees, providing audit and governance systems, providing technological
expertise, and maximising rates of improvement and learning through
collaboration, common systems and standards and a united culture.
Company M saw its competitive advantages as:
Having a world class mineral deposit that underpins their business
Having long term contracts with essential suppliers
Being able to leverage synergies from Company P
Having an “all-staff” workforce committed to continual improvement63.
61
The source of the information in this section was primarily a presentation by the General Manager - Process Improvement and a review of corporate documents.
62 HSEC is the Health, Safety and Environment Community that provides safety requirements and
governance for the mining sector.
63 An “all-staff workforce” was the term Company M used to denote the lack of unionisation within
the company.

Chapter 6 – Exploratory Case Study
- 6:190 -
6.4.1 Commencing the BPM Initiative
Participants indicated that the BPM Initiative had been evolving within Company
M since the early 1990‟s. This was evident in comments such as:
“…I‟ve been here for ten years and we were doing it for a few years
before that...”
“...it‟s been quite an on-going journey that we‟ve built upon over time
and to get to certain points there‟s quite a lot of bases to get there…”
There was a view amongst participants that the focus of the BPM Initiative had
become stronger in recent years, shown in comments such as:
“…there has been a stronger focus in last 4-5 years…”
“…the focus has really improved in the last 4-5 years…”
This increase in focus was at a time when Company M was seeking to improve
the cost base of business as a percentage of production whilst maintaining a
strict approach to safety as shown in Figure 27 and Figure 28.
Figure 27: Company M Vision for BPM and Cost Reduction
2004 Nominal Business Operating Cost Curve – Company M Operations
110
120
130
140
150
160
170
180
190
200
0.0% 25.0% 50.0% 75.0% 100.0%
Percentage of Production
(US
$/t
)
2004 Actual
2009 Plan
Source:Curve
Actual site data plotted
Raw Material Prices
Electricity Prices
Electricity Availability
Strengthening $A
Labour Rates
Improvement
- Creep
- Value Add
- Lean Six Sigma
- Asset Management
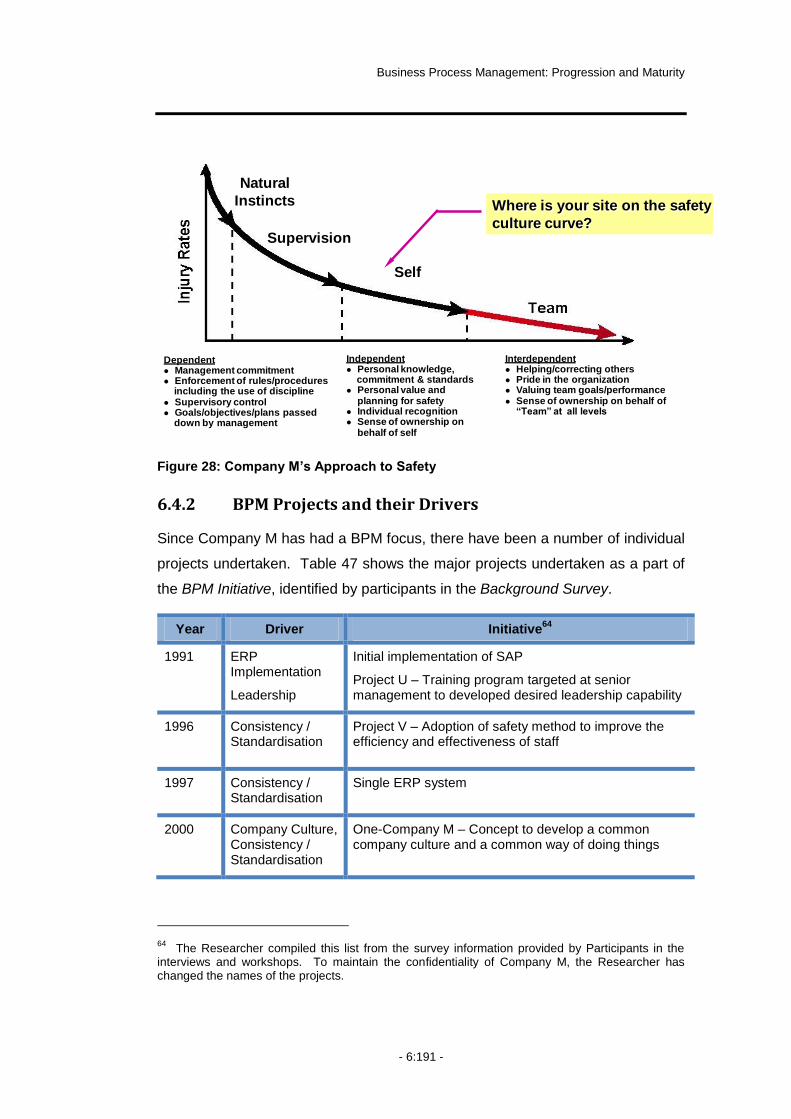
Business Process Management: Progression and Maturity
- 6:191 -
Figure 28: Company M‟s Approach to Safety
6.4.2 BPM Projects and their Drivers
Since Company M has had a BPM focus, there have been a number of individual
projects undertaken. Table 47 shows the major projects undertaken as a part of
the BPM Initiative, identified by participants in the Background Survey.
Year Driver Initiative64
1991 ERP Implementation
Leadership
Initial implementation of SAP
Project U – Training program targeted at senior management to developed desired leadership capability
1996 Consistency / Standardisation
Project V – Adoption of safety method to improve the efficiency and effectiveness of staff
1997 Consistency / Standardisation
Single ERP system
2000 Company Culture, Consistency / Standardisation
One-Company M – Concept to develop a common company culture and a common way of doing things
64
The Researcher compiled this list from the survey information provided by Participants in the interviews and workshops. To maintain the confidentiality of Company M, the Researcher has changed the names of the projects.
Interdependent Helping/correcting others Pride in the organization Valuing team goals/performance Sense of ownership on behalf of
“Team” at all levels
Natural
Instincts
Supervision
Self
Independent Personal knowledge,
commitment & standards Personal value and
planning for safety Individual recognition Sense of ownership on
behalf of self
Dependent Management commitment Enforcement of rules/procedures
including the use of discipline Supervisory control Goals/objectives/plans passed
down by management
Where is your site on the safety
culture curve?
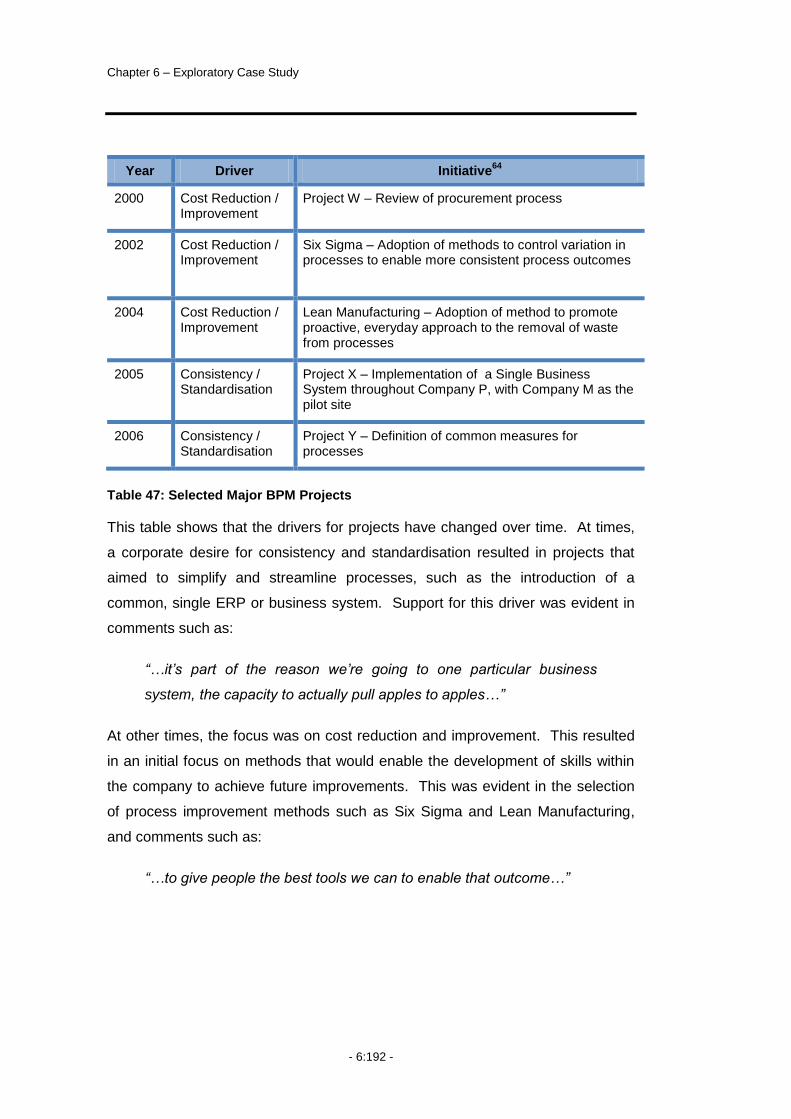
Chapter 6 – Exploratory Case Study
- 6:192 -
Year Driver Initiative64
2000 Cost Reduction / Improvement
Project W – Review of procurement process
2002 Cost Reduction / Improvement
Six Sigma – Adoption of methods to control variation in processes to enable more consistent process outcomes
2004 Cost Reduction / Improvement
Lean Manufacturing – Adoption of method to promote proactive, everyday approach to the removal of waste from processes
2005 Consistency / Standardisation
Project X – Implementation of a Single Business System throughout Company P, with Company M as the pilot site
2006 Consistency / Standardisation
Project Y – Definition of common measures for processes
Table 47: Selected Major BPM Projects
This table shows that the drivers for projects have changed over time. At times,
a corporate desire for consistency and standardisation resulted in projects that
aimed to simplify and streamline processes, such as the introduction of a
common, single ERP or business system. Support for this driver was evident in
comments such as:
“…it‟s part of the reason we‟re going to one particular business
system, the capacity to actually pull apples to apples…”
At other times, the focus was on cost reduction and improvement. This resulted
in an initial focus on methods that would enable the development of skills within
the company to achieve future improvements. This was evident in the selection
of process improvement methods such as Six Sigma and Lean Manufacturing,
and comments such as:
“…to give people the best tools we can to enable that outcome…”

Business Process Management: Progression and Maturity
- 6:193 -
Aligning the projects with the factors contained in the Extended Conceptual
Model provided an alternate view as shown in Figure 2965.
Figure 29: Selected BPM Projects per Factor
65
The placement of each project symbol is representative of the time at which the project or concept commenced within Company M. The size of the symbol is not representative of the duration of the project or the continuation of the project outcome within Company M. For example, the 1-Company M concept is still in evident in 2009 in a modified format – becoming 1-Company P with the increased involvement of Company P.
Adopt Lean
Strategic Alignment
Governance
Methods
Information Technology
People
Culture
1996 1997 1998 1999 2000 2001 2002 2003 2004 2005 2006 2007
Adoption of safety method -
DuPont
Increase in BPMI Focus
Implement Single Business System
1-Company M
Adopt Six Sigma
Single ERP System
Review Procurement
Processes
Defining/Aligning Process Measures
Train in Six Sigma Train in Lean
Cost Reduction Driver
Appoint New CEO
Safety Performance Increasing Role of
Company P
Standardisation / Consistency Driver
Standardisation / Consistency Driver
The range of projects showed that the approach to the initial
implementation and continuing application of a BPM Initiative could be
project-based, even when the scope of the BPM Initiative was enterprise-
wide.
Chapter 6 – Exploratory Case Study
- 6:194 -
Figure 29 highlights a number of aspects discussed in the coming sections.
Firstly, it shows that the focus across factors is not uniform at any given point.
During the BPM Initiative there were no major projects focused on developing
BPM Governance, for example. Over this same time however, there was higher
attention given to projects regarding the selection and adoption of Methods and
Information Technology.
Despite this apparent lack of attention to Governance, data from the interviews
and workshops highlighted the importance of Governance (see Section 6.5 and
Appendix 13.3.1 for further details). This suggested that a factor could be of
significance to the BPM Initiative even though there may have been no major
projects that aimed to develop capability within it.
Secondly, it shows that progression could reflect the introduction of a number of
complementary practices within a factor over time. Company M selected and
implemented more than one method for improving processes, for example. In
part, this was to meet changing needs – from a safety driver to a cost driver.
Interview and workshop data showed however, that Company M also introduced
Lean to meet shortfalls in the expected benefit arising from the use of Six Sigma
(see Section 6.5 and Appendix 13.3.1 for further details).
This suggested that prescriptive approaches to BPM that rely on a single
best practice approach may not adequately capture the existing
contextual environment of the organisation or the changing contextual
circumstances of organisations that lead to modification or extension of
practices based on suitability.
This raised the potential for spurious results during measurement
depending on how the measurement items and instruments seek to
capture the significance of a factor.
Business Process Management: Progression and Maturity
- 6:195 -
Thirdly, it shows that the focus on an individual factor was not constant, varying
over time. There was heightened attention given to IT in the late 90‟s with the
introduction of a new ERP system to streamline processes, for example. During
the early 2000‟s however, attention decreased in some factors, before gaining
momentum again in the mid 2000‟s. The increase in attention coincided with
Company P becoming more active in BPM, looking to introduce a common
business system across all its business entities.
Fourthly, it shows the potential for causal relationships between the factors and
capability areas over time. Following the implementation of the methods such as
Six Sigma and Lean (Methods – Process Improvement and Innovation),
Company M undertook an extensive period of training in these methods (People
– Process Education and Training), for example. Similarly, Company P‟s desire
to implement a common business system across multiple organisations (IT –
Process Implementation and Execution) has increased the focus on adopting and
refining consistent process measures that align with the new system and
business requirements (Strategic Alignment – Process Measures).
This showed that the measurement issues identified in earlier points in
relation to factors also apply at the level of capability areas.
Subsequent theory and measurement instruments need to consider the
implications of these findings.
This raised the potential for spurious results during measurement
depending on the extent to which measurement items and instruments
capture the rise and fall in activity over time and at different points in
time.

Chapter 6 – Exploratory Case Study
- 6:196 -
6.4.3 Benefits from the BPM Initiative
Although not aligned directly with individual projects, participants identified a
number of benefits arising from the BPM Initiative. Table 48 provides a summary
of the key areas in which participants had experience positive consequences that
they attributed to the BPM Initiative.
Affect Area of Affect
Reduction in Costs / Production costs
Variation
Waste
Improvement in Strategic planning, focus and alignment
Organisational Performance
Project turnaround times
Operational measures such as customer satisfaction, consistency / quality and safety / number of lost time injuries
Identification of improvement opportunities and alternatives
Identification of risks
Stability of physical processes
Capacity from existing assets with only marginal capital
Providing the right tools and systems
Portability and transitioning of staff
Collaboration on processes
Increased awareness of
Processes
Inter-relationships between processes
Process change and its consequence
Concept of value-add
Increased control over Finances
Measurement
Data collection
Increased standardisation / commonality in
Processes
Practice
Systems / Platforms
Language
Culture / Behaviour
Table 48: Major Affects of BPM
The data in Table 48 shows that Company M achieved numerous positive
benefits arising from implementing a BPM approach. Some participants also
noted the potential for less positive affects, however. One participant was
concerned that controls may become excessive, stating:

Business Process Management: Progression and Maturity
- 6:197 -
“…we are probably overly tightening up on controls…”
Another participant was concerned about the loss of flexibility, indicating:
“…there are areas that you just can‟t make common (…) we‟ve
compromised in doing some things in SAP…”
Yet another participant summarised the potential impact of process change
projects by stating:
“…my earlier comments on the valley of despair (…) it‟s about
keeping us in the top of that and not letting us get down to the bottom
because otherwise it‟s a long haul out of it again…”
These comments suggested that, immediately following a major process change
project an organisation might expect a period of reduced or negative reaction
until individuals within the organisation embed and accept the change.
6.4.4 Challenges to BPM Progression
Despite the benefits achieved from the BPM Initiative, participants identified the
necessity to continually revisit and enhance practices:
“…it‟s never going to be right when you first implement it and you‟ve
always got to keep changing (…) the idea of continuous
improvement…”
The need to adjust practices was evident in the challenges that Company M had
experienced during its journey. From the data collected during the interviews and
workshops, the Researcher classified the major challenges into categories of (1)
This showed that a BPM Initiative could have both positive and negative
effects on an organisation. A potential consequence of this is that the
progression of a BPM Initiative may not always be linear or in a forward
direction.
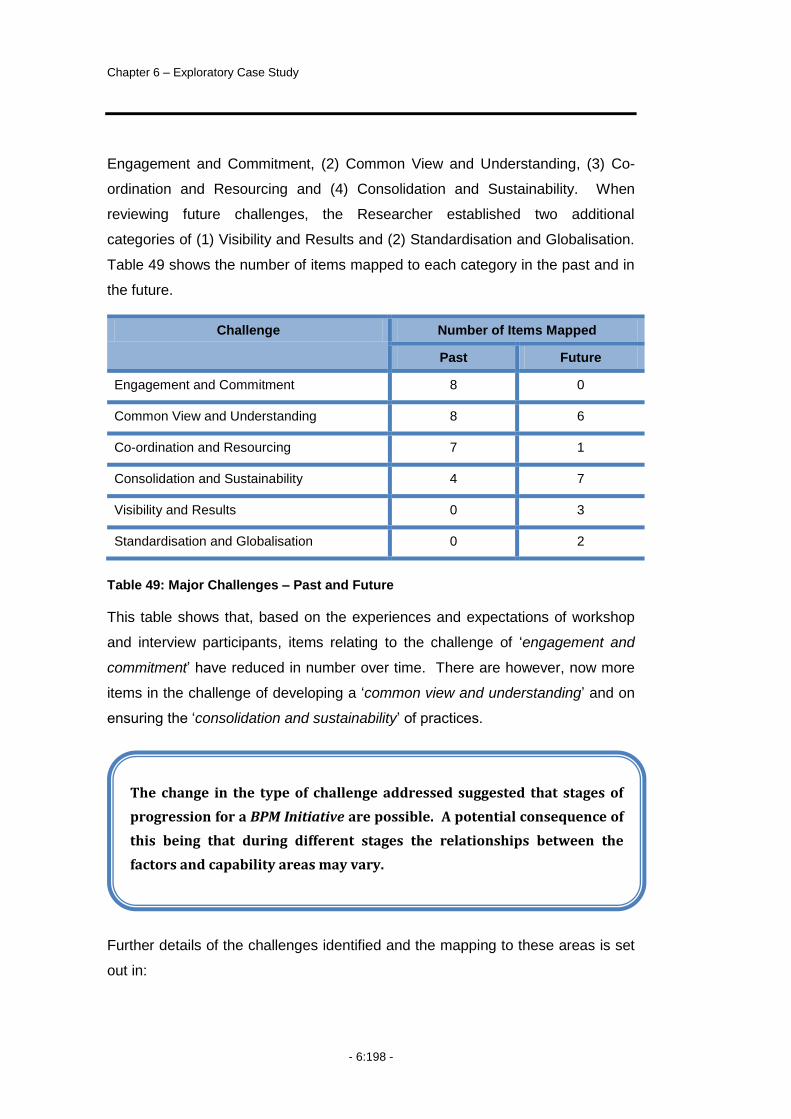
Chapter 6 – Exploratory Case Study
- 6:198 -
Engagement and Commitment, (2) Common View and Understanding, (3) Co-
ordination and Resourcing and (4) Consolidation and Sustainability. When
reviewing future challenges, the Researcher established two additional
categories of (1) Visibility and Results and (2) Standardisation and Globalisation.
Table 49 shows the number of items mapped to each category in the past and in
the future.
Challenge Number of Items Mapped
Past Future
Engagement and Commitment 8 0
Common View and Understanding 8 6
Co-ordination and Resourcing 7 1
Consolidation and Sustainability 4 7
Visibility and Results 0 3
Standardisation and Globalisation 0 2
Table 49: Major Challenges – Past and Future
This table shows that, based on the experiences and expectations of workshop
and interview participants, items relating to the challenge of „engagement and
commitment‟ have reduced in number over time. There are however, now more
items in the challenge of developing a „common view and understanding‟ and on
ensuring the „consolidation and sustainability‟ of practices.
Further details of the challenges identified and the mapping to these areas is set
out in:
The change in the type of challenge addressed suggested that stages of
progression for a BPM Initiative are possible. A potential consequence of
this being that during different stages the relationships between the
factors and capability areas may vary.
Business Process Management: Progression and Maturity
- 6:199 -
Appendix 13.3.11 – Categorisation of Past Challenges
Appendix 13.3.12 – Categorisation of Future Challenges.
In addition, there were a number of events identified that participants credited
with having a significant influence on Company M‟s BPM Initiative. The first of
these was the One-Company M concept.
6.4.5 The Role of One-Company M
Participants saw the introduction of the One-Company M concept in 2001 as a
crucial step in moving the BPM Initiative forward. The One-Company M concept
was instigated by the then CEO of Company M whose vision was to unite the
organisation under one common umbrella. Comments by participants included:
“…I remember when Company M, Site A and Head Office became
more integrated and then Company M became more integrated, and
Process A moved up here, it more or less became one big Company
M...”
“…we‟re well down the path of attaining that one view, the One
Company M view. Previously we‟ve been pretty dominantly „own
business‟ operating sites whereas now I think we do have a wider hat
on (…) that was a major, major change…”
The modification of Company M‟s logo to incorporate the One-Company M
concept was a further sign of the commitment to this initiative.
These statements show how having a BPM Initiative with strong CEO support
and a clear vision can assist a company to overcome boundaries (in this case the
disparate operation of Head Office and the sites). Additional statements
highlighted the long-term nature of a BPM Initiative including:
“…it‟s probably the hardest bit to get (…) there‟s much more of a
One-Company M culture than there used to be, it‟s still a hard thing to
really achieve…”
Chapter 6 – Exploratory Case Study
- 6:200 -
The emerging influence on Company M‟s BPM Initiative by Company P resulted
in a change from a One-Company M to a One-Company P view. Despite the
positive effects of the BPM Initiative within One-Company M, this transition was
not without challenge, as discussed in the following section.
6.4.6 The Influence of Company P
As indicated earlier, Company M was a wholly owned subsidiary of Company P.
Until shortly before the case study, Company M had been operating
predominantly as a stand-alone company, able to make operating decisions in its
own best interest. Company P had recently made a decision to become more
active in implementing a BPM approach as a means of increasing synergies
between its wholly owned or controlled entities, of which there were more than
50. Comments from participants reflecting the change in focus within Company
M included:
“…a step to the One Company M, the next step to One Company P
(…) as long as it‟s led right it should be all right…”
“…had One Company M (…) now we‟re becoming One Company
P…”
Consequently, the BPM strategy within Company M was now driven by their
parent company, Company P, rather than from within Company M. This was
evident in comments such as:
“...and then that‟s when we moved further with Company P taking
more control…”
“…increasingly more adoption or really ownership – especially with
the integration of Company P – more visible in the last 12 months…”
Further evidence of the increase in Company P‟s influence on Company M was
apparent in projects such as Project X and Project Y66. Company M was the pilot
66
To maintain the confidentiality of Company M, the Researcher has changed the names of the projects.
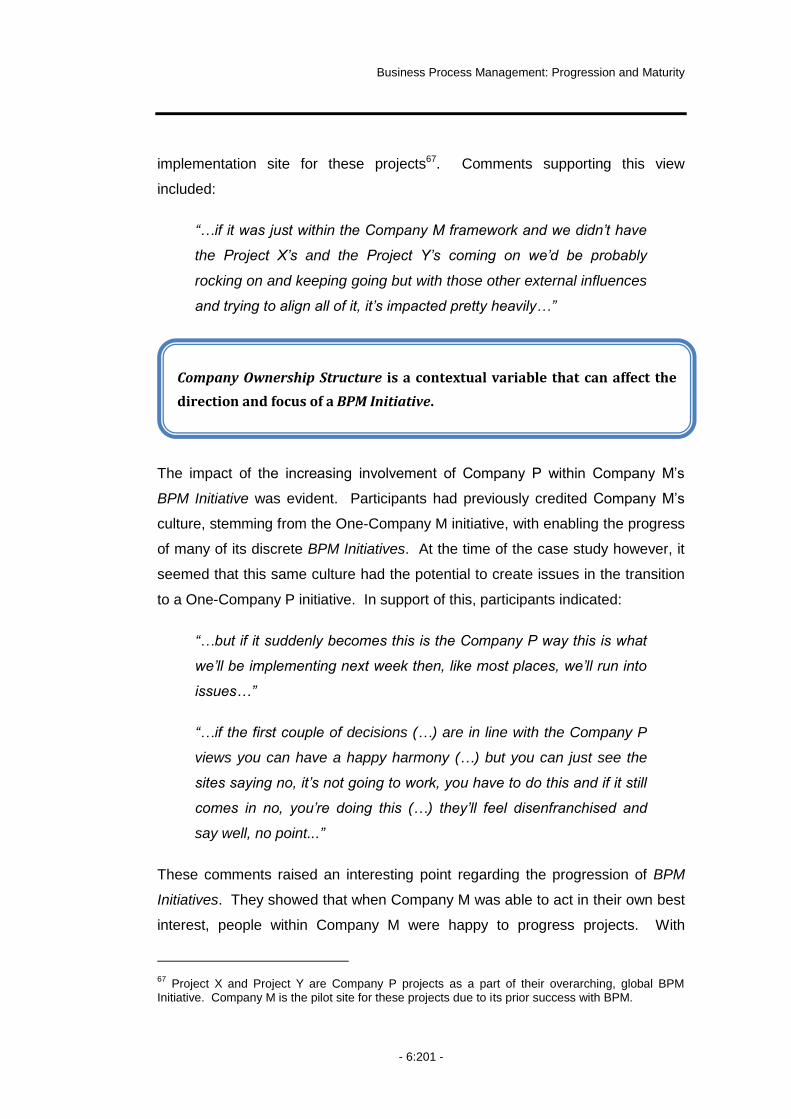
Business Process Management: Progression and Maturity
- 6:201 -
implementation site for these projects67. Comments supporting this view
included:
“…if it was just within the Company M framework and we didn‟t have
the Project X‟s and the Project Y‟s coming on we‟d be probably
rocking on and keeping going but with those other external influences
and trying to align all of it, it‟s impacted pretty heavily…”
The impact of the increasing involvement of Company P within Company M‟s
BPM Initiative was evident. Participants had previously credited Company M‟s
culture, stemming from the One-Company M initiative, with enabling the progress
of many of its discrete BPM Initiatives. At the time of the case study however, it
seemed that this same culture had the potential to create issues in the transition
to a One-Company P initiative. In support of this, participants indicated:
“…but if it suddenly becomes this is the Company P way this is what
we‟ll be implementing next week then, like most places, we‟ll run into
issues…”
“…if the first couple of decisions (…) are in line with the Company P
views you can have a happy harmony (…) but you can just see the
sites saying no, it‟s not going to work, you have to do this and if it still
comes in no, you‟re doing this (…) they‟ll feel disenfranchised and
say well, no point...”
These comments raised an interesting point regarding the progression of BPM
Initiatives. They showed that when Company M was able to act in their own best
interest, people within Company M were happy to progress projects. With
67
Project X and Project Y are Company P projects as a part of their overarching, global BPM Initiative. Company M is the pilot site for these projects due to its prior success with BPM.
Company Ownership Structure is a contextual variable that can affect the
direction and focus of a BPM Initiative.
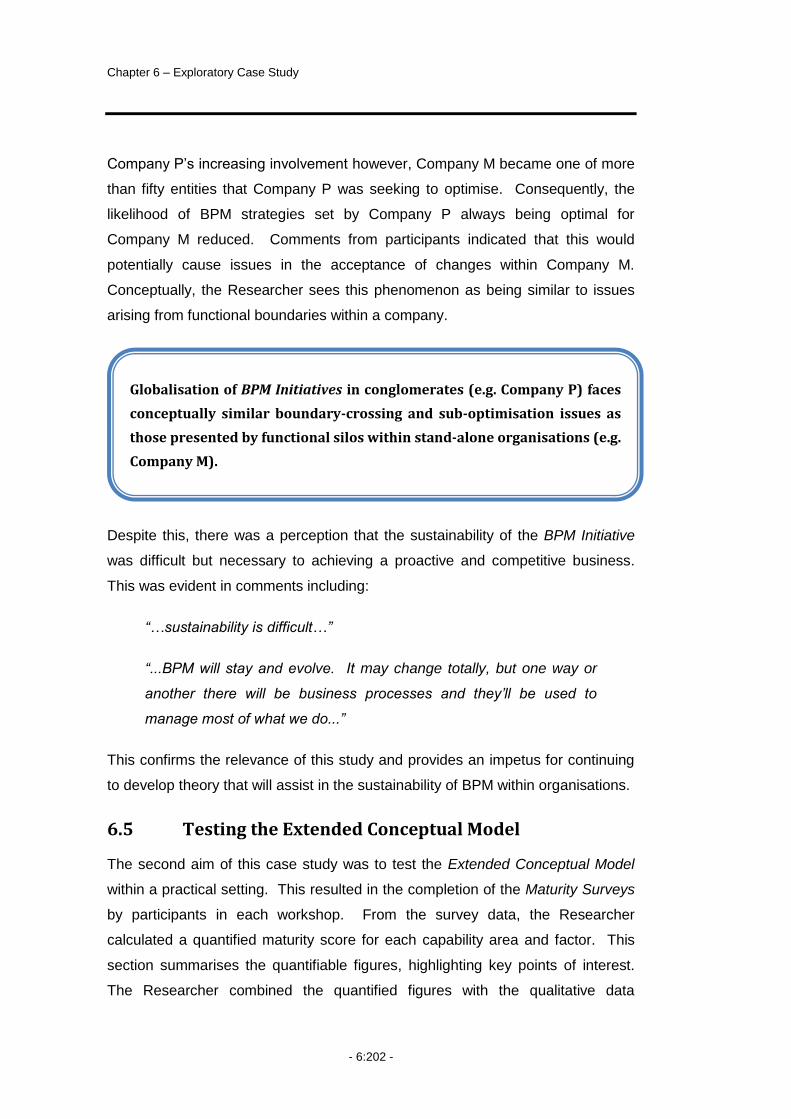
Chapter 6 – Exploratory Case Study
- 6:202 -
Company P‟s increasing involvement however, Company M became one of more
than fifty entities that Company P was seeking to optimise. Consequently, the
likelihood of BPM strategies set by Company P always being optimal for
Company M reduced. Comments from participants indicated that this would
potentially cause issues in the acceptance of changes within Company M.
Conceptually, the Researcher sees this phenomenon as being similar to issues
arising from functional boundaries within a company.
Despite this, there was a perception that the sustainability of the BPM Initiative
was difficult but necessary to achieving a proactive and competitive business.
This was evident in comments including:
“…sustainability is difficult…”
“...BPM will stay and evolve. It may change totally, but one way or
another there will be business processes and they‟ll be used to
manage most of what we do...”
This confirms the relevance of this study and provides an impetus for continuing
to develop theory that will assist in the sustainability of BPM within organisations.
6.5 Testing the Extended Conceptual Model
The second aim of this case study was to test the Extended Conceptual Model
within a practical setting. This resulted in the completion of the Maturity Surveys
by participants in each workshop. From the survey data, the Researcher
calculated a quantified maturity score for each capability area and factor. This
section summarises the quantifiable figures, highlighting key points of interest.
The Researcher combined the quantified figures with the qualitative data
Globalisation of BPM Initiatives in conglomerates (e.g. Company P) faces
conceptually similar boundary-crossing and sub-optimisation issues as
those presented by functional silos within stand-alone organisations (e.g.
Company M).

Business Process Management: Progression and Maturity
- 6:203 -
captured during interviews, workshops and document review. In doing so, the
Researcher provides insights into the applicability of, and, potential interactions
within, the Extended Conceptual Model. The following section provides a
condensed version of these findings. Appendix 13.3.1 provides further details of
this body of work and provides additional support for the assertions made
below68.
6.5.1 Overview of Factors
Application of the Maturity Surveys resulted in the calculation of quantifiable
maturity scores for the factors. Figure 30 shows the maturity scores calculated
with the dotted line reflecting the average score across all factors, for Company
M. As indicated earlier, the scores have been calculated by averaging responses
from a 5-point rating scale where a 1 reflects low maturity and a 5 with high.
Figure 30: Maturity Scores per Factor
As Figure 30 shows, there was a noticeable difference between the maturity
scores of the factors, ranging from 2.43 through to 3.32, an overall range of 0.89.
People (3.32), Culture (3.15) and Strategic Alignment (2.97) have higher average
scores whilst Governance (2.73), Methods (2.66) and Information Technology
(2.43) have lower average scores.
68
The constraints of the PhD thesis have led to this presentation format.

Chapter 6 – Exploratory Case Study
- 6:204 -
The exploration of Company M‟s BPM Initiative showed that concepts such as
One Company M have directed attention towards some factors more so than
other factors. This reflected in higher maturity scores for the People and Culture
factor. Application of the Extended Conceptual Model in the surveys also
enabled the calculation of maturity scores for the capability areas, as shown in
Figure 31. Use of the model as a guide to the workshops also enabled deeper
discussion of the practices within the capability areas of each factor, providing
additional insights into progression of the BPM Initiative.
6.5.2 Overview of Capability Areas
As indicated earlier, the design of the Maturity Surveys resulted in the
Researcher calculating a separate maturity score for each capability area. The
results arising from completion of the Maturity Surveys during the workshop
appear in Figure 31.
Figure 31: Capability Area Results – Company M
Figure 31 shows that across the capability areas there is a marked difference in
the maturity. This difference was evident both within and across factors. The
range in scores across the capability areas but within each factor also showed
significant variation as seen in Table 50.
1
Governance MethodsStrategic
AlignmentInformation Technology
People Culture
Process Management
Standards
Process Metrics & Performance
Linkage
Process Roles and
Responsibilities
Process Management
Decision Making
Process Measures
Enterprise Process
Architecture
Strategy & Process Capability Linkage
Process Improvement
Plan
Process Customers & Stakeholders
Process Control & Measurement
Process Implementation
& Execution
Process Design & Modeling
Process Control & Measurement
Process Implementation
& Execution
Process Design & Modeling
Process Education &
Learning
Process Management Knowledge
Process Skills & Expertise
Process Attitudes & Behaviors
Process Values & Beliefs
Responsiveness to Process
Change
Process Project & Program Mgmt
Process Improvement &
Innovation
Process Project & Program Mgmt
Process Improvement &
Innovation
Process Management
Leaders
Process Collaboration & Communication
Leadership Attention to
Process
Process Management
Social Networks
Process Management
Controls
2 3 4 5
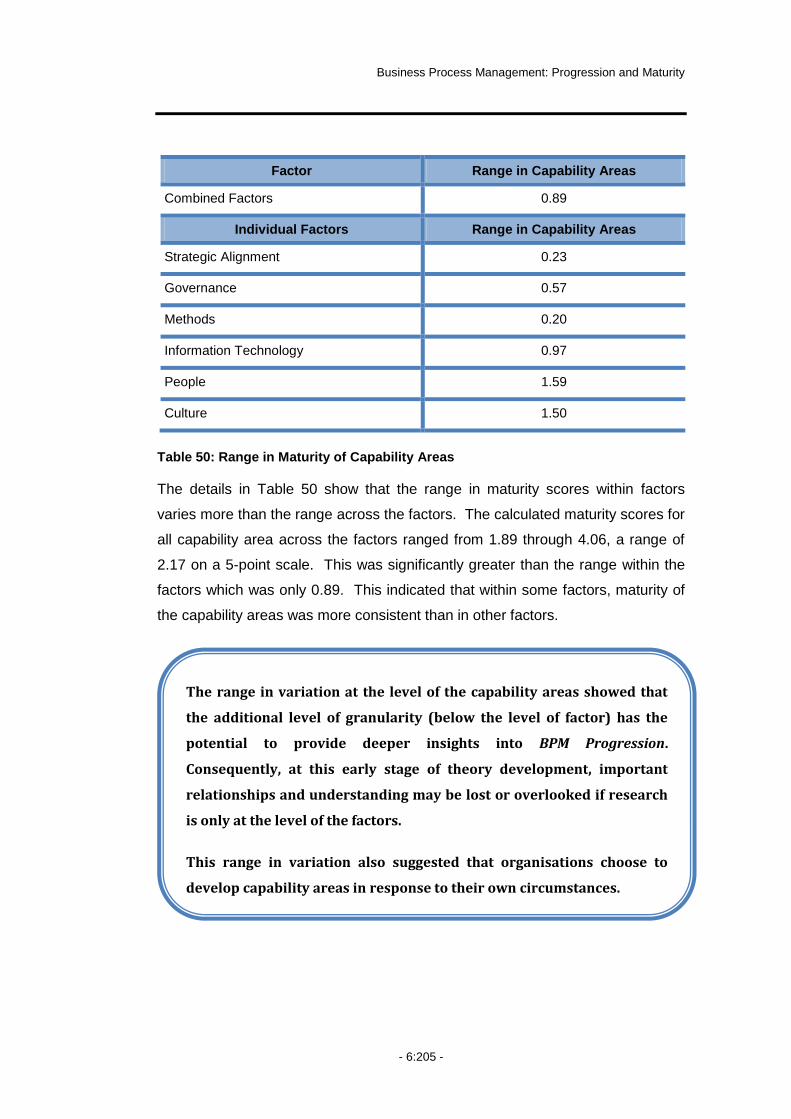
Business Process Management: Progression and Maturity
- 6:205 -
Factor Range in Capability Areas
Combined Factors 0.89
Individual Factors Range in Capability Areas
Strategic Alignment 0.23
Governance 0.57
Methods 0.20
Information Technology 0.97
People 1.59
Culture 1.50
Table 50: Range in Maturity of Capability Areas
The details in Table 50 show that the range in maturity scores within factors
varies more than the range across the factors. The calculated maturity scores for
all capability area across the factors ranged from 1.89 through 4.06, a range of
2.17 on a 5-point scale. This was significantly greater than the range within the
factors which was only 0.89. This indicated that within some factors, maturity of
the capability areas was more consistent than in other factors.
The range in variation at the level of the capability areas showed that
the additional level of granularity (below the level of factor) has the
potential to provide deeper insights into BPM Progression.
Consequently, at this early stage of theory development, important
relationships and understanding may be lost or overlooked if research
is only at the level of the factors.
This range in variation also suggested that organisations choose to
develop capability areas in response to their own circumstances.

Chapter 6 – Exploratory Case Study
- 6:206 -
6.6 Outcomes and Next Steps
The case study with Company M provided a number of outcomes that are
important to this study. The first of these is an understanding of the progression
of a BPM Initiative. The study with Company M showed that even when the BPM
Initiative is company-wide, the execution of the BPM Initiative is likely to
encompass a series of projects. Furthermore, the drivers and organisational
context are likely to influence the selection of projects that aim to deliver benefits
and/or build capabilities of most
immediate purpose to the organisation.
Figure 32 summarises this
interaction. In essence, the BPM Initiative
potentially involves a multitude of projects
that have competing priorities and are at
different stages of the completion. As
seen within Company M, this can affect
not only the progression of the BPM
Initiative but also the measurement of this
progression.
Figure 32: Elements in a BPM Initiative
The consequence on the overall progression of the BPM Initiative from a
progression and measurement perspective includes:
Organisations may choose to put more or less emphasis on progressing
factors at different points as drivers and context change. Consequently, a
prescriptive approach to implementing a BPM Initiative is unlikely to lead
to optimal results.
Factors may mature at different rates, dependent upon the success and
magnitude of the projects undertaken. In Company M, this was evident in
higher levels of maturity in People and Culture factors due to One-
Company M and the focus on working together to promote
standardisation.
Drivers
Projects
Benefits
CapabilitiesContext

Business Process Management: Progression and Maturity
- 6:207 -
The significance of factors may vary over time dependent on where the
organisation has elected to develop capability and/or achieve benefits.
The prima facie significance of Information Technology for example, was
strong during times of implementing new technology. Outside of these
times however, the relative significance may have appeared less, if
measured then.
Causal relationships are possible between the capability areas.
Furthermore, these relationships may vary over time, being more or less
visible at different times. This was evident in Company M in the increase
in training that occurred immediately following the implementation of new
methods for process improvement. It was also apparent in the
relationship between the conduct of projects to implement a standardised
technology for the execution of core processes and the corresponding
increase in attention to establishing process measures.
The capability areas provided the potential for gaining deeper insights into
progression and measurement as, when these roll up to a factor level,
differences and variation can be lost or overlooked.
These outcomes have significant implications for this study as they affect the
design and construct of both a theory on BPM Progression and instruments to
measure BPM Maturity.
6.6.1 Next Steps
As noted in Chapter 2, the ability to generalise is important to the development of
theory. Thus, while the outcomes from the case study with Company M provided
important insights into potential relationships, the extent to which these outcomes
can be generalised across organisations is largely unknown at this stage. The
case study with Company M also captured data for the entire progression of the
BPM Initiative, although it did not capture data in a manner that enabled the
measurement of change in the relationships from one point in time to another.
One can therefore only assume that a change in capability areas or factors
occurred and further investigation is required to substantiate this assumption.

Chapter 6 – Exploratory Case Study
- 6:208 -
Consequently, the next chapter begins Stage 2 of this study. This stage looks to
build upon the conceptual beginnings arising from the study to this point. As
indicated in Chapter 2, due to the early stage of theory development, conducting
a longitudinal study with multiple case organisations was more appropriate to the
theory building than cross-sectional studies at this point69. Stage 2 of this study
culminates in the proposition of theory on BPM Progression and the proposal of a
measurement model for BPM Maturity.
6.7 Chapter Summary
This chapter detailed the design and conduct of a single exploratory case study.
The aims of this study were to explore the progression of a BPM Initiative within
an organisation and to test the extended conceptual model within a practical
setting.
The chapter commenced with details of the case design. This included setting
the unit of analysis as the BPM Initiative and selecting Company M as suitable for
the study. Next, the Researcher detailed the design of a number of data
collection instruments including an Interview Guide, a Workshop Guide, a
Background Survey and the revised Maturity Surveys. The following sections
detailed participation in the case, including the participants and the data
collection in which they participated.
The following sections detailed key aspects of the progression of the BPM
Initiative within Company M. This included how Company M took a long-term
approach to continually developing its BPM Initiative. Consequently, the BPM
Initiative included a series of projects that arose from a combination of contextual
influences and drivers for change within Company M. Key aspects such as the
One-Company M concept and the increasing role of Company P had significant
influence over the progression of the BPM Initiative, showing that progression
was not necessarily linear or always in a forward direction.
69
Chapter 2 provides additional details on the selection of Longitudinal Case Studies for this stage of the research.

Business Process Management: Progression and Maturity
- 6:209 -
Application of the Maturity Surveys highlighted the consequences of progression
on measurement, showing first, how factors displayed less variation than did the
capability areas. Furthermore, this study showed that the contextual and
temporal aspects of progression combines and creates the potential for dynamic
causal relationships at both the factor and capability area level. The static and
singular point of data capture in the case study made views on the change in
factors and capability areas an assumption that required further investigation.
The next chapter details the design of the longitudinal case studies undertaken
with five companies to build upon the conceptual theory emerging from Stage 1
of this study.


STAGE 2
BUILDING BPM THEORY


Business Process Management: Progression and Maturity
- 7:213 -
7 Longitudinal Case Studies
he focus of this study thus far has been on the exploration of BPM
Initiatives within organisations. In the previous chapter, the
Researcher explored the BPM Initiative in a large mining organisation
using the BPM Capability Framework developed from the Delphi Studies. This
study showed variation in the development of the capability areas over time.
Consequently, to refine and confirm the emerging theory on progression, the
Researcher conducted a series of longitudinal case studies centred on the
capability areas. These cases enabled the Researcher to study the extent to
which the emphasis organisations placed on the capability areas changed
between two defined points in time. Pettigrew (1990, 269) states:
“…For the analyst interested in the theory and practice of changing,
the task is to identify the variety and mixture of causes of change and
to explore through time some of the conditions and contexts under
which these mixtures occur…”
Studying the change in emphasis over time enabled the Researcher to explore
which capability areas organisations focus on, to what extent and when, while
also gaining an understanding of the context in which the change occurred.
Furthermore, the use of multiple studies enabled investigation of the potential for
patterns in the selection of capability areas across companies, thereby increasing
the generalisability of outcomes.
T

Chapter 7 – Longitudinal Case Studies
- 7:214 -
7.1 Chapter Overview
The structure of this chapter is as follows. Section 2 details the design of the
longitudinal case studies including the definition of the unit of analysis and the
use of sampling when selecting cases. Section 3 details the data collection
instruments including the design of the interview and workshop guides and the
so-called BPM Evolution Survey. Section 4 discusses the data collection process
including the scheduling of the cases, inviting participants and the approach
taken to collecting data. Section 5 details the approach to calculating the change
in emphasis between the two data points included in the longitudinal study.
Section 6 concludes with a summary of the chapter and an outline of the
forthcoming chapters that present the within case and cross case analysis and
propose the refined theory arising from this study.
7.2 Multiple Case Study Design
The earlier case study with Company M highlighted the temporal implications of
progressing BPM Initiatives, showing that an organisation will potentially focus on
developing different capabilities at different points in time. Consequently, the
response to questions about a BPM Initiative is likely to vary, dependent on the
stage of progression. Furthermore, as the interpretation and understanding of
BPM can vary (both within the domain and within an organisation) a single point
of reference for data collection, be it time or participant based, has the potential
to bias data. Bowen and Wiersema (1999) suggested that to conduct cross-
sectional studies in such circumstances, without understanding the import of
these aspects would potentially result in spurious outcomes.
An alternative approach is to undertake a longitudinal study that captures data at
more than one point in time. A longitudinal case study enables the investigation
of change over time allowing for greater identification and understanding of the
relationships between variables, whilst also enabling the capture of views from
multiple informants within an organisation (Bergh & Holbein 1997; Hill & Hansen
1991). Furthermore, the conduct of multiple longitudinal case studies would
improve the generalisability of outcomes by enabling cross case analysis.
Pettigrew (1990) referred to this approach as a “longitudinal comparative case
study method”.
Business Process Management: Progression and Maturity
- 7:215 -
One approach to a longitudinal study is to investigate a number of companies
closely over an extended time. A potential limitation of this approach is the time
and commitment required. An alternative approach is to have a single data
collection point that captures data for more than one time point. A potential
limitation of this approach is the historic recollection of the informants with regard
to past events70.
In this study, the Researcher utilised the second of these two approaches due to
the desire to improve the generalisability of the theory by conducting multiple
studies, and the time constraints of the study. This means that the Researcher
captured quantitative data for two points during the single case study. The data
points selected by the Researcher were the first year and the last year of the
BPM Initiative within each company. The first year referred to the year
participants of each company recognised as the starting point of the BPM
Initiative. The last year referred to the most recent year of the BPM Initiative.
The Researcher supplemented the quantitative data collected at these two points
by collecting qualitative data in interviews, workshops and documentation
reviews. This qualitative data related to the entire journey of the BPM Initiative
within the organisation, including the time immediately prior to commencing the
BPM Initiative. The Researcher used the qualitative and quantitative data to
triangulate findings regarding the progression of the BPM Initiatives71.
7.2.1 Approach to Sampling
Yin (2003) distinguished between literal and theoretical replication. According to
Yin, literal replication aims for similar results from different sites to confirm the
circumstances in which the expected outcome will hold. Theoretical sampling
however, aims to show that the absence of certain conditions within cases will
result in different outcomes thus confirming the importance of the condition to the
70
To minimise the effect of historical recollection, the Researcher used a combination of multiple informants and complementary data collection instruments. There is a discussion of other limitations of this approach in Section 11.4.3.
71 The research of Kim & Malhotra (2005); Leonard-Barton (1990); McPhee (1990); van de Ven &
Huber (1990) informed the design and conduct of these longitudinal case studies.

Chapter 7 – Longitudinal Case Studies
- 7:216 -
theory. Eisenhardt (1989) recommended using theoretical sampling in order to
select cases that will enable the extension or replication of theory.
Literal Replication
The emerging theory on BPM Progression suggests that, within their BPM
Initiative, organisations focus on developing different BPM capability at different
times. To achieve literal replication it is therefore necessary to show that the
progression of BPM Initiatives (as evidenced by the emphasis placed on building
capabilities) varies across different organisations, at the same point in time.
Theoretical Replication
With regard to theoretical replication, the Researcher contends that the structure
of the BPM Initiative and the concept of Executive Buy-In are conditions that are
likely to lead to different results in the progression of BPM Initiatives.
The basis for the contention about the structure of the BPM Initiative arises from
the difference in interpretations of BPM as a management approach72. The
contention with regard to the level of Executive Buy-In arises from the continual
reference to the importance of Executive Buy-In to BPM Initiatives throughout this
study and in extant literature73. Furthermore, the Researcher contends that the
level of Executive Buy-In is likely to influence or perhaps determine the structure
of the BPM Initiative.
By way of explanation, this study has shown that contextual variables such as
workforce demographics and legislation are likely to affect how organisations do
BPM (i.e. what the organisation does next and how). To this end, Executive Buy-
In is a contextual variable as it affects which capability an organisation
emphasises, to what extent and when. Low or isolated levels of Executive Buy-In
for example, may cause an organisation to focus on building the capability area
72
Refer to Chapter 3 for a discussion on the different interpretations including, technology, lifecycle and organisational management approaches.
73 Case studies with Company A, B and M include reference to the importance of “leadership”,
“executive support” and “executive commitment” as have researchers such as Pritchard and Armistead (1999) and Lee and Dale (1998).
Business Process Management: Progression and Maturity
- 7:217 -
Leadership Attention to Process sooner than later. Furthermore, the strategies
selected for increasing leadership attention may depend on (among others) the
types of leaders in the organisation.
The Researcher contends that the affect of Executive Buy-In is more significant
to the progression of BPM Initiatives than other contextual variables. This is
because Executive Buy-In has the potential not only to influence what happens
within a BPM Initiative but also whether the organisation has a BPM Initiative at
all and if so, what structure the BPM Initiative takes within the organisation. A
lack of CEO support for example, may mean that an organisation does not have
a BPM Initiative, or strong support from only a small number of executives may
mean that the BPM Initiative only applies to a defined area of the organisation.
Consequently, the structure of the BPM Initiative and the level of Executive Buy-
In have the potential to extend the emerging theory by enabling exploration of the
role and relationship of these two concepts.
7.2.2 Change in Emphasis
To date this study has focused on measuring BPM Maturity. One could therefore
ask why the Researcher elected to measure the change in emphasis (as
opposed to the change in maturity) of the capability areas. The Researcher
contends that the level of emphasis placed on the capability areas was more
appropriate for these longitudinal studies due to the focus on investigating the
progression of the BPM Initiatives. As defined in this study, BPM Maturity was a
static concept designed to capture progression of the BPM Initiative at a given
point in time. Therefore, it aims to measure the consequence of progression. In
the longitudinal studies, the Researcher wanted to investigate the way in which
progression of the BPM Initiative occurred and to study what affected this
journey, not measure the result of its occurrence74.
74
The Researcher recognises that emphasis does not equate with success, nor does it mean that the emphasis given was the best course of action. Furthermore, an organisation may place high emphasis on an area but not achieve a positive result, the expected result or the same result as another organisation placing the same emphasis. Investigating such issues however requires further research and Chapter 11 provides additional insights into this.
Chapter 7 – Longitudinal Case Studies
- 7:218 -
7.2.3 Case Selection
To address both theoretical and literal replication in the multiple case studies
some companies needed to be similar enough in the characteristics of both the
company and the BPM Initiative, whilst some needed to be sufficiently different.
Thus, it was important to include organisations from a range of industries, known
to have made progress with their BPM Initiatives, where the initiatives had a
range of start dates, differing levels of Executive Buy-In, and differing structures
of their BPM Initiatives. Furthermore, the accessibility of the organisation and to
appropriate individuals within the organisation was also a criterion for the
selection of cases due to time and budget constraints.
In selecting potential cases, the Researcher presented an outline of the planned
study to the companies participating in the Australian BPM Roundtable75. The
membership requirements of this forum meant that the basic criteria of having an
active BPM Initiative and organisations with different demographics were
satisfied. Following this presentation, 15 companies expressed an interest in
participating and the Researcher subsequently provided them with additional
documentation as shown in:
Appendix 13.4.1 – Expression of Interest in BPM Evolution Case Studies
Appendix 13.4.2 – Information Sheet and Informed Consent.
Four of the 15 companies were able to secure agreement to participate.
Subsequently, another company approached the Researcher and agreed to
participate in the study resulting in five cases participating in the final study.
Table 51 shows the demographics of participating companies that the
Researcher collected using the BPM Evolution Survey discussed in the next
section76.
75
The Australian BPM Roundtable is a collaborative BPM forum, founded by Professor Michael Rosemann of QUT. Participating companies must have an active BPM initiative, representation from senior management and executive levels, and membership is subject to approval.
76 The iterative use of case studies in this study, each with a different purpose, has led the
Researcher to distinguish clearly between the names given to each group. To this end, the names given to the companies participating in the longitudinal studies are Company S, T U V and W.
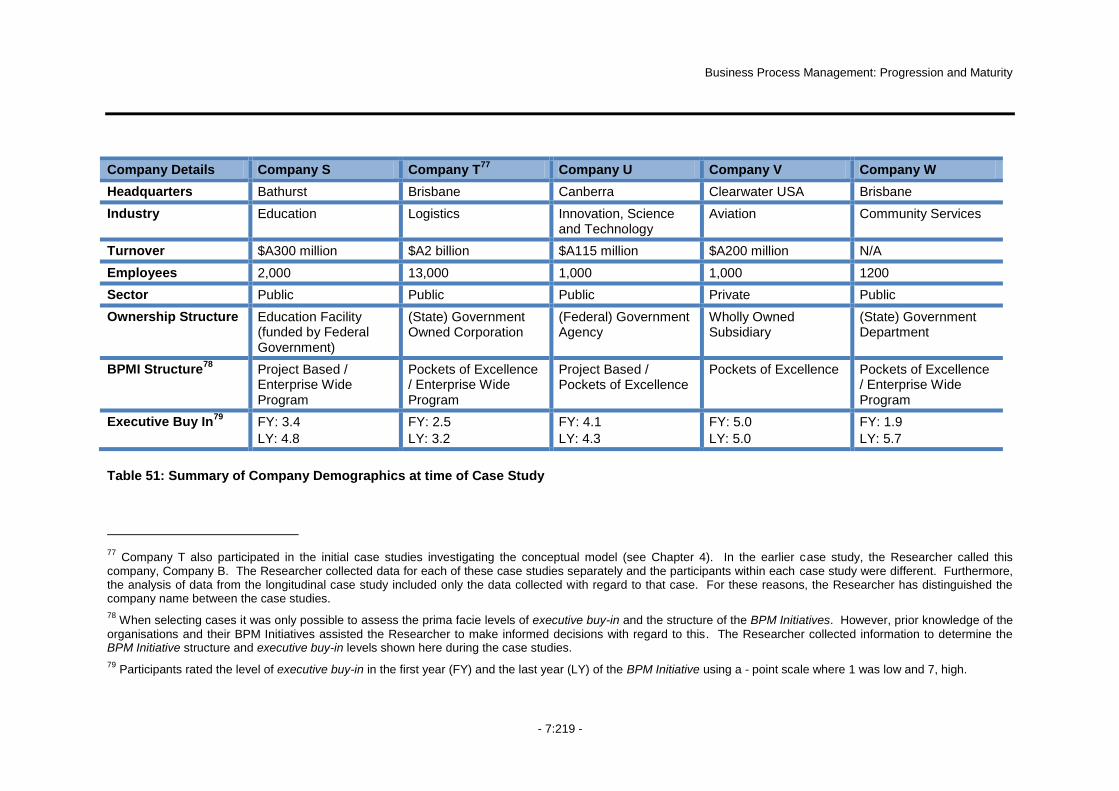
Business Process Management: Progression and Maturity
- 7:219 -
Company Details Company S Company T77
Company U Company V Company W
Headquarters Bathurst Brisbane Canberra Clearwater USA Brisbane
Industry Education Logistics Innovation, Science and Technology
Aviation Community Services
Turnover $A300 million $A2 billion $A115 million $A200 million N/A
Employees 2,000 13,000 1,000 1,000 1200
Sector Public Public Public Private Public
Ownership Structure Education Facility (funded by Federal Government)
(State) Government Owned Corporation
(Federal) Government Agency
Wholly Owned Subsidiary
(State) Government Department
BPMI Structure78
Project Based / Enterprise Wide Program
Pockets of Excellence / Enterprise Wide Program
Project Based / Pockets of Excellence
Pockets of Excellence Pockets of Excellence / Enterprise Wide Program
Executive Buy In79
FY: 3.4
LY: 4.8
FY: 2.5
LY: 3.2
FY: 4.1
LY: 4.3
FY: 5.0
LY: 5.0
FY: 1.9
LY: 5.7
Table 51: Summary of Company Demographics at time of Case Study
77
Company T also participated in the initial case studies investigating the conceptual model (see Chapter 4). In the earlier case study, the Researcher called this company, Company B. The Researcher collected data for each of these case studies separately and the participants within each case study were different. Furthermore, the analysis of data from the longitudinal case study included only the data collected with regard to that case. For these reasons, the Researcher has distinguished the company name between the case studies.
78 When selecting cases it was only possible to assess the prima facie levels of executive buy-in and the structure of the BPM Initiatives. However, prior knowledge of the
organisations and their BPM Initiatives assisted the Researcher to make informed decisions with regard to this. The Researcher collected information to determine the BPM Initiative structure and executive buy-in levels shown here during the case studies.
79 Participants rated the level of executive buy-in in the first year (FY) and the last year (LY) of the BPM Initiative using a - point scale where 1 was low and 7, high.
Chapter 7 – Longitudinal Case Studies
- 7:220 -
7.3 Data Collection Instruments
The Researcher designed a number of complementary data collection
instruments including an Interview Guide, a BPM Evolution Survey and a
Workshop Guide. In addition, the Researcher reviewed relevant documentation
within each organisation. Consistent use of these instruments through all studies
improved the comparability of data, enabled triangulation between data sources
and improved the generalisability of findings.
7.3.1 Interview Guide
The purpose of the interview was to capture views on the BPM Journey within the
organisation, from a range of individuals within each company. The Researcher
designed an Interview Guide to direct the interviews and ensure a level of
consistency in interviews within and across companies.
The Researcher used a semi-structured approach to the interviews, identifying
the key areas of discussion but enabling each participant to determine the
approach taken when responding. Some participants chose to describe the BPM
Journey using a chronological approach. Others chose to follow the order of the
key areas as reflected on the Interview Guide, addressing the key points in turn
and describing how they had changed over time. The Researcher interjected
with questions throughout the interview. A copy of the Interview Guide is in:
Appendix 13.4.3 – Interview Guide.
7.3.2 BPM Evolution Survey
The Researcher used an embedded survey, referred to as the BPM Evolution
Survey, to supplement and quantify the qualitative data gathered during the
interviews and workshop. This survey aimed to enable (1) the assessment of a
change emphasis on capability areas within each organisation over time and (2)
the subsequent comparison of a change in emphasis across the organisations.
Additional aims of the survey were to measure the levels of Executive Buy-In and
to capture details of the BPM Initiative.
Business Process Management: Progression and Maturity
- 7:221 -
There were two versions of the survey, one for the participants and one for the
Key Contact. The only difference between the two versions was that the Key
Contact version contained an additional section requesting company
demographics. The remainder of the survey was consistent between the two
versions, including five sections. A copy of the BPM Evolution Survey is in:
Appendix 13.4.4 – BPM Evolution Survey.
Section 1 provided participants with a summary of the study, a reiteration of the
ethics requirements, and a number of key definitions used in the survey. In doing
this, all participants had a consistent view of what the terms BPM, BPM Initiative
and end-to-end process meant, prior to completing the survey.
Section 2 captured the demographics of the participant, including the individual‟s
experience with the BPM Initiative and length of service with the company. This
provided support for the suitability of individuals for participating in the survey.
Section 3 asked participants about the BPM Initiative, including the structure,
key objectives and their perception of the success and maturity of the initiative.
This enabled the Researcher to improve the quality of data by:
Checking the consistency of data between participants within a
company (e.g. that they all had the same „start date‟ for the initiative)
Allowing for more complete collection of historic data as one participant
may recall an event or item that another failed to recollect
Enabling comparison of data between companies (e.g. what structures
of BPM Initiative existed within each company).
Section 4 captured the level of emphasis placed on the capability areas at two
points in time being the first year and the last year of the BPM Initiative80. To
ensure consistency in which year participants viewed as the first year, a question
regarding the start date of the BPM Initiative was also included in Section 3 of the
survey. When a participant did not have knowledge of the first year of the BPM
80
The last year was not to imply that the BPM Initiative was no longer current but referred to the
most recent year of the BPM Initiative.

Chapter 7 – Longitudinal Case Studies
- 7:222 -
Initiative either, because they were not involved with it or because they did not
work for the company at the time, they responded to only the last year questions.
The questions in Section 4 related to the 30 capability areas of the extended
conceptual model (i.e. the so-called BPM Capability Framework). Using the
experience and data gathered in the Delphi studies and a further literature
review, the Researcher derived a single question for each capability area, to
encompass its meaning and intent. A 7-point scale provided a rating mechanism,
with 1 – Little or No Emphasis through to 7 – Strong Emphasis. The Researcher
included A Don‟t Know option to discourage participants from providing ratings
where they were uncomfortable in doing so. Where a participant selected the
Don‟t Know option, the Researcher questioned whether this was because they
did not understand the question or because they did not feel they could provide a
valid response. In all cases, participants selected this option because they did
not feel they could provide a valid response.
Section 5 measured the levels of Executive Buy-In and Organisational Support
for BPM. The Researcher derived questions in this section from literature in
related fields including studies to assess employee empowerment, top
management support and key aspects of BPM. As with Section 4 of the survey,
the Researcher used the Don‟t Know option and a 7-point scale. In this section
however the options for the scale were, 1 – Strongly Disagree through to 7 –
Strongly Agree. Again, upon questioning, participants only used the Don‟t Know
option when they felt they could not provide a valid response to the question.
7.3.3 Workshop Agenda
The workshop occurred after the Researcher had conducted all interviews for the
company and had undertaken a first analysis of the interview and survey data.
Consequently, the purpose of the workshop was twofold. On the one hand, the
workshop served as an opportunity to present the early stage, data analysis for
review and comment. On the other hand, the workshop provided an avenue to
collect additional information about the practices and issues within the capability
areas in a group setting. The Researcher used a Workshop Agenda to guide the
conduct the workshop a copy of which is in:

Business Process Management: Progression and Maturity
- 7:223 -
Appendix 13.4.5 – Workshop Agenda.
In line with its dual purpose, the workshop format had two major components. In
the first part of the workshop, the Researcher presented the preliminary analysis
of the interview and survey data. Consequently, this section of the workshop
followed a similar format to the Interview Guide, covering the same key areas.
The remainder of the workshop was dedicated to the identification and discussion
of key practices that the company used within each of the capability areas. This
component was broken into six segments – one for each of the factors.
7.3.4 Document Review
To supplement the data collected during the interviews, workshop and surveys a
review of relevant documentation occurred where possible81. The specific
documents varied between organisations but, in general, this included reviewing:
The BPM component of corporate intranet sites and/or portals
Corporate documents such as business cases and proposals for the
BPM Initiative, organisation charts reflecting the BPM positions and
structure
Corporate presentations conducted both internally and externally that
articulate the progression of BPM or some aspect of it
Project specific documentation to support progress.
7.4 Data Collection
A consistent approach to data collection across the organisations improves the
ability of the Researcher to compare results between them. Similarly, within each
case, collecting data from appropriate individuals is important as it improves the
validity of data captured. Consequently, this section details the approach to data
collection and the selection and invitation of participants.
81
The documentation reviewed is subject to confidentiality agreements and some documentation was only available to the Researcher to view whilst on Company premises. Consequently, this thesis does not include reproduction of any of the reviewed documentation.

Chapter 7 – Longitudinal Case Studies
- 7:224 -
7.4.1 Scheduling and Timing of Case Studies
The duration and timing of the case studies varied dependent on the location of
the case organisation and the availability of participants. Two of the cases
(Company S and Company U) were located interstate, requiring the Researcher
to travel to reach them. In these cases, the Researcher and the Key Contact
worked to schedule data collection and the first round of data analysis over the
course of a week to minimise the associated travel and accommodation costs.
The remaining companies were local to the Researcher, having offices in
Brisbane. The Researcher scheduled the data collection with participants from
these companies primarily to fit the availability of participants. Table 52 shows
the periods over which the case studies occurred.
Company Case Conducted
S November 2007 – January 2008
T August 2007 – December 2007
U May 2007 – August 2007
V December 2007 – February 2008
W February – June 2008
Table 52: Conduct of Longitudinal Cases
7.4.2 Selecting and Inviting Participants
Following agreement from the companies with regard to participation, the
Researcher met with the Key Contact to arrange the conduct of the study. In all
cases, the Key Contact held a critical BPM role in the company. Furthermore, a
number of the Key Contacts had been with the company for an extended time
and thus had a solid knowledge of the history of the company, its people and its
BPM Journey. The Researcher worked with the Key Contact from each company
to identify the most appropriate people to invite to participate in the study.
To gather a range of views, the aim was to have between six and eight
participants from each organisation. In doing so, the reliance on any one
participant for the historical view of the BPM Initiative was minimised, with the
multiple views acting to provide a more complete and comprehensive view of the
Business Process Management: Progression and Maturity
- 7:225 -
BPM Journey. It was preferable for participants to contribute to all data collection
sessions including interviews, workshops and completion of the survey, however,
the Researcher recognised that this was not always possible due to the work
commitments of some participants82.
A principal aim was for participants to have a high degree of knowledge and/or
involvement in the BPM Initiative. Furthermore, a cross-section of employee
levels (i.e. executives, management and other key staff) was preferable in order
to limit potential bias in responses. Due to the purpose of the studies however,
this was secondary to the individual being knowledgeable about the BPM
Initiative. Similarly, due to the different interpretations of BPM and the potential
for both management interpretations to exist within an organisation, consideration
of which area of the business the participants were from was also important.
Again, a mix of views would act to minimise potential bias from either area, but
limited knowledge of the BPM Initiative would not provide the insights required for
this stage of the research. Consequently, this requirement was also secondary
to the level of knowledge the individuals had of the BPM Initiative.
Following the identification of potential participants, the Key Contact invited
individuals to participate, and provided them with an outline of what participation
would entail. Usually, this meant that the Information Sheet was, sent directly, or
content from the Information Sheet formed the basis of the communication
between the Key Contact and potential participants. Participants were able to
refuse the invitation without any recourse. Table 53 provides a summary of
participation for each of the five companies.
82
Chapter 8 provides further details regarding participation for each company.

Chapter 7 – Longitudinal Case Studies
- 7:226 -
Company Number of Participants
Experience of Participants in BPM Initiative83
Extensive Limited
S 7 7 -
T 5 4 1
U 7 6 1
V 7 3 4
W 9 8 2
Table 53: Summary of Participants for all Companies
7.4.3 Approach to Data Collection
The approach to data collection was consistent across all case studies. The
majority of interviews occurred at the premises of each company. A small
number (5 from 32) however, occurred via telephone due to the location and/or
availability of key individuals84. The remaining interviews occurred, either in the
office of the participant, or in a designated interview room arranged by the Key
Contact. All workshops occurred at the premises of the company, in a room
coordinated by the Key Contact.
The Researcher received agreement for recording interviews and workshops
from all companies. The Researcher also sought individual consent from all
participants prior to recording sessions. One participant from Company U did not
consent to having the interview recorded. Consequently, the Researcher did not
record the workshop for Company U either, as the participant was also present.
The Researcher recorded all other interviews and workshops.
Following the interviews and surveys, the Researcher did a preliminary analysis
of the data, prior to conducting the workshops. In doing this, the workshops
acted to validate the Researcher‟s interpretation of the interview data.
83
Chapter 8 provides further details regarding participant demographics.
84 The location of one participant from Company V was the United Kingdom and a key participant
from Company U (located interstate) had resigned and was leaving the company prior to the commencement of the scheduled case study and thus was unable to participate in the interview at the scheduled time of the study and did not participate in the workshop.

Business Process Management: Progression and Maturity
- 7:227 -
Furthermore, the consolidation and representation of data at this point enabled
the workshops to become an opportunity to contribute further data in the event
that key facts were missing. This ensured a more comprehensive and complete
set of data (Pettigrew 1990). An example of the key activities extracted from
interview data and presented in the workshop is in:
Appendix 13.4.6 – Mapping Activities to Factors: Company S & U.
A further purpose of the workshops was to identify key practices and issues for
each of the capability areas enabling triangulation with the quantitative data
gathered during the survey and other qualitative data gathered during the
interviews. The Researcher provided participants with a document that
contained the definitions of the capability areas for each factor. Using this
document as a guide, participants identified the company‟s major practices,
activities or issues in each of the areas. In this section of the workshop, the
Researcher captured data directly to a laptop that projected onto a screen within
the workshop room. In this way, participants were able to immediately read what
the Researcher was recording, providing validation at the point of data capture.
By audio recording the workshops, the Researcher was able to revisit any
corresponding discussions at a later stage. A copy of the definitions document
provided to participants and an example of key practices collected during the
workshops is in:
Appendix 13.4.7 – BPM Capability Area Overview
Appendix 13.4.8 – BPM Capability Areas: Key Practices (Sample).
Following the collection of data, the Researcher undertook a period of data
analysis. The Researcher collated the data collected from the survey in MS-
Excel spreadsheets. This enabled subsequent calculation of descriptive statistics
including averages and standard deviation in responses, the calculation of
change between the two data points and the graphical depiction of this data for
subsequent comparison85. The Researcher transcribed the qualitative data
collected during the interviews and workshops and subsequently analysed these
85
The next section provides details on the method of calculating change that the Researcher adopts in this study.

Chapter 7 – Longitudinal Case Studies
- 7:228 -
transcriptions for themes and concepts86. Following the completion of data
analysis, the Researcher prepared a report for each case study organisation.
The report provided details of the conduct of the case study, together with a
consolidation and interpretation of the data collected throughout the study. The
company received the report in draft form, with a request to review and verify the
contents and interpretation of the data, prior to the Researcher issuing the final
report. An example of the content from a BPM Case Study Report is in:
Appendix 13.4.9 – BPM Case Study Report
7.5 Measuring Change in the Capability areas
The basis of the longitudinal studies was to collect data at more than one point in
time to enable the calculation of change between points. In this case, the
Researcher collected data (on one occasion) for two defined time points – the
first year and the last year of each organisation‟s BPM Initiative.
Within extant literature, there is debate over the measurement of change with
some suggesting that it should not occur at all. Cronbach and Furby (1970, 68)
infer four instances where extant studies have historically calculated gains.
These include:
(1) Providing a dependent variable for a study
(2) Measuring growth or learning rate that is to be predicted (e.g. what kinds
of persons grow (learn) fastest)
(3) Identifying individuals for study or special treatment
(4) Operationalising constructs thought to be significant in a theoretical
network.
86
Chapters 8 and 9 present the outcomes of this data analysis including the use of rich text descriptions, tabulated data, graphical representation and descriptive data.

Business Process Management: Progression and Maturity
- 7:229 -
As proponents of not using change measurement, Cronbach and Furby (1970,
68) suggested that87:
“…raw change or raw gain scores formed by subtracting pre test
scores from post test scores lead to fallacious conclusions, primarily
because such scores are systematically related to any random error
of measurement...”
Advocates of measuring change challenge the shortcomings perceived by
detractors88. In particular, Gottman and Rushe (1993) articulated a number of
fallacies about measuring change, based on Rogosa (1988) including:
1) Regression toward the mean is an unavoidable law of nature
2) The difference score between pre and post measurement is unreliable
3) Analysis of covariance is the way to analyse change
4) Correlation between change and initial level is always negative.
According to Bergh and Fairbank (2002), there are a number of ways in which to
measure change. The most common of which is the simple difference approach
that computes the difference between separate instances of the same variable89.
Other measures include residual scores, component scores and growth curves
(Bergh & Fairbank, 2002; Linn & Slinde, 1977). Table 54 (reproduced from
Bergh & Fairbank, 2002, 362) reflects the use, strengths and limitations of these
methods. The highlighted section of Table 54 indicates the method applied to
this study.
87
Other proponents of not using change measurement as it has been used in the past, or limiting or modifying its use include Edwards (1994), Johns (1981), Linn and Slinde (1977) and Lord (1963).
88 Other proponents of using change measurement include Allison (1990), Rogosa and Willett
(1993), and Zimmerman (1994).
89 Bergh and Fairbank (2002, 360) show this as “Cx = X1 – X2, whereby Cx is called a „change
score‟ and variable X is measured at time period 1 (X1) and time period 2 (X2)”.

Chapter 7 – Longitudinal Case Studies
- 7:230 -
Method When Used Strengths Limitations
Simple difference
High reliability, low correlations.
Intuitive, conceptually simple.
Vulnerability to errors.
Residuals Predicted change is focus rather than actual change.
Partials correlation between C and X1.
Not measuring actual change.
True change Conceptual change is in simple difference and C and X1 are correlated highly.
Partials correlation, conceptually intuitive.
Requires high reliabilities and large n.
Components Testing components, not a change in score.
Overcomes problems of simple difference approach.
May not align with some conceptual logics.
Growth curves
Mapping Change. Form and type of change.
Not applicable to two-wave data.
Table 54: Alternative Methods of Measuring and Testing Change
Thus, whilst not addressing all possible arguments against measuring change,
when combined with the purpose of the measurement (i.e. to investigate the role
of temporal and contextual issues on BPM Progression), taking a simple
difference approach to measuring change is deemed appropriate for this study.
Consistent with the work of Bergh (1995), in this study the Researcher used the
formula (meanyear 2 – meanyear 1) / meanyear 1 to calculate change in emphasis in
capability areas. Calculation of change was between the two data points being
the first and the last year of the BPM Initiative. This formula allowed the
calculation of the relative change in emphasis, enabling comparison of change
between the companies.
7.6 Chapter Summary
This chapter included details of the design of a series of longitudinal case studies
undertaken to refine and confirm the emerging theory of BPM Progression. The
case studies were longitudinal in order to study the BPM Journey over time,
allowing comparison of the emphasis an organisation placed on capability areas
during the first and last years of the BPM Initiative. The inclusion of multiple
organisations aimed to increase the generalisability of key findings.

Business Process Management: Progression and Maturity
- 7:231 -
The Researcher designed a number of data collection instruments for use in the
longitudinal studies. Interview Guides provided the Researcher with a consistent
means of interviewing key personnel across the organisations to elicit a
chronological view of the BPM Journeys. The aim of the BPM Evolution Survey
was to quantify the level of emphasis the organisation placed on the individual
capability areas at two points in time (i.e. the first year and the last year of the
BPM Initiative). The Workshop Guide on the other hand was to assist the
Researcher in presenting first analysis on the interview and survey data and
collecting further data regarding the BPM practices in the organisations.
Analysis of the interview and survey data prior to conducting the workshops
provided the Researcher with an opportunity to validate and refine the findings
arising from the data. During the workshop, in addition to providing feedback and
clarification on early data analysis, participants identified the major practices,
activities and issues the company had within each capability area. This provided
support for the quantitative data captured through the BPM Evolution Survey. In
analysing the change in emphasis between the first and last years of the BPM
Initiatives, the Researcher elected to use a simple difference approach.
Whilst this chapter has provided details on the design of the longitudinal studies,
the following chapters detail their conduct and outcomes as follows:
Chapter 8 provides a summary of each case, including within case analysis and
presentation of key findings from each case.
Chapter 9 presents an in-depth cross case analysis investigating the similarities
and differences between the five cases.
Chapter 10 consolidates key findings, integrating them with earlier research and
extant literature. From this, the Researcher proposes theory on BPM
Progression and a conceptual model for measuring BPM Maturity. Furthermore,
from the experience and insights gained throughout this study, the Researcher
proposes a typology for classifying BPM Initiatives.

Business Process Management: Progression and Maturity
- 8:233 -
8 Within Case Analysis
he preceding chapter detailed of the design of the longitudinal case
studies undertaken to refine the emerging theory on BPM Progression.
Five companies participated in the longitudinal studies. The aim of this
chapter is to present the details of each case, including the progression of their
BPM Initiatives and the key insights arising from each study in turn. In the
subsequent chapter, cross-case analysis will investigate similarities and
differences between the companies.
8.1 Chapter Overview
To provide a level of consistency in the presentation of the five cases, the
Researcher has chosen to present details for each case using a similar structure.
To this end, each company is in a separate section (see Sections 8.2 – 8.6) and
each section follows a similar structure being:
8.n.1 – Participants in Study
8.n.2 – Demographics of the BPM Initiative
8.n.3 – First Year of the BPM Initiative
8.n.4 – Changes from First to Last Year
8.n.5 – Discussion on Progression of the BPM Initiative
8.n.6 – Company Summary.
Section 7 provides a summary of the chapter.
8.2 Case 1 – Company S
Company S was a large educational institution with campuses in various
Australian cities and towns as shown in Figure 33. Company S also had an
T

Chapter 8 – Within Case Analysis
- 8:234 -
international campus in Ontario, Canada. In 2006, Company S had almost
35,000 students, of which approximately 20,000 studied via distance education
and 9,000 attended the main campus. The remaining 6,000 students attended
regional campuses. Approximately 5% of graduands over the past 10 years were
international students.
Figure 33: Geographical Dispersion of Company S
As an Australian educational facility, Company S received a level of funding from
the Federal Government. Due to changes to the funding model, greater
competition for students, and a growing number of external students, Company S
was looking for alternative ways of operating to improve its sustainability over the
next ten years. Table 55 summarises the demographics of Company S.
Company S Details
Headquarters Bathurst
Industry Education
Turnover $300 million
Employees 3000
Sector Public
Ownership Structure Government Funded
Table 55: Company S – Company Demographics

Business Process Management: Progression and Maturity
- 8:235 -
8.2.1 Participants in Study
The case study with Company S occurred from November 2007 to February
2008. The Key Contact from Company S (i.e. the Program Manager) invited
participants to the study based on knowledge of the individuals and their
involvement and understanding of the BPM Initiative. Table 56 shows details of
the seven participants from Company S.
Participants Position Position Level
90
Years of Service
Involvement with BPMI
Participant 1 Director – Organisational Development
S,T,O 13 Current, since beginning
Participant 2 Executive Director - ICT S 25 Current, strong knowledge of history
Participant 3 Deputy Vice Chancellor (Administration)
S 26 Current, strong knowledge of history
Participant 4 Manager – Culture and Change
S 5 Current, strong knowledge of history
Participant 591
Program Manager – Workplace Productivity Program
S 5 Current, since beginning
Participant 6 Director – Service Alignment
S 7 Current, strong knowledge of history
Participant 7 Deputy Vice Chancellor (Academic)
92
S 25 Current, strong knowledge of history
Table 56: Company S – Participant Details
All seven participants held strategic positions within Company S. One participant
had additional tactical and operational roles. All seven participants had a strong
knowledge of the BPM Initiative, with two participants being involved in the BPM
Initiative since it began.
90
S=Strategic, T=Tactical, O=Operational.
91 Participant 5 was the Key Contact for the case study with Company S.
92 The Deputy Vice Chancellor (Academic) participated in a one-on-one interview but did not
complete the survey or participate in the workshop.
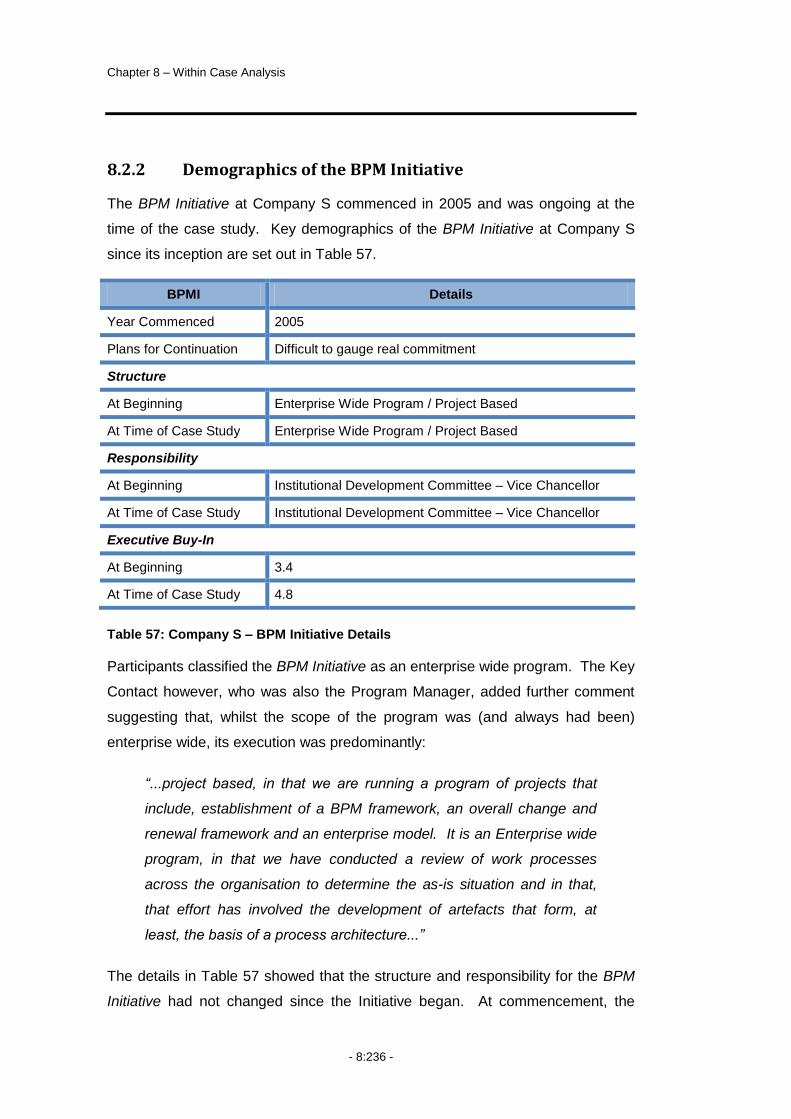
Chapter 8 – Within Case Analysis
- 8:236 -
8.2.2 Demographics of the BPM Initiative
The BPM Initiative at Company S commenced in 2005 and was ongoing at the
time of the case study. Key demographics of the BPM Initiative at Company S
since its inception are set out in Table 57.
BPMI Details
Year Commenced 2005
Plans for Continuation Difficult to gauge real commitment
Structure
At Beginning Enterprise Wide Program / Project Based
At Time of Case Study Enterprise Wide Program / Project Based
Responsibility
At Beginning Institutional Development Committee – Vice Chancellor
At Time of Case Study Institutional Development Committee – Vice Chancellor
Executive Buy-In
At Beginning 3.4
At Time of Case Study 4.8
Table 57: Company S – BPM Initiative Details
Participants classified the BPM Initiative as an enterprise wide program. The Key
Contact however, who was also the Program Manager, added further comment
suggesting that, whilst the scope of the program was (and always had been)
enterprise wide, its execution was predominantly:
“...project based, in that we are running a program of projects that
include, establishment of a BPM framework, an overall change and
renewal framework and an enterprise model. It is an Enterprise wide
program, in that we have conducted a review of work processes
across the organisation to determine the as-is situation and in that,
that effort has involved the development of artefacts that form, at
least, the basis of a process architecture...”
The details in Table 57 showed that the structure and responsibility for the BPM
Initiative had not changed since the Initiative began. At commencement, the

Business Process Management: Progression and Maturity
- 8:237 -
BPM Initiative had a medium level of Executive Buy-In, rating 3.4 on a 7-point
scale. Over time, this increased to a rating of 4.8.
During interviews, participants indicated the strategic support for the Initiative
stating:
“...there was a strategic imperative identified by the university...”
This indicated that, independent of the level of Executive Buy-In, there was an
overriding mandate for the BPM Initiative within Company S.
The BPM Initiative commenced for Company S with a project called the Work
Process Improvement (WPI) project. Company S had received external funding
from the Australian Federal Government for this project following the successful
submission of a grant application. Due to the success of the WPI project, the
WPI team applied for additional funding to continue and expand process work
within Company S. Subsequent approval of the second funding application saw
the commencement of the Workplace Productivity Program (WPP). This WPP
enabled the continuation and expansion of the WPI program.
8.2.3 First Year of the BPM Initiative
At the commencement of the BPM Initiative, the goals and objectives of the WPI
were the improvement of work processes, specifically:
“…Intra Faculty, Division or otherwise constituted functions of Company
S, i.e., where the contributors to and key stakeholders of a process lie
within that organisation.
At the level of interactions among Faculties, Divisions and otherwise
constituted groups, where processes cross-organisational boundaries.
At Company S Level, where processes are directly controlled at the
executive level...”
The emphasis Company S placed on capability areas during the first year of the
BPM Initiative is below in Figure 34.
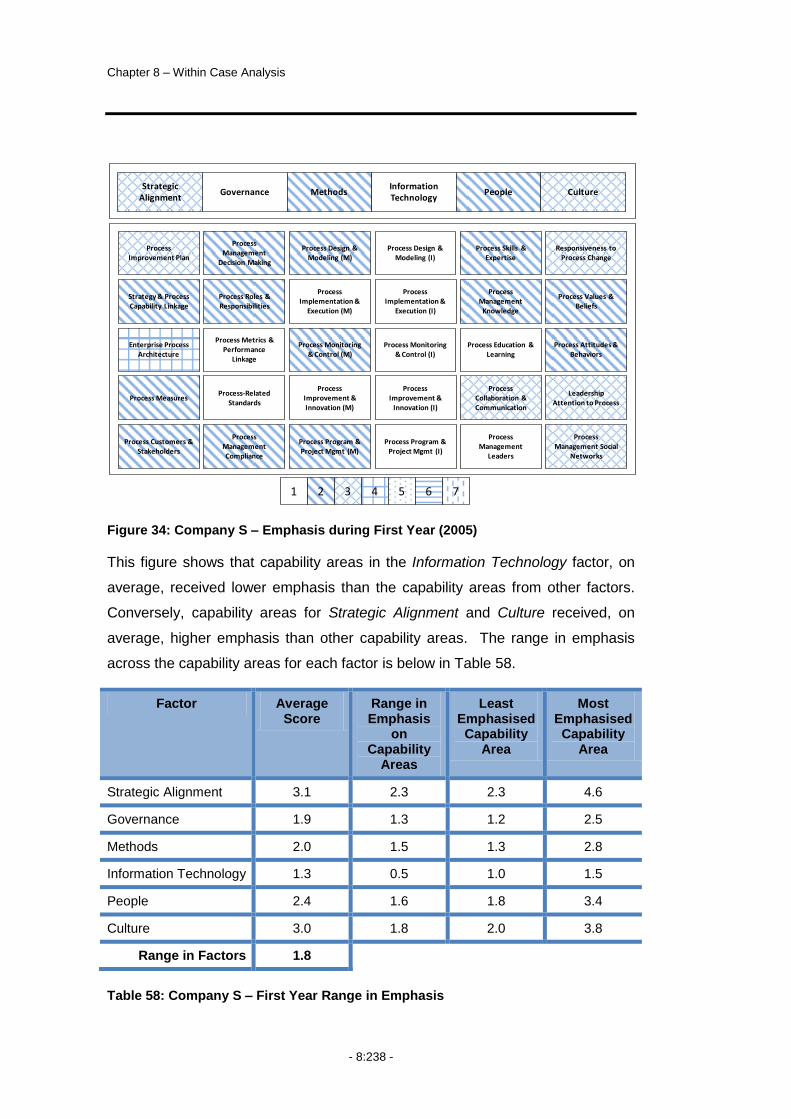
Chapter 8 – Within Case Analysis
- 8:238 -
Figure 34: Company S – Emphasis during First Year (2005)
This figure shows that capability areas in the Information Technology factor, on
average, received lower emphasis than the capability areas from other factors.
Conversely, capability areas for Strategic Alignment and Culture received, on
average, higher emphasis than other capability areas. The range in emphasis
across the capability areas for each factor is below in Table 58.
Factor Average Score
Range in Emphasis
on Capability
Areas
Least Emphasised Capability
Area
Most Emphasised Capability
Area
Strategic Alignment 3.1 2.3 2.3 4.6
Governance 1.9 1.3 1.2 2.5
Methods 2.0 1.5 1.3 2.8
Information Technology 1.3 0.5 1.0 1.5
People 2.4 1.6 1.8 3.4
Culture 3.0 1.8 2.0 3.8
Range in Factors 1.8
Table 58: Company S – First Year Range in Emphasis
Governance MethodsStrategic
AlignmentInformation Technology
People Culture
Process-Related Standards
Process Metrics & Performance
Linkage
Process Roles & Responsibilities
Process Management
Decision Making
Process Measures
Enterprise Process Architecture
Strategy & Process Capability Linkage
Process Improvement Plan
Process Customers & Stakeholders
Process Monitoring & Control (M)
Process Implementation &
Execution (M)
Process Design & Modeling (M)
Process Monitoring & Control (I)
Process Implementation &
Execution (I)
Process Design & Modeling (I)
Process Education & Learning
Process Management
Knowledge
Process Skills & Expertise
Process Attitudes & Behaviors
Process Values & Beliefs
Responsiveness to Process Change
Process Program & Project Mgmt (M)
Process Improvement & Innovation (M)
Process Program & Project Mgmt (I)
Process Improvement &
Innovation (I)
Process Management
Leaders
Process Collaboration & Communication
Leadership Attention to Process
Process Management Social
Networks
Process Management Compliance
1 2 3 4 5 6 7

Business Process Management: Progression and Maturity
- 8:239 -
The data in Figure 34 and Table 58 shows that although Strategic Alignment and
Culture had a similar average emphasis, the range in emphasis across the
capability areas was higher for Strategic Alignment areas. Furthermore, the
Strategic Alignment capability area of Enterprise Process Architecture received
the highest emphasis of all capability areas in the first year. The interview data
provided additional insights into the higher emphasis on these two areas during
the first year.
With regard to increasing the strategic focus of process, participants stated:
“...the relatively new Director of Facilities Management had come
from an outside environment and wanted to bring a more strategic
focus to process management...”
“...it was linked very heavily to the university strategy and in terms of
processes...”
Another participant alluded to an emphasis on developing an overarching
process architecture or framework early in the project with the comment:
“...we‟d never reviewed processes before (...) things were being
duplicated in the existing processes and we needed a way to actually
see if we could eliminate that duplication...”
According to one participant, the arrival of a new Vice Chancellor wanting to
promote a one-University culture provided momentum and a link between
strategy and culture, stating:
“...particularly with the arrival of the new Vice Chancellor and his
considerable emphasis on one-university as a really important part of
our mode of operating, that‟s given a lot of momentum to this. That
whole notion of one-university was really crucial within the current
strategy...”
The emphasis on organisational development and cultural aspects was evident in
participant comments including:
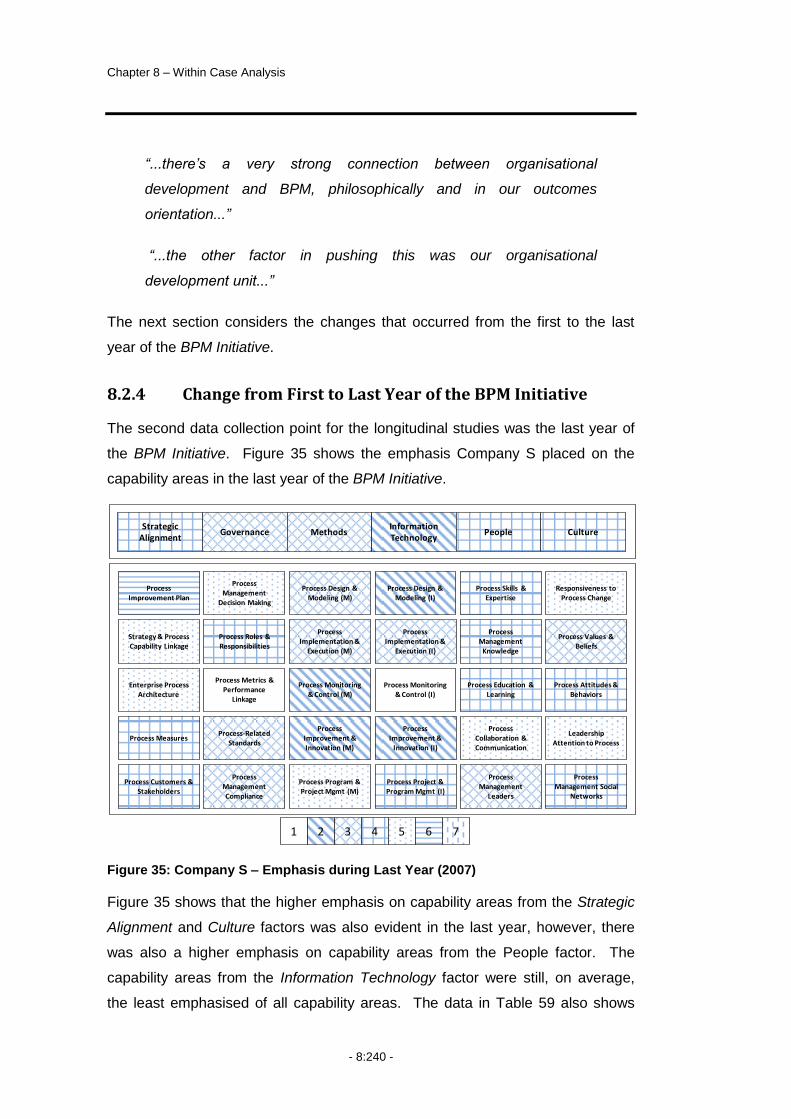
Chapter 8 – Within Case Analysis
- 8:240 -
“...there‟s a very strong connection between organisational
development and BPM, philosophically and in our outcomes
orientation...”
“...the other factor in pushing this was our organisational
development unit...”
The next section considers the changes that occurred from the first to the last
year of the BPM Initiative.
8.2.4 Change from First to Last Year of the BPM Initiative
The second data collection point for the longitudinal studies was the last year of
the BPM Initiative. Figure 35 shows the emphasis Company S placed on the
capability areas in the last year of the BPM Initiative.
Figure 35: Company S – Emphasis during Last Year (2007)
Figure 35 shows that the higher emphasis on capability areas from the Strategic
Alignment and Culture factors was also evident in the last year, however, there
was also a higher emphasis on capability areas from the People factor. The
capability areas from the Information Technology factor were still, on average,
the least emphasised of all capability areas. The data in Table 59 also shows
Governance MethodsStrategic
AlignmentInformation Technology
People Culture
Process-Related Standards
Process Metrics & Performance
Linkage
Process Roles & Responsibilities
Process Management
Decision Making
Process Measures
Enterprise Process Architecture
Strategy & Process Capability Linkage
Process Improvement Plan
Process Customers & Stakeholders
Process Monitoring & Control (M)
Process Implementation &
Execution (M)
Process Design & Modeling (M)
Process Monitoring & Control (I)
Process Implementation &
Execution (I)
Process Design & Modeling (I)
Process Education & Learning
Process Management
Knowledge
Process Skills & Expertise
Process Attitudes & Behaviors
Process Values & Beliefs
Responsiveness to Process Change
Process Program & Project Mgmt (M)
Process Improvement & Innovation (M)
Process Project & Program Mgmt (I)
Process Improvement &
Innovation (I)
Process Management
Leaders
Process Collaboration & Communication
Leadership Attention to Process
Process Management Social
Networks
Process Management Compliance
1 2 3 4 5 6 7

Business Process Management: Progression and Maturity
- 8:241 -
that the highest range in emphasis was in the capability areas of Governance
and Information Technology.
Factor Average Score
Range in Emphasis
on Capability
Areas
Least Emphasised Capability
Area
Most Emphasised Capability
Area
Strategic Alignment 4.3 1.7 4.3 6.0
Governance 3.0 3.3 1.7 5.0
Methods 3.5 2.5 2.5 5.0
Information Technology 2.5 3.2 1.0 4.2
People 4.4 1.9 3.3 5.2
Culture 4.8 1.7 3.8 5.5
Range in Factors 2.3
Table 59: Company S – Last Year Range in Emphasis
The continuing higher emphasis on Strategic Alignment was evident in comments
from participants including:
“...the whole idea of process aligned to overall strategy within the
university has really gained momentum in the last couple of years
and it‟s really been consolidated now...”
Similarly, comments from participants reflected the increase in emphasis placed
on People capability areas:
“...there was an underlying challenge of how do we get the overall
university buy in for this? How do we bring people along and get
them to appreciate it...”
“...there‟s a deep, quite a deep psychological impediment to people
working on collaboration organisation wide projects...”
Comments from participants also reflected the need to increase emphasis placed
on Culture capability areas over the course of the BPM Initiative:

Chapter 8 – Within Case Analysis
- 8:242 -
“...every time we tell people they need to change we encounter
resistance because it‟s painful for them...”
“...there was this big gorge between the people who were trying to do
the advocating for business process management and the people
who were really our main client base...”
“...the inhibitors were more on the organisational development side of
things (...) like what has been people‟s inherent training and
understanding and knowledge base...”
The effect of this increase in emphasis was evident in comments including:
“...more and more there‟s a great deal of support (…) originally we
had to struggle to get people to accept the notion of WPI...”
“...the Organisational Development unit was very important with that
in terms of communicating it and building a common shared
understanding...”
Change in Emphasis
Figure 36 shows the change in emphasis from the first year to the last year.
Figure 36: Company S – Change in Emphasis on Capability Areas
The change in Figure 36 shows that the areas reflecting the greatest increase in
emphasis were IT – Project and Program Management and Governance –
Process Management Decision Making. The impetus for increasing attention on
0.000.250.500.751.001.251.501.752.00
PIP
S&P
L
EPA
PM
PC
&S
PM
DM
PR
&R
PM
&P
L
PR
S
PM
C
PD
&M
PE&
I
PM
&C
PI&
I
PM
gt
PD
&M
-IT
PI&
E -
IT
PM
&C
-IT
PI&
I -IT
PM
gt -
IT
PS&
E
PM
K
PE&
L
PC
&C
PM
L
RTP
C
PV
&B
PA
&B
LATP
PM
SN
Strategic Alignment Governance Methods
Information Technology People Culture
Company S Change

Business Process Management: Progression and Maturity
- 8:243 -
building capability to support a systemic approach to managing projects was
evident in comments including:
“...things having been crystallised in the WPI project, stimulated by
the previous executive director DIT (…) had quite a role in drawing
attention to some of that sort of holistic project focussed work that
needed to be done...”
“...there was an emphasis from the senior management wanting to
get more effective management systems...”
“...there was a sense that we needed to have a more systematic
approach to these sort of major projects...”
These comments alluded to a need to increase the overall approach to the
management of process projects, including decision-making and the
management of information. The high emphasis given to capability areas of
Strategic Alignment – Process Improvement Planning, which received the highest
level of emphasis, and Methods – Process Project and Program Management
(see Figure 35) supported this view.
8.2.5 Discussion on Progression of the BPM Initiative
In discussing the progression of the BPM Initiative, participants made key points
regarding:
Matching progression strategies to organisational context
Negative affect of contextual variables
Positive affect of contextual variables.
Further details are in the following sections.
Match Progression Strategies to Organisational Context
During the BPM Initiative, there were a number of influences on progression.
With regard to the actual progression of the BPM Initiative, one participant
indicated:
Chapter 8 – Within Case Analysis
- 8:244 -
“...some parts of the sequence have been very determined, but that
doesn‟t mean that they‟ve been sequential (...) it is very much more
like one step forward, two steps back, one step forward, two steps
back...”
This indicated that Company S recognised the need to accept that progression
was not always going to be in a forward direction. Furthermore, this statement
indicated that even with deliberate planning, there was an element of progression
that was reactive.
Another key insight from Company S was with regard to the adoption of best
practice. During an interview, a participant indicated:
“...an organisation needs to be very careful in assessing the
applicability of things (…) it doesn‟t matter whether it‟s the business
world or industry or management theory or whatever (...) it doesn‟t
mean that there aren‟t a lot of things that you can benefit from but
you‟ve got to put time into thinking how the things would actually
operate in a university setting...”
Another participant stated:
“...you need to understand the strengths and weakness of the thing
otherwise you do find yourself in the situation of trying to use it in
situations where it is not appropriate or not understanding that this
isn‟t the absolute solution to all life‟s problems...”
These statements showed the importance of adapting practices to the
organisational context. Such statements challenge, or at least qualify, the
application of best practice, with regard to progressing BPM Initiatives.
Negative Affect of Contextual Variables
Within Company S, participants highlighted the impact of two contextual variables
being the geographic dispersion of the company and the availability of suitable
resources. Participants stated that there was a relationship between the two
variables, indicating that:

Business Process Management: Progression and Maturity
- 8:245 -
“...the disparate nature of the organisation, its regional nature, has a
direct influence from a logistical perspective in terms of resources,
and we certainly had direct problems in resourcing the whole
project...”
With regard to the availability of suitability of staff resources, participants stated:
“...there‟s a much more pragmatic factor and that is the university
found it very hard to employ, on a permanent basis, people with some
of the expertise we needed to undertake these projects...”
“...the biggest constraint was staff resources (...) the demands on the
specialist staff in particular areas, who have the systems knowledge,
the technical skills and the organisational knowledge (...) that‟s a
major problem (...) so we‟re now trying to develop strategies for
addressing that in 2008...”
The impact of the lack of staff resources was also evident in a comment by one
participant who indicated:
“...we‟ve had to scale back or reprioritise work because we haven‟t
got enough people to do what was on the original list...”
This showed that the progression of the BPM Initiative could be constrained by
the contextual environment in which a company operates. In this case, the
regional dispersion of the company resulted in difficulty attracting appropriately
skilled resources, leading to a reduction in the progression.
Positive Affect of Contextual Variables
A number of aspects assisted the progression of the BPM Initiative including the
availability of funds and the dedication of leaders. With regard to the availability
of funds, participants made two points. One was that Company S was choosing
to undertake the BPM Initiative while they were in a solid financial situation. For
example, participants stated:

Chapter 8 – Within Case Analysis
- 8:246 -
“...the other obvious factor is the university is in a very healthy
financial position (...) achieving all these things when you‟re doing it
in order to dig yourself out of some sort of financial hole is completely
different from choosing to do it when you‟re in a strong financial
position...”
“...we are in a position of being able to be proactive because we were
making decisions from a position of relative strength, particularly
financial strength (...) we‟re not doing this because we‟re facing
bankruptcy or because we haven‟t been doing well, we‟re actually
building on the fact that we have done well...”
These comments showed that participants saw the timing of the BPM Initiative as
a positive aspect. The other funding aspect was in relation to the dedicated
funding available through the WPI and WPP projects, with a participant stating:
“...not many people get the level of support to do what we‟ve done.
To pack this much money into it is unbelievable...”
With respect to the commitment of the leaders of the program, participants made
a number of comments about both the specific leadership of the program and
immediate implementation team including:
“...it could‟ve been a challenge, if we didn‟t have a good facilitator or
someone to put this together, we wouldn‟t have been able to do it.
You need a good facilitator or a good person to collect it and
understand it...”
“...it had to have people in the middle, and they were about
leadership and management development, organisational and staff
performance, and continual professional development...”
“...just the way that we came together as a crew and that
synchronicity...”
At a more general level, it was about the executive support for the program,
included in statements such as:
Business Process Management: Progression and Maturity
- 8:247 -
“...the whole thing about senior management buy-in and then that
filtering down is critical...”
“...it was driven by the executive so it was going to happen...”
These statements show the necessity of both a general commitment from
executives to the Initiative as well as to the dedicated management of the
implementation.
8.2.6 Company S Summary
The BPM Initiative within Company S commenced in 2005 with an enterprise
wide scope, using a project-based approach to implementation. From 2005 to
2007, the structure of the BPM Initiative had not changed, although the emphasis
on capability areas had shifted, over this time.
In the first year of the BPM Initiative, a desire to create a one-University culture
and to align process and strategy reflected in an emphasis on Strategic
Alignment and Culture capability areas. Over time, the emphasis on Strategic
Alignment and Culture capability areas remained high and the emphasis on
developing People capability areas had increased, potentially in relation to a
recognised issue with attracting suitably skilled staff. Due to the cultural
impediments to process change that existed, Company S recognised that the
BPM Initiative shared a close relationship with the Organisational Development
area. Throughout the BPM Initiative, the emphasis on IT was consistently low.
The highest rating capability areas in the last year and the biggest movement in
capability areas over time, was in those areas affecting the management of
process projects and information. This was in response to senior management
wanting to improve the systemic management of process information and
projects.
Progression of the BPM Initiative was constrained at times by the geographic
dispersion of Company S and the availability of suitably skilled staff. The
availability of funding and the dedication and support of leadership was important
to the progression of the BPM Initiative.

Chapter 8 – Within Case Analysis
- 8:248 -
8.3 Case 2 – Company T
Company T was a large provider of transportation to both individuals and
businesses within Australia. Although predominantly Queensland based, with a
myriad of centres throughout regional Queensland, Company T had a presence
in all states of Australia. Company T was a Government Owned Corporation (i.e.
a GOC), being owned by the Queensland State Government but having a
commercial focus. In 2007, Company T had a turnover of over $2 billion dollars
and a workforce of more than 13,000 employees. The demographics of
Company T are set out in Table 60.
Company T Details
Headquarters Brisbane
Industry Transport
Turnover $A2 billion
Employees 13,000
Sector Public
Ownership Structure Government Owned Corporation
Table 60: Company T – Company Demographics
8.3.1 Participants in Study
The case study with Company T occurred over the period of August 2007 to
February 2008. The Key Contact from Company T invited participants for the
study based on knowledge of the individuals and their involvement and
understanding of the BPM Initiative. Table 61 shows the details of the five
participants from Company T.

Business Process Management: Progression and Maturity
- 8:249 -
Participants Position Position Level
93
Years of Service
Involvement with BPMI
Participant 194
Business Architect / Process Design Adviser
S/O 10 Current, since beginning
Participant 2 General Manager S 15 Current, limited knowledge of history
Participant 3 Business Process Analyst
O 9 Current, strong knowledge of history
Participant 4 Manager – Six Sigma
S/O 16 Current, strong knowledge of history
Participant 5 Risk & Compliance Coordinator
O 15 Current, strong knowledge of history
Table 61: Company T – Participant Details
Table 61 shows the five participants from Company T were from two levels of the
organisation, strategic and operational. All five participants were currently
involved in the BPM Initiative. Four of the five participants had a strong
knowledge of the history of the BPM Initiative and one had a limited knowledge of
its history. One of the participants had been involved with the BPM Initiative
since its inception in 2000.
8.3.2 Demographics of the BPM Initiative
Company T commenced its BPM Initiative in 2000. Table 62 shows the key
demographics of the BPM Initiative at Company T since its inception.
93
S=Strategic, T=Tactical, O=Operational.
94 Participant 1 was the Key Contact for the Case Study.
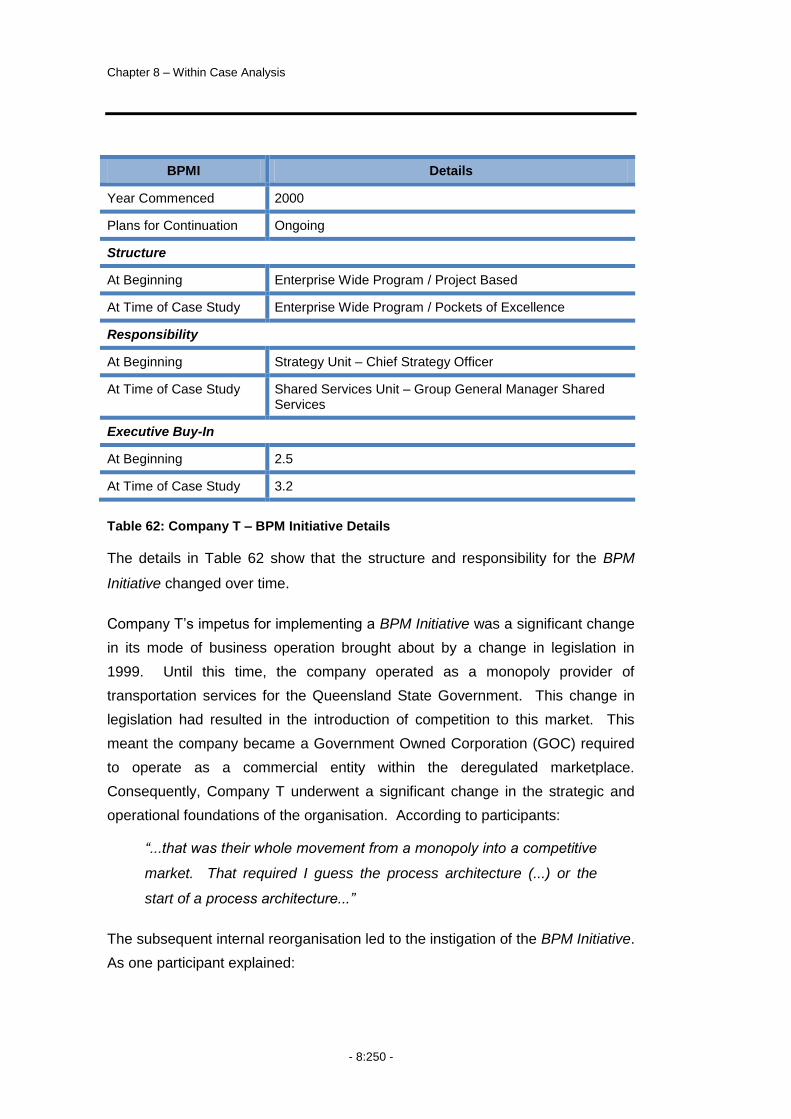
Chapter 8 – Within Case Analysis
- 8:250 -
BPMI Details
Year Commenced 2000
Plans for Continuation Ongoing
Structure
At Beginning Enterprise Wide Program / Project Based
At Time of Case Study Enterprise Wide Program / Pockets of Excellence
Responsibility
At Beginning Strategy Unit – Chief Strategy Officer
At Time of Case Study Shared Services Unit – Group General Manager Shared Services
Executive Buy-In
At Beginning 2.5
At Time of Case Study 3.2
Table 62: Company T – BPM Initiative Details
The details in Table 62 show that the structure and responsibility for the BPM
Initiative changed over time.
Company T‟s impetus for implementing a BPM Initiative was a significant change
in its mode of business operation brought about by a change in legislation in
1999. Until this time, the company operated as a monopoly provider of
transportation services for the Queensland State Government. This change in
legislation had resulted in the introduction of competition to this market. This
meant the company became a Government Owned Corporation (GOC) required
to operate as a commercial entity within the deregulated marketplace.
Consequently, Company T underwent a significant change in the strategic and
operational foundations of the organisation. According to participants:
“...that was their whole movement from a monopoly into a competitive
market. That required I guess the process architecture (...) or the
start of a process architecture...”
The subsequent internal reorganisation led to the instigation of the BPM Initiative.
As one participant explained:
Business Process Management: Progression and Maturity
- 8:251 -
“...from there, the quality unit had a bit of a revamp and it became the
Improvement Unit and it started to look at a bit broader, it started to
look at end to end process...”
Over time, the scope of the BPM Initiative remained as an enterprise-wide
program. The approach to implementation, however, changed from being project
based to having a recognised centre of excellence. Furthermore, the
responsibility of the BPM Initiative moved from within the Strategy Unit to being
within the Shared Service Unit.
Executive Buy-In at the beginning of the BPM Initiative was low, being 2.5 on a 7-
point scale. Despite this, there was a recognised mandate to implement a BPM
Initiative, as indicated by a participant‟s comment:
“...that was around 2000 (…) we had a new chief strategist starting
with us and he was given the mandate from the CEO to change the
organisation towards a more process centric organisation...”
The level of Executive Buy-In increased marginally to a level of 3.2 during the last
year. There was a feeling by participants that the mandate for the BPM Initiative
no longer existed however, seen in comments such as:
“...it‟s definitely not pushed from the top level down (...) not any
more...”
“...unless it‟s actually mandated on the corporate level (…) it will
never be picked up properly...”
8.3.3 First Year of the BPM Initiative
The emphasis Company T placed on capability areas during the first year of the
BPM Initiative is set out in Figure 37.

Chapter 8 – Within Case Analysis
- 8:252 -
Figure 37: Company T – Emphasis during First Year (2000)
This figure shows little variation in the emphasis placed on the capability areas
across different factors during the first year. Only two capability areas outside of
IT reflected an emphasis other than a 2 on a 7-point scale with 7 being high
emphasis. Conversely, three capability areas of IT had a score other than two
giving this factor the greatest variation across the capability areas and the
greatest range in emphasis as seen in Table 63.
Factor Average Score
Range in Emphasis
on Capability
Areas
Least Emphasised Capability
Area
Most Emphasised Capability
Area
Strategic Alignment 2.1 0.9 1.8 2.7
Governance 2.3 0.7 1.8 2.5
Methods 2.2 0.7 1.8 2.5
Information Technology 2.4 2.0 1.0 3.0
People 2.4 0.7 2.0 2.7
Culture 2.6 0.4 2.3 2.7
Range in Factors 0.5
Table 63: Company T – First Year Range in Emphasis
Governance MethodsStrategic
AlignmentInformation Technology
People Culture
Process-Related Standards
Process Metrics & Performance
Linkage
Process Roles & Responsibilities
Process Management
Decision Making
Process Measures
Enterprise Process Architecture
Strategy & Process Capability Linkage
Process Improvement Plan
Process Customers & Stakeholders
Process Monitoring & Control (M)
Process Implementation &
Execution (M)
Process Design & Modeling (M)
Process Monitoring & Control (I)
Process Implementation &
Execution (I)
Process Design & Modeling (I)
Process Education & Learning
Process Management
Knowledge
Process Skills & Expertise
Process Attitudes & Behaviors
Process Values & Beliefs
Responsiveness to Process Change
Process Program & Project Mgmt (M)
Process Improvement & Innovation (M)
Process Program & Project Mgmt (I)
Process Improvement &
Innovation (I)
Process Management
Leaders
Process Collaboration & Communication
Leadership Attention to Process
Process Management Social
Networks
Process Management Compliance
1 2 3 4 5 6 7

Business Process Management: Progression and Maturity
- 8:253 -
Insights into the early focus on IT – Process Implementation and Execution, and
IT – Process Monitoring and Control came from participants and the early drivers
of the BPM Initiative. In addition to building a framework, the BPM Initiative was
also output driven due to the heavy compliance focus of the organisation
although this had moved more toward being driven by performance and profit in
recent times. According to participants:
“...it was output driven, it was about putting in place a business
process enterprise (...) it was tool driven...”
“...compliance is losing its shine. It‟s really now performance, that‟s
really, profit and performance is now, is the thing...”
8.3.4 Change from First to Last Year of the BPM Initiative
Looking at the data from the last year of the BPM Initiative (i.e. 2007), Figure 38
again shows a greater level of volatility at a capability area level, despite seeming
consistency at a factor level.
Figure 38: Company T – Emphasis during Last Year (2007)
Governance MethodsStrategic
AlignmentInformation Technology
People Culture
Process-Related Standards
Process Metrics & Performance
Linkage
Process Roles & Responsibilities
Process Management
Decision Making
Process Measures
Enterprise Process Architecture
Strategy & Process Capability Linkage
Process Improvement Plan
Process Customers & Stakeholders
Process Monitoring & Control (M)
Process Implementation &
Execution (M)
Process Design & Modeling (M)
Process Monitoring & Control (I)
Process Implementation &
Execution (I)
Process Design & Modeling (I)
Process Education & Learning
Process Management
Knowledge
Process Skills & Expertise
Process Attitudes & Behaviors
Process Values & Beliefs
Responsiveness to Process Change
Process Program & Project Mgmt (M)
Process Improvement & Innovation (M)
Process Program & Project Mgmt (I)
Process Improvement &
Innovation (I)
Process Management
Leaders
Process Collaboration & Communication
Leadership Attention to Process
Process Management Social
Networks
Process Management Compliance
1 2 3 4 5 6 7

Chapter 8 – Within Case Analysis
- 8:254 -
This figure shows that three of the most emphasised areas were from the People
factor. Conversely, two of the least emphasised areas were also from the People
factor. Participants reflected on the higher emphasis when discussing the
internal BPM community, stating the purpose of the group as being:
“...to knowledge share, to feedback what, how well they are going
within their businesses with implementing business process
management or business process improvement...”
This comment indicated that Company T was actively trying to use a distributed
internal structure to spread knowledge of BPM throughout the company. In
discussing enablers of progression, participants also indicated:
“...we established the different training courses, the modelling training
courses and the business process review training courses, the Six-
Sigma training courses and the Lean manufacturing training
courses...”
Statements such as this showed that developing and conducting training courses
was important to the BPM Initiative. At the same time, they showed the use of
complementary process improvement methods, including Lean and Six Sigma,
within Company T.
Participants, when discussing the enablers of progression, also mentioned
collaboration, stating:
“...and then collaboration was a big one...”
The higher emphasis on some of the capability areas from the People factor
resulted in this factor having the greatest range in emphasis as seen in Table 64.

Business Process Management: Progression and Maturity
- 8:255 -
Factor Average Score
Range in Emphasis
on Capability
Areas
Least Emphasised Capability
Area
Most Emphasised Capability
Area
Strategic Alignment 3.4 0.5 3.0 3.5
Governance 3.0 1.2 2.3 3.5
Methods 3.4 1.0 3.0 4.0
Information Technology 3.5 1.0 3.0 4.0
People 3.6 2.0 2.5 4.5
Culture 3.4 1.0 2.8 3.8
Range in Factors 0.6
Table 64: Company T – Last Year Range in Emphasis
The low emphasis on the capability areas of People – Process Leaders and
Culture – Leadership Attention to Processes was consistent with further changes
in the executive and senior management ranks. This was evident in comments
such as:
“...other than Executive X they don‟t have a deep understanding of
process, the importance of managing processes (…) some of the new
people coming in seem to be fairly non process oriented, which is
horrifying because you‟d think we‟d get better, not worse...”
“...it‟s going to be very interesting to see what the new CEO is like,
because the chairman of the board doesn‟t understand it...”
These statements show the inability to progress the capability areas due to
changes occurring within Company T.
Change in Emphasis
Figure 39 shows the change in emphasis across the capability areas from the
first to the last year.

Chapter 8 – Within Case Analysis
- 8:256 -
Figure 39: Company T – Change in Emphasis on Capability Areas
This figure shows the highest change in emphasis on IT – Process Design and
Modelling. This change reflected the acquisition and implementation of System
Architect for process modelling within Company T.
Select capability areas from the Strategic Alignment, Methods and People factors
also showed a high change in emphasis relative to other capability areas. The
emphasis on Strategic Alignment reflected on-going changes to the business
model. This was evident in comments such as:
“...we are still doubting ourselves and each other because we‟re now
reshaping the whole organisation again...”
“…we‟ll see if all of the work, which has been done in the last five
years, is going to be undone (...) I have fears that it will be...”
The changes in the business model linked to the recent changes in the executive
within Company T. This shows that changes within the environment can have
the affect of creating a forward and backward momentum to progression.
8.3.5 Discussion on Progression of the BPM Initiative
In discussing the progression of the BPM Initiative, participants made key points
regarding:
Iterative approach to BPM
Short-term Gain versus Long-term Sustainability
Information Technology versus Business.
0.00
0.50
1.00
1.50
2.00
2.50
PIP
S&P
L
EPA
PM
PC
&S
PM
DM
PR
&R
PM
&P
L
PR
S
PM
C
PD
&M
PE&
I
PM
&C
PI&
I
PM
gt
PD
&M
-IT
PI&
E -
IT
PM
&C
-IT
PI&
I -IT
PM
gt -
IT
PS&
E
PM
K
PE&
L
PC
&C
PM
L
RTP
C
PV
&B
PA
&B
LATP
PM
SN
Strategic Alignment Governance Methods
Information Technology People Culture
Company T Change

Business Process Management: Progression and Maturity
- 8:257 -
Further details are in the following sections.
Iterative Approach to BPM
Within Company T, participants indicated the need to take an iterative approach
to progression, stating:
“...we can see where it needs to go, but the journey is very stressful
(...) to try and get to a point where you get all the parties working
together (...) and get them all thinking the same way...”
This statement showed that one difficulty to overcome is having people within the
company thinking in the same manner. There was also difficulty in the ability of
individuals to digest the changes however, indicated in comments such as:
“...get ready to wean them onto the next step, but don‟t give them too
much too soon (…) you‟ve got to be able to take a piece, think about
it, have a go at using it, and it might be two years later before the
penny drops...”
“…the second time around you actually get a lot further, you can tell
that they‟ve learned, but if you give them too much too soon it‟s no
good...”
These comments showed that it was necessary to have people thinking the same
way, but it was also necessary to break the journey down into small steps so that
there was only a small amount of change within any given period. These last
statements also indicated that the actual step taken might not be one that
Company T ultimately needed to take but rather that the step was in the right
direction and of a magnitude that was digestible to people within Company T.
Short-term Gain versus Long-term Sustainability
Company T commenced its operations due to a change in legislation changing
the company from a monopoly government provider to being required to operate
within a commercial market. Consequently, there was a focus within Company T
on gaining short-term financial improvements. Participants indicated:
Chapter 8 – Within Case Analysis
- 8:258 -
“...all the pressure is on immediate, bottom line returns (…) managers
are under intense pressure to drive down costs immediately, with no
view of the output delivered for that cost reduction...”
“...the other challenges for any BPM focus, is the focus on short term
gains only (...) quick wins (...) we‟ve got to satisfy that need for ROI...”
These statements highlighted the driver within Company T, namely, to focus on
short-term financial gains. Despite this, participants within Company T
recognised a conflict between making sustainable progress with the BPM
Initiative and achieving the short-term gains. One participant indicated:
“…they don‟t understand that if you want financial outcomes you have
to manage the lead processes that deliver those outcomes…”
Another participant indicated a further consequence of the short-term focus for
Company T was:
“...the process to deliver long term sustainable performance is
disappearing, so you get a culture that is adverse to creativity. It‟s
adverse to process management and improvement, except in the
lowest level of risk aversion...”
These comments showed that within Company T the short-term focus on
outcomes reduced the sustainable performance of processes over time. This
was due to the increased risk aversion leading to a lack of management around
the core processes and the future improvement and innovation of the processes.
Information Technology versus Business
Within Company T, there was a recognised tension between IT and Business
with regard to the ownership and understanding of BPM. Participants indicated:
“...we said it‟s business architecture, but the business didn‟t take any
ownership of it because they thought it was purely IT (...) they didn‟t
understand really what it was...”

Business Process Management: Progression and Maturity
- 8:259 -
“...we had to stop (…) even calling it, Staffware or whatever, because
they just related it back to IT too...”
A consequence of the lack of ownership was evident in the assignment of
business staff to projects. Participants indicated:
“…we got given people who were not wanted, you know, nobody
would miss them for four weeks. Instead of getting the right ones…”
These comments showed the difficulty the BPM team faced in getting the
business areas to commit to process improvement projects. Consequently, the
BPM team within Company T focused on developing ways of getting support
from the business, including:
“…we tried anything and everything (…) the tool was owned by ISD
and we went as far as moving it out of ISD ownership into the
business improvement ownership and people still didn‟t get it…”
“...we developed a glossary of BPM definitions. We put together what
we mean by business improvement, including how many types of
projects of business improvement are there in the organisation (…)
we also defined business process management. The concept, what it
is all about, its relationships with all the other management concepts
in the organisation, so that we were able to communicate to the
business what BPM is all about and where it fits...”
This showed the necessity within Company T of communicating the BPM concept
and the role the Initiative played within the organisation.
8.3.6 Company T Summary
During the time from 2000 to 2007, Company T‟s BPM Initiative changed in
structure and responsibility. The scope of the initiative remained as an enterprise
wide program however the implementation approach changed from being project
based to being a centre of excellence. Furthermore, the responsibility moved
from the Strategy Unit with a mandate for implementation, to the Shared Service
Unit where the mandate for implementation was not as notable as previously.

Chapter 8 – Within Case Analysis
- 8:260 -
During early stages of implementation, Company T consistently distributed
emphasis applying similar levels to over 80% of the capability areas. Early
emphasis was on IT for the execution and control of processes, stemming from a
compliance background. Over time however, Company T targeted emphasis to
specific areas, in response to changes in the needs of the organisation.
Capability areas in the People factor received higher emphasis due to the
constraints placed on progression. This reflected in the need to overcome issues
between the business and IT areas, and the iterative approach to implementation
of the BPM Initiative.
Company T also found their move from a monopoly to a competitive environment
led to a short-term focus that acted to counter the long-term sustainability of the
initiative. Changes to the executive and another subsequent organisational
structure were a further consequence of the move. These changes reflected in
the level of Executive Buy-In increasing only marginally and participants raising
concerns about the affect on the progression of the BPM Initiative.
8.4 Case 3 – Company U
Company U was a stand-alone agency within a large federal government
portfolio providing four key services to individuals and companies from within
Australian and abroad95. Within Australia, Company U was a monopoly service
provider however, due to increasing global demands Company U worked closely
with similar centres in other countries including the United States, the United
Kingdom, Korea, China and New Zealand. Increasingly these international
offices, that offered the same services for different countries, were becoming
competition to Company U.
Company U was located in Canberra. In addition to the four key business units,
Company U had an IT department and a Customer Operations Group that dealt
with common administrative processes for the four business units. There was
also a small team of human resource and finance staff (although this team had a
95
Conceptually this structure is similar to a subsidiary of a parent company.

Business Process Management: Progression and Maturity
- 8:261 -
largely facilitation role as the provision of human resource and finance services
was outsourced). In 2006, Company U had a turnover of $115 million and a staff
of approximately 1,000. The demographics of Company U are summarised in
Table 65.
Company U Details
Headquarters Canberra
Industry Innovation, Science and Technology
Turnover $A115 million
Employees 1,000
Sector Public
Ownership Structure Agency in Federal Government Portfolio
Table 65: Company U – Company Demographics
8.4.1 Participants in Study
The case study with Company U occurred over the period of May 2007 to August
2007. The Key Contact from Company U invited participants to the study based
on knowledge of the individuals and their involvement and understanding of the
BPM Initiative. The details of participants are set out in Table 66.
Participants Position Position Level
96
Years with Company
Involvement with BPMI
Participant 197
Business Process Architect
O 1 Current, limited knowledge of history
Participant 2 Director, BIMS Project Delivery
S,O,T 18 Current, strong knowledge of history
Participant 3 Business Analyst S,T 10 Current, since beginning
Participant 4 Director, Strategic Development and Quality Management
S 5 Current, strong knowledge of history
96
S=Strategic, T=Tactical, O=Operational.
97 Participant 1 was the Key Contact for the case study with Company U.
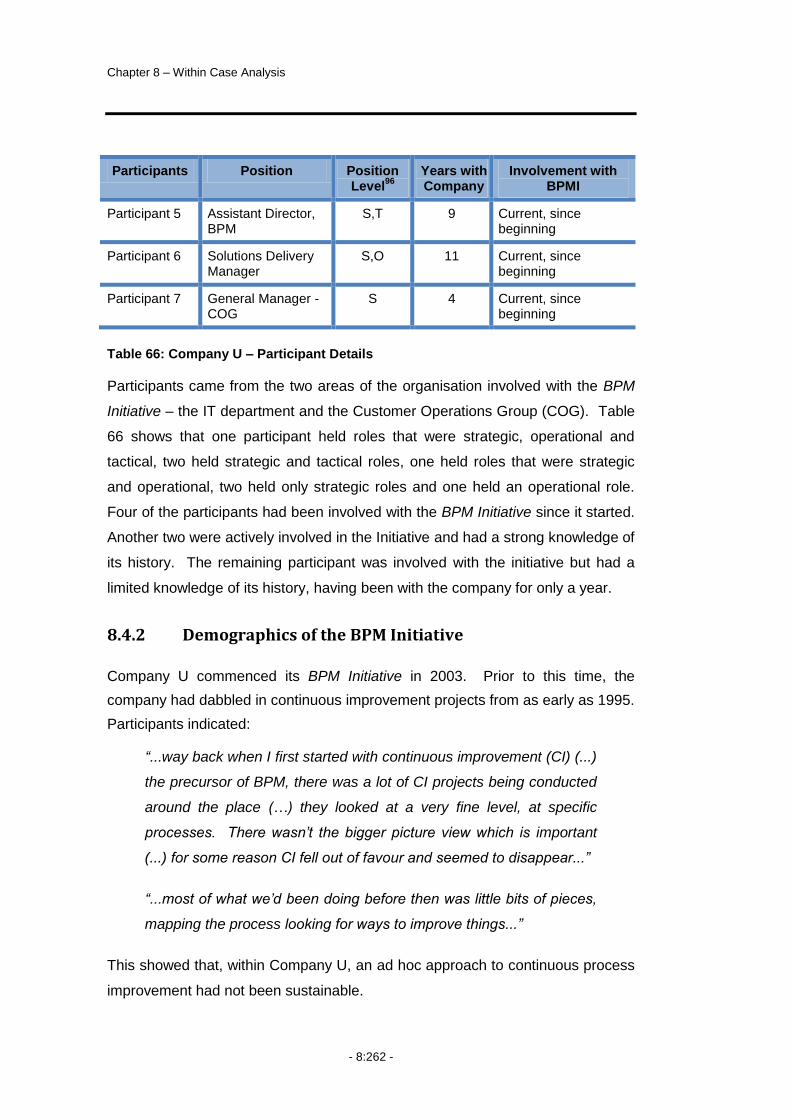
Chapter 8 – Within Case Analysis
- 8:262 -
Participants Position Position Level
96
Years with Company
Involvement with BPMI
Participant 5 Assistant Director, BPM
S,T 9 Current, since beginning
Participant 6 Solutions Delivery Manager
S,O 11 Current, since beginning
Participant 7 General Manager - COG
S 4 Current, since beginning
Table 66: Company U – Participant Details
Participants came from the two areas of the organisation involved with the BPM
Initiative – the IT department and the Customer Operations Group (COG). Table
66 shows that one participant held roles that were strategic, operational and
tactical, two held strategic and tactical roles, one held roles that were strategic
and operational, two held only strategic roles and one held an operational role.
Four of the participants had been involved with the BPM Initiative since it started.
Another two were actively involved in the Initiative and had a strong knowledge of
its history. The remaining participant was involved with the initiative but had a
limited knowledge of its history, having been with the company for only a year.
8.4.2 Demographics of the BPM Initiative
Company U commenced its BPM Initiative in 2003. Prior to this time, the
company had dabbled in continuous improvement projects from as early as 1995.
Participants indicated:
“...way back when I first started with continuous improvement (CI) (...)
the precursor of BPM, there was a lot of CI projects being conducted
around the place (…) they looked at a very fine level, at specific
processes. There wasn‟t the bigger picture view which is important
(...) for some reason CI fell out of favour and seemed to disappear...”
“...most of what we‟d been doing before then was little bits of pieces,
mapping the process looking for ways to improve things...”
This showed that, within Company U, an ad hoc approach to continuous process
improvement had not been sustainable.
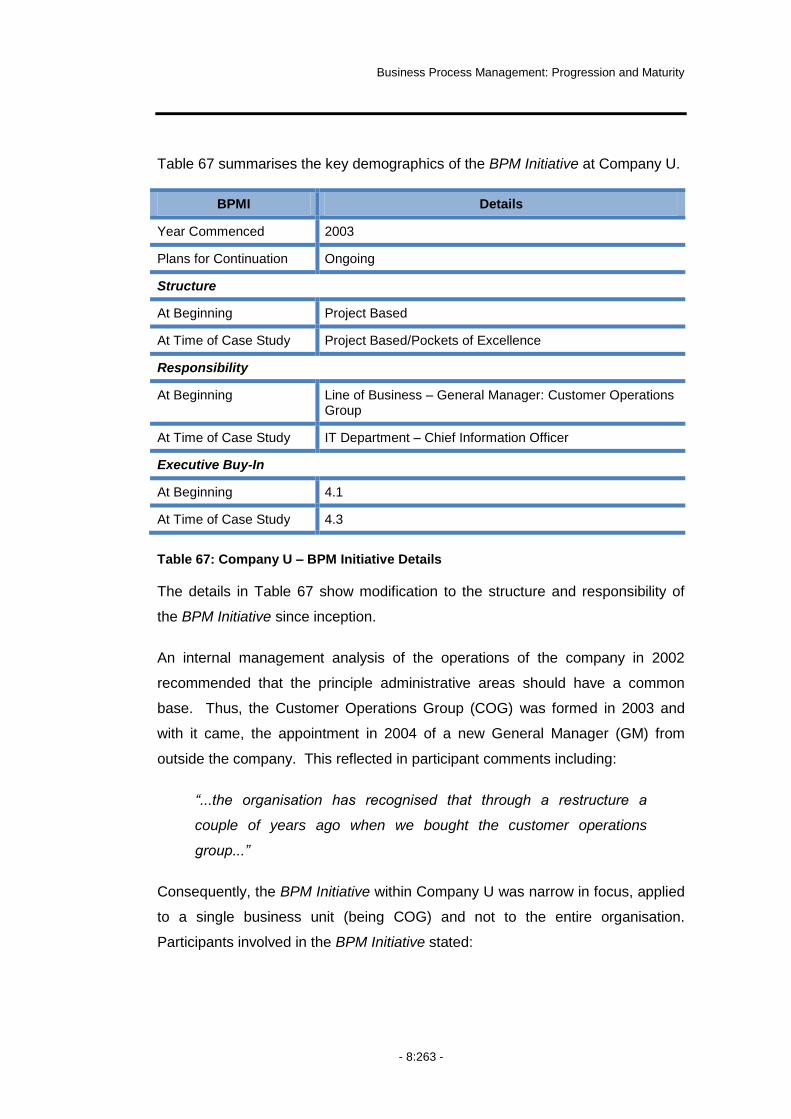
Business Process Management: Progression and Maturity
- 8:263 -
Table 67 summarises the key demographics of the BPM Initiative at Company U.
BPMI Details
Year Commenced 2003
Plans for Continuation Ongoing
Structure
At Beginning Project Based
At Time of Case Study Project Based/Pockets of Excellence
Responsibility
At Beginning Line of Business – General Manager: Customer Operations Group
At Time of Case Study IT Department – Chief Information Officer
Executive Buy-In
At Beginning 4.1
At Time of Case Study 4.3
Table 67: Company U – BPM Initiative Details
The details in Table 67 show modification to the structure and responsibility of
the BPM Initiative since inception.
An internal management analysis of the operations of the company in 2002
recommended that the principle administrative areas should have a common
base. Thus, the Customer Operations Group (COG) was formed in 2003 and
with it came, the appointment in 2004 of a new General Manager (GM) from
outside the company. This reflected in participant comments including:
“...the organisation has recognised that through a restructure a
couple of years ago when we bought the customer operations
group...”
Consequently, the BPM Initiative within Company U was narrow in focus, applied
to a single business unit (being COG) and not to the entire organisation.
Participants involved in the BPM Initiative stated:

Chapter 8 – Within Case Analysis
- 8:264 -
“...we don‟t have that overall, overarching BPM philosophy by any
means (...) Executive X tried a number of times over his three years
here to have a corporate BPM and had some direction coming out of
that area and, but that‟s never got off the ground. I think even getting
a COG BPM section called BPM is the biggest step in doing that...”
“...because it‟s not an overt step outside of my group it doesn‟t
happen corporately the same way it happens within my group...”
Consequently, at the beginning of the BPM Initiative, responsibility for the
Initiative lay with the General Manager of the applicable business unit. Shortly
prior to the case study however, the departure of the GM had resulted in
responsibility shifting to the IT Department in an attempt to progress the BPM
Initiative in other areas of the business. The relocation to IT resulted from the
high reliance on IT projects during the early stages of the BPM Initiative.
At the beginning, the BPM Initiative had moderate levels of Executive Buy-In,
rating 4.1 on a 7-point scale. There was a slight increase in the level of
Executive Buy-In over time.
The next sections detail the emphasis placed on the capability areas during the
first and last year of the BPM Initiative, including the change between these two
points.
8.4.3 First Year of the BPM Initiative
Figure 40 shows the level of emphasis that Company U placed on the capability
areas in the first year of the BPM Initiative.

Business Process Management: Progression and Maturity
- 8:265 -
Figure 40: Company U – Emphasis during First Year (2003)
This figure shows that the capability areas in the Methods factors received, on
average, more emphasis than those of other factors. This factor also included
the most emphasised capability area in Process Design and Modelling.
Participants supported the focus on the Methods factor, with comments including:
“...we are really driving ourselves hard to see how we can improve
our processes...”
The distribution of emphasis across the remaining factors was consistent except
for the Governance factor, which received the lowest emphasis. Participants
provided insights into this, indicating:
“...to make sure that you have the right processes, the right
technology, the right tools, the right training, the right skills to be able
to do your job effectively every day...”
“...you confidently have to keep focus on balancing out people,
process and technology...”
Governance MethodsStrategic
AlignmentInformation Technology
People Culture
Process-Related Standards
Process Metrics & Performance
Linkage
Process Roles & Responsibilities
Process Management
Decision Making
Process Measures
Enterprise Process Architecture
Strategy & Process Capability Linkage
Process Improvement Plan
Process Customers & Stakeholders
Process Monitoring & Control (M)
Process Implementation &
Execution (M)
Process Design & Modeling (M)
Process Monitoring & Control (I)
Process Implementation &
Execution (I)
Process Design & Modeling (I)
Process Education & Learning
Process Management
Knowledge
Process Skills & Expertise
Process Attitudes & Behaviors
Process Values & Beliefs
Responsiveness to Process Change
Process Program & Project Mgmt (M)
Process Improvement & Innovation (M)
Process Program & Project Mgmt (I)
Process Improvement &
Innovation (I)
Process Management
Leaders
Process Collaboration & Communication
Leadership Attention to Process
Process Management Social
Networks
Process Management Compliance
1 2 3 4 5 6 7
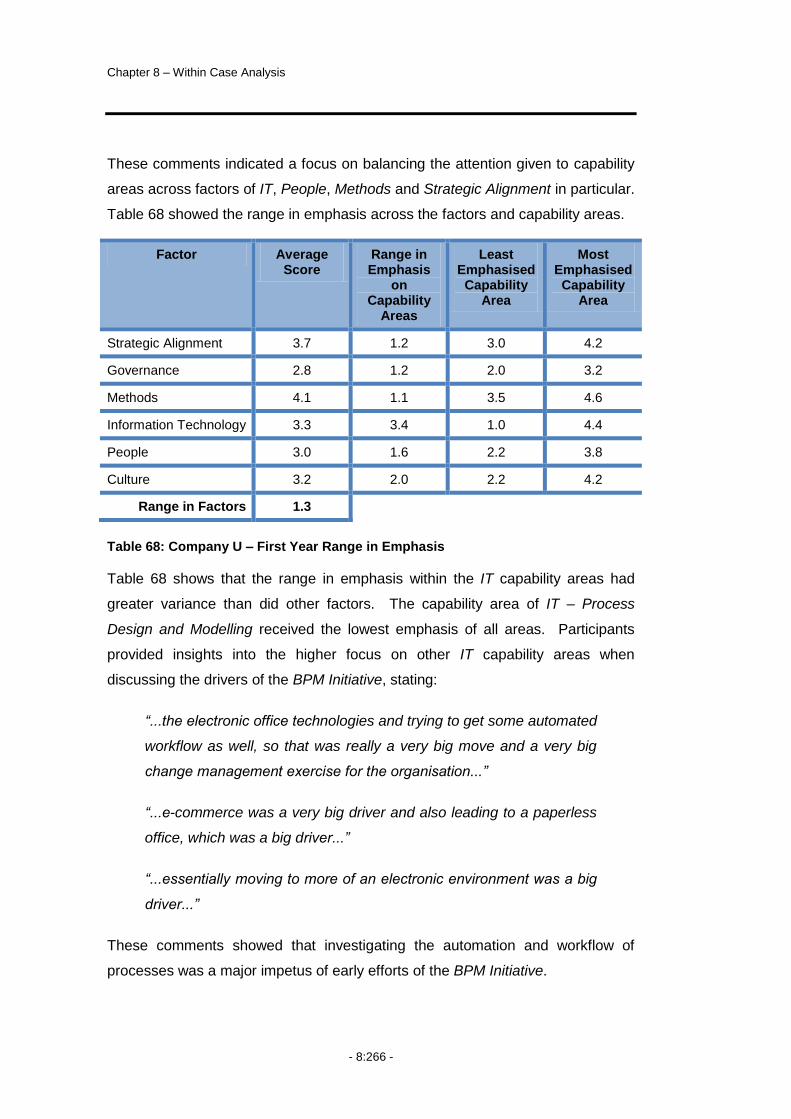
Chapter 8 – Within Case Analysis
- 8:266 -
These comments indicated a focus on balancing the attention given to capability
areas across factors of IT, People, Methods and Strategic Alignment in particular.
Table 68 showed the range in emphasis across the factors and capability areas.
Factor Average Score
Range in Emphasis
on Capability
Areas
Least Emphasised Capability
Area
Most Emphasised Capability
Area
Strategic Alignment 3.7 1.2 3.0 4.2
Governance 2.8 1.2 2.0 3.2
Methods 4.1 1.1 3.5 4.6
Information Technology 3.3 3.4 1.0 4.4
People 3.0 1.6 2.2 3.8
Culture 3.2 2.0 2.2 4.2
Range in Factors 1.3
Table 68: Company U – First Year Range in Emphasis
Table 68 shows that the range in emphasis within the IT capability areas had
greater variance than did other factors. The capability area of IT – Process
Design and Modelling received the lowest emphasis of all areas. Participants
provided insights into the higher focus on other IT capability areas when
discussing the drivers of the BPM Initiative, stating:
“...the electronic office technologies and trying to get some automated
workflow as well, so that was really a very big move and a very big
change management exercise for the organisation...”
“...e-commerce was a very big driver and also leading to a paperless
office, which was a big driver...”
“...essentially moving to more of an electronic environment was a big
driver...”
These comments showed that investigating the automation and workflow of
processes was a major impetus of early efforts of the BPM Initiative.

Business Process Management: Progression and Maturity
- 8:267 -
8.4.4 Change from First to Last Year of the BPM Initiative
Figure 41 shows the level of emphasis Company U placed on the capability
areas in the last year.
Figure 41: Company U – Emphasis during Last Year (2007)
This figure shows that a number of capability areas received higher emphasis
than others including:
Methods – Process Implementation and Execution
Information Technology – Process Design and Modelling
Culture – Responsiveness to Process Change.
The emphasis on having a repository for developing process models was evident
in comments including:
“...repository based tools are important, otherwise you end up
repeating, having multiple instances of business objects, that sort of
thing. So I think you need good systems to maintain the quality of that
repository...”
Governance MethodsStrategic
AlignmentInformation Technology
People Culture
Process-Related Standards
Process Metrics & Performance
Linkage
Process Roles & Responsibilities
Process Management
Decision Making
Process Measures
Enterprise Process Architecture
Strategy & Process Capability Linkage
Process Improvement Plan
Process Customers & Stakeholders
Process Monitoring & Control (M)
Process Implementation &
Execution (M)
Process Design & Modeling (M)
Process Monitoring & Control (I)
Process Implementation &
Execution (I)
Process Design & Modeling (I)
Process Education & Learning
Process Management
Knowledge
Process Skills & Expertise
Process Attitudes & Behaviors
Process Values & Beliefs
Responsiveness to Process Change
Process Program & Project Mgmt (M)
Process Improvement & Innovation (M)
Process Program & Project Mgmt (I)
Process Improvement &
Innovation (I)
Process Management
Leaders
Process Collaboration & Communication
Leadership Attention to Process
Process Management Social
Networks
Process Management Compliance
1 2 3 4 5 6 7

Chapter 8 – Within Case Analysis
- 8:268 -
This showed that participants saw value in having a common repository for
storing and sharing the process models. The spread of emphasis across the
factors was evidence of the balanced approach taken within the BPM Initiative,
seen in comments such as:
“…you can have the best technology, you can have the best process
in place, but if you haven‟t got your people trained and if they don‟t
understand what‟s going on or why they‟re doing it, it‟s going to fail.
It‟s an inevitable truth...”
This statement highlighted again the belief within Company U that a balanced
approach, including people, processes and technology was critical to
progression. Table 69 shows the range in emphasis that Company U placed on
the capability areas.
Factor Average Score
Range in Emphasis
on Capability
Areas
Least Emphasised Capability
Area
Most Emphasised Capability
Area
Strategic Alignment 4.1 1.3 3.5 4.8
Governance 3.1 2.0 1.8 3.8
Methods 4.4 2.5 3.0 5.5
Information Technology 4.1 1.8 3.2 5.0
People 3.4 1.5 2.7 4.2
Culture 3.8 2.5 2.7 5.2
Range in Factors 1.3
Table 69: Company U – Last Year Range in Emphasis
The range in emphasis on capability areas was highest for the Methods and
Culture factors – the two factors that also had the most emphasised capability
areas. Governance was the least emphasised factor during the last year.
Change in Emphasis from First Year to Last Year
Figure 42 shows the change in emphasis from the first to the last years.

Business Process Management: Progression and Maturity
- 8:269 -
Figure 42: Company U – Change in Emphasis on Capability Areas
This figure showed little change in emphasis in all capability areas except for IT –
Process Design and Modelling. Participants provided additional insights into this
during the interviews. One participant indicated:
“...he‟d been using ARIS and thought it was pretty good (…) and so
we bought a few licences (...) but at the highest level of the
organisation there mightn‟t have been the commitment to see it
through...”
This comment related to the Executive championing the BPM Initiative. During
the last year of the BPM Initiative, this Executive left Company U and Company U
transferred responsibility for the BPM Initiative to the IT Department. This
resulted in the use of different process modelling software, seen in the comment:
“...we‟ve just recently gone to using Holocentric as our process
mapping tool and done that as a corporate product. Where ARIS was
(…) never officially in our production environment, Holocentric is
leveraged off a contract with our parent Department…”
This statement explained the peak in the capability area in the last year and
showed the impact contextual factors such as the company ownership or a
change in Executive Buy-In can have on the progression of a BPM Initiative.
Another point of interest from Figure 45 is the negative change in some capability
areas. Although the magnitude of change was minimal (ranging from -0.01 to -
0.08) the change showed that the emphasis placed on capability areas for
-1.00
0.00
1.00
2.00
3.00
4.00
5.00
PIP
S&P
L
EPA
PM
PC
&S
PM
DM
PR
&R
PM
&P
L
PR
S
PM
C
PD
&M
PE&
I
PM
&C
PI&
I
PM
gt
PD
&M
-IT
PI&
E -
IT
PM
&C
-IT
PI&
I -IT
PM
gt -
IT
PS&
E
PM
K
PE&
L
PC
&C
PM
L
RTP
C
PV
&B
PA
&B
LATP
PM
SN
Strategic Alignment Governance Methods
Information Technology People Culture
Company U Change

Chapter 8 – Within Case Analysis
- 8:270 -
Company U decreased over the duration of the BPM Initiative.
8.4.5 Discussion on Progression of the BPM Initiative
In discussing the progression of the BPM Initiative, Participants made key points
regarding:
Operating in a heavily legislated environment
Strong but narrow Executive Buy-In
Practical affect of BPM terminology.
Further details are in the following sections.
Operating in a Heavily Legislated Environment
Legislation or regulations acted to control the core processes within Company U,
thus presenting a challenge to progressing the BPM Initiative. Participants
articulated this in a number of ways, stating:
“...as much as we would like to significantly simplify our processes
(...) we are to a large extent, hamstrung by the policy, legislation and
international treaties that we are a party to...”
“...there may well be something at the root of it like legislation (…) so
if the legislation defines something then we have to do it otherwise
we‟re breaking the law. You‟ve got to take these things into account
you can‟t just throw all that away and start with a clean slate...”
In discussing the effects of the heavily legislated environment, participants
highlighted the effects this had on the organisation, indicating:
“...this sort of leads you back to this silo mentality that we‟ve had for a
hundred years...”
“...getting back to cultural inertia and things of that nature is probably
one of the biggest issues that we‟ll face...”
“...we‟ve got a fair degree of inertia within the organisation...”

Business Process Management: Progression and Maturity
- 8:271 -
These comments show that the existence of stable legislation governing the core
processes of the organisation acted to limit the perceived opportunities for
process change within Company U. One consequence of the inertia was the
narrow scope of the BPM Initiative and the inability to progress the BPM Initiative
into other areas of the business. Participants indicated:
“...I could see other parts of this organisation really struggling with
it...”
“...COG go well with it because I support it, corporately it doesn‟t have
that same level of support so therefore it doesn‟t have that same
connection...”
This showed that different areas of Company U were more receptive to BPM
thinking than others.
Strong but Narrow Executive Buy-In
The importance of having Executive Buy-In to the BPM Initiative was also evident
in participant‟s comments, including:
“...management support is an important part of that. If you don‟t have
support from the top it‟s not going to work across the board...”
“...there needs to be a top level commitment (...) you‟ve got to really
capture the imagination of the exec and demonstrate how this thing is
going to work...”
“...more from the exec. The number one thing obviously, you can‟t do
anything unless you‟ve got their support to do it...”
Despite recognising the importance of Executive Buy-In and having their BPM
Initiative championed by an executive however, Company U was unable to
progress well with the Initiative. As one participant indicated:

Chapter 8 – Within Case Analysis
- 8:272 -
“...despite the fact one executive was one of the champions of it (…)
it sort of died (…) that‟s a good example of how it can be quite difficult
to implement this in an organisation such as ours, despite the fact
there are people interested in it and even one of the executive
members are interested in it...”
This showed that within Company U, strong support from a single executive
combined with support from other people within the company was insufficient for
the progression of the BPM Initiative. There was further evidence of the effect of
strong executive support from only isolated executives when the executive in
question left the company. Participants indicated the effect of this change,
stating:
“...one of the executives (...) he just left (...) he was championing it,
but then for some reason it seemed to fall in a heap and we didn‟t go
anywhere, and then we got caught up into specific projects and they
took up a lot of our time. So I suppose we run the risk now that we‟re
going to forget about all that good corporate thinking that we did and
go back to our old traps...”
“...there‟s a few of us around who had these concepts in our heads
and any recommendation we put forward will still be in line with it, but
you can see we‟ve reverted to this ad hoc unstructured approach...”
These comments showed the effect on the BPM Initiative within Company U
when a key executive left the company. The point made by these comments was
that Company U had not embedded a sufficiently coordinated approach to BPM
such that BPM thinking could continue without the support of that key executive.
Business Process Management: Progression and Maturity
- 8:273 -
Practical Effect of BPM Terminology
Participants within Company U also discussed issues with BPM terminology and
interpretation. Comments included:
“...it is program management versus project management (…) it‟s
really in the technology stage, another truism that‟s not a truism is the
number of IT people that think a workflow tool is BPM...”
“...it‟s really easy to focus on your program management around your
implementation of technology, but if you don‟t have the right people
and the right processes, one of my favourite sayings in that space is,
a fool with a tool is still a fool...”
“...too many people think BPM and BPR are synonyms, when it‟s
not...”
“...we‟re developing a bigger-picture process orientated approach
rather than just a technology orientated approach...”
These comments show that within Company U the distinctions between the
different interpretations of BPM were evident in practice98.
8.4.6 Company U Summary
Company U commenced its BPM Initiative within a single line of business in 2003
– the COG. Since that time, attempts to expand the BPM Initiative to apply to a
wider area of the business had been unsuccessful. Participants saw the lack of
success in adopting a wider BPM view within Company U as stemming from core
processes being the by-product of legislation. Participants credited the stability
of this legislation, with it having remained largely unchanged for over 100 years,
with creating a level of inertia within the company whereby there was little interest
in process thinking.
98
See Chapters 1 and 3 for discussion.
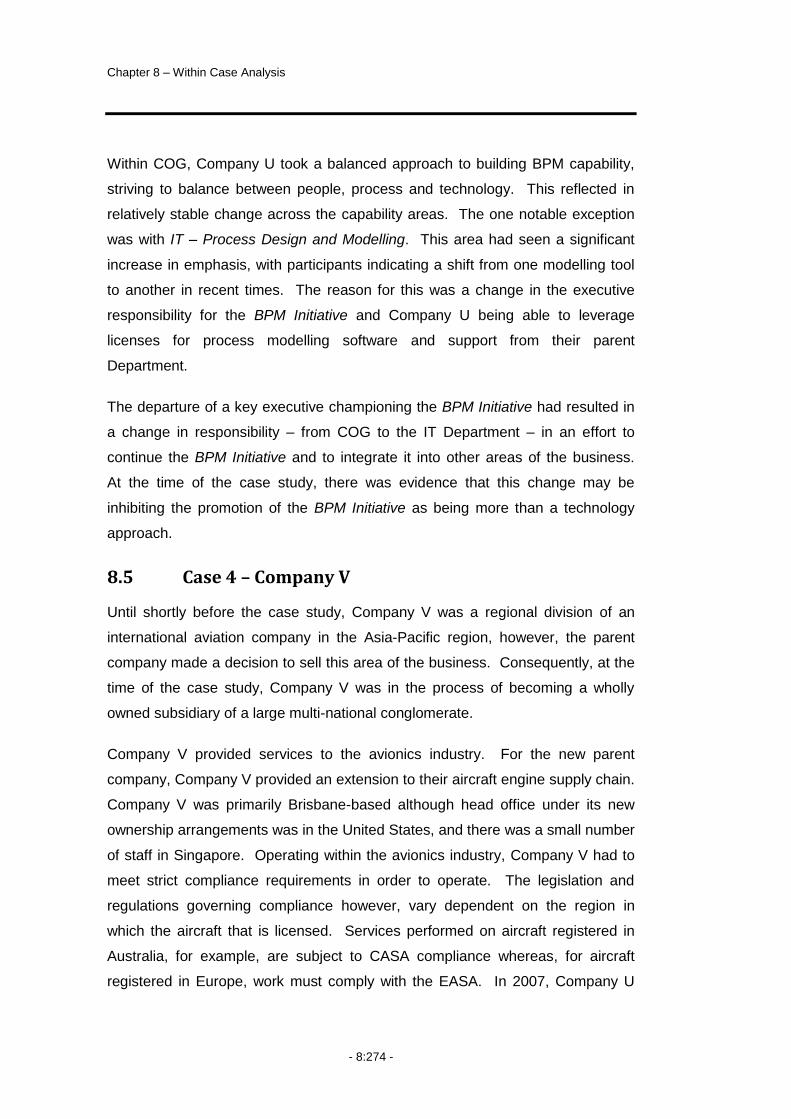
Chapter 8 – Within Case Analysis
- 8:274 -
Within COG, Company U took a balanced approach to building BPM capability,
striving to balance between people, process and technology. This reflected in
relatively stable change across the capability areas. The one notable exception
was with IT – Process Design and Modelling. This area had seen a significant
increase in emphasis, with participants indicating a shift from one modelling tool
to another in recent times. The reason for this was a change in the executive
responsibility for the BPM Initiative and Company U being able to leverage
licenses for process modelling software and support from their parent
Department.
The departure of a key executive championing the BPM Initiative had resulted in
a change in responsibility – from COG to the IT Department – in an effort to
continue the BPM Initiative and to integrate it into other areas of the business.
At the time of the case study, there was evidence that this change may be
inhibiting the promotion of the BPM Initiative as being more than a technology
approach.
8.5 Case 4 – Company V
Until shortly before the case study, Company V was a regional division of an
international aviation company in the Asia-Pacific region, however, the parent
company made a decision to sell this area of the business. Consequently, at the
time of the case study, Company V was in the process of becoming a wholly
owned subsidiary of a large multi-national conglomerate.
Company V provided services to the avionics industry. For the new parent
company, Company V provided an extension to their aircraft engine supply chain.
Company V was primarily Brisbane-based although head office under its new
ownership arrangements was in the United States, and there was a small number
of staff in Singapore. Operating within the avionics industry, Company V had to
meet strict compliance requirements in order to operate. The legislation and
regulations governing compliance however, vary dependent on the region in
which the aircraft that is licensed. Services performed on aircraft registered in
Australia, for example, are subject to CASA compliance whereas, for aircraft
registered in Europe, work must comply with the EASA. In 2007, Company U
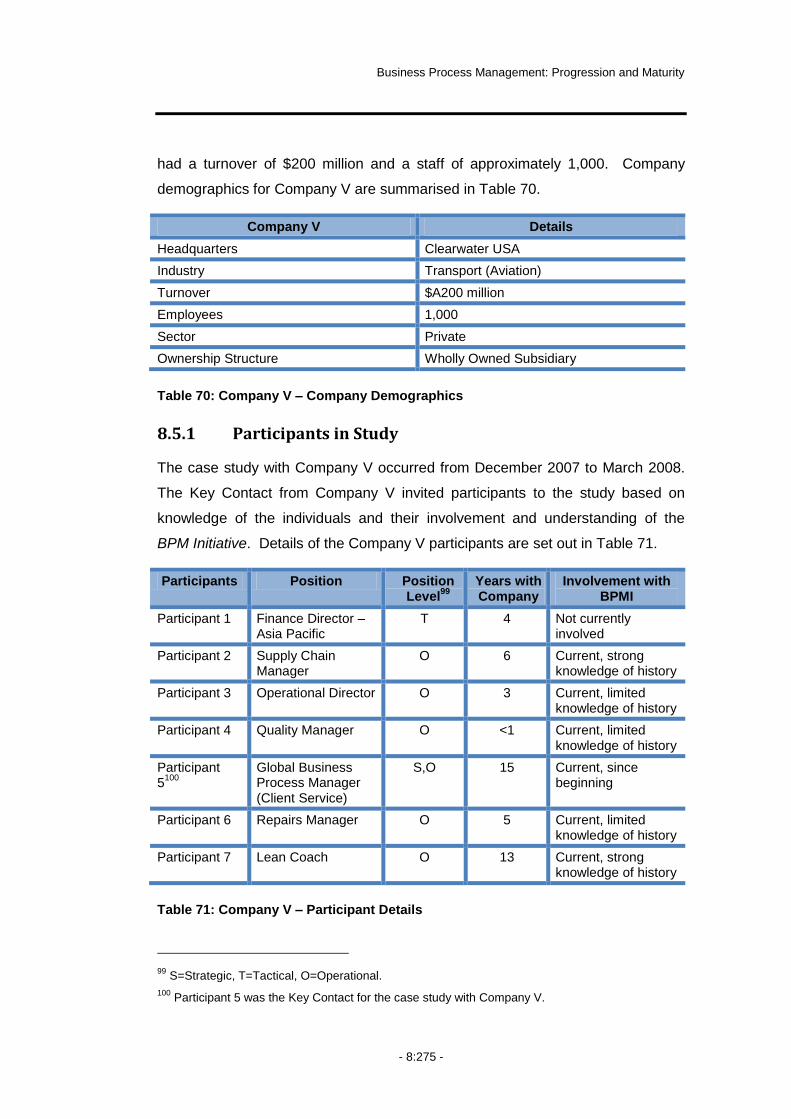
Business Process Management: Progression and Maturity
- 8:275 -
had a turnover of $200 million and a staff of approximately 1,000. Company
demographics for Company V are summarised in Table 70.
Company V Details
Headquarters Clearwater USA
Industry Transport (Aviation)
Turnover $A200 million
Employees 1,000
Sector Private
Ownership Structure Wholly Owned Subsidiary
Table 70: Company V – Company Demographics
8.5.1 Participants in Study
The case study with Company V occurred from December 2007 to March 2008.
The Key Contact from Company V invited participants to the study based on
knowledge of the individuals and their involvement and understanding of the
BPM Initiative. Details of the Company V participants are set out in Table 71.
Participants Position Position Level
99
Years with Company
Involvement with BPMI
Participant 1 Finance Director – Asia Pacific
T 4 Not currently involved
Participant 2 Supply Chain Manager
O 6 Current, strong knowledge of history
Participant 3 Operational Director O 3 Current, limited knowledge of history
Participant 4 Quality Manager O <1 Current, limited knowledge of history
Participant 5
100
Global Business Process Manager (Client Service)
S,O 15 Current, since beginning
Participant 6 Repairs Manager O 5 Current, limited knowledge of history
Participant 7 Lean Coach O 13 Current, strong knowledge of history
Table 71: Company V – Participant Details
99
S=Strategic, T=Tactical, O=Operational.
100 Participant 5 was the Key Contact for the case study with Company V.

Chapter 8 – Within Case Analysis
- 8:276 -
Table 71 shows that six of the seven participants from Company V were at an
operational level. One of these participants also held a strategic position and the
remaining participant held a tactical position. One participant had been involved
with the BPM Initiative since it began, with an additional two participants involved
with the BPM Initiative and having a strong understanding of its history. A further
three participants were involved with the BPM Initiative but had a limited
knowledge of its history and the remaining participant was not currently involved
with the BPM Initiative.
8.5.2 Demographics of the BPM Initiative
Company V commenced its BPM Initiative in 2005 within its Customer Service
Division. Key demographics of the BPM Initiative at Company V since its
inception in 2005 are set out in Table 72.
BPMI Details
Year Commenced 2005
Plans for Continuation Ongoing (but on hold pending outcome of recent sale of the company)
Structure
At Beginning Ad Hoc/Project Based
At Time of Case Study Centre of Excellence
Responsibility
At Beginning Executive
At Time of Case Study President – Business Improvement Unit
Executive Buy-In
At Beginning 5.0
At Time of Case Study 5.0
Table 72: Company V – BPM Initiative Details
The details in Table 72 show that, since its inception the structure and
responsibility for the BPM Initiative had changed. At the beginning of the BPM
Initiative an ad hoc, project based approach was taken to improving processes.
During the early stages however, the BPM Initiative changed. According to one
participant:

Business Process Management: Progression and Maturity
- 8:277 -
“…we were buying this tool, or evaluating a tool to design our
processes but looking at it myopically from a very narrow point of
view. We needed to understand the bigger picture...”
The realisation that BPM was more than modelling and improving processes
resulted in a wider, more co-ordinated approach to the BPM Initiative. This saw
the establishment of a recognised Business Improvement Unit that operated as a
centre of excellence and incorporated the Global Business Solutions Team
(GBST).
The Executive Buy-In for the BPM Initiative at the beginning was moderately
high, rating 5 on a 7-point scale. Over time, the level of Executive Buy-In
remained unchanged.
According to the Global Process Owner, at the beginning of the BPM Initiative,
the major drivers of the BPM Initiative were:
“...the need to understand, to have the consistency of processes and
at least aligned to our business objectives and strategic processes...”
The next sections detail the emphasis placed on the capability areas during the
first and last years of the BPM Initiative.
8.5.3 First Year of the BPM Initiative
Figure 43 shows the emphasis placed on the capability areas during the first year
of the BPM Initiative.
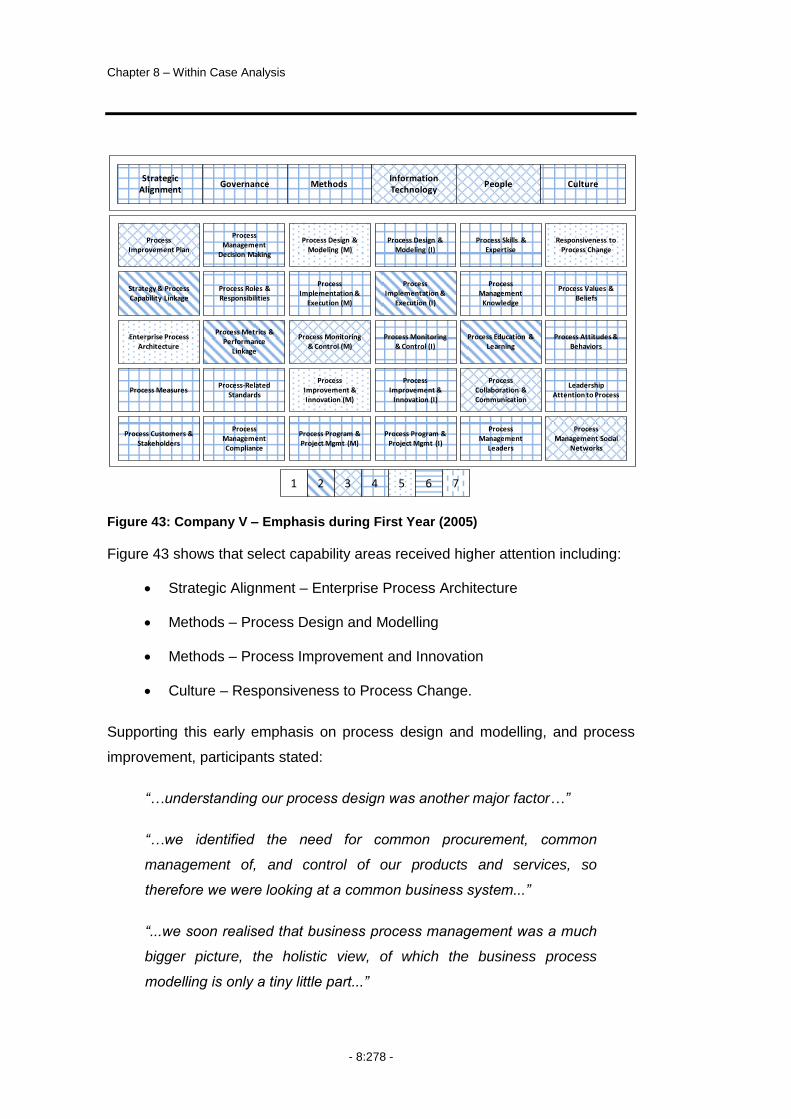
Chapter 8 – Within Case Analysis
- 8:278 -
Figure 43: Company V – Emphasis during First Year (2005)
Figure 43 shows that select capability areas received higher attention including:
Strategic Alignment – Enterprise Process Architecture
Methods – Process Design and Modelling
Methods – Process Improvement and Innovation
Culture – Responsiveness to Process Change.
Supporting this early emphasis on process design and modelling, and process
improvement, participants stated:
“…understanding our process design was another major factor…”
“…we identified the need for common procurement, common
management of, and control of our products and services, so
therefore we were looking at a common business system...”
“...we soon realised that business process management was a much
bigger picture, the holistic view, of which the business process
modelling is only a tiny little part...”
Governance MethodsStrategic
AlignmentInformation Technology
People Culture
Process-Related Standards
Process Metrics & Performance
Linkage
Process Roles & Responsibilities
Process Management
Decision Making
Process Measures
Enterprise Process Architecture
Strategy & Process Capability Linkage
Process Improvement Plan
Process Customers & Stakeholders
Process Monitoring & Control (M)
Process Implementation &
Execution (M)
Process Design & Modeling (M)
Process Monitoring & Control (I)
Process Implementation &
Execution (I)
Process Design & Modeling (I)
Process Education & Learning
Process Management
Knowledge
Process Skills & Expertise
Process Attitudes & Behaviors
Process Values & Beliefs
Responsiveness to Process Change
Process Program & Project Mgmt (M)
Process Improvement & Innovation (M)
Process Program & Project Mgmt (I)
Process Improvement &
Innovation (I)
Process Management
Leaders
Process Collaboration & Communication
Leadership Attention to Process
Process Management Social
Networks
Process Management Compliance
1 2 3 4 5 6 7

Business Process Management: Progression and Maturity
- 8:279 -
These statements showed that although Company V focused early efforts on
business process modelling and improvement activities they soon recognised
that process modelling was only a part of what contemporary BPM practice could
entail.
Figure 43 also shows that greater variance occurred at the level of capability
areas than was evident at the factor level. In the Strategic Alignment factor, for
example, the emphasis placed on the capability area of Enterprise Process
Architecture was rated 5 on a 7-point scale with 7 being the highest level of
emphasis. Conversely, within the same factor, the emphasis on the capability
area of Strategy and Process Capability Linkage was lower, being just 2. Table
73 shows the difference in range within each factor and across the capability
areas.
Factor Average Score
Range in Emphasis
on Capability
Areas
Least Emphasised Capability
Area
Most Emphasised Capability
Area
Strategic Alignment 4.0 2.2 2.8 5.0
Governance 4.1 2.2 2.6 4.8
Methods 4.5 2.8 3.0 5.8
Information Technology 3.9 2.2 2.6 4.8
People 3.7 1.8 2.6 4.4
Culture 4.5 1.6 3.4 5.0
Range in Factors 0.8
Table 73: Company V – First Year Range in Emphasis
This table confirms that the range across the factors (i.e. 0.8) was significantly
less that the range evident within each of the factors, being between 1.6 and 2.8.
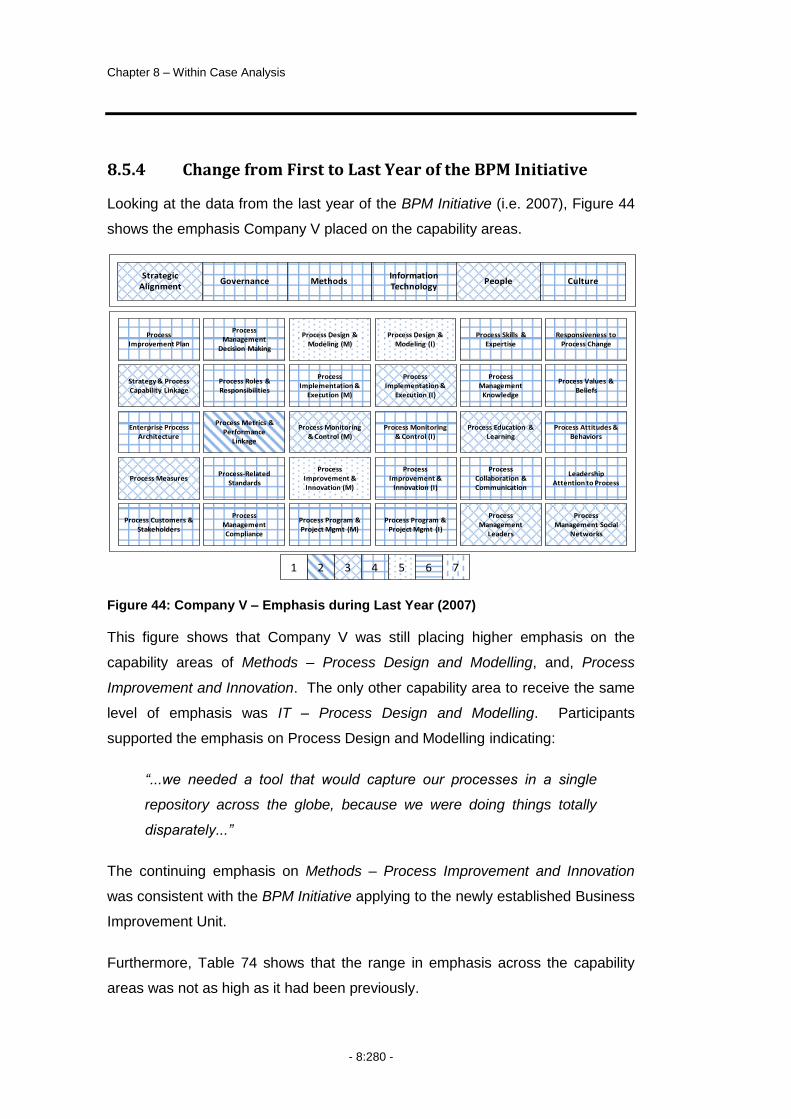
Chapter 8 – Within Case Analysis
- 8:280 -
8.5.4 Change from First to Last Year of the BPM Initiative
Looking at the data from the last year of the BPM Initiative (i.e. 2007), Figure 44
shows the emphasis Company V placed on the capability areas.
Figure 44: Company V – Emphasis during Last Year (2007)
This figure shows that Company V was still placing higher emphasis on the
capability areas of Methods – Process Design and Modelling, and, Process
Improvement and Innovation. The only other capability area to receive the same
level of emphasis was IT – Process Design and Modelling. Participants
supported the emphasis on Process Design and Modelling indicating:
“...we needed a tool that would capture our processes in a single
repository across the globe, because we were doing things totally
disparately...”
The continuing emphasis on Methods – Process Improvement and Innovation
was consistent with the BPM Initiative applying to the newly established Business
Improvement Unit.
Furthermore, Table 74 shows that the range in emphasis across the capability
areas was not as high as it had been previously.
Governance MethodsStrategic
AlignmentInformation Technology
People Culture
Process-Related Standards
Process Metrics & Performance
Linkage
Process Roles & Responsibilities
Process Management
Decision Making
Process Measures
Enterprise Process Architecture
Strategy & Process Capability Linkage
Process Improvement Plan
Process Customers & Stakeholders
Process Monitoring & Control (M)
Process Implementation &
Execution (M)
Process Design & Modeling (M)
Process Monitoring & Control (I)
Process Implementation &
Execution (I)
Process Design & Modeling (I)
Process Education & Learning
Process Management
Knowledge
Process Skills & Expertise
Process Attitudes & Behaviors
Process Values & Beliefs
Responsiveness to Process Change
Process Program & Project Mgmt (M)
Process Improvement & Innovation (M)
Process Program & Project Mgmt (I)
Process Improvement &
Innovation (I)
Process Management
Leaders
Process Collaboration & Communication
Leadership Attention to Process
Process Management Social
Networks
Process Management Compliance
1 2 3 4 5 6 7

Business Process Management: Progression and Maturity
- 8:281 -
Factor Average Score
Range in Emphasis
on Capability
Areas
Least Emphasised Capability
Area
Most Emphasised Capability
Area
Strategic Alignment 3.9 1.5 3.0 4.5
Governance 4.2 1.9 2.8 4.7
Methods 4.5 2.4 3.3 5.7
Information Technology 4.6 2.0 3.7 5.7
People 3.9 1.5 3.0 4.5
Culture 4.0 1.2 3.3 4.5
Range in Factors 0.7
Table 74: Company V – Last Year Range in Emphasis
This table shows that the range in capability areas for the Methods and IT factors
varied more than for other factors. These two factors also included the most
emphasised capability areas during the last year.
Change in Emphasis from First Year to Last Year
Figure 45 shows the change in emphasis in capability areas for Company V.
Figure 45: Company V – Change in Emphasis on Capability Areas
This figure shows that for a number of capability areas the emphasis decreased
from the first year to the last year. One source of the decrease was the
impending sale of the organisation. Participants commented on the effect of this
sale in relation to the progression of the BPM Initiative stating:
-0.30-0.20-0.100.000.100.200.300.400.50
PIP
S&P
L
EPA
PM
PC
&S
PM
DM
PR
&R
PM
&P
L
PR
S
PM
C
PD
&M
PE&
I
PM
&C
PI&
I
PM
gt
PD
&M
-IT
PI&
E -
IT
PM
&C
-IT
PI&
I -IT
PM
gt -
IT
PS&
E
PM
K
PE&
L
PC
&C
PM
L
RTP
C
PV
&B
PA
&B
LATP
PM
SNStrategic Alignment Governance Methods
Information Technology People Culture
Company V Change
Chapter 8 – Within Case Analysis
- 8:282 -
“...because you‟ve got this culture saying, we‟re getting bought and
we don‟t even know if we keep modelling, we don‟t know if we‟re
going to keep going forward with business process management and
with process owners, the process owners were becoming very much
disengaged and it was a waiting game in a way...”
The Strategic Alignment capability area of Process Improvement Planning also
received an increase in emphasis over time. Comments by participants that
provided insights into this increase in emphasis included:
“...we looked to address issues such as how do we harness all of this,
how do we bring this all together and using our limited resources to
address these problems in a consistent manner...”
“...but we prioritised them so that we could work on the first 4 or 5 so
we wouldn‟t stretch our resources and we‟d be able to go forward and
rectify them...”
These comments showed that Company V focused on improving the planning
and prioritisation of their project in response to resource restrictions and the
desire to balance resources with progression.
Other areas to receive increasing emphasis over time were education and
communication. Participants stated:
“...we were trying to bring everything into one global organisation, so
having seen that I realised that we needed to start educating the
business...”
“...motivation and communication was lacking and we needed to
communicate it a lot more and lot clearer...”
This highlighted the deliberate emphasis put on these areas and indicated that
companies choose to place emphasis on particular capability areas based on the
specific needs of the company and the views of decision makers at a given point
in time.

Business Process Management: Progression and Maturity
- 8:283 -
8.5.5 Discussion on Progression of the BPM Initiative
In discussing the progression of the BPM Initiative, Participants made key points
regarding:
Change in company ownership
Operating in a global environment
Potential relationship between capability areas.
Further details are in the following sections.
Change in Company Ownership
In 2006, what was Company V in this case study was a stand-alone company
with a team in the Asia-Pacific region undertaking a BPM Initiative with solid
support from executives. Early in 2007, the owners of the company separated
and sold the Asia-Pacific business. Thus, Company V became a wholly owned
subsidiary of another company. This change in ownership affected the
progression of the BPM Initiative. Participants indicated:
“...at this point that we knew we were being purchased, everything
went on, I wouldn‟t say hold but, there was a drastic slow down...”
“...how do you take on an acquisition? When somebody‟s acquiring
you, you‟ve got buy in, you‟ve got momentum and all of a sudden it
seems like they‟ve got a different agenda and they‟re not sure of that
agenda and uncertainty develops further uncertainty and you sit there
waiting and playing a waiting game, not really going forward driving...”
These statements showed that the impending change in ownership caused a
significant period of instability and inactivity in what was an active BPM Initiative.
This provided an example of how changes in the contextual environment of an
organisation can influence progression.

Chapter 8 – Within Case Analysis
- 8:284 -
Operating in a Global Environment
Company V was a global company operating in a legislatively controlled
environment. With regard to locations, a participant indicated:
“...one of the huge, huge problems we‟ve had is that we tried to be a
global organisation, obviously we‟ve got operations in Brisbane,
we‟ve got operations in Newcastle, Singapore. We‟ve got operations
in Cheltenham, Wolverhampton, Wellington. We‟ve got operations in
7 US towns as well...”
Within this geographic dispersion, common processes had to comply with
different legislative requirements. Participants indicated that:
“...to get standard global processes would be very difficult not only
due to a lack of a common business system but also due to the
countries having different laws, different regulations, especially in the
Aerospace industry (…) Europe is governed by a European Air Safety
Agency and the US is governed by the Federal Aviation Authority, so
to get common processes is very difficult...”
“...issues we have like legal policies and things like FAA policies and
CAA...”
“...that‟s just part of the civil aviation regulations, so that presented its
own problems in how we control this...”
Such comments indicated the potential for differences in global organisations as
they face increased complexity due to different legislation applying in different
regions.
Potential Relationships between Capability areas
In addition to showing that the emphasis on capability areas could decrease, the
case study with Company V provided evidence of the potential for a sequential
relationship between the capability areas. One participant indicated:

Business Process Management: Progression and Maturity
- 8:285 -
“...some of the areas directly impacted on others (…) if you were
focused on one particular area of IT (…) you also had to have some
element of maturity within the people and your culture (…) which
would make your implementation of the IT program a lot easier…”
Comments such as this raise two points (1) that a temporal sequence may exist
between some capability areas and (2) that a causal relationship may exist
between some capability areas.
8.5.6 Company V Summary
Company V commenced its BPM Initiative in 2005 with a view to improving its
service delivery processes. The initial BPM Initiative was an ad hoc, project base
approach to improving processes. There was moderate-high Executive Buy-In to
the BPM Initiative.
During early stages of the BPM Initiative, Company V realised that BPM could be
more than just modelling and improving processes. Consequently, Company V
established a recognised Business Improvement Unit operating as a specialist
BPM team with a view to expanding the BPM Initiative within the company.
Early in 2007, Company V had a change in ownership structure that acted to
slow down the progress of the BPM Initiative. At the time of the case study, the
Executive Buy-In remained at the same level. The emphasis placed on a number
of capability areas decreased however, as Company V put some BPM activities
on hold during the buy-out of the company.
The case study with Company V showed the negative affect of a change in
contextual variables, the potential for complexity introduced by global operations
and the potential for sequential, temporal, and directional relationships between
the capability areas within the BPM Capability Framework.

Chapter 8 – Within Case Analysis
- 8:286 -
8.6 Case 5 – Company W
Company W was an operational area within a Department of the Queensland
State Government that included administrative, technical and professional staff.
The primary purpose of Company W was to provide services to the people of
Queensland by managing operations effectively and efficiently whilst ensuring
independence of information provision. The demographics of Company W are
summarised in Table 75.
Company W Details
Headquarters Brisbane
Industry Community Services
Annual Gross Turnover N/A
Employees 1200
Sector Public
Ownership Structure Agency of State Government Department
Table 75: Company W – Company Demographics
8.6.1 Participants in Study
The case study with Company W occurred over the period from December 2007
to March 2008. The Key Contact from Company W invited participants to the
study based on knowledge of the individuals and their involvement and
understanding of the BPM Initiative. The details of participants for Company W
are set out in Table 76.

Business Process Management: Progression and Maturity
- 8:287 -
Participants Position Position Level
101
Years with
Company
Involvement with BPMI
Participant 1
102
Business Process Management Advisor
T 1 Current, strong knowledge of history
Participant 2 Business Process Expert
S 28 Current, strong knowledge of history
Participant 3 Business Expert O 37 Current, since beginning
Participant 4 Information Architect S 1.5 + prior
Current, strong knowledge of history
Participant 5 Business Expert T 18 Current, strong knowledge of history
Participant 6 Deputy Director – Courts
S,T,O 2 Current, strong knowledge of history
Participant 7 Team Leader O 18 Current, limited knowledge of history
Participant 8 Team Leader O 14 Current, strong knowledge of history
Participant 9 Director of Courts S 1 + 20yrs prior
Current, since beginning
Table 76: Company W – Participant Details
Table 76 shows that one of the nine participants held strategic, tactical and
operational roles; three held strategic roles; three held operational roles; and two
held tactical roles. All participants were involved in the BPM Initiative at the time
of the case study, with two having been involved with the BPM Initiative since the
beginning. All participants had a strong knowledge of the history of the BPM
Initiative except for one. The remaining participant had a limited understanding
of the BPM Initiative.
101
S=Strategic, T=Tactical, O=Operational.
102 Participant 1 was the Key Contact for the case study with Company W.
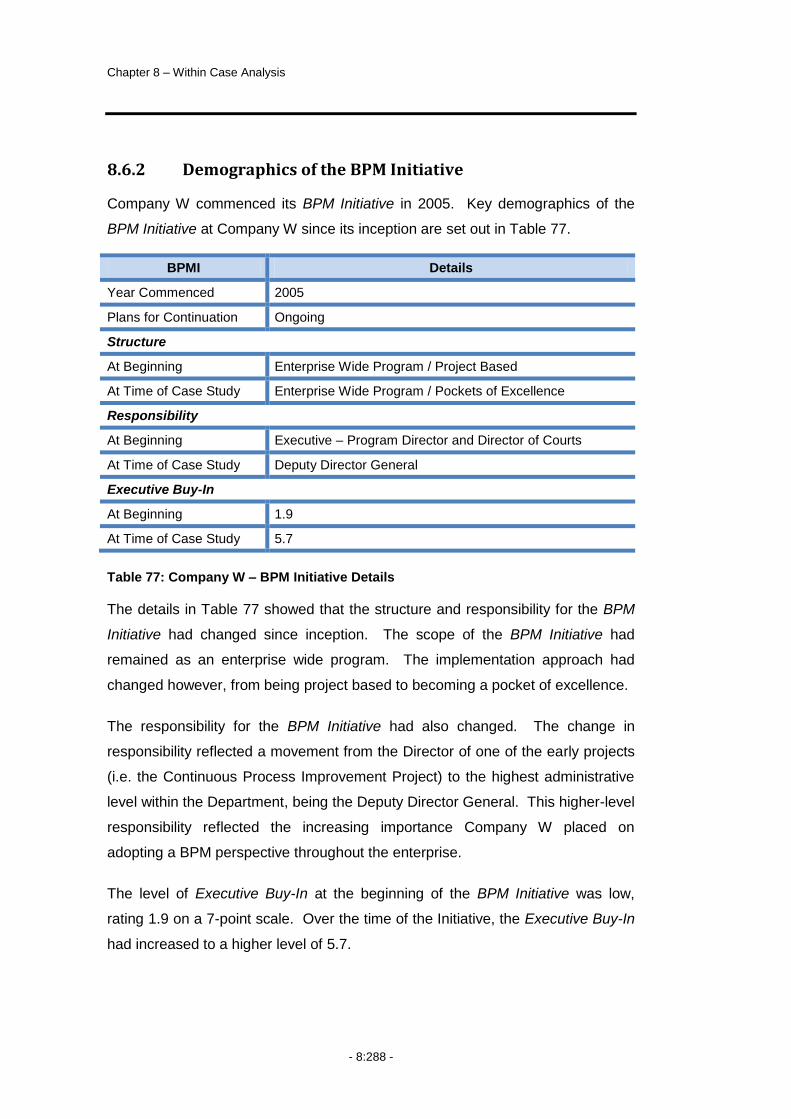
Chapter 8 – Within Case Analysis
- 8:288 -
8.6.2 Demographics of the BPM Initiative
Company W commenced its BPM Initiative in 2005. Key demographics of the
BPM Initiative at Company W since its inception are set out in Table 77.
BPMI Details
Year Commenced 2005
Plans for Continuation Ongoing
Structure
At Beginning Enterprise Wide Program / Project Based
At Time of Case Study Enterprise Wide Program / Pockets of Excellence
Responsibility
At Beginning Executive – Program Director and Director of Courts
At Time of Case Study Deputy Director General
Executive Buy-In
At Beginning 1.9
At Time of Case Study 5.7
Table 77: Company W – BPM Initiative Details
The details in Table 77 showed that the structure and responsibility for the BPM
Initiative had changed since inception. The scope of the BPM Initiative had
remained as an enterprise wide program. The implementation approach had
changed however, from being project based to becoming a pocket of excellence.
The responsibility for the BPM Initiative had also changed. The change in
responsibility reflected a movement from the Director of one of the early projects
(i.e. the Continuous Process Improvement Project) to the highest administrative
level within the Department, being the Deputy Director General. This higher-level
responsibility reflected the increasing importance Company W placed on
adopting a BPM perspective throughout the enterprise.
The level of Executive Buy-In at the beginning of the BPM Initiative was low,
rating 1.9 on a 7-point scale. Over the time of the Initiative, the Executive Buy-In
had increased to a higher level of 5.7.

Business Process Management: Progression and Maturity
- 8:289 -
At the time of commencing its BPM Initiative, Company W was experiencing a
range of issues including staff working in silos, not understanding how they fitted
into the bigger picture, high error rate, significant duplication, limited (and at times
unprofessional) service and had limited capability to grow or develop capability or
capacity. When discussing the drivers of the BPM Initiative, one participant
stated it was about:
“...getting honest with ourselves about the fact that there was a real
need for substantial change, and that the way we were running our
business at that point in time was unsustainable and making
everybody pretty unhappy, there was low morale and the staff were
working in some pretty unsatisfactory conditions. There was no
thought to line management, our communications were a mess, our
statistics were a mess...”
Consequently, the goals of the BPM Initiative were to improve business
processes and workflows, focus on customer service, improve internal and
external communications, improve the use of information technology and
management, amend legislation and policy (where necessary) and review the
organisational structure to improve workflows.
The next sections detail the emphasis placed on the capability areas during the
first and last years of the BPM Initiative.
8.6.3 First Year of the BPM Initiative
Figure 46 shows the emphasis placed on each capability area in the first year of
the BPM Initiative.
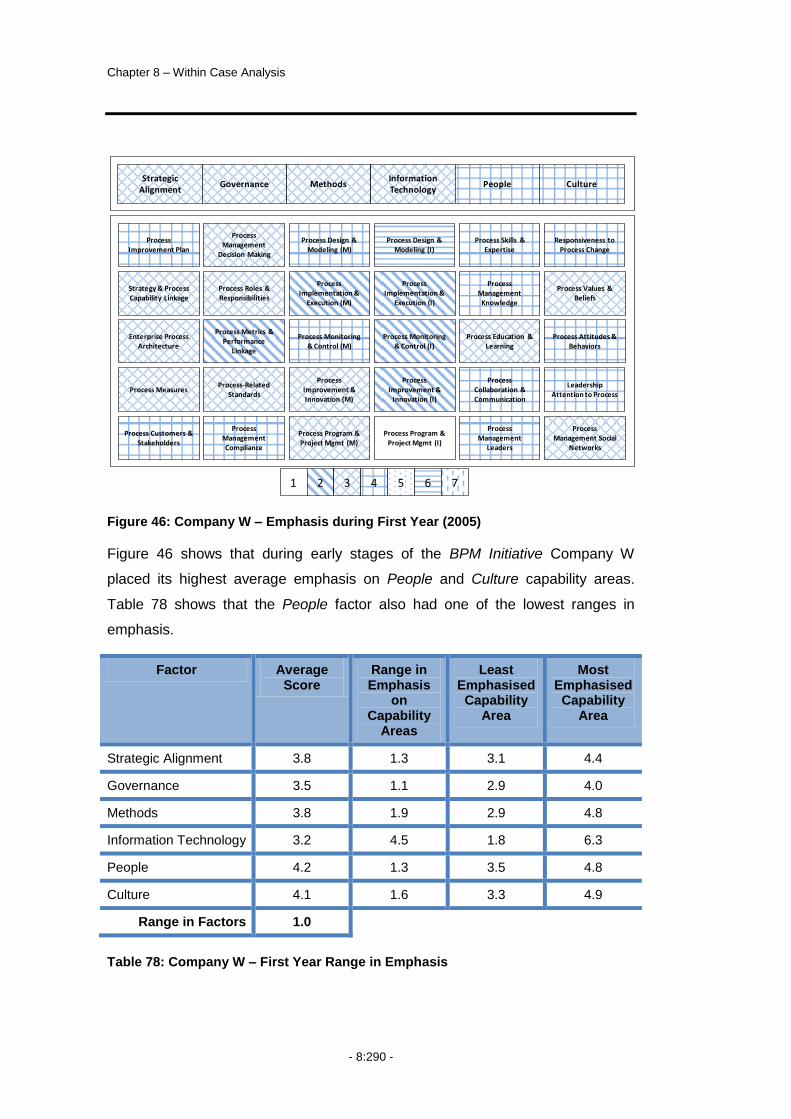
Chapter 8 – Within Case Analysis
- 8:290 -
Figure 46: Company W – Emphasis during First Year (2005)
Figure 46 shows that during early stages of the BPM Initiative Company W
placed its highest average emphasis on People and Culture capability areas.
Table 78 shows that the People factor also had one of the lowest ranges in
emphasis.
Factor Average Score
Range in Emphasis
on Capability
Areas
Least Emphasised Capability
Area
Most Emphasised Capability
Area
Strategic Alignment 3.8 1.3 3.1 4.4
Governance 3.5 1.1 2.9 4.0
Methods 3.8 1.9 2.9 4.8
Information Technology 3.2 4.5 1.8 6.3
People 4.2 1.3 3.5 4.8
Culture 4.1 1.6 3.3 4.9
Range in Factors 1.0
Table 78: Company W – First Year Range in Emphasis
Governance Methods
Strategic Alignment
Information Technology
People Culture
Process-Related Standards
Process Metrics & Performance
Linkage
Process Roles & Responsibilities
Process Management
Decision Making
Process Measures
Enterprise Process Architecture
Strategy & Process Capability Linkage
Process Improvement Plan
Process Customers & Stakeholders
Process Monitoring & Control (M)
Process Implementation &
Execution (M)
Process Design & Modeling (M)
Process Monitoring & Control (I)
Process Implementation &
Execution (I)
Process Design & Modeling (I)
Process Education & Learning
Process Management
Knowledge
Process Skills & Expertise
Process Attitudes & Behaviors
Process Values & Beliefs
Responsiveness to Process Change
Process Program & Project Mgmt (M)
Process Improvement & Innovation (M)
Process Program & Project Mgmt (I)
Process Improvement &
Innovation (I)
Process Management
Leaders
Process Collaboration & Communication
Leadership Attention to Process
Process Management Social
Networks
Process Management Compliance
1 2 3 4 5 6 7

Business Process Management: Progression and Maturity
- 8:291 -
Evidence from interviews supporting the early emphasis of People included
comments such as:
“...without working up the people, without starting to develop the
people, or making that a goal up front or making that a priority up
front, I don‟t think it would ever have succeeded...”
“...building capability within the organisation that again, such that the
organisation could own its own growth and progress its own growth,
and grow its own staff and grow its own expertise and
professionalism up...”
Participants indicated a necessity to overcome a lack of understanding about
process in order to progress, making comments such as:
“...having to overcome a profound level of organisational
immaturity...”
“...lack of organisational understanding about business process
improvement generally...”
This reflected in the emphasis placed on developing capability areas in the
Culture factor.
Despite the high emphasis on the People and Culture factors, Table 78 shows
that the capability area receiving the greatest emphasis was from the IT factor,
being IT – Process Design and Modelling. The early emphasis on IT for process
modelling reflected in participants stating that the initial focus of the BPM
Initiative was:
“...initially (...) doing some process modelling...”
The emphasis on process modelling was also evident in the Continuous Process
Improvement Project being the recognised starting point of the BPM Initiative
within Company W.

Chapter 8 – Within Case Analysis
- 8:292 -
8.6.4 Change from First to Last Year of the BPM Initiative
Figure 47 shows the emphasis placed on each capability area in the last year of
the BPM Initiative.
Figure 47: Company W – Emphasis during Last Year (2007)
Figure 47 shows a high emphasis on capability areas from the People factor with
four of the five capability areas receiving an average emphasis of 6 on a 7- point
scale. Other capability areas receiving an average emphasis score of 6 included:
Governance – Process Decision Making
Methods – Process Design and Modelling
IT – Process Design and Modelling
Culture – Leadership Attention to Process.
The Strategic Alignment factor was notable for the consistent emphasis placed
on its capability areas with all five receiving an average emphasis of between 5.0
and 5.8. This reflected in the factor having the lowest range in emphasis during
the last year, as seen in Table 79.
Governance MethodsStrategic
AlignmentInformation Technology
People Culture
Process-Related Standards
Process Metrics & Performance
Linkage
Process Roles & Responsibilities
Process Management
Decision Making
Process Measures
Enterprise Process Architecture
Strategy & Process Capability Linkage
Process Improvement Plan
Process Customers & Stakeholders
Process Monitoring & Control (M)
Process Implementation &
Execution (M)
Process Design & Modeling (M)
Process Monitoring & Control (I)
Process Implementation &
Execution (I)
Process Design & Modeling (I)
Process Education & Learning
Process Management
Knowledge
Process Skills & Expertise
Process Attitudes & Behaviors
Process Values & Beliefs
Responsiveness to Process Change
Process Program & Project Mgmt (M)
Process Improvement & Innovation (M)
Process Program & Project Mgmt (I)
Process Improvement &
Innovation (I)
Process Management
Leaders
Process Collaboration & Communication
Leadership Attention to Process
Process Management Social
Networks
Process Management Compliance
1 2 3 4 5 6 7

Business Process Management: Progression and Maturity
- 8:293 -
Factor Average Score
Range in Emphasis
on Capability
Areas
Least Emphasised Capability
Area
Most Emphasised Capability
Area
Strategic Alignment 5.3 0.8 5.0 5.8
Governance 4.9 2.9 3.1 6.0
Methods 5.2 2.6 3.6 6.2
Information Technology 4.4 2.6 3.8 6.4
People 6.1 0.9 5.7 6.6
Culture 5.6 1.3 4.9 6.2
Range in Factors 1.7
Table 79: Company W – Last Year Range in Emphasis
Supporting the continuing focus on the People factor, participants commented on
the need to recognise process skills, indicating a focus on:
“...thinking carefully about how we recruited and what the skill base
was and the aptitudes that we really needed...”
“...giving staff skills to be able to know their own processes and do
them...”
Similarly, participants highlighted the role of training stating:
“...the mentoring of staff and staff training and having a cohesive
management team here...”
“…everything is incremental, even the training, the team leaders got
on board, they got particular training up front (…) and there‟ll be more
training later, so it‟s not trying to do everything with a big bang but
just knowing that it takes time to grow a garden...”
These statements show that Company W placed emphasis on continuing to
develop staff internally, using iterative training and mentoring as a means of
enhancing existing skills and expertise.

Chapter 8 – Within Case Analysis
- 8:294 -
Participants indicated changes in the working environment, stating:
“...we‟re really supportive of each other, it‟s treated as a safe
environment, so people can get up and say what they need to and
they‟re not going to hear it somewhere else, so there‟s respect...”
“...absolute honesty and integrity, our willingness to embrace what
comes along (…) that sense of your co worker should be able to
know that there is a degree of consideration and respect and
reliability that they can have of you and that you bring to the table,
and you should be able to understand the same is given to you...”
Such statements were indicative of Company W‟s continuing emphasis on
developing capabilities that supported working in a collaborative environment.
The consequence of this emphasis on Company W was evident in comments
including:
“...there is no way that it could go back to what it was. It couldn‟t, it
actually couldn‟t. Like it‟s too different, the structure has altered...”
“...there‟s been so much influx of new talent that I think it would be
hard. I think that there has been an irrevocable change culturally...”
These comments show that the high emphasis on the People and Culture factors
resulted in significant changes to the working environment, with an aim to embed
BPM within Company W.
Change in Emphasis from First Year to Last Year
The change in emphasis on the capability areas from 2005 to 2007 is set out in
Figure 48.

Business Process Management: Progression and Maturity
- 8:295 -
Figure 48: Company W – Change in Emphasis on Capability Areas
This shows that two capability areas (1) IT – Process Project and Program
Management and (2) Governance – Decision Making Processes received the
largest increase in emphasis. The capability area of IT – Process Design and
Modelling consistently received high attention, being one of the most emphasised
areas in the first and last year and reflecting little change over time.
8.6.5 Discussion on Progression of the BPM Initiative
In discussing the progression of the BPM Initiative, participants made key points
regarding:
Making deliberate choices to match progression to contextual
environment
Having periods of heightened activity amongst periods of stability
Distinction between Executive Buy-In and Leadership.
Further details are in the following sections.
Matching Progression to Contextual Environment
When discussing the progression of the BPM Initiative, participants commented
on the need to make choices to suit the needs and situation of the company,
stating:
“...the choices that we made in terms of foundation decisions were
the right ones, for us and I‟d stand by them...”
0.00
0.20
0.40
0.60
0.80
1.00
1.20
PIP
S&P
L
EPA
PM
PC
&S
PM
DM
PR
&R
PM
&P
L
PR
S
PM
C
PD
&M
PE&
I
PM
&C
PI&
I
PM
gt
PD
&M
-IT
PI&
E -
IT
PM
&C
-IT
PI&
I -IT
PM
gt -
IT
PS&
E
PM
K
PE&
L
PC
&C
PM
L
RTP
C
PV
&B
PA
&B
LATP
PM
SN
Strategic Alignment Governance Methods
Information Technology People Culture
Company W Change
Chapter 8 – Within Case Analysis
- 8:296 -
“...we were undertaking renovations such that a house couldn‟t be the
same again and that by immediately changing your environment you
were immediately laying a platform for your growth, so they were the
choices we made. Other people would‟ve made other choices
depending on what their needs were, but they were our needs so that
was one contextual issue...”
These statements showed that, for Company W, progression of the BPM
Initiative came from making deliberate choices that suited the contextual situation
of the company. The comments also acknowledged that such choices might not
have been appropriate for all companies.
Periods of Heightened Activity amongst Periods of Stability
Other participants reflected on the need to work continually to progress the BPM
Initiative, stating:
“...it‟s not a risk but it certainly could be, that is not being complacent
about it and ensuring that, even when we‟re tired, making sure we still
take gentle steps, step by step by step by step and even when we‟re
really stretched, making sure we‟re still making an investment in
ourselves...”
“...you still have to put your energy in, it‟s not just being carried along
on a river, you actually have to put in energy and so there‟ll be times
when you have to really swim fast and there will be times you will be
carried (...) it‟s a multi-layered process…”
These comments showed the necessity of applying the notion of continual
improvement to the Initiative itself and not just to the processes to which BPM
applied. They also show that, over time, there will be periods of heightened
activity and other times when activity will slow down.

Business Process Management: Progression and Maturity
- 8:297 -
Executive Buy-In and Leadership
With regard to the impediments to the progression of the BPM Initiative,
participants commented on the lack of experience and understanding from
executives stating:
“...it was buy-in (...) but it was tacit support and encouragement as
opposed to actual, real hands on rigour and vigour, so that was
another really big, that was a really big problem for us...”
“...A lack of buy in, in the sense that they did not, because of the lack
of understanding they didn‟t have a really good feeling about what
could‟ve been achieved, so they (…) didn‟t take up the initiative they
left it for others to do...”
This showed that Executive Buy-In for the BPM Initiative was, by itself,
insufficient for progression. Additional comments with regard to the leadership of
the BPM Initiative showed however, that it was the ownership of the BPM
Initiative implementation by individual executives that saw it progress. In support
of this, participants indicated:
“...someone needed to own it and go, this is the direction and this is
where we‟re moving, (…) without the executive being, and I mean in
terms of the whole leadership team being absolutely zealous about
pushing that forward, it would not have happened...”
“...without the vigour and drive from this role (…) it‟s the fact that
without it being driven from somewhere, and by someone, it would
not have happened...”
These comments showed that in itself Executive Buy-In was insufficient to
progress the BPM Initiative within Company W. The combination of active and
involved participation of executives, with the authority and power to instigate
change, and the broader support from other executives enabled progression.

Chapter 8 – Within Case Analysis
- 8:298 -
8.6.6 Company W Summary
Company W commenced its BPM Initiative in 2005 as an enterprise wide
program in response to a need to improve information availability and use. Over
the duration of the BPM Initiative, the implementation approach had changed
from a project-based approach to one using a recognised BPM team as a centre
of excellence. The progression of the BPM Initiative had seen movement of
responsibility for the BPM Initiative to the highest administrative position within
the Department. There had also been an increase in the level of Executive Buy-
In to the BPM Initiative, from 1.9 to a higher level of 5.7 on a 7-point scale.
In the first year of the BPM Initiative Company W focused on building capability in
the People and Culture factors, although the most highly emphasised capability
area during this time was IT – Process Design and Modelling. This was
consistent with the initial project that started the BPM Initiative being on the
modelling of processes.
Over the course of the BPM Initiative, the higher focus on People and Culture
capability areas continued. The areas receiving the largest change in emphasis
however were Governance – Process Management Decision Making and IT –
Project and Program Management.
The case study with Company W showed the need for Executive Buy-In but also
the importance of having dedicated (executive) leaders to drive the
implementation of the BPM Initiative. Other aspects that were important to the
progression of the BPM Initiative within Company W were (1) the need to match
progression to the specifics of company and (2) the ebb and flow of activity, with
periods of stable progression interspersed with heightened periods of activity.
8.7 Chapter Summary
This chapter presented the BPM Initiatives of the five companies that participated
in the longitudinal study. Presenting the cases separately provided a deeper
understanding of the BPM Initiatives for each company.

Business Process Management: Progression and Maturity
- 8:299 -
The Researcher used a standard format across all five companies, first
presenting the demographics of the company, the participants and the BPM
Initiative. Next, there was a review of the emphasis placed on the capability
areas of the BPM Capability Framework in the first and last years, and the
change in emphasis between these two points. Following this there was a
discussion of three key findings arising from each of the companies. The final
section for each case concluded with a summary of BPM Initiative.
The subsequent chapter details the cross case analysis and findings from the
longitudinal case studies with these five companies.

Business Process Management: Progression and Maturity
- 9:301 -
9 Comparative Case Analysis
hen investigating the progression of BPM, it is important to
consider how journeys compare and contrast across different
organisations. This improves the generalisability of subsequent
theory. Questions the Researcher will answer in this chapter include:
What aspects are common among the five case studies?
What is different?
Where do the consistencies and inconsistencies come from?
What do they mean?
These questions will be answered through the comparison and contrasting of the
five case studies presented in the previous chapter.
9.1 Chapter Overview
The structure of this chapter is as follows. Section 2 presents a summary of the
demographics of the five cases and their BPM Initiatives. Section 3 provides an
in-depth investigation of the first year of the BPM Initiatives, using the emphasis
the companies have placed on building capability as a basis of comparison and
contrast. Section 4 includes a similar investigation of the last year of the BPM
Initiatives. Section 5 considers the relative change in emphasis between the two
points of first and last year. Section 6 summarises the key themes from the
cross-case analysis. Section 7 concludes with a summary of the chapter.
W
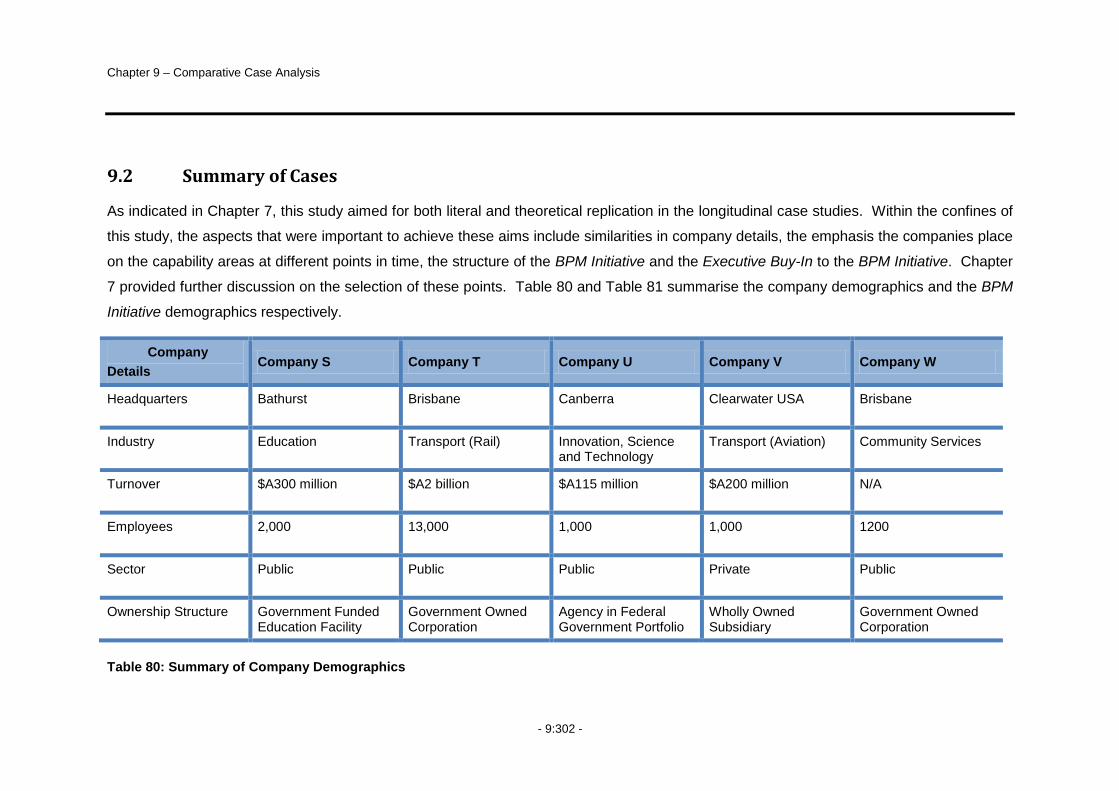
Chapter 9 – Comparative Case Analysis
- 9:302 -
9.2 Summary of Cases
As indicated in Chapter 7, this study aimed for both literal and theoretical replication in the longitudinal case studies. Within the confines of
this study, the aspects that were important to achieve these aims include similarities in company details, the emphasis the companies place
on the capability areas at different points in time, the structure of the BPM Initiative and the Executive Buy-In to the BPM Initiative. Chapter
7 provided further discussion on the selection of these points. Table 80 and Table 81 summarise the company demographics and the BPM
Initiative demographics respectively.
Company
Details Company S Company T Company U Company V Company W
Headquarters Bathurst Brisbane Canberra Clearwater USA Brisbane
Industry Education Transport (Rail) Innovation, Science and Technology
Transport (Aviation) Community Services
Turnover $A300 million $A2 billion $A115 million $A200 million N/A
Employees 2,000 13,000 1,000 1,000 1200
Sector Public Public Public Private Public
Ownership Structure Government Funded Education Facility
Government Owned Corporation
Agency in Federal Government Portfolio
Wholly Owned Subsidiary
Government Owned Corporation
Table 80: Summary of Company Demographics
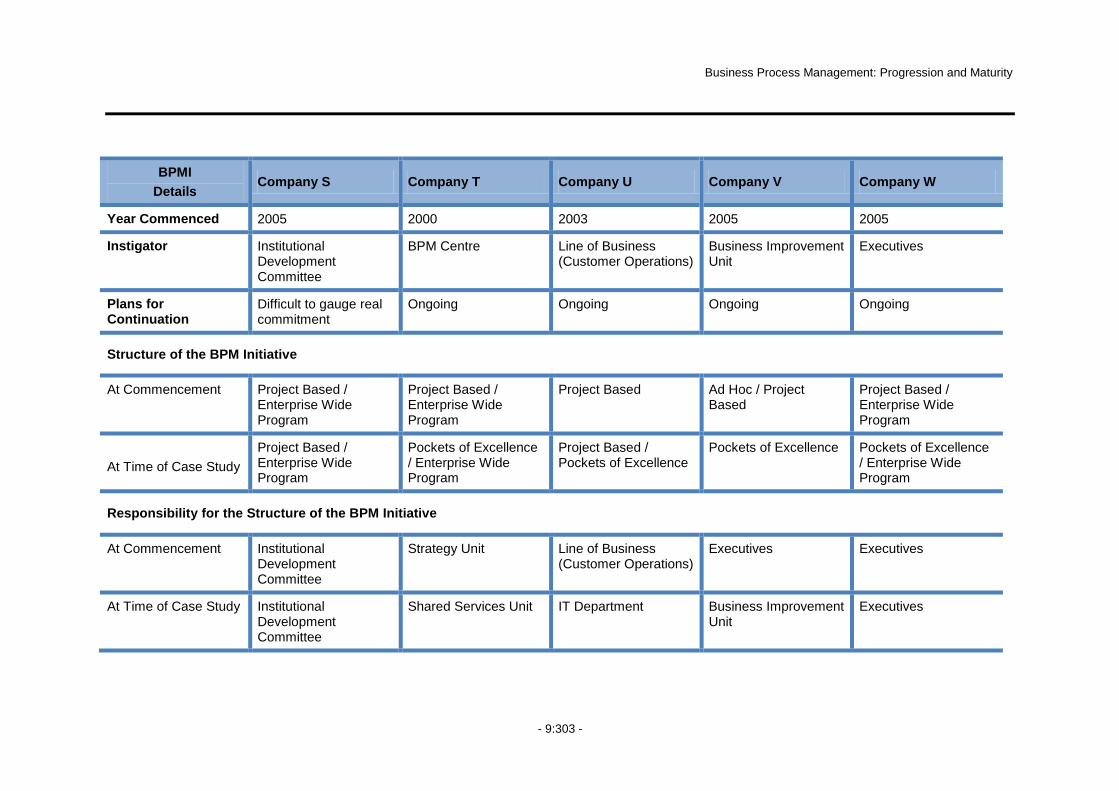
Business Process Management: Progression and Maturity
- 9:303 -
BPMI
Details Company S Company T Company U Company V Company W
Year Commenced 2005 2000 2003 2005 2005
Instigator Institutional Development Committee
BPM Centre Line of Business (Customer Operations)
Business Improvement Unit
Executives
Plans for Continuation
Difficult to gauge real commitment
Ongoing Ongoing Ongoing Ongoing
Structure of the BPM Initiative
At Commencement Project Based / Enterprise Wide Program
Project Based / Enterprise Wide Program
Project Based Ad Hoc / Project Based
Project Based / Enterprise Wide Program
At Time of Case Study
Project Based / Enterprise Wide Program
Pockets of Excellence / Enterprise Wide Program
Project Based / Pockets of Excellence
Pockets of Excellence Pockets of Excellence / Enterprise Wide Program
Responsibility for the Structure of the BPM Initiative
At Commencement Institutional Development Committee
Strategy Unit Line of Business (Customer Operations)
Executives Executives
At Time of Case Study Institutional Development Committee
Shared Services Unit IT Department Business Improvement Unit
Executives

Chapter 9 – Comparative Case Analysis
- 9:304 -
BPMI
Details Company S Company T Company U Company V Company W
Responsibility for the BPM Initiative
At Commencement Vice Chancellor Chief Strategy Officer General Manager – Customer Operations
President Program Director and Director of Courts
At Time of Case Study Vice Chancellor Group General Manager Shared Services
Chief Information Officer
President Deputy Director General
Executive Buy-In to the BPM Initiative
At Commencement 3.4 2.5 4.1 5.0 1.9
At Time of Case Study 4.8 3.2 4.3 5.0 5.7
Employee Support for the BPM Initiative
At Commencement 4.1 3.0 4.6 4.6 2.4
At Time of Case Study 4.8 4.1 4.7 4.8 4.8
Table 81: Summary of BPM Initiative Demographics
Business Process Management: Progression and Maturity
- 9:305 -
In the longitudinal studies, the Researcher measured the level of emphasis the
companies placed on the capability areas from the BPM Capability Framework at
two points in time. These two points were, the first year of the BPM Initiative for
each company, and the most recent year of the BPM Initiative at the time of the
case study (i.e. the last year). The Researcher collected this data using a survey
instrument completed by participants within each company103. Using this data,
the Researcher calculated the capability areas in the top and bottom quartile of
emphasis for each year, and the relative change in emphasis across the
capability areas between these two points.
Sections 9.3 and 9.4 detail the key findings arising from this investigation. The
structure of these two sections is as follows:
Section 9.x.1 provides a summary the capability areas appearing in the top
quartile for the five companies during the year. Next, the Researcher highlights
commonalities and differences between the companies and the capability areas
appearing in the top quartile.
Section 9.x.2 provides a summary the capability areas appear in the bottom
quartile for the five companies during the year. Next, the Researcher highlights
commonalities and differences between the companies and capability areas
appearing in the bottom quartile.
Section 9.x.3 analyses the commonalities and differences with regard to (1) the
structure of the BPM Initiatives and the level of Executive Buy-In and (2) the
factors and capability areas of the BPM Capability Framework during the year.
9.3 First Year Emphasis on Capability Areas
The Researcher selected the first year of each company‟s BPM Initiative in order
to explore how they commenced their BPM journey.
103
See Chapter 7 for further details.
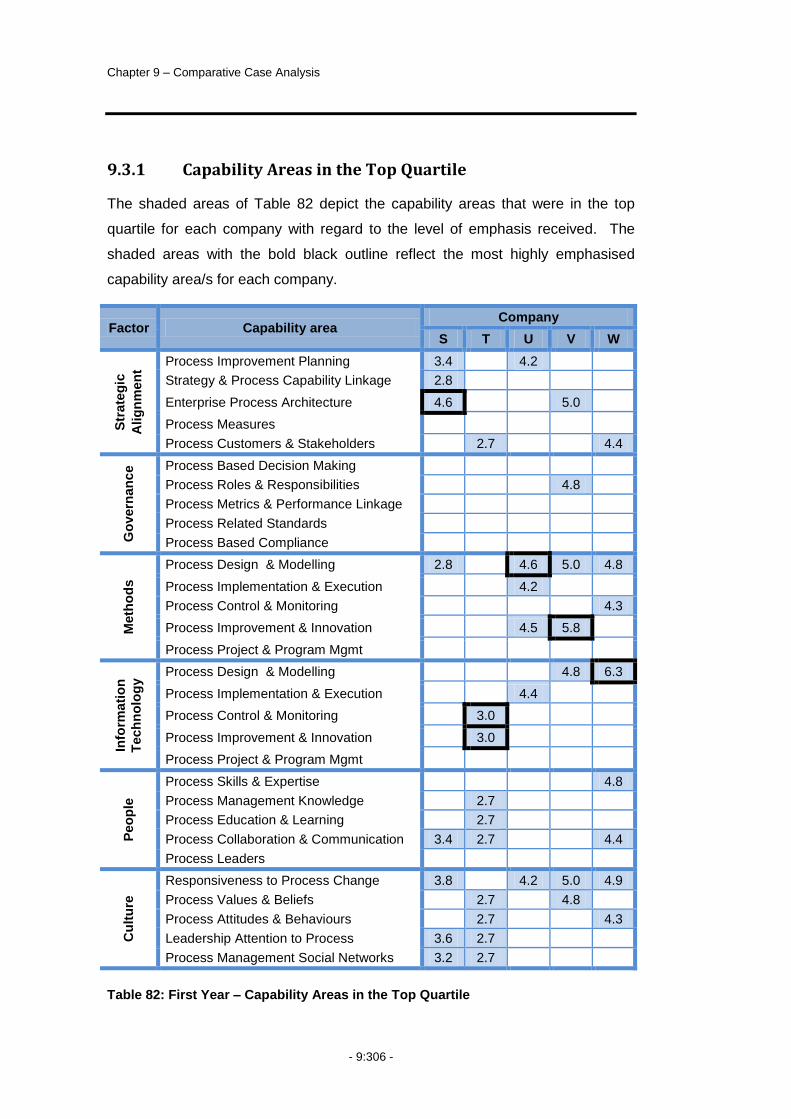
Chapter 9 – Comparative Case Analysis
- 9:306 -
9.3.1 Capability Areas in the Top Quartile
The shaded areas of Table 82 depict the capability areas that were in the top
quartile for each company with regard to the level of emphasis received. The
shaded areas with the bold black outline reflect the most highly emphasised
capability area/s for each company.
Factor Capability area Company
S T U V W
Str
ate
gic
Alig
nm
en
t
Process Improvement Planning 3.4 4.2
Strategy & Process Capability Linkage 2.8
Enterprise Process Architecture 4.6 5.0
Process Measures
Process Customers & Stakeholders 2.7 4.4
Go
vern
an
ce
Process Based Decision Making
Process Roles & Responsibilities 4.8
Process Metrics & Performance Linkage
Process Related Standards
Process Based Compliance
Meth
od
s
Process Design & Modelling 2.8 4.6 5.0 4.8
Process Implementation & Execution 4.2
Process Control & Monitoring 4.3
Process Improvement & Innovation 4.5 5.8
Process Project & Program Mgmt
Info
rmati
on
Tech
no
log
y Process Design & Modelling 4.8 6.3
Process Implementation & Execution 4.4
Process Control & Monitoring 3.0
Process Improvement & Innovation 3.0
Process Project & Program Mgmt
Peo
ple
Process Skills & Expertise 4.8
Process Management Knowledge 2.7
Process Education & Learning 2.7
Process Collaboration & Communication 3.4 2.7 4.4
Process Leaders
Cu
ltu
re
Responsiveness to Process Change 3.8 4.2 5.0 4.9
Process Values & Beliefs 2.7 4.8
Process Attitudes & Behaviours 2.7 4.3
Leadership Attention to Process 3.6 2.7
Process Management Social Networks 3.2 2.7
Table 82: First Year – Capability Areas in the Top Quartile
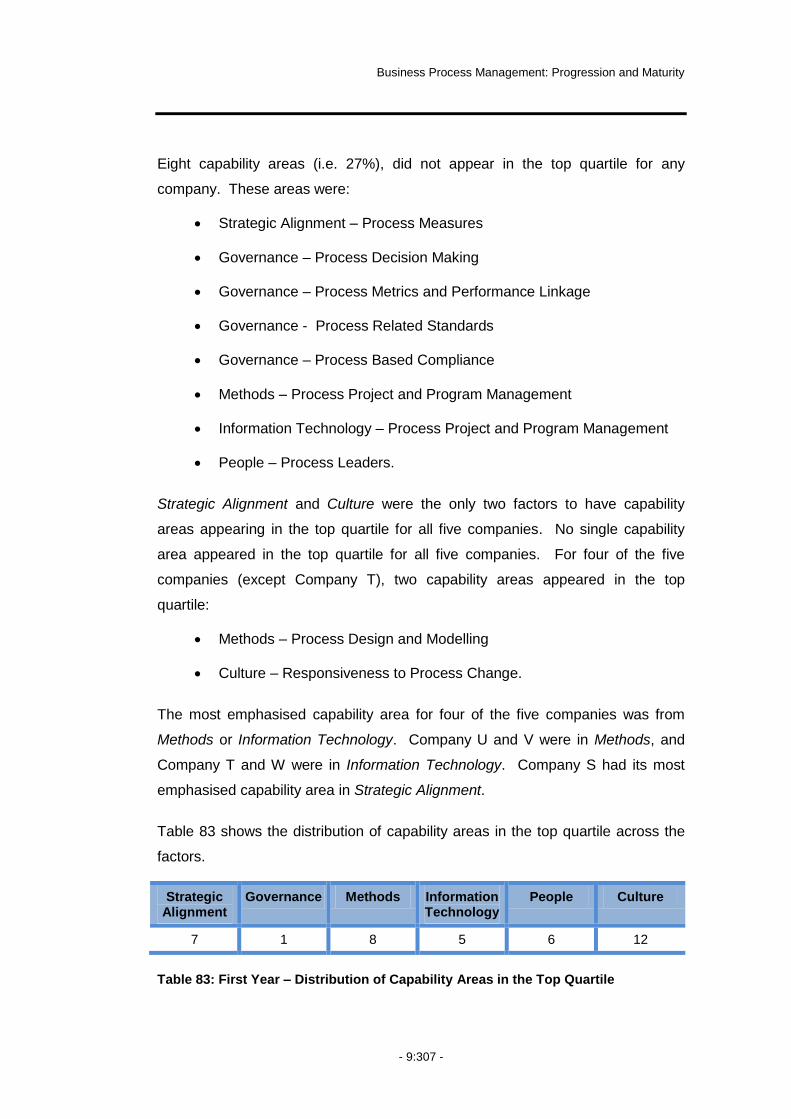
Business Process Management: Progression and Maturity
- 9:307 -
Eight capability areas (i.e. 27%), did not appear in the top quartile for any
company. These areas were:
Strategic Alignment – Process Measures
Governance – Process Decision Making
Governance – Process Metrics and Performance Linkage
Governance - Process Related Standards
Governance – Process Based Compliance
Methods – Process Project and Program Management
Information Technology – Process Project and Program Management
People – Process Leaders.
Strategic Alignment and Culture were the only two factors to have capability
areas appearing in the top quartile for all five companies. No single capability
area appeared in the top quartile for all five companies. For four of the five
companies (except Company T), two capability areas appeared in the top
quartile:
Methods – Process Design and Modelling
Culture – Responsiveness to Process Change.
The most emphasised capability area for four of the five companies was from
Methods or Information Technology. Company U and V were in Methods, and
Company T and W were in Information Technology. Company S had its most
emphasised capability area in Strategic Alignment.
Table 83 shows the distribution of capability areas in the top quartile across the
factors.
Strategic Alignment
Governance Methods Information Technology
People Culture
7 1 8 5 6 12
Table 83: First Year – Distribution of Capability Areas in the Top Quartile

Chapter 9 – Comparative Case Analysis
- 9:308 -
Culture had the most capability areas in the top quartile accounting for 12 of the
39 capability areas (i.e. 31%). Governance had the least, with only one (i.e. 3%).
The remaining capability areas spread across the remaining four factors with
Strategic Alignment (7), Methods (8), Information Technology (5) and People (6).
The next sections highlight key aspects of the capability areas appearing in the
top quartile for each factor and company.
Strategic Alignment
Table 84 is an extraction of the Strategic Alignment section of Table 82.
Factor Capability area Company
S T U V W
Str
ate
gic
Alig
nm
en
t
Process Improvement Planning 3.4 4.2
Strategy & Process Capability Linkage 2.8
Enterprise Process Architecture 4.6 5.0
Process Measures
Process Customers & Stakeholders 2.7 4.4
Table 84: First Year – Strategic Alignment Top Quartile
Company S was the only company that had more than one Strategic Alignment
capability area in the top quartile with three areas, including the highest ranked
area in this quartile. All four remaining companies had only one Strategic
Alignment capability area in the top quartile.
Process Measures did not appear in the top quartile for any company. Strategy
and Process Capability Linkage appeared in the top quartile for only one
company, Company S. Process Improvement Planning, Enterprise Process
Architecture, and, Process Customers and Stakeholders were each in the top
quartile for two companies.
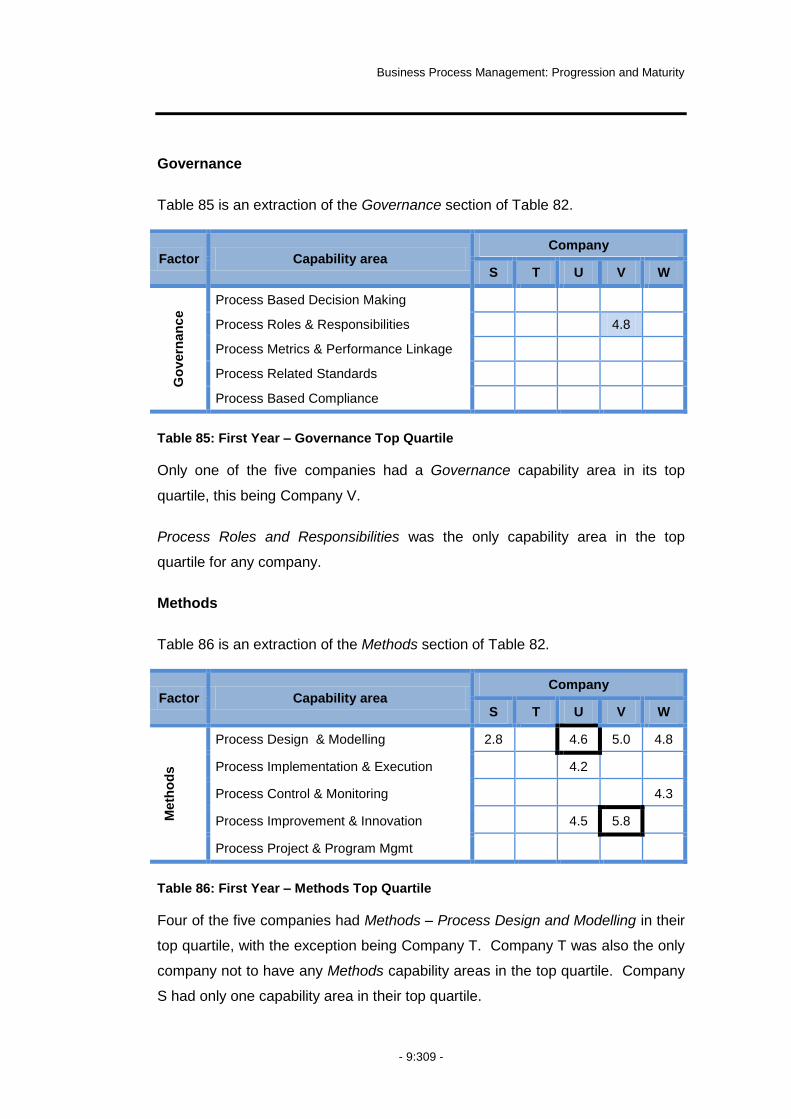
Business Process Management: Progression and Maturity
- 9:309 -
Governance
Table 85 is an extraction of the Governance section of Table 82.
Factor Capability area Company
S T U V W
Go
vern
an
ce
Process Based Decision Making
Process Roles & Responsibilities 4.8
Process Metrics & Performance Linkage
Process Related Standards
Process Based Compliance
Table 85: First Year – Governance Top Quartile
Only one of the five companies had a Governance capability area in its top
quartile, this being Company V.
Process Roles and Responsibilities was the only capability area in the top
quartile for any company.
Methods
Table 86 is an extraction of the Methods section of Table 82.
Factor Capability area Company
S T U V W
Meth
od
s
Process Design & Modelling 2.8 4.6 5.0 4.8
Process Implementation & Execution 4.2
Process Control & Monitoring 4.3
Process Improvement & Innovation 4.5 5.8
Process Project & Program Mgmt
Table 86: First Year – Methods Top Quartile
Four of the five companies had Methods – Process Design and Modelling in their
top quartile, with the exception being Company T. Company T was also the only
company not to have any Methods capability areas in the top quartile. Company
S had only one capability area in their top quartile.
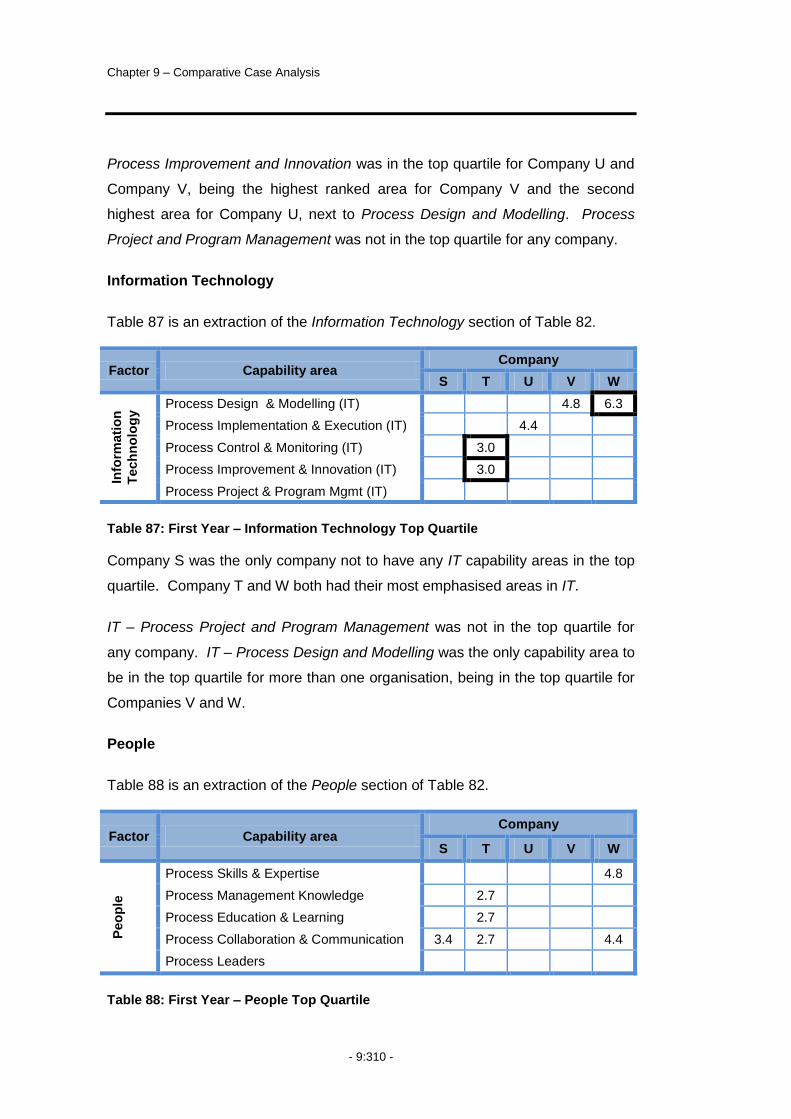
Chapter 9 – Comparative Case Analysis
- 9:310 -
Process Improvement and Innovation was in the top quartile for Company U and
Company V, being the highest ranked area for Company V and the second
highest area for Company U, next to Process Design and Modelling. Process
Project and Program Management was not in the top quartile for any company.
Information Technology
Table 87 is an extraction of the Information Technology section of Table 82.
Factor Capability area Company
S T U V W
Info
rmati
on
Tech
no
log
y Process Design & Modelling (IT) 4.8 6.3
Process Implementation & Execution (IT) 4.4
Process Control & Monitoring (IT) 3.0
Process Improvement & Innovation (IT) 3.0
Process Project & Program Mgmt (IT)
Table 87: First Year – Information Technology Top Quartile
Company S was the only company not to have any IT capability areas in the top
quartile. Company T and W both had their most emphasised areas in IT.
IT – Process Project and Program Management was not in the top quartile for
any company. IT – Process Design and Modelling was the only capability area to
be in the top quartile for more than one organisation, being in the top quartile for
Companies V and W.
People
Table 88 is an extraction of the People section of Table 82.
Factor Capability area Company
S T U V W
Peo
ple
Process Skills & Expertise 4.8
Process Management Knowledge 2.7
Process Education & Learning 2.7
Process Collaboration & Communication 3.4 2.7 4.4
Process Leaders
Table 88: First Year – People Top Quartile

Business Process Management: Progression and Maturity
- 9:311 -
Company U and Company V both had no capability areas from the People factor
in the top quartile. Company T and W were the only two companies to have
more than one capability area in the top quartile, with Company T having three
and Company W, two.
Process Communication and Collaboration was in the top quartile for three
companies, Companies S, T and W. Process Leaders was not in the top quartile
for any company.
Culture
Table 89 is an extraction of the Culture section of Table 82.
Factor Capability area Company
S T U V W
Cu
ltu
re
Responsiveness to Process Change 3.8 4.2 5.0 4.9
Process Values & Beliefs 2.7 4.8
Process Attitudes & Behaviours 2.7 4.3
Leadership Attention to Process 3.6 2.7
Process Management Social Networks 3.2 2.7
Table 89: First Year – Culture Top Quartile
Company S had three Culture capability areas in the top quartile and Company
T, four. The remaining companies, Company U, V and W had one or two
capability areas in the top quartile.
Responsiveness to Process Change was in the top quartile for four of the five
companies, with the exception of Company T. All other capability areas were in
the top quartile for two companies.
9.3.2 Capability Areas in the Bottom Quartile
The shaded areas of Table 90 depict the capability areas that were in the bottom
quartile for each company with regard to the level of emphasis received during
the first year. The shaded area with the bold black outline reflects the least
emphasised capability area/s for each company.
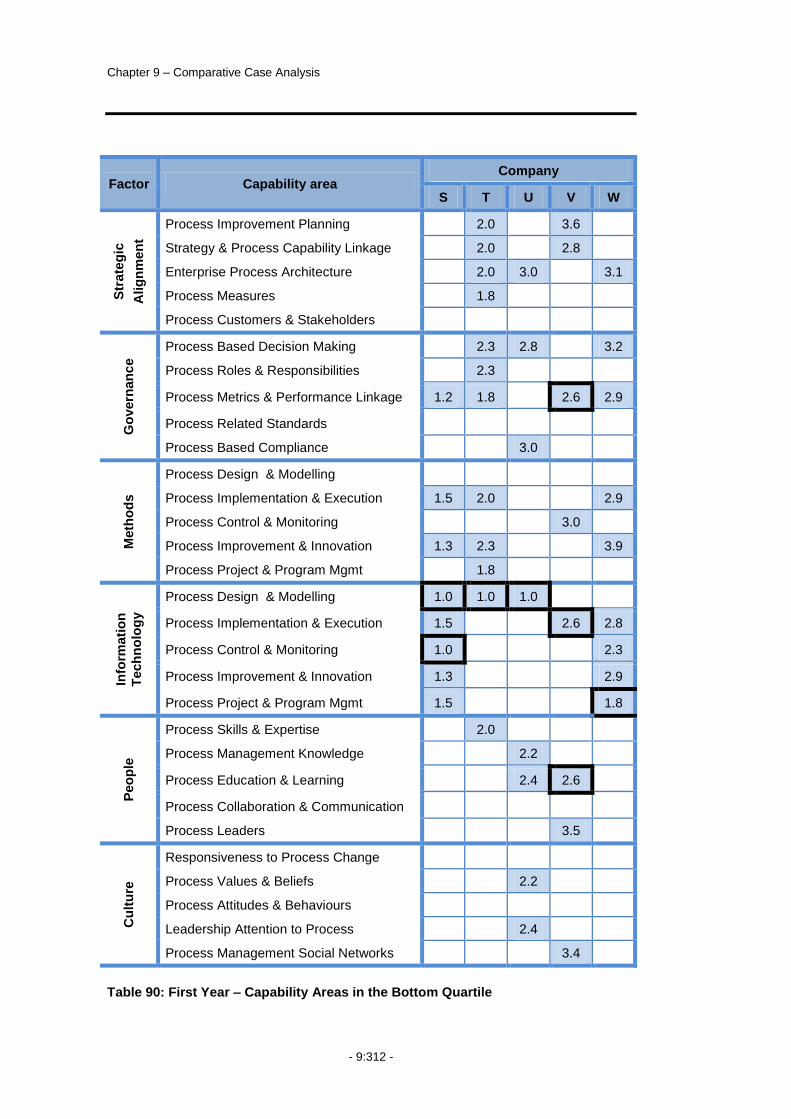
Chapter 9 – Comparative Case Analysis
- 9:312 -
Factor Capability area Company
S T U V W
Str
ate
gic
Alig
nm
en
t
Process Improvement Planning 2.0 3.6
Strategy & Process Capability Linkage 2.0 2.8
Enterprise Process Architecture 2.0 3.0 3.1
Process Measures 1.8
Process Customers & Stakeholders
Go
vern
an
ce
Process Based Decision Making 2.3 2.8 3.2
Process Roles & Responsibilities 2.3
Process Metrics & Performance Linkage 1.2 1.8 2.6 2.9
Process Related Standards
Process Based Compliance 3.0
Meth
od
s
Process Design & Modelling
Process Implementation & Execution 1.5 2.0 2.9
Process Control & Monitoring 3.0
Process Improvement & Innovation 1.3 2.3 3.9
Process Project & Program Mgmt 1.8
Info
rmati
on
Tech
no
log
y
Process Design & Modelling 1.0 1.0 1.0
Process Implementation & Execution 1.5 2.6 2.8
Process Control & Monitoring 1.0 2.3
Process Improvement & Innovation 1.3 2.9
Process Project & Program Mgmt 1.5 1.8
Peo
ple
Process Skills & Expertise 2.0
Process Management Knowledge 2.2
Process Education & Learning 2.4 2.6
Process Collaboration & Communication
Process Leaders 3.5
Cu
ltu
re
Responsiveness to Process Change
Process Values & Beliefs 2.2
Process Attitudes & Behaviours
Leadership Attention to Process 2.4
Process Management Social Networks 3.4
Table 90: First Year – Capability Areas in the Bottom Quartile
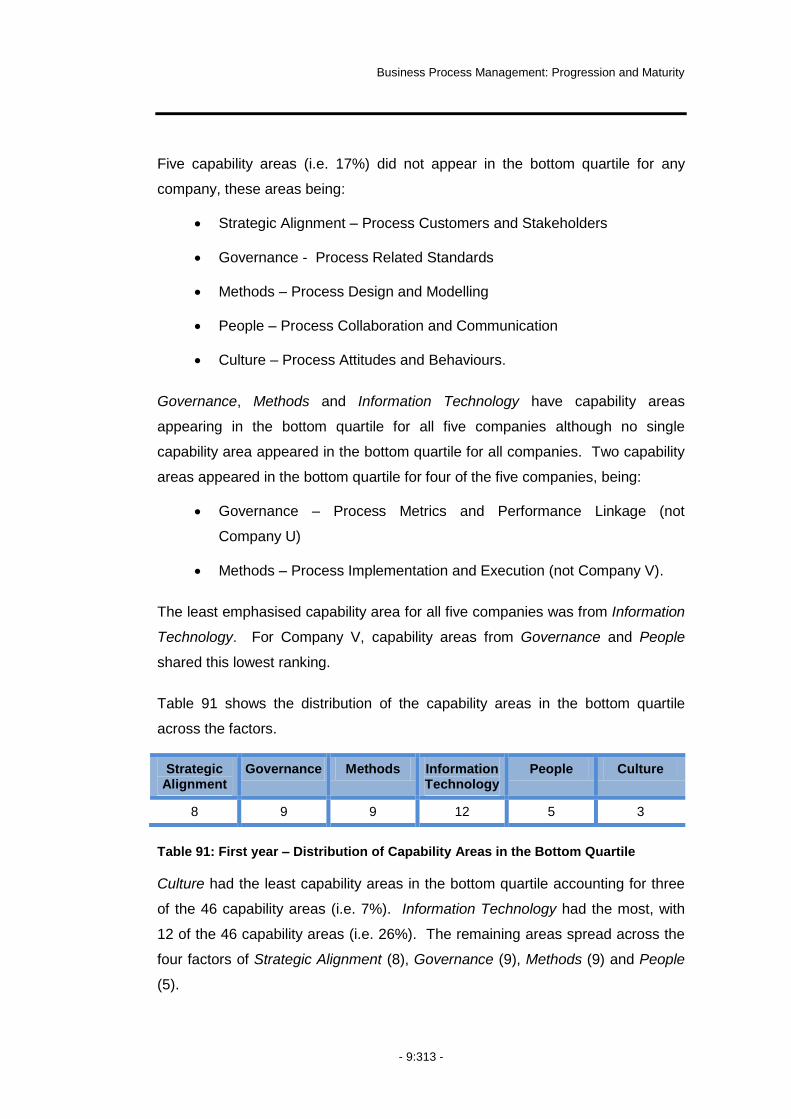
Business Process Management: Progression and Maturity
- 9:313 -
Five capability areas (i.e. 17%) did not appear in the bottom quartile for any
company, these areas being:
Strategic Alignment – Process Customers and Stakeholders
Governance - Process Related Standards
Methods – Process Design and Modelling
People – Process Collaboration and Communication
Culture – Process Attitudes and Behaviours.
Governance, Methods and Information Technology have capability areas
appearing in the bottom quartile for all five companies although no single
capability area appeared in the bottom quartile for all companies. Two capability
areas appeared in the bottom quartile for four of the five companies, being:
Governance – Process Metrics and Performance Linkage (not
Company U)
Methods – Process Implementation and Execution (not Company V).
The least emphasised capability area for all five companies was from Information
Technology. For Company V, capability areas from Governance and People
shared this lowest ranking.
Table 91 shows the distribution of the capability areas in the bottom quartile
across the factors.
Strategic Alignment
Governance Methods Information Technology
People Culture
8 9 9 12 5 3
Table 91: First year – Distribution of Capability Areas in the Bottom Quartile
Culture had the least capability areas in the bottom quartile accounting for three
of the 46 capability areas (i.e. 7%). Information Technology had the most, with
12 of the 46 capability areas (i.e. 26%). The remaining areas spread across the
four factors of Strategic Alignment (8), Governance (9), Methods (9) and People
(5).

Chapter 9 – Comparative Case Analysis
- 9:314 -
The next sections highlight key aspects of the capability areas appearing in the
bottom quartile for each factor and company.
Strategic Alignment
Table 92 is an extraction of the Strategic Alignment section of Table 90.
Factor Capability area Company
S T U V W
Str
ate
gic
Alig
nm
en
t Process Improvement Planning 2.0
Strategy & Process Capability Linkage 2.0 2.8
Enterprise Process Architecture 2.0 3.1
Process Measures 1.8
Process Customers & Stakeholders
Table 92: First Year – Strategic Alignment Bottom Quartile
Two of the five companies, Company S and U both had no Strategic Alignment
capability areas in their bottom quartile. Company T had four, whilst the
remaining two companies each had one capability area in the bottom quartile.
Process Customers and Stakeholders was the only Strategic Alignment capability
area not to be in the bottom quartile for any company.
Governance
Table 93 is an extraction of the Governance section of Table 90.
Factor Capability area Company
S T U V W
Go
vern
an
ce
Process Based Decision Making 2.8
Process Roles & Responsibilities
Process Metrics & Performance Linkage 1.2 1.8 2.6 2.9
Process Related Standards
Process Based Compliance
Table 93: First Year – Governance Bottom Quartile
Four of the five companies had Process Metrics and Performance Linkage in the
bottom quartile, with the exception being Company U. Company U was the only
company to have Process Based Decision Making appear in the bottom quartile.

Business Process Management: Progression and Maturity
- 9:315 -
Three Governance capability areas did not appear in the bottom quartile for any
company, these being Process Roles and Responsibilities, Process Related
Standards and Process Based Compliance.
Methods
Table 94 is an extraction of the Methods section of Table 90.
Factor Capability area Company
S T U V W
Meth
od
s
Process Design & Modelling
Process Implementation & Execution 1.5 2.0 2.9
Process Control & Monitoring 3.0
Process Improvement & Innovation 1.3
Process Project & Program Mgmt 1.8
Table 94: First Year – Methods Bottom Quartile
Three of the five companies, Company S, T and W, all had Methods – Process
Implementation and Execution in their bottom quartile. Company U had no
Methods capability areas in the bottom quartile.
Methods – Process Design and Modelling did not appear in the bottom quartile
for any company.
Information Technology
Table 95 is an extraction of the Information Technology section of Table 90.
Factor Capability area Company
S T U V W
Info
rmati
on
Tech
no
log
y
Process Design & Modelling 1.0 1.0 1.0
Process Implementation & Execution 1.5 2.6 2.8
Process Control & Monitoring 1.0 2.3
Process Improvement & Innovation 1.3 2.9
Process Project & Program Mgmt 1.5 1.8
Table 95: First Year – Information Technology Bottom Quartile

Chapter 9 – Comparative Case Analysis
- 9:316 -
Company S had all five IT areas in the bottom quartile and Company W had four.
The remaining three companies had only one IT capability area in their bottom
quartile but, in all cases, this was the least emphasised capability area for that
company.
A capability area from IT was the least emphasised area for all companies with IT
– Process Design and Modelling being the least emphasised for capability area
for three of the five companies.
People
Table 96 is an extraction of the People section of Table 90.
Factor Capability area Company
S T U V W
Peo
ple
Process Skills & Expertise 2.0
Process Management Knowledge 2.2
Process Education & Learning 2.4 2.6
Process Collaboration & Communication
Process Leaders 3.5
Table 96: First Year – People Bottom Quartile
Company S and W were the only two companies not to have a People capability
areas in their bottom quartile. Company T had only one, whereas Company U
and V each had two.
Process Collaboration and Communication was the only People capability area
not to appear in the bottom quartile for any company. Process Education and
Learning was the only People capability area to be in the bottom quartile for two
companies, being Company U and V.

Business Process Management: Progression and Maturity
- 9:317 -
Culture
Table 97 is an extraction of the Culture section of Table 90.
Factor Capability area Company
S T U V W
Cu
ltu
re
Responsiveness to Process Change
Process Values & Beliefs 2.2
Process Attitudes & Behaviours
Leadership Attention to Process 2.4
Process Management Social Networks 3.4
Table 97: First Year – Culture Bottom Quartile
Company S, T and W had no Culture capability areas in their bottom quartile.
Company V had only one and Company U had two.
Responsiveness to Process Change and Process Attitudes and Behaviours were
not in the bottom quartile for any company. The remaining capability areas were
in the bottom quartile for one company each.
9.3.3 Discussion of First Year
This section discusses the key points arising from the investigation of the first
year of the BPM Initiatives. In keeping with the aims of the longitudinal study,
this discussion focuses on (1) select demographics of the BPM Initiative being
the structure and the level of Executive Buy-In and (2) the factors and capability
areas from the BPM Capability Framework.
Structure of BPM Initiative and Level of Executive Buy-In
Company S, T and W shared similar structures for their BPM Initiatives. All three
were intending to adopt BPM as an enterprise-wide initiative and commenced
implementation using a project-based approach. Executive Buy-In for these
companies was medium to low, ranging from 3.4 (S), 2.5 (T) and 1.9 (W) on a 7
point scale, with 7 – Very High.

Chapter 9 – Comparative Case Analysis
- 9:318 -
The similarities in the BPM Initiatives during the first year for these companies
included:
Company T and W both had their most emphasised areas in IT. For
Company T this was for Process Control and Monitoring, and Process
Improvement and Innovation. For Company W this was for Process
Design and Modelling
Company S and Company W had a high proportion of IT capability areas
in their bottom quartile with Company S having five and Company W, four
Company S, T and W were the only companies to have People capability
areas in the top quartile
Company S and T had three and four Culture capability areas
respectively, in their top quartile. This included the capability area,
Leadership Attention to Process
All three companies had Process Metrics and Performance Linkage in
their bottom quartile, together with Company V
All three companies had Methods – Process Implementation and
Execution in their bottom quartile
Company S and W both had no People capability areas in their bottom
quartile and Company T had only one, being Process Skills and
Expertise.
The following section highlights the key differences amongst these three
companies.
Company S:
Had three Strategic Alignment areas in the top quartile whereas all other
companies had only one
Was the only company not to have any IT capability areas in its top
quartile
Was one of only two companies with no Strategic Alignment areas in its
bottom quartile, together with Company U.

Business Process Management: Progression and Maturity
- 9:319 -
Company T was:
One of two companies with two Culture capability areas in its top quartile,
the other being Company U
The only company not to have Methods – Process Design and Modelling
in its top quartile
The only company not to have any Methods capability areas in the top
quartile
The only company not to have Responsiveness to Process Change in its
top quartile
The only company to have four Strategic Alignment capability areas in the
bottom quartile.
Company W did not have any notable differences from other companies.
Company U and V also shared similar structures to their BPM Initiatives. Both
were adopting BPM only within a defined customer facing area of their business
and commenced implementation using a project-based approach. Executive
Buy-In for these companies was medium to high, being 4.1 (U) and 5.0 (V) on a 7
point scale with 7 – very high.
The similarities in Companies U and V included:
Both had Methods – Process Design and Modelling in their top quartile,
together with Companies S and W
They were the only two companies with no capability areas from the
People factor in their top quartile
They were the only two companies with only one Methods capability area
in their bottom quartile
They were two of the three companies with only one IT capability area in
their bottom quartile, the other company being Company T. For all three
companies the IT capability area was the least emphasised of all areas
Chapter 9 – Comparative Case Analysis
- 9:320 -
They were the only two companies to have more than one People
capability area in their bottom quartile, each having two
They were the only two companies to have Culture capability areas in
their bottom quartile, having two and one respectively.
The next section shows the key differences between these two companies.
Company V was the only company that:
Had any Governance capability areas in its top quartile, having one, being
Process Roles and Responsibilities
Had Methods – Process Control and Monitoring in its bottom quartile
Did not have Methods – Process Implementation and Execution in its
bottom quartile.
Company U was the only company that:
Had Governance – Process Based Compliance in its bottom quartile
Did not have the Governance – Process Metrics and Performance
Linkage in its bottom quartile.
Factors and Capability areas
During the first year, across all companies there was a notable selection of
capability areas relevant to undertaking process improvement/change projects
(i.e. 36% of those areas in the top quartile). This reflected in two or more
companies having in their top quartile, capability areas including:
Strategic Alignment – Process Customers and Stakeholders (2)
Methods – Process Design and Modelling (4)
Methods – Process Improvement and Innovation (2)
Information Technology – Process Design and Modelling (2)
Culture – Responsiveness to Process Change (4).
Business Process Management: Progression and Maturity
- 9:321 -
At the same time, for companies with an enterprise-wide scope to their BPM
Initiatives, there was also a notable selection of capability areas relevant to
establishing a foundation for BPM thinking and co-ordination within an
organisation (i.e. 39% of those areas in the top quartile, with 31% being from
companies with an enterprise wide scope), including:
Strategic Alignment – Process Improvement Planning (2)
Strategic Alignment – Enterprise Process Architecture (2)
People – Process Collaboration and Communication (3)
Culture – Process Values and Beliefs (2)
Culture – Process Attitudes and Behaviours (2)
Culture – Leadership Attention to Process (2)
Culture – Process Management Social Networks (2).
The exception to companies with an enterprise-wide scope was Company V
being one of the companies emphasising Strategic Alignment – Enterprise
Process Architecture and Culture – Process Values and Beliefs, and Company U
being one of the companies emphasising Strategic Alignment – Process
Improvement Planning.
Given the project-based approach to implementing the BPM Initiatives in all five
companies, it was interesting that the capability areas of Methods – Project and
Program Management and Information Technology – Project and Program
Management did not appear in the top quartile for any company.
9.4 Last Year – Emphasis on Capability areas
This section considers the level of emphasis placed on different capability areas
during the last year of the BPM Initiatives. All companies had active BPM
Initiatives at the time of the case study. As the case studies occurred within a
relatively short timeframe, the last year for all companies was 2007 (or some
component thereof).
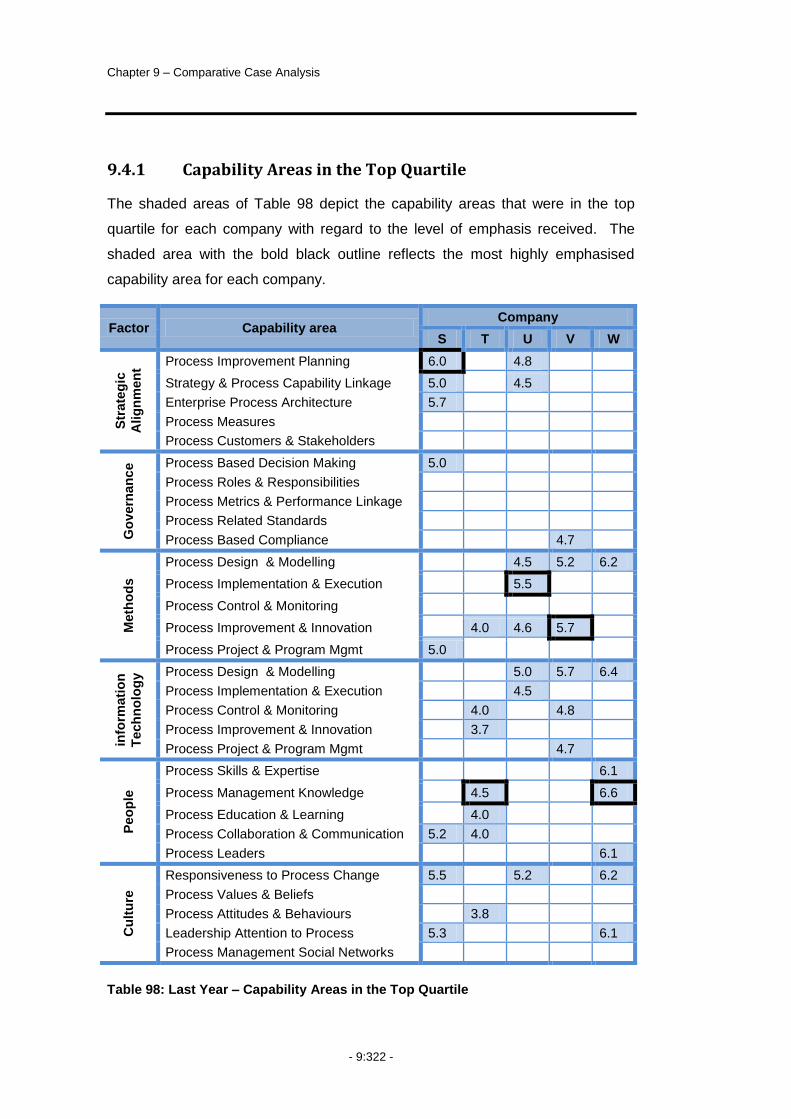
Chapter 9 – Comparative Case Analysis
- 9:322 -
9.4.1 Capability Areas in the Top Quartile
The shaded areas of Table 98 depict the capability areas that were in the top
quartile for each company with regard to the level of emphasis received. The
shaded area with the bold black outline reflects the most highly emphasised
capability area for each company.
Factor Capability area Company
S T U V W
Str
ate
gic
Alig
nm
en
t
Process Improvement Planning 6.0 4.8
Strategy & Process Capability Linkage 5.0 4.5
Enterprise Process Architecture 5.7
Process Measures
Process Customers & Stakeholders
Go
vern
an
ce
Process Based Decision Making 5.0
Process Roles & Responsibilities
Process Metrics & Performance Linkage
Process Related Standards
Process Based Compliance 4.7
Meth
od
s
Process Design & Modelling 4.5 5.2 6.2
Process Implementation & Execution 5.5
Process Control & Monitoring
Process Improvement & Innovation 4.0 4.6 5.7
Process Project & Program Mgmt 5.0
info
rmati
on
Tech
no
log
y Process Design & Modelling 5.0 5.7 6.4
Process Implementation & Execution 4.5
Process Control & Monitoring 4.0 4.8
Process Improvement & Innovation 3.7
Process Project & Program Mgmt 4.7
Peo
ple
Process Skills & Expertise 6.1
Process Management Knowledge 4.5 6.6
Process Education & Learning 4.0
Process Collaboration & Communication 5.2 4.0
Process Leaders 6.1
Cu
ltu
re
Responsiveness to Process Change 5.5 5.2 6.2
Process Values & Beliefs
Process Attitudes & Behaviours 3.8
Leadership Attention to Process 5.3 6.1
Process Management Social Networks
Table 98: Last Year – Capability Areas in the Top Quartile

Business Process Management: Progression and Maturity
- 9:323 -
Eight capability areas (i.e. 27%) did not appear in the top quartile for any
company during the last year of the BPM Initiative. These areas were:
Strategic Alignment – Process Measures
Strategic Alignment – Process Customers and Stakeholders
Governance – Roles and Responsibilities
Governance – Process Metrics and Performance Linkage
Governance - Process Related Standards
Methods – Process Control and Monitoring
Culture – Values and Beliefs
Culture – Process Management Social Networks.
People and Information Technology were the only two factors with capability
areas in the top quartile across all five companies. No single capability area
appeared in the top quartile for all companies. Only four capability areas were in
the top quartile of more than two companies during the last year, being there for
three companies in each instance. These capability areas were:
Methods – Process Design and Modelling
Methods – Process Improvement and Innovation
Information Technology – Process Design and Modelling
Culture – Responsiveness to Process Change.
Table 99 shows the distribution across the factors, of capability areas in the top
quartile.
Strategic Alignment
Governance Methods Information Technology
People Culture
5 2 8 8 7 6
Table 99: Last Year – Distribution of Capability Areas in the Top Quartile
Governance had the least capability areas in the top quartile accounting for just
two of the 36 capability areas (i.e. 6%). The remaining capability areas spread
across the other five factors with Strategic Alignment (5), Methods (8),
Information Technology (8), People (7) and Culture (6).

Chapter 9 – Comparative Case Analysis
- 9:324 -
The next sections detail the capability areas appearing in the top quartile for each
factor and company in more detail.
Strategic Alignment
Table 100 is an extraction of the Strategic Alignment section of Table 98.
Factor Capability area Company
S T U V W
Str
ate
gic
Alig
nm
en
t
Process Improvement Planning 6.0 4.8
Strategy & Process Capability Linkage 5.0 4.5
Enterprise Process Architecture 5.7
Process Measures
Process Customers & Stakeholders
Table 100: Last Year – Strategic Alignment Top Quartile
Only two of the five companies had capability areas from Strategic Alignment in
the top quartile, being Company S with three and Company U with two.
Two Strategic Alignment capability areas were not in the top quartile for any
companies, these being Process Measures, and Process Customers and
Stakeholders.
Governance
Table 101 is an extraction of the Governance section of Table 98.
Factor Capability area Company
S T U V W
Go
vern
an
ce
Process Based Decision Making 5.0
Process Roles & Responsibilities
Process Metrics & Performance Linkage
Process Related Standards
Process Based Compliance 4.7
Table 101: Last Year – Governance Top Quartile

Business Process Management: Progression and Maturity
- 9:325 -
Only two of the five companies had a Governance capability area in the top
quartile being Company S and Company V with one capability area each.
The capability areas of Process Roles and Responsibilities, Process Metrics and
Performance Linkage and Process Related Standards were not in the top quartile
for any company.
Methods
Table 102 is an extraction of the Methods section of Table 98.
Factor Capability area Company
S T U V W
Meth
od
s
Process Design & Modelling 4.5 5.2 6.2
Process Implementation & Execution 5.5
Process Control & Monitoring
Process Improvement & Innovation 4.0 4.6 5.7
Process Project & Program Mgmt 5.0
Table 102: Last Year – Methods Top Quartile
All companies had at least one Methods capability area in the top quartile in their
last year. Company U had three and Company V had two. The remaining three
companies each had one.
Two capability areas were in the top quartile for three companies being Methods
– Process Design and Modelling, and Methods – Process Improvement and
Innovation. Methods – Process Control and Monitoring was not in the top
quartile for any company.
Information Technology
Table 103 is an extraction of the Information Technology section of Table 98.

Chapter 9 – Comparative Case Analysis
- 9:326 -
Factor Capability area Company
S T U V W
info
rmati
on
Tech
no
log
y Process Design & Modelling 5.0 5.7 6.4
Process Implementation & Execution 4.5
Process Control & Monitoring 4.0 4.8
Process Improvement & Innovation 3.7
Process Project & Program Mgmt 4.7
Table 103: Last Year – Information Technology Top Quartile
Company S had no IT capability areas in the top quartile. Company V had three
areas, Companies T and U had two and Company W, one.
All IT capability areas were in the top quartile for at least one company. IT –
Process Design and Modelling was in the top quartile for three companies.
People
Table 104 is an extraction of the People section of Table 98.
Factor Capability area Company
S T U V W
Peo
ple
Process Skills & Expertise 6.1
Process Management Knowledge 4.5 6.6
Process Education & Learning 4.0
Process Collaboration & Communication 5.2 4.0
Process Leaders 6.1
Table 104: Last Year – People Top Quartile
Company U and V had no People capability areas in the top quartile. Companies
T and W each had three, and Company S had one. Companies T and W both
had their most emphasised capability area from the People factor, being Process
Management Knowledge.
All People capability areas were in the top quartile for at least one company.
Process Management Knowledge was in the top quartile for two companies.
Process Collaboration and Communication was in the top quartile for two
companies.

Business Process Management: Progression and Maturity
- 9:327 -
Culture
Table 105 is an extraction of the Culture section of Table 98.
Factor Capability area Company
S T U V W
Cu
ltu
re
Responsiveness to Process Change 5.5 5.2 6.2
Process Values & Beliefs
Process Attitudes & Behaviours 3.8
Leadership Attention to Process 5.3 6.1
Process Management Social Networks
Table 105: Last Year – Culture Top Quartile
Only two of the five companies had more than one Culture capability area in their
top quartile. Company S and Company W both had two – Responsiveness to
Process Change and Leadership Attention to Process. Company V was the only
company with no Culture capability areas in its top quartile.
Two Culture capability areas were not in top quartile for any company, these
being Process Values and Beliefs, and Process Management Social Networks.
The capability area of Process Attitudes and Behaviours was in the top quartile of
only one company.
9.4.2 Capability Areas in the Bottom Quartile
The shaded areas of Table 106 depict the capability areas that were in the
bottom quartile of capability areas emphasised for each company. The shaded
area with the bold black outline reflects the least emphasised capability area for
each company.
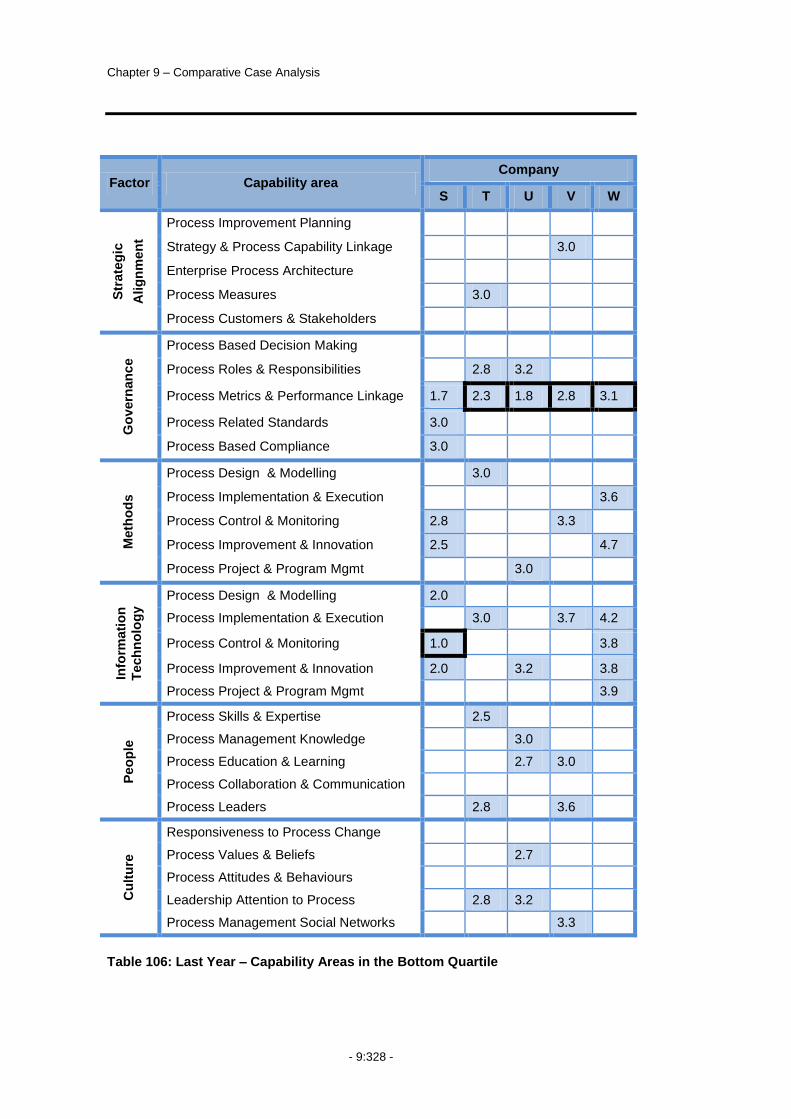
Chapter 9 – Comparative Case Analysis
- 9:328 -
Factor Capability area Company
S T U V W
Str
ate
gic
Alig
nm
en
t
Process Improvement Planning
Strategy & Process Capability Linkage 3.0
Enterprise Process Architecture
Process Measures 3.0
Process Customers & Stakeholders
Go
vern
an
ce
Process Based Decision Making
Process Roles & Responsibilities 2.8 3.2
Process Metrics & Performance Linkage 1.7 2.3 1.8 2.8 3.1
Process Related Standards 3.0
Process Based Compliance 3.0
Meth
od
s
Process Design & Modelling 3.0
Process Implementation & Execution 3.6
Process Control & Monitoring 2.8 3.3
Process Improvement & Innovation 2.5 4.7
Process Project & Program Mgmt 3.0
Info
rmati
on
Tech
no
log
y
Process Design & Modelling 2.0
Process Implementation & Execution 3.0 3.7 4.2
Process Control & Monitoring 1.0 3.8
Process Improvement & Innovation 2.0 3.2 3.8
Process Project & Program Mgmt 3.9
Peo
ple
Process Skills & Expertise 2.5
Process Management Knowledge 3.0
Process Education & Learning 2.7 3.0
Process Collaboration & Communication
Process Leaders 2.8 3.6
Cu
ltu
re
Responsiveness to Process Change
Process Values & Beliefs 2.7
Process Attitudes & Behaviours
Leadership Attention to Process 2.8 3.2
Process Management Social Networks 3.3
Table 106: Last Year – Capability Areas in the Bottom Quartile
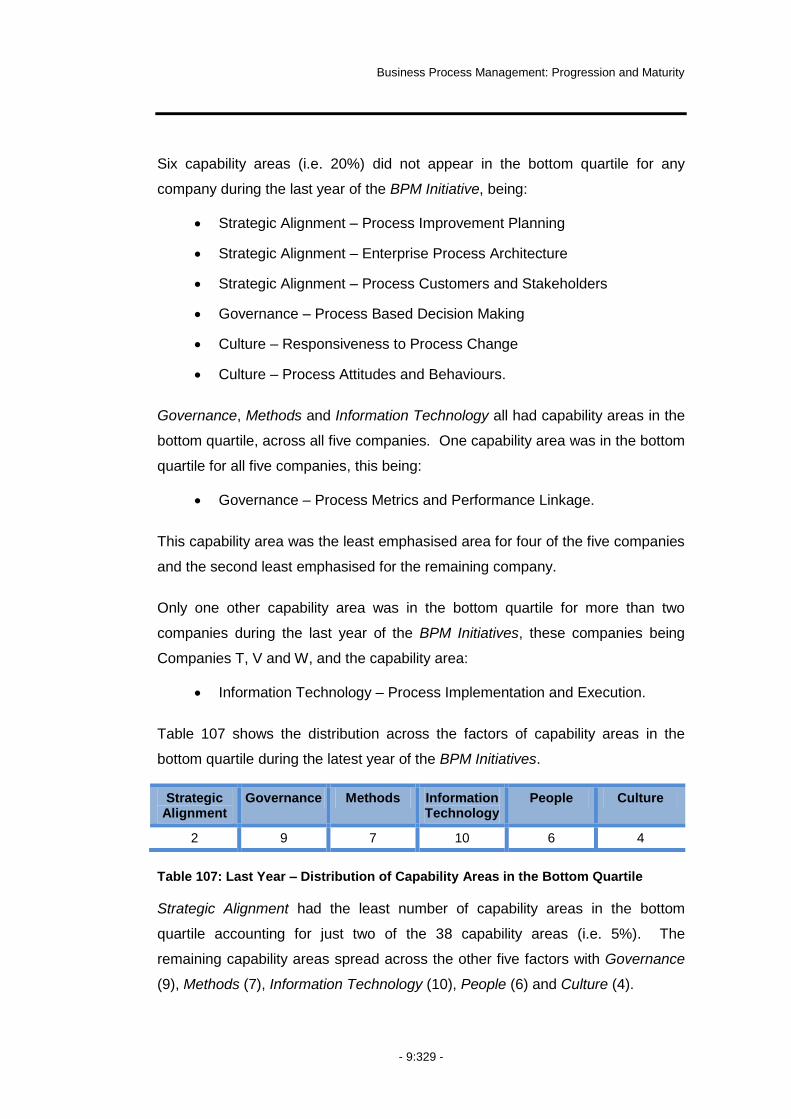
Business Process Management: Progression and Maturity
- 9:329 -
Six capability areas (i.e. 20%) did not appear in the bottom quartile for any
company during the last year of the BPM Initiative, being:
Strategic Alignment – Process Improvement Planning
Strategic Alignment – Enterprise Process Architecture
Strategic Alignment – Process Customers and Stakeholders
Governance – Process Based Decision Making
Culture – Responsiveness to Process Change
Culture – Process Attitudes and Behaviours.
Governance, Methods and Information Technology all had capability areas in the
bottom quartile, across all five companies. One capability area was in the bottom
quartile for all five companies, this being:
Governance – Process Metrics and Performance Linkage.
This capability area was the least emphasised area for four of the five companies
and the second least emphasised for the remaining company.
Only one other capability area was in the bottom quartile for more than two
companies during the last year of the BPM Initiatives, these companies being
Companies T, V and W, and the capability area:
Information Technology – Process Implementation and Execution.
Table 107 shows the distribution across the factors of capability areas in the
bottom quartile during the latest year of the BPM Initiatives.
Strategic Alignment
Governance Methods Information Technology
People Culture
2 9 7 10 6 4
Table 107: Last Year – Distribution of Capability Areas in the Bottom Quartile
Strategic Alignment had the least number of capability areas in the bottom
quartile accounting for just two of the 38 capability areas (i.e. 5%). The
remaining capability areas spread across the other five factors with Governance
(9), Methods (7), Information Technology (10), People (6) and Culture (4).

Chapter 9 – Comparative Case Analysis
- 9:330 -
The next sections consider the capability areas in the bottom quartile for each
factor and company in more detail.
Strategic Alignment
Table 108 is an extraction of the Strategic Alignment section of Table 106.
Factor Capability area Company
S T U V W
Str
ate
gic
Alig
nm
en
t
Process Improvement Planning
Strategy & Process Capability Linkage 3.0
Enterprise Process Architecture
Process Measures 3.0
Process Customers & Stakeholders
Table 108: Last Year – Strategic Alignment Bottom Quartile
Only two companies had Strategic Alignment capability areas in the bottom
quartile during the last year of their BPM Initiatives. This was Company T with
Process Measures and Company V with Strategy and Process Capability
Linkage.
Three capability areas were not in the bottom quartile for any company these
being Process Improvement Planning, Enterprise Process Architecture, and
Process Customers and Stakeholders.
Governance
Table 109 is an extraction of the Governance section of Table 106.
Factor Capability area Company
S T U V W
Go
vern
an
ce
Process Based Decision Making
Process Roles & Responsibilities 2.8 3.2
Process Metrics & Performance Linkage 1.7 2.3 1.8 2.8 3.1
Process Related Standards 3.0
Process Based Compliance 3.0
Table 109: Last Year – Governance Bottom Quartile

Business Process Management: Progression and Maturity
- 9:331 -
All five companies had at least one Governance capability area in their bottom
quartile. For four of the companies this was included their least emphasised
capability area. Company S had three capability areas in the bottom quartile.
Process Metrics and Performance Linkage was in the bottom quartile for all five
companies. With the exception of Company S, it was the least emphasised of all
capability areas. Process Based Decision Making was the only Governance area
not to be in the bottom quartile for any company. Process Related Standards
and Process Based Compliance were only in the bottom quartile for Company S.
Methods
Table 110 is an extraction of the Methods section of Table 106.
Factor Capability area Company
S T U V W
Meth
od
s
Process Design & Modelling 3.0
Process Implementation & Execution 3.6
Process Control & Monitoring 2.8 3.3
Process Improvement & Innovation 2.5 4.7
Process Project & Program Mgmt 3.0
Table 110: Last Year – Methods Bottom Quartile
All companies had at least one Methods capability area in the bottom quartile,
with two companies (S and W) having two. No company had more than two
capability areas in the bottom quartile.
All Methods capability areas were in the bottom quartile for at least one company.
Methods – Process Control and Monitoring, and Methods – Process
Improvement and Innovation were the only two capability areas that were in the
bottom quartile for two companies.
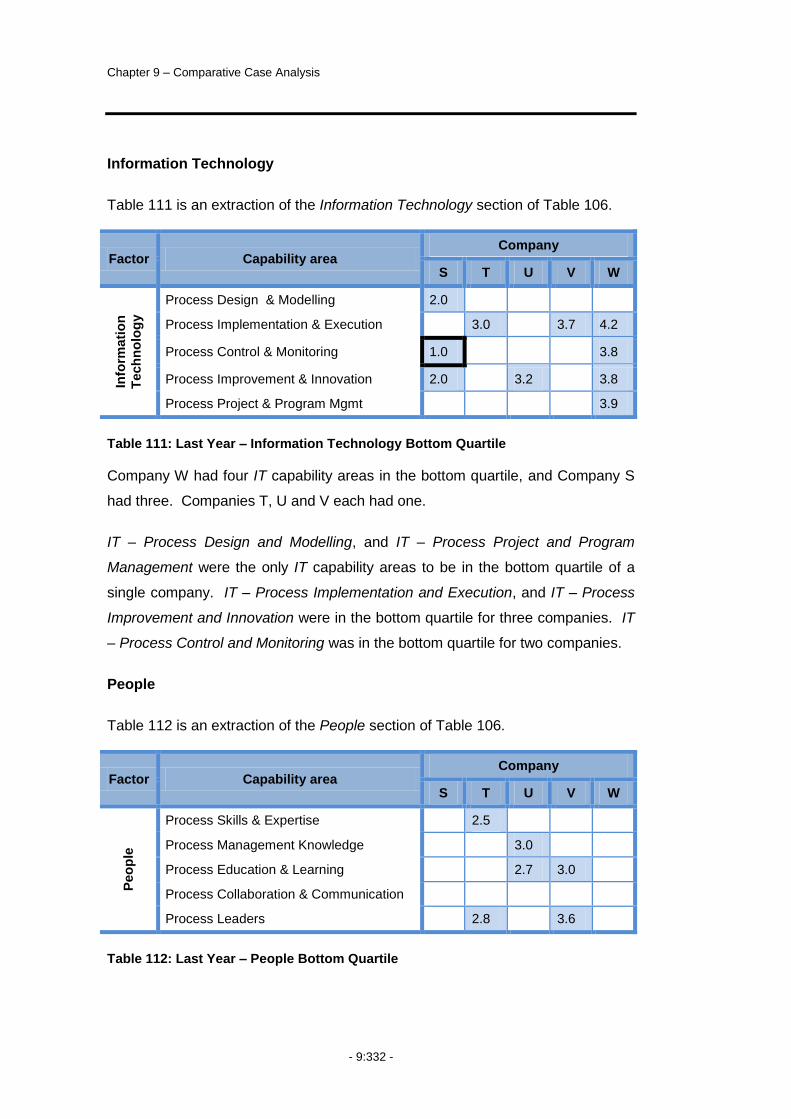
Chapter 9 – Comparative Case Analysis
- 9:332 -
Information Technology
Table 111 is an extraction of the Information Technology section of Table 106.
Factor Capability area Company
S T U V W
Info
rmati
on
Tech
no
log
y
Process Design & Modelling 2.0
Process Implementation & Execution 3.0 3.7 4.2
Process Control & Monitoring 1.0 3.8
Process Improvement & Innovation 2.0 3.2 3.8
Process Project & Program Mgmt 3.9
Table 111: Last Year – Information Technology Bottom Quartile
Company W had four IT capability areas in the bottom quartile, and Company S
had three. Companies T, U and V each had one.
IT – Process Design and Modelling, and IT – Process Project and Program
Management were the only IT capability areas to be in the bottom quartile of a
single company. IT – Process Implementation and Execution, and IT – Process
Improvement and Innovation were in the bottom quartile for three companies. IT
– Process Control and Monitoring was in the bottom quartile for two companies.
People
Table 112 is an extraction of the People section of Table 106.
Factor Capability area Company
S T U V W
Peo
ple
Process Skills & Expertise 2.5
Process Management Knowledge 3.0
Process Education & Learning 2.7 3.0
Process Collaboration & Communication
Process Leaders 2.8 3.6
Table 112: Last Year – People Bottom Quartile
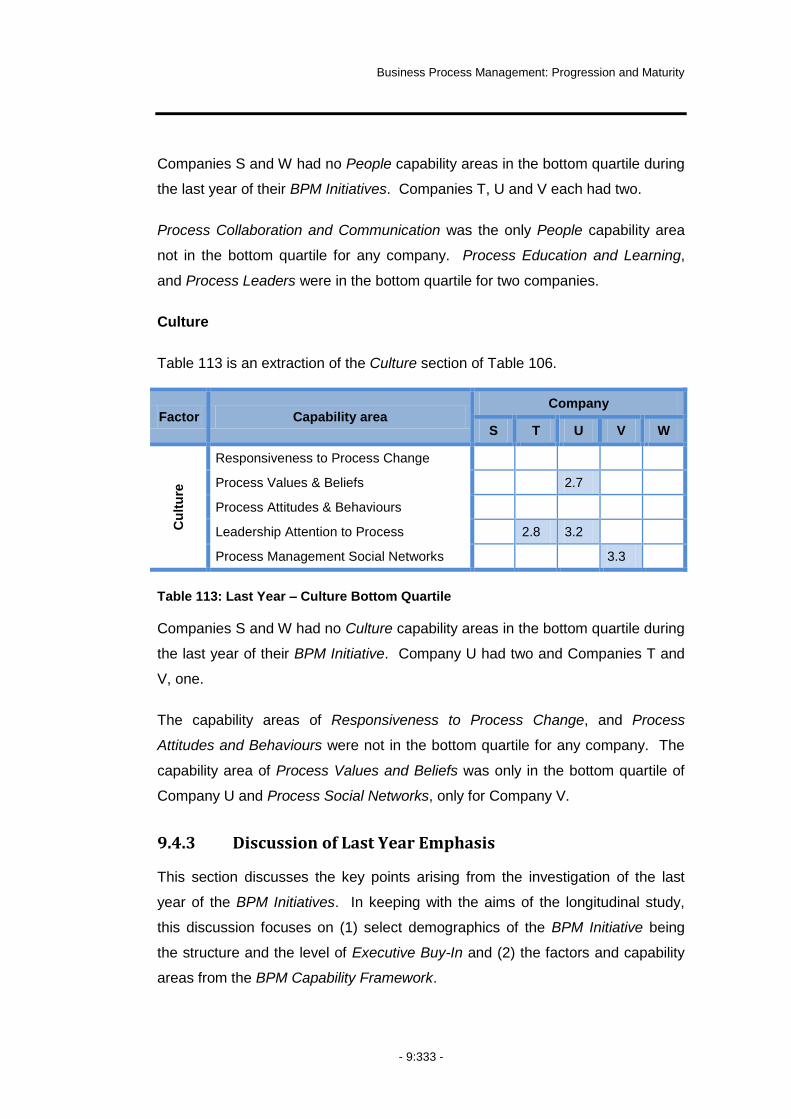
Business Process Management: Progression and Maturity
- 9:333 -
Companies S and W had no People capability areas in the bottom quartile during
the last year of their BPM Initiatives. Companies T, U and V each had two.
Process Collaboration and Communication was the only People capability area
not in the bottom quartile for any company. Process Education and Learning,
and Process Leaders were in the bottom quartile for two companies.
Culture
Table 113 is an extraction of the Culture section of Table 106.
Factor Capability area Company
S T U V W
Cu
ltu
re
Responsiveness to Process Change
Process Values & Beliefs 2.7
Process Attitudes & Behaviours
Leadership Attention to Process 2.8 3.2
Process Management Social Networks 3.3
Table 113: Last Year – Culture Bottom Quartile
Companies S and W had no Culture capability areas in the bottom quartile during
the last year of their BPM Initiative. Company U had two and Companies T and
V, one.
The capability areas of Responsiveness to Process Change, and Process
Attitudes and Behaviours were not in the bottom quartile for any company. The
capability area of Process Values and Beliefs was only in the bottom quartile of
Company U and Process Social Networks, only for Company V.
9.4.3 Discussion of Last Year Emphasis
This section discusses the key points arising from the investigation of the last
year of the BPM Initiatives. In keeping with the aims of the longitudinal study,
this discussion focuses on (1) select demographics of the BPM Initiative being
the structure and the level of Executive Buy-In and (2) the factors and capability
areas from the BPM Capability Framework.

Chapter 9 – Comparative Case Analysis
- 9:334 -
Structure of the BPM Initiative and the Level of Executive Buy-In
In the last year, Company S, T and W shared similar structures for their BPM
Initiatives. All were adopting BPM as an enterprise-wide initiative. Whereas in
the first year, all three of these companies commenced implementation using a
project-based approach, in the last year two of the companies (T and W) had
BPM teams operating as recognised centres of excellence.
In the last year, the Executive Buy-In for these companies had increased to
medium through to high levels, ranging from 3.2 to 5.7 on a 7-point scale, with 7
– Very High. Company S and Company W had the highest Executive Buy-In at
4.8 and 5.7 respectively whilst Company T had the lowest Executive Buy-In for all
companies at 3.2.
By the last year, the BPM Initiatives for Company U and V progressed from
having a predominantly project-based approach to utilising pockets of excellence.
The scope of the BPM Initiative for both companies was still restricted to a
defined area of the business – the Customer Operations Group and the Global
Business Solutions Team.
In the last year, the Executive Buy-In for Company U and Company V was 4.3
and 5.0 respectively, similar to the levels in the first year.
At the factor level, there were still notable similarities and differences between
and within the two groups of companies. There was less distinction however, in
the last year of the BPM Initiatives when considering individual capability areas.
In the companies with an enterprise wide scope (i.e. Companies S, T and W):
Company S continued emphasising Strategic Alignment with three
capability areas from this factor in their top quartile
Companies T and W had a strong focus on People, each with three
capability areas from this factor in their top quartile, including the
capability area of Process Management Knowledge being the most
emphasised capability area for both companies
Company S and W had the strongest focus on Culture, each with the

Business Process Management: Progression and Maturity
- 9:335 -
same two capability areas from this factor in their top quartile
Company S and W had a notable lack of emphasis on IT, each with
three capability areas in the bottom quartile
Company S and W both had no capability areas from Strategic
Alignment, People and Culture in their bottom quartile. Companies T, U
and V each had four capability areas across these factors.
The companies with a narrower scope (i.e. Companies U and V):
Both continued to emphasise the Methods and IT factors, with these
factors accounting for 63% (U) and 83% (V) of the capability areas in
the top quartile.
Factors and Capability areas
During the last year, across all companies there was still a notable selection of
capability areas relevant to undertaking process improvement/change projects
(i.e. at least 33% of those areas in the top quartile). This reflected in at least
three companies having in their top quartile capability areas including:
Methods – Process Design and Modelling (3)
Methods – Process Improvement and Innovation (3)
Information Technology – Process Design and Modelling (3)
Culture – Responsiveness to Process Change (3).
Only two capability areas from the Governance factor were in the top quartile:
Process Based Decision Making for Company S and Process Based Compliance
for Company V. The capability area of Process Metric and Performance Linkage
however was in the bottom quartile for all five companies, being the least
emphasised area for four of them.
The capability areas of Methods – Process Design and Modelling and IT –
Process Design and Modelling were in the top quartile for the same three
companies being T, U and V.

Chapter 9 – Comparative Case Analysis
- 9:336 -
9.5 Change in Emphasis on Capability areas
Whilst a number of insights arose from considering where the companies placed
emphasis in each of the years, there was also value in considering the change in
emphasis and the variation in change, across time. Doing so enabled
investigation of the reasons for variation in changes, a greater understanding of
the nature and consequence of change, and consideration of questions such as:
Does change occur uniformly across time or capability areas or a
combination of the two, or does it vary?
Where variance is noted, does it arise from the same influence or
different influences?
9.5.1 Capability Areas with Greatest Change in Emphasis
The shaded areas of Table 114 depict the capability areas for each company that
were in the top quartile for a change in emphasis over time. The shaded area
with the bold black outline reflects the capability area for each company that
showed the greatest amount of change from the first to the last year.
Factor Capability area Company
S T U V W
Str
ate
gic
Alig
nm
en
t
Process Improvement Planning 0.8 0.2
Strategy & Process Capability Linkage 0.8
Enterprise Process Architecture 0.8 0.3 0.8
Process Measures 1.1
Process Customers & Stakeholders
Go
vern
an
ce
Process Based Decision Making 1.5 0.3 0.9
Process Roles & Responsibilities
Process Metrics & Performance Linkage
Process Related Standards
Process Based Compliance
Meth
od
s
Process Design & Modelling
Process Implementation & Execution 1.3 0.3
Process Control & Monitoring
Process Improvement & Innovation 0.8
Process Project & Program Mgmt 0.9 0.6
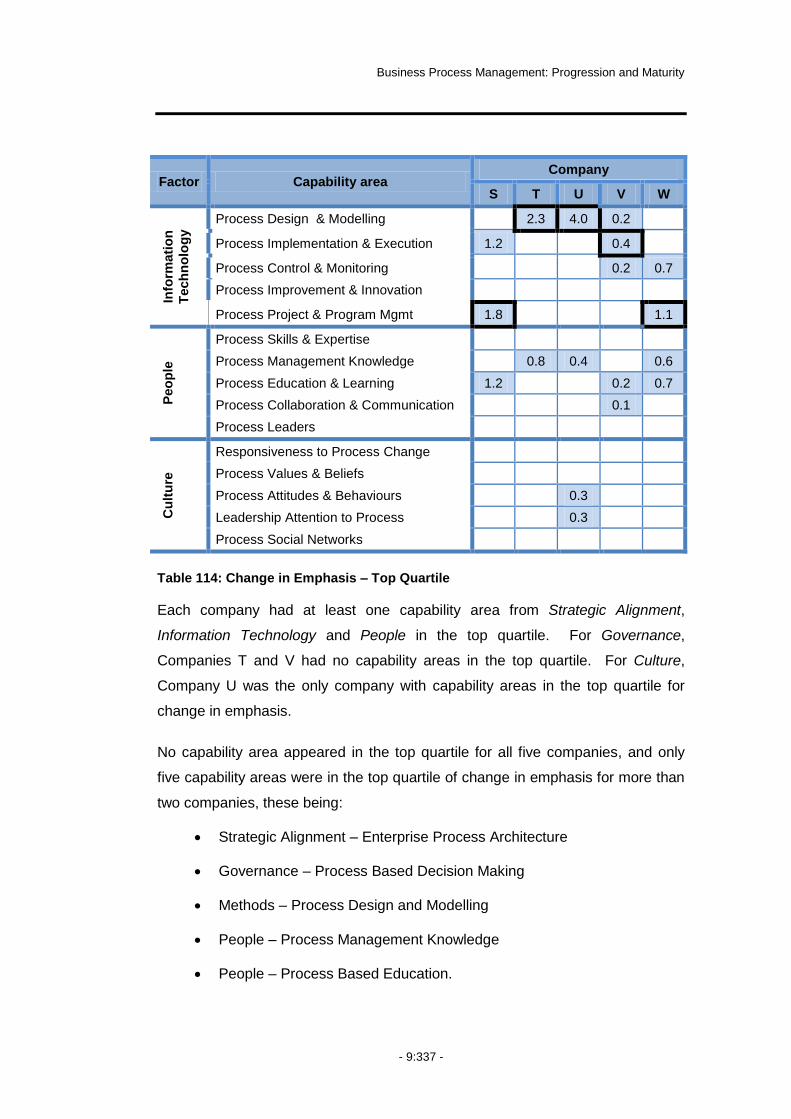
Business Process Management: Progression and Maturity
- 9:337 -
Factor Capability area Company
S T U V W
Info
rmati
on
Tech
no
log
y Process Design & Modelling 2.3 4.0 0.2
Process Implementation & Execution 1.2 0.4
Process Control & Monitoring 0.2 0.7
Process Improvement & Innovation
Process Project & Program Mgmt 1.8 1.1
Peo
ple
Process Skills & Expertise
Process Management Knowledge 0.8 0.4 0.6
Process Education & Learning 1.2 0.2 0.7
Process Collaboration & Communication 0.1
Process Leaders
Cu
ltu
re
Responsiveness to Process Change
Process Values & Beliefs
Process Attitudes & Behaviours 0.3
Leadership Attention to Process 0.3
Process Social Networks
Table 114: Change in Emphasis – Top Quartile
Each company had at least one capability area from Strategic Alignment,
Information Technology and People in the top quartile. For Governance,
Companies T and V had no capability areas in the top quartile. For Culture,
Company U was the only company with capability areas in the top quartile for
change in emphasis.
No capability area appeared in the top quartile for all five companies, and only
five capability areas were in the top quartile of change in emphasis for more than
two companies, these being:
Strategic Alignment – Enterprise Process Architecture
Governance – Process Based Decision Making
Methods – Process Design and Modelling
People – Process Management Knowledge
People – Process Based Education.
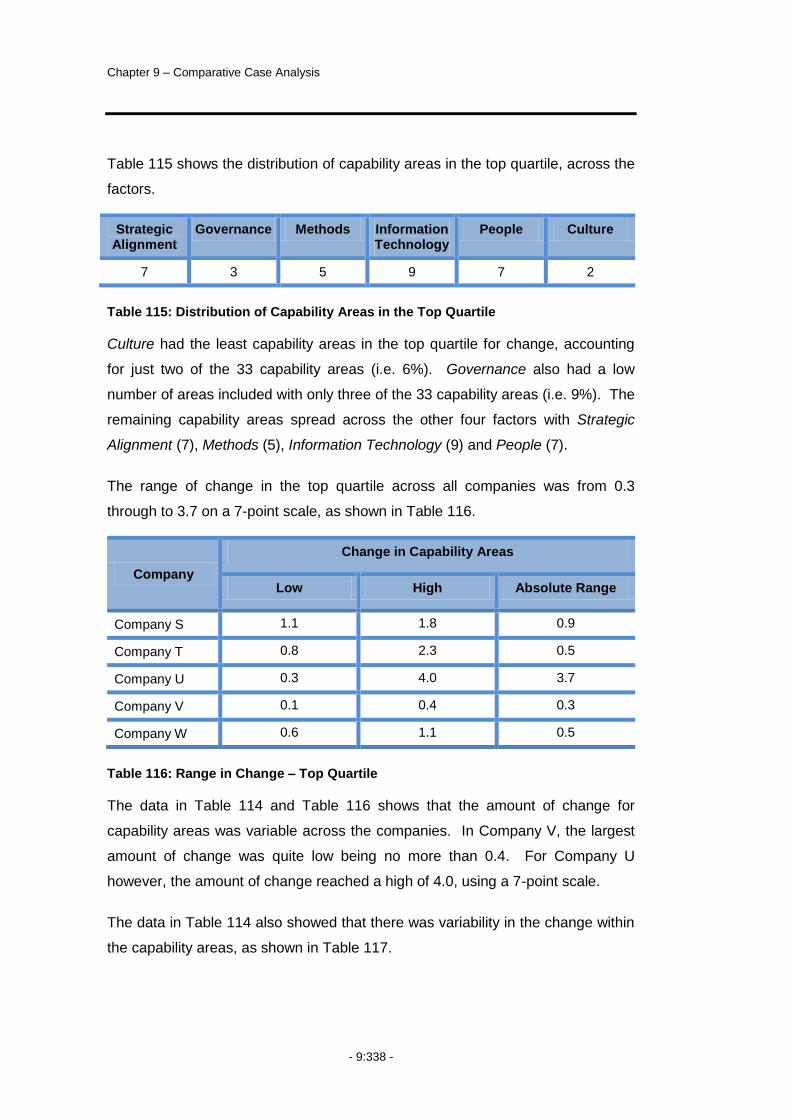
Chapter 9 – Comparative Case Analysis
- 9:338 -
Table 115 shows the distribution of capability areas in the top quartile, across the
factors.
Strategic Alignment
Governance Methods Information Technology
People Culture
7 3 5 9 7 2
Table 115: Distribution of Capability Areas in the Top Quartile
Culture had the least capability areas in the top quartile for change, accounting
for just two of the 33 capability areas (i.e. 6%). Governance also had a low
number of areas included with only three of the 33 capability areas (i.e. 9%). The
remaining capability areas spread across the other four factors with Strategic
Alignment (7), Methods (5), Information Technology (9) and People (7).
The range of change in the top quartile across all companies was from 0.3
through to 3.7 on a 7-point scale, as shown in Table 116.
Company
Change in Capability Areas
Low High Absolute Range
Company S 1.1 1.8 0.9
Company T 0.8 2.3 0.5
Company U 0.3 4.0 3.7
Company V 0.1 0.4 0.3
Company W 0.6 1.1 0.5
Table 116: Range in Change – Top Quartile
The data in Table 114 and Table 116 shows that the amount of change for
capability areas was variable across the companies. In Company V, the largest
amount of change was quite low being no more than 0.4. For Company U
however, the amount of change reached a high of 4.0, using a 7-point scale.
The data in Table 114 also showed that there was variability in the change within
the capability areas, as shown in Table 117.
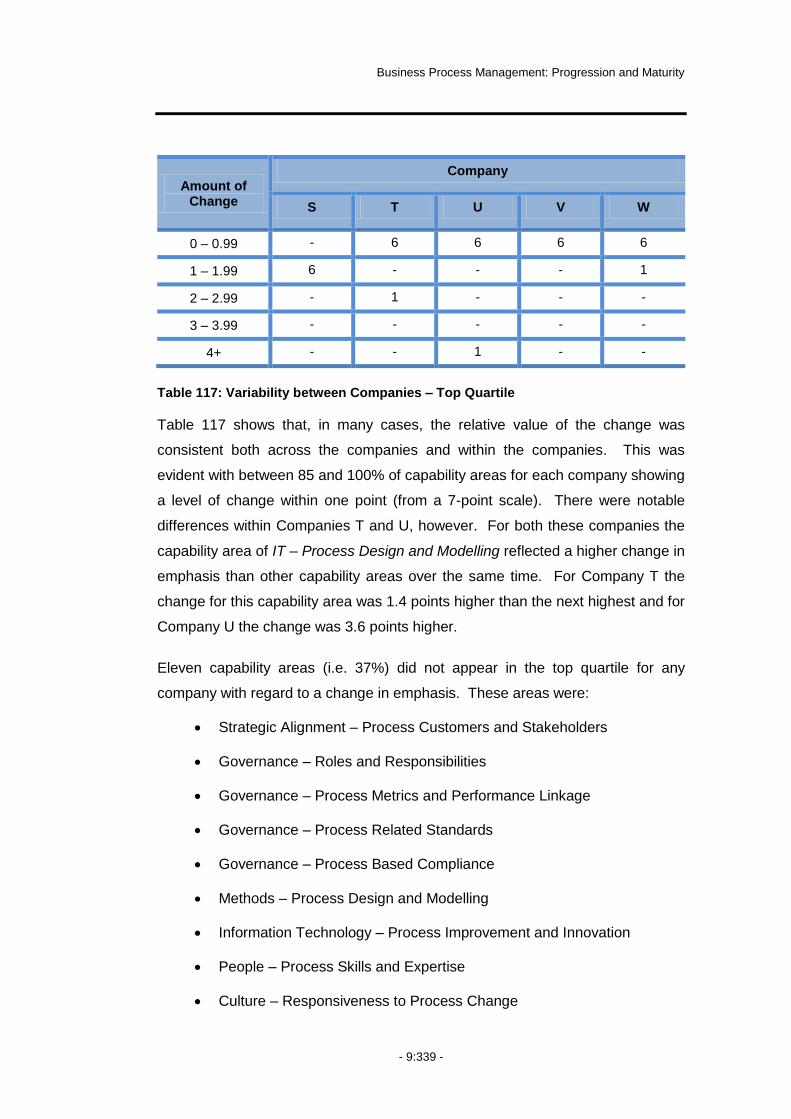
Business Process Management: Progression and Maturity
- 9:339 -
Amount of Change
Company
S T U V W
0 – 0.99 - 6 6 6 6
1 – 1.99 6 - - - 1
2 – 2.99 - 1 - - -
3 – 3.99 - - - - -
4+ - - 1 - -
Table 117: Variability between Companies – Top Quartile
Table 117 shows that, in many cases, the relative value of the change was
consistent both across the companies and within the companies. This was
evident with between 85 and 100% of capability areas for each company showing
a level of change within one point (from a 7-point scale). There were notable
differences within Companies T and U, however. For both these companies the
capability area of IT – Process Design and Modelling reflected a higher change in
emphasis than other capability areas over the same time. For Company T the
change for this capability area was 1.4 points higher than the next highest and for
Company U the change was 3.6 points higher.
Eleven capability areas (i.e. 37%) did not appear in the top quartile for any
company with regard to a change in emphasis. These areas were:
Strategic Alignment – Process Customers and Stakeholders
Governance – Roles and Responsibilities
Governance – Process Metrics and Performance Linkage
Governance – Process Related Standards
Governance – Process Based Compliance
Methods – Process Design and Modelling
Information Technology – Process Improvement and Innovation
People – Process Skills and Expertise
Culture – Responsiveness to Process Change

Chapter 9 – Comparative Case Analysis
- 9:340 -
Culture – Values and Beliefs
Culture – Process Management Social Networks.
Capability areas for Governance and Culture were the most represented on this
list, with four capability areas from Governance and three from Culture not
included in the areas with the most change for any company.
The next section details the change in emphasis for capability areas in the
bottom quartile across the five companies.
9.5.2 Capability areas with the Least Change in Emphasis
The shaded areas of Table 118 depict the capability areas that were in the
bottom quartile for each company with regard to the change in emphasis given
from the first year to the last year of the BPM Initiative. The shaded area with the
bold black outline reflects the capability area with the least change in emphasis
for each company.
Factor Capability area Company
S T U V W
Str
ate
gic
Alig
nm
en
t
Process Improvement Planning
Strategy & Process Capability Linkage
Enterprise Process Architecture 0.2 (0.1)
Process Measures (0.1)
Process Customers & Stakeholders 0.2 0.0 0.1
Go
vern
an
ce
Process Based Decision Making
Process Roles & Responsibilities 0.2 0.0 (0.1)
Process Metrics & Performance Linkage 0.4 (0.1) 0.1
Process Related Standards
Process Based Compliance
Meth
od
s
Process Design & Modelling 0.4 0.2
Process Implementation & Execution (0.1) 0.2
Process Control & Monitoring 0.4
Process Improvement & Innovation
Process Project & Program Mgmt (0.1)

Business Process Management: Progression and Maturity
- 9:341 -
Factor Capability area Company
S T U V W
Info
rmati
on
Tech
no
log
y
Process Design & Modelling 0.0
Process Implementation & Execution 0.2
Process Control & Monitoring 0.0
Process Improvement & Innovation 0.2 (0.0)104
Process Project & Program Mgmt (0.0)
Peo
ple
Process Skills & Expertise (0.0) 0.3
Process Management Knowledge
Process Education & Learning
Process Collaboration & Communication 0.3
Process Leaders 0.2
Cu
ltu
re
Responsiveness to Process Change 0.5 (0.2) 0.3
Process Values & Beliefs 0.2 (0.2)
Process Attitudes & Behaviours (0.1)
Leadership Attention to Process 0.5 0.0
Process Social Networks
Table 118: Change in Emphasis – Bottom Quartile
Each company had at least one capability area from Strategic Alignment,
Governance and Methods in the bottom quartile. For People, Companies S and
W had no capability areas in the bottom quartile, whereas for Culture, Company
U did not have any capability areas in the bottom quartile.
Information Technology was the only factor with every capability area in the
bottom quartile for at least one company. No capability area appeared in the
bottom quartile for all five companies.
Table 119 shows the distribution of the capability areas in the bottom quartile,
across the factors.
104
A (0.0) in this table recognises a reduction in emphasis on the capability area when calculated to two decimal places which is not apparent when the figure is rounded to one decimal point.

Chapter 9 – Comparative Case Analysis
- 9:342 -
Strategic Alignment
Governance Methods Information Technology
People Culture
6 6 6 6 4 8
Table 119: Distribution of Capability Areas in the Bottom Quartile
Culture had the most capability areas in the bottom quartile, accounting for eight
of the 36 capability areas (i.e. 22%). The remaining capability areas spread
across the other five factors with Strategic Alignment (6), Governance (6),
Methods (6), Information Technology (6) and People (4).
The range of change in the bottom quartile across all companies was low, with
the highest range being 0.5 from a 7-point scale, as shown in Table 120.
Company Range in Change
Low High Absolute Range
Company S 0.0 0.5 0.5
Company T 0.0 0.2 0.2
Company U (0.1) 0.0 0.1
Company V (0.2) (0.1) 0.1
Company W 0.0 0.3 0.3
Table 120: Range in Change – Bottom Quartile
The data in Table 118 and Table 120 also shows that the amount of change
within the capability areas in the bottom quartile was low. To this end, of the 36
capability areas included in the bottom quartile:
17 capability areas (i.e. 47%) had a change of emphasis in the range
from (0.1) to 0.1
12 capability areas (i.e. 33%) showed a reduction in emphasis over
time105
Only two capability areas (i.e. 6%) showed a change of 0.5, the highest
amount of change.
105
This includes those rounded to (0.0) from a negative figure at two decimal places.

Business Process Management: Progression and Maturity
- 9:343 -
Eight capability areas (i.e. 27%) did not appear in the bottom quartile for any
company with regard to level of change over time. These areas included:
Strategic Alignment – Process Improvement Planning
Strategic Alignment – Strategy and Process Capability Linkage
Governance – Process Related Standards
Governance – Process Based Compliance
Methods – Process Improvement and Innovation
People – Process Management Knowledge
People – Process Education and Learning
Culture – Process Management Social Networks.
The only factor that had all capability areas in the bottom quartile for at least one
company was Information Technology.
9.6 Discussion on Key Themes
In keeping with the aims of the longitudinal study, this section summarises the
key points arising from the investigation of the change in emphasis from the first
to the last year of the BPM Initiatives. This summary focuses on (1) select
demographics of the BPM Initiative including the structure of the Initiative and the
level of Executive Buy-In and (2) on the factors and capability areas from the
BPM Capability Framework.
9.6.1 Structure of the BPM Initiative
When designing the data collection instruments for the longitudinal case study,
the Researcher proposed categories for classifying the structure of the BPM
Initiative. It became apparent however that the proposed categories were not
sufficient. Rather the Researcher found that there was a scope to the BPM
Initiative (i.e. the area of the company it applied to) and an approach to
implementing the BPM Initiative (i.e. the means by which the company was
implementing it). Consequently, in this section the Researcher discusses
findings based on both the approach and the scope.

Chapter 9 – Comparative Case Analysis
- 9:344 -
Scope
During the first year, three of the five companies were adopting an enterprise-
wide scope to their BPM Initiative, Companies S, T and W. The remaining two
companies, U and V were adopting the BPM Initiative only within a defined area
of their business – the Customer Operations Group and the Business
Improvement Team. The scope of the BPM Initiatives did not change through the
duration of the study.
Within the first year, the Researcher identified commonality in the companies
adopting a BPM Initiative with an enterprise-wide scope with a notable selection
of capability areas that contributed to establishing a foundation for building BPM
capability across an organisation. These companies also displayed a higher
emphasis on these capability areas in the last year of the study.
Approach
At the commencement of the BPM Initiatives, all five companies were using a
project-based approach to implementation. During the first year of the BPM
Initiatives, the Researcher identified some areas of commonality between all
companies. The project-based approach of all companies reflected in a high
emphasis on capability areas with a focus on process modelling, improvement
and change during this first year.
This shows the potential for common paths of progression dependent on
the approach to the BPM Initiative during early stages of implementation.
This shows the potential for common paths of progression dependent on
the scope of the BPM Initiative during early stages of implementation.
Business Process Management: Progression and Maturity
- 9:345 -
The approach to implementation then changed for a number of companies. From
the first to the last year, two of the three companies with an enterprise-wide
scope (i.e. Company T and W) recognised a BPM team as a centre of excellence
through which co-ordinated projects were run as a body of work. Company S,
the remaining company with an enterprise wide approach also had a small team
running a co-ordinated program of projects for its BPM Initiative but did not refer
to this as a centre of expertise. One of the companies with a narrow scope (i.e.
Company V) also progressed from having an ad hoc, project-based approach to
having a centre of excellence. Company U remained with having a project-based
approach throughout the study.
In the first year, no company emphasised capability areas that supported the co-
ordinated management of projects and programs, such as the Method or IT
capability areas for Process Project and Program Management being in the top
quartile. For some companies, these capability areas were actually in the bottom
quartile during the first year. Over time however, the emphasis on these
capability areas increased for a number of companies, with the capability areas
making it to the top quartile for the level of emphasis in the last year and for a
change in emphasis.
This suggests that, as companies become more co-ordinated in their
implementation of a BPM Initiative, building capability in areas of Process
Project and Program Management becomes a higher priority.
This shows the potential for companies to change the structure of their
BPM Initiative over time.
Furthermore, it suggests a staged approach to progression may be
identifiable.
Chapter 9 – Comparative Case Analysis
- 9:346 -
Level of Executive Buy In
At the beginning of their BPM Initiatives, the three companies with an enterprise
wide scope (i.e. Companies S, T and W) had lower levels of Executive Buy-In
than did the two companies that had BPM Initiatives applied only within a defined
area of the company.
All three companies with an enterprise-wide initiative reported having a mandate
to progress the BPM Initiative at the time of commencement. Despite this, all
three reflected low levels of Executive Buy-In at the beginning of the BPM
Initiative. Company T lost its mandate part way through the journey due to
changes in the executive and board106. In later stages of the BPM Initiative
Company T displayed increasing similarities with Companies U and V and
decreasing similarity with Companies S and W.
106
See Chapter 8 for details.
This shows that a high level of Executive Buy-In to a BPM Initiative,
either at the beginning or at a later stage, does not necessarily equate
with an enterprise-wide scope.
It also shows that a low level of Executive Buy-In to a BPM Initiative
during the early stages of a BPM Initiative does not necessarily equate
with the BPM Initiative having a limited scope.
Consequently, the level of Executive Buy-In may not be a good predictor
of the scope of a BPM Initiative.

Business Process Management: Progression and Maturity
- 9:347 -
The two companies that had a narrow scope for their BPM Initiative and high
levels of Executive Buy-In (i.e. Company U and Company V) were the only two
companies to show a reduction in the emphasis placed on capability areas.
The three companies with an enterprise wide scope (S, T and W) all had a
notable change in the levels of Executive Buy-In from the first to the last year with
increases over their starting levels of 45%, 26% and 203% respectively.
Conversely, the two companies (U and V) where the scope was within a defined
business unit had only a small change in Executive Buy-In with it increasing over
the starting level by only 5% and less than 1% respectively.
The variation within the change in Executive Buy-In for the three
companies with enterprise wide BPM Initiatives shows that companies
may achieve different outcomes from emphasising the same capability
area.
This shows that higher levels of Executive Buy-In do not necessarily lead to
sustainability of emphasis on capability areas.
This indicates that having a CEO (or equivalent) mandate for a BPM
Initiative is different to the level of Executive Buy-In.
It also indicates that having a CEO (or equivalent) mandate for the BPM
Initiative may be necessary to progress the development of some
capability areas.

Chapter 9 – Comparative Case Analysis
- 9:348 -
All three companies with low levels of Executive Buy-In emphasised the
capability area of Culture – Leadership Attention to Process. This capability area
was in the top quartile for Company S in both the first and last year and for
Company W in the last year. It was in the top quartile for Company T during the
first year but had dropped to the bottom quartile by the last year. For Company U
it was in the bottom quartile in both the first and the last year.
9.6.2 Factors and Capability areas
The data showed that the emphasis placed on capability areas during a given
year and the change in emphasis on capability areas over time was variable.
There was variability between companies, variability in the magnitude of change
(see Table 116 and Table 120) and variability within companies (see Table 117).
The data also showed that the direction of a change in emphasis on a capability
area was not always positive, with a few companies showing either no change or
negative change. Companies U and V were the only two companies to have a
reduction in emphasis in any capability areas from the first year to the last.
This indicates that progression of capability areas is not always linear nor
always in a forward direction.
This indicates that companies make a conscious selection of (1) the
capability areas on which to place emphasis and (2) choose the amount of
emphasis they place on them, in response to their own needs.
This shows that companies progress capability areas based on their own
contextual environment. Those with a low level of Executive Buy-In
emphasised Leadership Attention to Process whereas those that already
had high levels of Executive Buy-In did not.
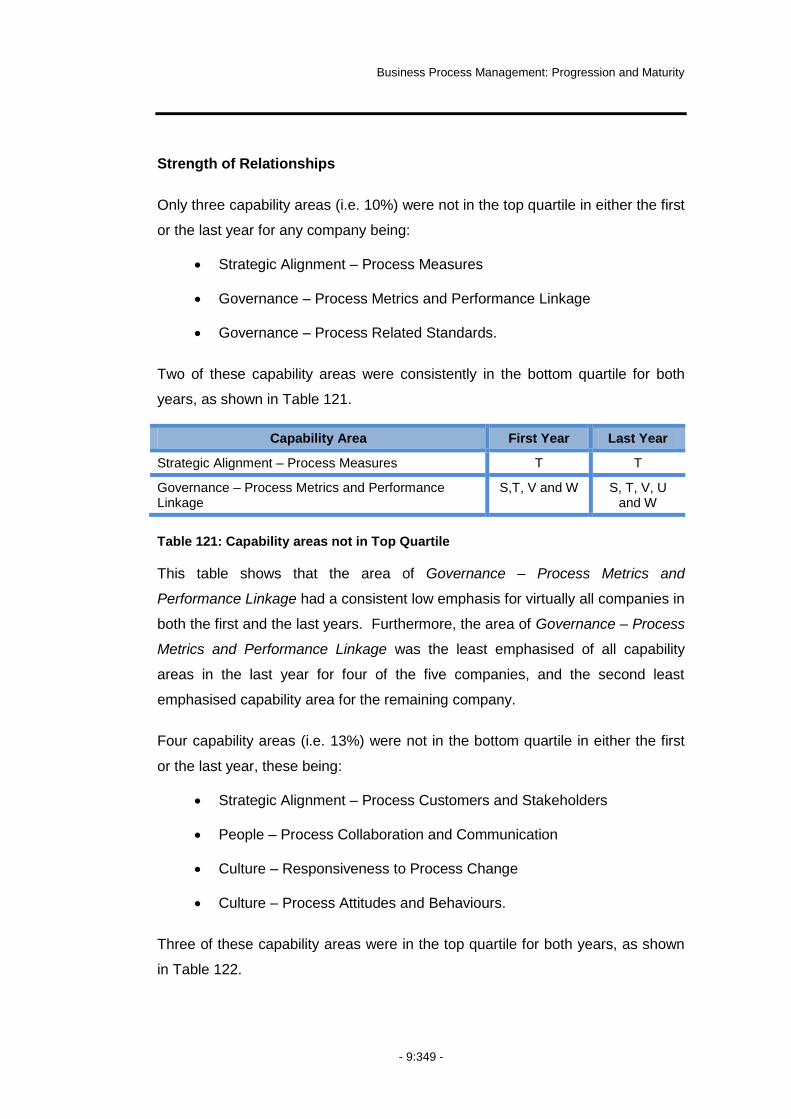
Business Process Management: Progression and Maturity
- 9:349 -
Strength of Relationships
Only three capability areas (i.e. 10%) were not in the top quartile in either the first
or the last year for any company being:
Strategic Alignment – Process Measures
Governance – Process Metrics and Performance Linkage
Governance – Process Related Standards.
Two of these capability areas were consistently in the bottom quartile for both
years, as shown in Table 121.
Capability Area First Year Last Year
Strategic Alignment – Process Measures T T
Governance – Process Metrics and Performance Linkage
S,T, V and W S, T, V, U and W
Table 121: Capability areas not in Top Quartile
This table shows that the area of Governance – Process Metrics and
Performance Linkage had a consistent low emphasis for virtually all companies in
both the first and the last years. Furthermore, the area of Governance – Process
Metrics and Performance Linkage was the least emphasised of all capability
areas in the last year for four of the five companies, and the second least
emphasised capability area for the remaining company.
Four capability areas (i.e. 13%) were not in the bottom quartile in either the first
or the last year, these being:
Strategic Alignment – Process Customers and Stakeholders
People – Process Collaboration and Communication
Culture – Responsiveness to Process Change
Culture – Process Attitudes and Behaviours.
Three of these capability areas were in the top quartile for both years, as shown
in Table 122.

Chapter 9 – Comparative Case Analysis
- 9:350 -
Capability Area First Year Last Year
People – Process Collaboration and Communication S, T and W S and T
Culture – Responsiveness to Process Change S, U, V and W S, U and W
Culture – Process Attitudes and Behaviours T and W T
Table 122: Capability areas not in the Bottom Quartile
This table shows a consistently higher emphasis on these capability areas for a
number of companies.
9.7 Chapter Summary
This chapter detailed the cross-case analysis of data looking for commonality and
distinction within the five longitudinal case studies.
This chapter first provided a summary of the demographics of the companies and
their BPM Initiatives. The next sections presented the analysis of case study
data for the first year, the last year and the change between the years with regard
to the level of emphasis the companies placed on the capability areas.
Furthermore, the sections for the first and last years summarised the key points
within each area for the year.
The chapter concluded with a discussion on the key themes that emerged from
the data with regard to the structure of the BPM Initiatives, including their scope
and approach, the levels of Executive Buy-In and the potential for relationships
between the capability areas.
Based on the findings of this study to date, the next chapter proposes theory on
the progression and measurement of BPM Initiatives.
These examples show that there is potential for the strength of
relationships to vary across and within the capability areas.
Business Process Management: Progression and Maturity
- 10:351 -
10 Theory Building
hapter 6 presented a number of theoretical implications for BPM
Progression based on findings from the exploratory case study. In light
of these earlier findings, the Researcher conducted a series of
longitudinal case studies to investigate the progression of BPM Initiatives with a
view to improving the generalisability of subsequent theory. Consequently,
Chapters 7, 8 and 9 presented the longitudinal case studies, undertaken with five
organisations. The aim of this chapter is to integrate the key findings of the study
into theory on BPM Progression and a measurement model for BPM Maturity.
10.1 Chapter Overview
Section 2 considers the classification of theory including Gregor‟s (2002 and
2006) purpose of theory, Sabherwal et al.‟s (2001) type of theory and Edward
and Bagozzi‟s (2000) nature and direction of relationships between constructs
and measures. Using these classifications, the Researcher presents the theory
supported by this study as follows. Section 3 positions the BPM Capability
Framework and a typology for BPM Initiatives as theories for analysing (Gregor,
2006). Section 4 details an explanatory theory (Gregor, 2006) for BPM
Progression. Section 5 positions the explanatory theory against Sabherwal et
al.‟s (2001) punctuated equilibrium theory. Section 6 details an explanatory and
predictive (EP) theory (Gregor, 2006) for BPM Maturity. Section 7 positions the
EP theory as a multi-dimensional, formative model. Section 8 provides a
summary of the chapter.
C

Chapter 10 – Theory Building
- 10:352 -
10.2 Classification of Theory
Researchers including Sutton and Staw (1995) and Weick (1995) have discussed
what does or does not constitute theory. In this study, the Researcher classifies
the proposed theory based on its purpose (as defined by Gregor, 2002 & 2006),
its type (as defined by Sabherwal et al., 2001) and the nature of its constructs (as
defined by Edwards & Bagozzi, 2000).
10.2.1 Types of Theory
Gregor (2006) defines five theory types based on the purpose or goals of the
theory these being analysing, explaining, predicting, explaining and predicting
(EP theory), and design and action. According to Gregor (2006), classification by
purpose depends on the underlying question of the research. Gregor (2006)
indicates that, within IS, classification of theory by its purpose is appropriate, as it
is an applied discipline. Furthermore, understanding the purpose of the theory
defines what the theory aims to achieve and guides the basic elements that the
theory should contain.
Sabherwal et al. (2001) provide an alternative means of defining the type of
theory categorising IS Management theory into universalistic, contingency,
lifecycle and punctuated equilibrium theories. The basis for their classification of
theory is the underlying assumptions made with regard to the phenomenon under
investigation and the environment in which the phenomenon occurs. Sabherwal
et al. (2001) indicate that classification in this way is useful in studying strategic
IS management as a dynamic concept rather than a static one.
Edwards and Bagozzi (2000) distinguish theory based on the nature and
direction of the relationship between constructs and measures. To this end,
Edwards and Bagozzi (2000) distinguish between reflective and formative
measures. The basis for their classification lies in the causal direction of the
relationship between the construct and measure.
Within this study, the Researcher sees value in applying each of these distinctive
classifications of theory. Considering Gregor‟s (2002, 2006) purpose of the
theory is useful because it defines what should be included within each theory

Business Process Management: Progression and Maturity
- 10:353 -
type. It also enables the identification of different types of theory that meet
different purposes and contribute to building a cumulative body of knowledge.
Considering Sabherwal et al.‟s (2001) types of theory is useful as it contributes to
defining the circumstances and assumptions under which the stated theory
applies. In doing so, it defines the generalisability of the theory and increases its
transferability. Furthermore, this classification acknowledges the temporal nature
of progression. Considering Edwards and Bagozzi‟s (2000) nature and direction
between constructs and measures is important as it contributes to the future
testability of the theory.
10.2.2 Theory Supported by this Study
The theory supported by this study as categorised by Gregor‟s (2002, 2006)
purpose is set out in Table 123.
Theory Purpose
(Gregor 2002 & 2006)
BPM Capability Framework Theory for Analysing
Typology for BPM Initiatives Theory for Analysing
Theory for BPM Progression Theory for Explaining
BPM Maturity Measurement Model Theory for Explaining and Predicting (EP Theory)
Table 123: BPM Theory supported by this Study
The following sections provide further insights into each of these theories.
Subsequent sections position the proposed explanatory theory using Sabherwal
et al.‟s (2001) classification and the proposed EP theory, using Edwards and
Bagozzi‟s (2000) distinction between formative and reflective constructs.
10.3 Theory for Analysing
According to Gregor (2006, 622):
“…Analytic theories analyse “what is” as opposed to explaining
causality or attempting predictive generalizations...”
Chapter 10 – Theory Building
- 10:354 -
Gregor (2002) defines two types of theory for analysing, including naming and
classification. In particular Gregor (2002, 7) states:
“…A naming theory is a description of the dimensions or
characteristics of some phenomenon. A classification theory is more
elaborate in that it states that the dimensions or characteristics of a
given phenomena are structurally interrelated. The dimensions may
be mutually exclusive, overlapping, hierarchical or sequential...”
Gregor (2006) extends earlier work, defining a “Theory for Analyzing”, indicating
that this type of theory includes frameworks, taxonomies, typologies and
classification schema. Gregor (2006) suggests analysing theory is valuable
when the phenomenon under investigation is largely unknown. Furthermore,
Gregor (2006) claims theory that provides clear definition of constructs is
necessary for the development of all other theory types.
Within this study, the Researcher makes two contributions that satisfy as theory
for analysing (as defined by Gregor, 2006) – a framework for classifying factors
critical to progressing BPM Initiatives based on the capability areas that define
them, and a typology for classifying BPM Initiatives. The following sections detail
these contributions.
10.3.1 The BPM Capability Framework
The Researcher proposed the BPM Capability Framework following the Delphi
studies in Chapter 5. Figure 49 reiterates this framework.

Business Process Management: Progression and Maturity
- 10:355 -
Figure 49: BPM Capability Framework
This framework satisfies Gregor‟s (2002, 2006) requirements of theory for
analysing as shown in Table 124.
Theory Component Instantiation
Means of Representation Words, diagrams.
Primary Constructs Factors and Capability Areas.
Statements of Relationships Two tiers with six Factors, each further defined by five Capability Areas.
Scope A means for understanding the important components of BPM and enabling the subsequent identification of measurement items.
Causal Explanations Not present.
Testable Propositions Not present.
Prescriptive Statements Not present.
Table 124: The BPM Capability Framework as a Taxonomic Theory
Process Improvement &
Innovation
Process Management
Decision Making
Process Measures
Process Improvement
Planning
Process Management
Knowledge
Process Skills & Expertise
Process Values & Beliefs
Responsiveness to Process Change
Process Management
Leaders
Process Collaboration & Communication
Leadership Attention to
Process
Process Related Standards
Process Metrics & Performance
Linkage
Process Roles & Responsibilities
Enterprise Process Architecture
Strategy & Process Capability Linkage
Process Customers & Stakeholders
Process Monitoring &
Control
Process Implementation &
Execution
Process Design & Modeling
Process Monitoring &
Control
Process Implementation &
Execution
Process Design & Modeling
Process Education & Learning
Process Attitudes & Behaviors
Process Program & Project
Management
Process Improvement &
Innovation
Process Program & Project
Management
Process Management
Social Networks
Process Based Compliance
Governance MethodsStrategic
AlignmentInformation Technology
People Culture
Factors
Cap
ability A
reas

Chapter 10 – Theory Building
- 10:356 -
The BPM Capability Framework was developed at a time when little was known
about how the factors critical to the progression of BPM Initiatives might be
measured and defined. The framework provides delineation between the
constructs (i.e. the factors) and their associated measures (i.e. the capability
areas). In so doing, this framework defines what is important in measuring the
progression of BPM Initiatives but does not provide insights into the relationships
between these components. Furthermore, the development of this framework
enabled the conduct of further case studies that led to the subsequent
development of explanatory and EP theory.
10.3.2 Typology of BPM Initiatives
In Chapter 1 and Chapter 3, the Researcher distinguished between three
common applications of the term BPM that occur within extant literature. The
basis for this distinction was BPM as a technology solution, BPM as a lifecycle
approach to the management of processes, and BPM as an organisational
approach focused on the management of the organisation using a process
perspective, as opposed to the traditional functional view.
These differing views of BPM presented a challenge to this study. On the one
hand, they made it difficult to compare and contrast existing literature, as it was
not always clear to which BPM interpretation articles refer. On the other hand, in
conducting case studies, the Researcher had to contend with the possibility that
the BPM Initiatives within the participating organisations could vary, dependent
on the interpretation of BPM adopted by each organisation. To address these
issues, the Researcher used definitions of both BPM and BPM Initiative when
collecting data in combination with a pre-defined list of BPM structures107.
The definition of BPM separated the traits, characteristics and principles of BPM
(i.e. the philosophy of BPM) from the structure of the BPM Initiative within an
organisation. The pre-defined list attempted to capture different structures of
BPM Initiative including categories of: Ad Hoc, Project Based, Centre of
Excellence and Enterprise-wide Program. At the time, the intention was for
107
Chapter 1 details these definitions.

Business Process Management: Progression and Maturity
- 10:357 -
companies to position their BPM Initiative against one of these categories.
During the longitudinal case studies however, it became apparent that the pre-
defined list of structures was not sufficient, as the BPM Initiatives within
companies did not fit into just one of the categories. In some cases, participants
within a single company selected different options. In other cases, participants
provided additional commentary with regard to their selection. Within Company
V for example, three participants selected Project Based, two participants
selected Pockets of Excellence and one participant selected both Project Based
and Pockets of Excellence. Company T had a similar discrepancy between
participants, as did Company W. In Company S however, all participants
selected Enterprise Wide Program but the Key Contact, who was also the
Program Manager for the BPM Initiative, provided further insight, stating:
“…we have an enterprise-wide program in that we have conducted
a review of work processes across the organisation (…) but it‟s
project-based in that we are running a program of projects that
include, establishment of BPM framework, an overall change and
renewal framework and an enterprise model.”
The practical insights and experiences gained during the case studies, combined
with the conflicting interpretative aspects of the term BPM within the extant
literature, led the Researcher to propose a typology for BPM Initiatives, as shown
in Figure 50. In doing so, the Researcher aims to contribute to future research by
providing an effective and consistent means of categorising BPM Initiatives.
Figure 50 shows the proposed typology, depicting the concept of the BPM
Initiative as a combination of scope and approach. This typology integrates
these elements with the three common interpretations of BPM from Chapter 1.

Chapter 10 – Theory Building
- 10:358 -
Figure 50: Typology for BPM Initiatives
In the context of the proposed typology:
Scope means the extent to which the BPM Initiative applies within an
organisation (i.e. Does it apply to the entire organisation, only within a single
business unit or some other defined component of the business?).
Approach refers to the manner in which the organisation operationalises the
BPM Initiative (i.e. Is it an ad hoc approach to process improvement projects, a
project-based process improvement program or a fully integrated program
including process change and review projects?).
Time recognises the notion of time, being the passage of time from when an
organisation begins to recognise process improvement or management within the
organisation.
Approach
Defined Unit
Ad Hoc Integrated Program
Isolated Efforts
Project Based
Enterprise Wide
Sco
pe
Life-cycle BPM Frontier
Organisational BPM Frontier
Technological BPM Frontier
Time

Business Process Management: Progression and Maturity
- 10:359 -
This depiction derives (in part) from Porter‟s (1996) concept of productivity
frontiers in strategic management. When comparing operational effectiveness to
strategic positioning, Porter (1996) saw the availability of processes, technologies
and best practice as enabling an organisation to operate at maximum efficiency,
while seeing the strategies for combining these as what differentiated
organisations, enabling higher returns.
The Researcher contends that Porter‟s arguments can also apply to BPM
Initiatives. The principles of BPM aim at maximising the efficiency and
effectiveness of processes, technologies and best practice through the
streamlining, standardisation, integration and automation of processes108. It is
the manner in which each organisation applies BPM principles however, that will
determine the consequences of their application. This is due, in part, to the
varying definitions of BPM discussed earlier in Chapters 1 and 3 (i.e. Technology,
Lifecycle and Organisational) and thus the different types of BPM Initiatives that
can exist in an organisation.
By way of example: in Chapter 1 the Researcher proposed a definition for BPM
including (among others) principles such as standardising and streamlining
processes, eroding cross-functional boundaries, simplifying process work and
defining the end-to-end processes of the organisation. The Researcher also
recognised that the BPM Initiative within organisations could vary dependent
upon the interpretation of BPM (i.e. Technology, Lifecycle and Organisational).
In an organisation with a limited scope to their BPM Initiative, having it apply
within a single technologically based project or business unit, the ability to erode
cross-functional boundaries may be restricted to those that touch on the business
unit in questions. Similarly, the ability to standardise and streamline processes
may be limited to only those within the business unit. Alternatively, where a BPM
Initiative encompasses the entire organisation such principles may apply more
broadly within the organisation, and may even address external boundaries with
customers and other stakeholders. The ability of the organisation to optimise
process outcomes across the entire organisation is therefore greater.
108
See the definition of BPM in Chapter 1 for further details of the BPM principles.

Chapter 10 – Theory Building
- 10:360 -
Consequently, the Researcher proposes that a company adopting an
organisational BPM approach has the potential to achieve a higher level of
organisational performance, over time, with a common bundle of processes,
technologies and best practice, than those that adopt a lifecycle approach. In
turn, those that adopt a lifecycle approach have the potential to achieve more,
over time, than those that adopt a technological view of BPM.
Further research is required to substantiate this proposed typology. If
substantiated, the typology would become an EP theory as the structure of the
BPM Initiative would become predictive of the level of achievement, over time.
This argumentation is consistent with Gregor‟s (2006) example of the
categorisation of Miles and Snow‟s (1978) ideal organisation types by Doty and
Glick (1994).
10.4 Theory for Explaining
Gregor (2006) indicates that theory for explaining does not have testable
predictions as its primary focus. Rather, it looks to explain how and why the
phenomenon occurs. To this end, Gregor (2002, 2006) defines two sub-types of
theory for explanation being its use as a “sensitising device” and as
“conjectures”.
With regard to being a sensitising device, Gregor (2006) positions the theory as a
high-level theory that serves to enlighten. Consequently, the theory does not aim
at high generalisability but rather, is paradoxical, complex and unfamiliar, seeking
to challenge conventional notions.
With regard to conjectures, Gregor (2002, 8) states:
“…conjectures are drawn from a study of how and why things
happened in some particular real world situation. These conjectures
could form the basis of subsequent theory development, or be used
to inform practice…”
Gregor (2006) suggests that many case studies fall into this lower level category.
Furthermore, with regard to theories of explanation, Gregor (2006, 624) states:
Business Process Management: Progression and Maturity
- 10:361 -
“…the theory itself is an end product and not expected to lead to
predictive, deterministic theory…”
Within this study, the Researcher proposes explanatory theory on BPM
Progression. This includes conjectures derived from the experiences within the
various case studies.
10.4.1 Explanatory Theory of BPM Progression
Throughout this study, a number of themes emerged with regard to the
progression of BPM Initiatives within organisations. These themes include:
The scope and approach to the BPM Initiative
Organisational Context
Changes in Contextual Variables
Level of Executive Buy-In.
These themes form the basis of the proposed theory on BPM Progression,
articulated on the next page. The themes also combine with the experience
gained through the study to enable the Researcher to present a number of
conjectures in Table 125. These conjectures lay the foundation for future studies
by way of presenting testable propositions and hypotheses arising from this
study.
Section 10.5 then provides an evaluation of the proposed explanatory theory for
BPM Progression against Sabherwal et al. (2001) theory types. In doing so, it
demonstrates how the case study data from this study supports the proposed
theory. Classification against Sahherwal et al. (2001) theory types is also
important to the subsequent proposal of the EP theory for BPM Maturity in
Section 10.6. This is because it highlights key issues from BPM Progression that
a measurement model needs to incorporate in order to avoid spurious results.

Chapter 10 – Theory Building
- 10:362 -
BPM Progression is dynamic and varies between organisations and over time.
Progression is not always linear nor in a forward-direction and does not
universally follow the same stages.
Common progression paths may be identifiable based on the:
a) scope of the BPM Initiative
b) approach to implementing the BPM Initiative
The organisational context (including the Executive Buy-In at that time)
at the commencement of the BPM Initiative will influence the scope of
the BPM Initiative and the approach taken to implementing the BPM
Initiative.
Variation in the progression of BPM Initiatives can arise due to any
combination of the:
a) scope of the BPM Initiative
b) approach taken to implementing the BPM Initiative
c) changes in the organisational context arising from changes in
contextual variables
Changes to the structure of the BPM Initiative and the organisational
context in which it occurs will advance and / or constrain progression
over time by redirecting, inhibiting or enabling the development of BPM
capability areas along the progression path. This may have a positive,
negative or neutral impact on progression.
Significant changes in contextual variables may result in revolutionary
periods of activity. A more stable, evolutionary period of activity will
precede and succeed such a revolutionary period.

Business Process Management: Progression and Maturity
- 10:363 -
10.4.2 Conjectures from the Theory of BPM Progression
Conjecture Case Study Evidence Further Comment
Variation in Progression
During early stages of implementation, companies adopting a BPM Initiative consistent with a lifecycle approach are likely to display higher emphasis on the Methods and IT factors than companies adopting a BPM Initiative consistent with an organisational approach.
See Longitudinal Cases – Company S, T and W for organisational approach and Company U and V for lifecycle approach.
Requires further research to substantiate.
During later stages of implementation, companies adopting a BPM Initiative consistent with a lifecycle approach are less likely to make as much progress in factors of Strategic Alignment, Governance, People and Culture than companies adopting a BPM Initiative consistent with an organisational approach.
See Longitudinal Cases – Company S, T and W for organisational approach and Company U and V for lifecycle approach.
Requires further research to substantiate.
Distinctive stages of progression may be discernible over time.
See Longitudinal Cases. Requires further research to substantiate.
Factors will reflect more stability and show less variance than their capability areas over the same time.
See Longitudinal Cases. Important insights into progression maybe overlooked if research focuses only at a factor level.
Variance in factors and capability areas is likely to be greater during earlier stages of progression and is likely to reduce during later stages of progression.
See Longitudinal Cases. Requires further research to substantiate.
Organisational Context
Adopting BPM Initiatives with an enterprise-wide scope See Longitudinal Cases - Company S and Company
During early stages of implementation, this may not

Chapter 10 – Theory Building
- 10:364 -
Conjecture Case Study Evidence Further Comment
requires executive mandate. W. necessarily reflect in high levels of Executive Buy-In.
Without an executive mandate for an enterprise-wide scope, a lifecycle approach to the BPM Initiative is more likely.
See Longitudinal Cases – Company U and V.
Such Initiatives may display high levels of Executive Buy-In during early stages of implementation if driven by a small number of highly committed executives.
Commencing a BPM Initiative with a limited scope (i.e. defined to a discrete business area) is more likely in areas where processes are heavily transactional or where significant advancement can arise from automation or improvement.
See Longitudinal Cases – Company U and V.
Requires further research to determine whether the different interpretations of BPM (i.e. lifecycle and organisational) are more or less common in different situations.
Changes Leading to Variation in Progression Paths
Organisations will use different strategies to progress capability areas dependent on the specifics of the organisation and the contextual variables in effect at the time.
See Company A, B and M for early insights.
See Longitudinal Cases and Appendix 13.4.7 for examples of variation in practices.
Requires further research to develop understanding of how and why different strategies are selected and what impact this has on the overall success of the BPM Initiative.
The origin of a contextual variable may be internal or external to the organisation.
See all Case Studies. Examples of internal variables include: Executive Buy-In, Organisational Commitment, Organisational Ownership Structure, Technology.
Examples of external variables include: Legislation / Compliance, Market Conditions, Unionisation.
Requires further research to develop complete list of all major contextual variables.
The impact of a change in any given contextual variable is See Longitudinal Case Requires further research to understand impact and/or

Business Process Management: Progression and Maturity
- 10:365 -
Conjecture Case Study Evidence Further Comment
temporal, and is likely to rise and fall over time. Studies. duration of affect.
Contextual variables can have a positive (i.e. cause a deliberate increase in emphasis) or a negative (i.e. cause a deliberate reduction or avoidance of) influence.
See Longitudinal Case Studies – Company U and V.
Requires further research to gain a deeper understanding of the possible consequences of different contextual variables and the associated affect of a change.
The impact of a given contextual variable is not always in the same direction.
See Company U for an example of where legislation has a decreasing impact and Company M for an example of legislation having an increasing impact.
Requires further research to understand further implications.
Unionisation can inhibit progress in some capability areas e.g. Governance – Process Roles and Responsibilities and Process Metrics and Performance Linkage.
See Company A and B for evidence of limitations and Company M for evidence where lack of unionisation was credited with being able to achieve progression.
Requires further research to understand the implications including the impact of redirection and the adoption of strategies for progression in these areas.
The characteristics of a company‟s workforce can affect the progression of some capability areas.
See Company A discussion on having to overcome a “culture of engineers”.
See Company B discussion on the consequence of “having a predominantly male workforce over the age of 45”.
Requires further research to understand the implications including the impact of redirection and the adoption of strategies for progression in these areas.
Table 125: Conjectures about BPM Progression

Chapter 10 – Theory Building
- 10:366 -
10.5 Classification of Explanatory Theory
When investigating the evolution of alignment over time, Sabherwal et al. (2001)
discussed the classification of theory based on its type. This classification
included universalistic, contingency, lifecycle and general theories such as the
punctuated equilibrium model. The next sections discuss each of these
categories with regard to further classifying the explanatory theory supported by
this study.
Universalistic Theory
The first type of theory discussed by Sabherwal et al. (2001) was universalistic
theory, a description of which is below in Table 126.
Theory Type Description
Universalistic Present one way of performing management.
Focus on how this way can be improved.
Provide valuable insights through this focus.
View the same approach as useful in all situations.
Don‟t examine multiple approaches in alternate context.
More appropriate to relatively narrow domains.
Table 126: Description of Universalistic Theory
Researchers such as Ittner and Larcker (1997), and Pritchard and Armistead
(1999) have previously shown that there is more than one-way in which to
progress BPM and that the same approach is unlikely to be useful in all
situations. Furthermore, the focus of this study has not been on how to improve
the progression of BPM, but rather on understanding the progression of BPM
Initiatives within organisations.
Consequently, the theory this study supports does not satisfy the requirements of
universalistic theory, as defined by Sabherwal et al. (2001).
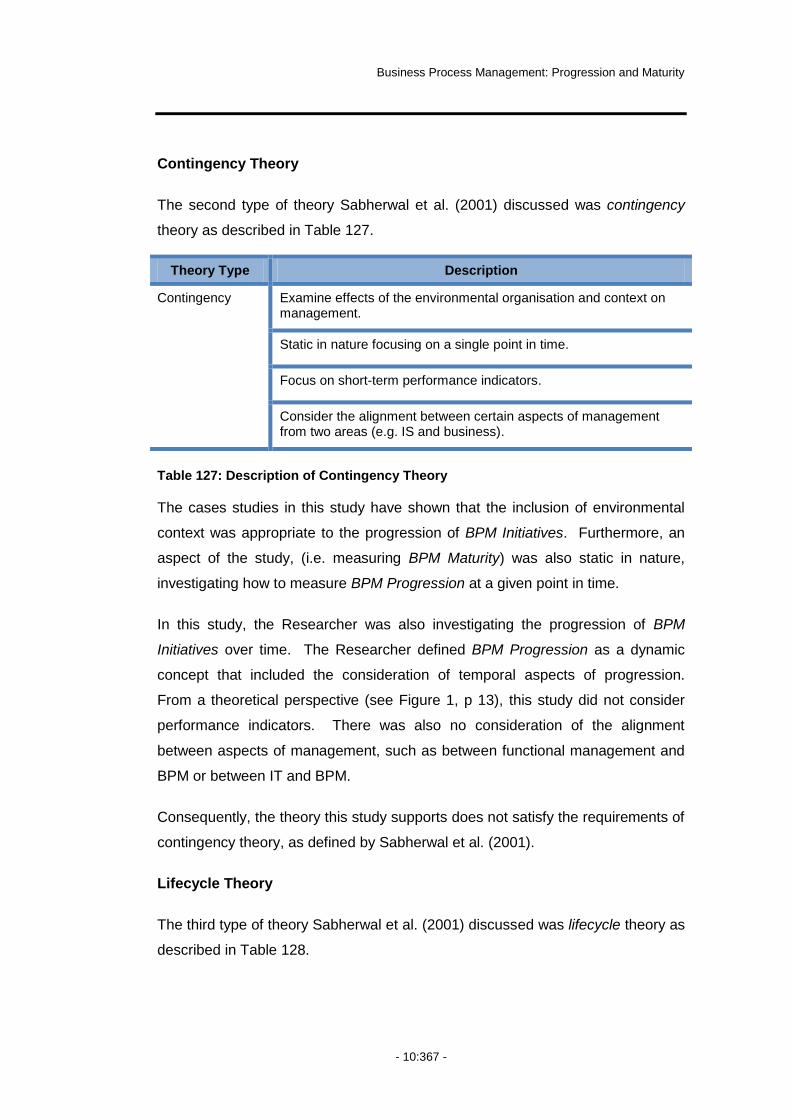
Business Process Management: Progression and Maturity
- 10:367 -
Contingency Theory
The second type of theory Sabherwal et al. (2001) discussed was contingency
theory as described in Table 127.
Theory Type Description
Contingency Examine effects of the environmental organisation and context on management.
Static in nature focusing on a single point in time.
Focus on short-term performance indicators.
Consider the alignment between certain aspects of management from two areas (e.g. IS and business).
Table 127: Description of Contingency Theory
The cases studies in this study have shown that the inclusion of environmental
context was appropriate to the progression of BPM Initiatives. Furthermore, an
aspect of the study, (i.e. measuring BPM Maturity) was also static in nature,
investigating how to measure BPM Progression at a given point in time.
In this study, the Researcher was also investigating the progression of BPM
Initiatives over time. The Researcher defined BPM Progression as a dynamic
concept that included the consideration of temporal aspects of progression.
From a theoretical perspective (see Figure 1, p 13), this study did not consider
performance indicators. There was also no consideration of the alignment
between aspects of management, such as between functional management and
BPM or between IT and BPM.
Consequently, the theory this study supports does not satisfy the requirements of
contingency theory, as defined by Sabherwal et al. (2001).
Lifecycle Theory
The third type of theory Sabherwal et al. (2001) discussed was lifecycle theory as
described in Table 128.

Chapter 10 – Theory Building
- 10:368 -
Theory Type Description
Life Cycle Take a more dynamic view (e.g. Galliers & Sutherland, 1991; Hirschheim et al., 1988; van de Ven & Poole, 1995).
Do not recognise different context as important.
Usually assume changes in all organisations take place along the same path (or stages).
Changes are linear and assume movement in a forward direction towards a desired end goal.
Table 128: Description of Life Cycle Theory
Within this study, taking a dynamic view was appropriate and recognised at the
beginning of the study with the definition of the terms BPM Progression
(dynamic) and BPM Maturity (static). A lifecycle theory may appear to suit at
least one of the common interpretations of BPM covered in this study, the
lifecycle approach – as this often assumes a best-practice way of managing
processes. The evidence from this study does not support the remaining
elements of a lifecycle theory however.
All of the case studies have shown the importance of context and in a number of
companies, changes in the organisational context actually led to the adoption of
BPM Initiative. For example:
Company A commenced its BPM Initiative in response to issues arising
from the merger of six companies into one and the need to establish a
„single source of truth‟
Company B commenced its BPM Initiative in response to a change in
government legislation that moved the organisation from being a
government monopoly to being a GOC, required to operate on a
commercial basis in a competitive market.
Furthermore, the outcomes from the longitudinal studies showed that changes
within the BPM Initiatives of different companies progress along different paths,
and that they are not always linear nor in a forward direction.
Consequently, the theory this study supports does not satisfy the requirements of
lifecycle theory, as defined by Sabherwal et al. (2001).
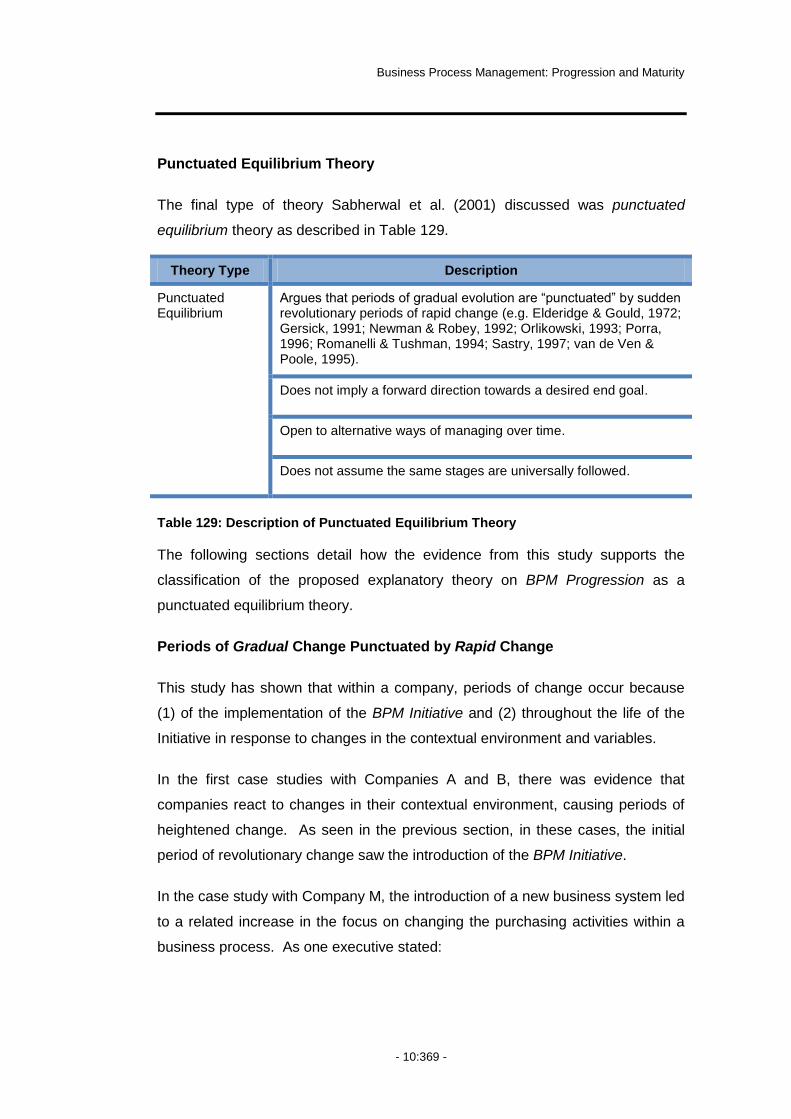
Business Process Management: Progression and Maturity
- 10:369 -
Punctuated Equilibrium Theory
The final type of theory Sabherwal et al. (2001) discussed was punctuated
equilibrium theory as described in Table 129.
Theory Type Description
Punctuated Equilibrium
Argues that periods of gradual evolution are “punctuated” by sudden revolutionary periods of rapid change (e.g. Elderidge & Gould, 1972; Gersick, 1991; Newman & Robey, 1992; Orlikowski, 1993; Porra, 1996; Romanelli & Tushman, 1994; Sastry, 1997; van de Ven & Poole, 1995).
Does not imply a forward direction towards a desired end goal.
Open to alternative ways of managing over time.
Does not assume the same stages are universally followed.
Table 129: Description of Punctuated Equilibrium Theory
The following sections detail how the evidence from this study supports the
classification of the proposed explanatory theory on BPM Progression as a
punctuated equilibrium theory.
Periods of Gradual Change Punctuated by Rapid Change
This study has shown that within a company, periods of change occur because
(1) of the implementation of the BPM Initiative and (2) throughout the life of the
Initiative in response to changes in the contextual environment and variables.
In the first case studies with Companies A and B, there was evidence that
companies react to changes in their contextual environment, causing periods of
heightened change. As seen in the previous section, in these cases, the initial
period of revolutionary change saw the introduction of the BPM Initiative.
In the case study with Company M, the introduction of a new business system led
to a related increase in the focus on changing the purchasing activities within a
business process. As one executive stated:

Chapter 10 – Theory Building
- 10:370 -
“…we‟re making some major changes to the way we‟re doing things
and we‟re going from a global material master (…) we‟ve got to work
out how we manage that change, because that impacts our business
process…”
This showed that there are recognised periods of heightened activity, dependent
on the activities occurring within the BPM Initiative from time to time.
Within the longitudinal case studies, there was also evidence that companies can
have periods of heightened change and periods of more stable and consistent
change. Company U provides an example of this, whereby the availability of new
process modelling software caused a peak in activity within one of the capability
areas. In comparison, during the same time (i.e. from the first year to the last
year of the BPM Initiative – 2003 to 2007), the emphasis on the remaining
capability areas was notably lower and relatively constant across all capability
areas. Figure 51 shows the significance of the peak in activity within IT –
Process Design and Modelling, comparative to the other capability areas.
Figure 51: Example – Variability across Capability Areas (Company U)
Consequently, this study showed BPM Initiatives have periods of gradual
evolution, punctuated by periods of heightened activity.
Moving Forward towards an End Goal
This study showed that the progression of BPM is not always in a forward
direction. The first case study evidence supporting this notion came from
Company M. When discussing the implementation of a new business system to
-1.00
0.00
1.00
2.00
3.00
4.00
5.00
PIP
S&P
L
EPA
PM
PC
&S
PM
DM
PR
&R
PM
&P
L
PR
S
PM
C
PD
&M
PE&
I
PM
&C
PI&
I
PM
gt
PD
&M
-IT
PI&
E -
IT
PM
&C
-IT
PI&
I -IT
PM
gt -
IT
PS&
E
PM
K
PE&
L
PC
&C
PM
L
RTP
C
PV
&B
PA
&B
LATP
PM
SN
Strategic Alignment Governance Methods
Information Technology People Culture
Company U Change

Business Process Management: Progression and Maturity
- 10:371 -
standardise a core process across multiple entities, an executive claimed:
“…we need to keep out of that „valley of despair‟ as much as
possible, so when you‟re planning for it and all of a sudden you do
have that drop, you have to work hard just to get to where you were
(…) we‟re trying to limit just how much of that „valley of despair‟ we go
into, so if we can keep it to just a little dip…”
This showed that, whilst the intention was ultimately to move forward, there was
recognition and acceptance that the realisation of benefits from some process
improvement initiatives may not be realised immediately. Consequently, the
effect on the progression of the BPM Initiative may be negative during that time.
Furthermore, deliberate management action was required to minimise the
magnitude of the backward movement.
The possibility of static or backward movement was also evident in the
subsequent longitudinal case studies. A number of companies showed no
change in some capability areas. Both Company U and Company V showed a
reduction in the emphasis placed on some capability areas, over time, as seen in
Figure 51 (above) and Figure 52 (below).
Figure 52: Example – Change in Capability Areas (Company V)
Consequently, this study showed that movement of the BPM Initiative is not
always in a forward direction.
-0.30-0.20-0.100.000.100.200.300.400.50
PIP
S&P
L
EPA
PM
PC
&S
PM
DM
PR
&R
PM
&P
L
PR
S
PM
C
PD
&M
PE&
I
PM
&C
PI&
I
PM
gt
PD
&M
-IT
PI&
E -
IT
PM
&C
-IT
PI&
I -IT
PM
gt -
IT
PS&
E
PM
K
PE&
L
PC
&C
PM
L
RTP
C
PV
&B
PA
&B
LATP
PM
SNStrategic Alignment Governance Methods
Information Technology People Culture
Company V Change

Chapter 10 – Theory Building
- 10:372 -
Alternative Ways of Managing Over Time
When looking at BPM Initiatives, this study showed that there could be variation
in the approach to the management of the BPM Initiative and the practices
adopted to manage and progress each capability area.
The demographics of the BPM Initiatives in the five longitudinal case studies
provided evidence that there are alternative ways of managing BPM Initiatives.
During the first year, the BPM Initiatives for three companies had an enterprise
wide scope and a project-based approach to implementation. The remaining two
companies had a narrower focus to their BPM Initiatives with them being
applicable to only a defined area of the business.
Differences in demographics from the first year to the last year, provided
evidence of a change in the approach to the management of the BPM Initiatives
over time. When Company T commenced its BPM Initiative, responsibility for the
BPM Initiative was with the General Manager of the Strategy Unit. The structure
of the BPM Initiative was taking a project-based approach to implementing BPM
throughout the enterprise. At the time of case study, the General Manager of the
Shared Service Unit was responsible for the BPM Initiative and a Centre of
Excellence had been established to manage and co-ordinate the activities of the
BPM Initiative through a central area.
During the longitudinal case studies, the Researcher collected data regarding the
management practices that companies adopted within each of the capability
areas. The examples of these practices, contained in Appendix 13.4.7, show that
companies adopt different practices to manage activities and progression in the
capability areas.
Consequently, this study showed that companies use alternate ways of
managing their BPM Initiatives, and the activities undertaken within the BPM
Initiatives, over time.

Business Process Management: Progression and Maturity
- 10:373 -
Does not require Same Stages to be Universally Followed
In Chapter 9, the Researcher analysed the data from the longitudinal studies with
regard to the demographics of the BPM Initiatives. In doing so, the Researcher
separated the companies adopting a BPM Initiative as an enterprise-wide scope
(i.e. Companies S, T and W), from those where the BPM Initiative had a narrower
scope, applying only to a defined area within the business (i.e. Companies U and
V). The subsequent analysis showed similarities in the progression of the BPM
Initiatives within these groupings, as seen in Figure 53.
Figure 53: Example – Last Year Emphasis for Selected Companies
Figure 53 shows that in 2007, companies with an enterprise wide scope to their
BPM Initiatives placed the least emphasis on the factors of Governance, Methods
and IT. Alternately, companies where the BPM Initiative had a narrow scope
placed the most emphasis on Methods and IT during the same period. The focus
in Company U and Company V arose due to those organisations having more of
a lifecycle interpretation applied to their BPM Initiative where their focus was on
managing a process though the stages of its lifecycle by acquiring and utilising
methods and tools to do so. Alternatively, those organisations that applied more
of an organisational interpretation to their BPM Initiative displayed a greater focus
on organisational factors such as People, Culture and Strategic Alignment.

Chapter 10 – Theory Building
- 10:374 -
Furthermore, throughout this study, there was evidence of the importance of
context and of companies responding to their contextual environment in order to
progress with their BPM Initiatives. This study showed that the necessity of
responding to changes in context requires flexibility in progression paths.
Consequently, this study showed that progression of BPM Initiatives does not
require that organisations universally follow the same stages.
10.6 Theory for Explaining and Predicting
The fourth type of theory Gregor (2006) presents is theory for explaining and
predicting, or EP Theory. According to Gregor (2006, 26), EP theory aligns with
common views from natural and social science and implies:
“…both understanding of underlying causes and prediction, as well as
description of theoretical constructs and the relationships among
them…”
At the commencement of this study, the Researcher made a distinction between
the dynamic notion of BPM Progression and the static notion of measuring
progression at a single point in time, using the construct of BPM Maturity. In
doing so, the Researcher aimed to contribute to further research relating to the
measurement and understanding of BPM Success, Process Success and their
subsequent contribution to Organisational Performance. The Researcher first
depicted the theorised relationships between these constructs in Chapter 1.
Within this section, the Researcher first proposes a conceptual EP theory relating
to BPM Maturity, including conjectures derived from the case study experiences.
The Researcher uses the term conceptual here in recognition of future work that
is required to progress the EP theory due to further research being required to
understand completely the relationships between the factors and capability
areas. The Researcher then shows how the case study evidence supports the
proposition of this theory as a formative model, as opposed to the more common
reflective model.
Business Process Management: Progression and Maturity
- 10:375 -
10.6.1 A BPM Maturity Measurement Model
The development of a measurement model for BPM Maturity commenced in
Chapter 3, with the initial identification and subsequent refinement of the
conceptual model including the six factors of Strategic Alignment, Governance,
Methods, Information Technology, People and Culture. The subsequent
extension of the conceptual model to include capability areas for each factor
resulted in the BPM Capability Framework.
As discussed earlier in this Chapter, the BPM Capability Framework is a theory
for analysing (as defined by Gregor, 2006). It does not have sufficient
components to be predictive and thus is not an EP Theory. It does not for
example, include details of the relationships between the factors and capability
areas, nor does it provide any causal explanations or any testable propositions.
This framework did however provide a base from which to continue the
development of an EP theory for BPM Maturity, consistent with Gregor‟s (2006)
view that analytic theory can provide a foundation for the future development of
other theory types.
In the subsequent exploratory case study and the longitudinal case studies, the
Researcher utilised the BPM Capability Framework as a base from which to
explore the progression of the BPM Initiatives. This enabled the derivation of
explanatory theory on BPM Progression as discussed in the previous section. In
addition, this study has enabled the proposal of conceptual EP theory for BPM
Maturity as shown in Figure 54 and including the conjectures detailed in Table
130.

Chapter 10 – Theory Building
- 10:376 -
Figure 54: Proposed EP Theory for BPM Maturity
ξ1
η1
η3 η4
η13 η17η14 η15 η16
η18 η22η19 η20 η21
η2
η8 η12η9 η10 η11
η6 η7
η28 η32η29 η30 η31
η33 η37η34 η35 η36
η5
η23 η27η24 η25 η26
ξ 2
1 2 3 n
BPM Success Process Success
BPM Maturity
BPM Capability Areas
BPM Factors
Yet to be defined measures for BPM Capability Areas

Business Process Management: Progression and Maturity
- 10:377 -
Conjecture Comment
Factors
The strength of the correlation between factors may vary over time. Variation will potentially be less at higher stages of maturity as BPM Initiatives reach a point of equilibrium.
Variability in correlation between factors potentially relates to the structure of the BPM Initiative within the organisation.
BPM Initiatives where BPM equates to a lifecycle approach will potentially show higher correlation between Methods and IT during early stages of implementation than will BPM Initiatives where BPM equates to an organisational approach.
The relative importance of the factors will vary across organisations and over time.
Specific organisational context may result in companies focusing on certain factors over others at given times thus giving the potential for spurious results if not taken into account during measurement.
Capability Areas
The strength of the relationship between the capability areas will vary across organisations and over time and is likely to relate to the environmental context of the organisations.
Organisations with similar environmental contexts may develop capability in similar areas at similar times resulting in common paths of progression in given situations.
A change in contextual variables may cause variability in correlation between capability areas.
A change in legislation may result in an increase in process, for example.
The relative importance of the capability areas will vary between organisations and over time.
Due to specific organisational context including resource constraints organisations may select to focus on certain capability areas over others at any given stage.
Causal relationships are likely to exist between capability areas. People - Process Education and Learning is likely to have a causal relationship with Culture – Process Attitudes and Behaviours, for example.
Further research is required to identify all relationships.
Table 130: Conjectures about BPM Maturity

Chapter 10 – Theory Building
- 10:378 -
10.7 Classification of EP Theory
The EP theory supported by this study and depicted in Figure 54 included multi-
dimensional constructs. That is, the BPM Maturity construct was composed of
multiple factors and the factors were composed of multiple capability areas.
Furthermore, the Researcher proposed that the relationships between the
constructs and variables were formative in nature. In support of this
classification, the next sections discuss (1) the use of multi-dimensional
constructs and (2) the selection of formative constructs as being most
appropriate for measuring BPM Maturity.
10.7.1 Multi-Dimensional Constructs
There is some debate regarding the use of multi-dimensional constructs in theory
building. Critics argue that, conceptually, theories including multi-dimensional
constructs are ambiguous due to the relationship between the constructs and
other variables (e.g. Hattie, 1985). Such critics claim that more than one
explanation is possible for any variation in this relationship thus creating the
ambiguity. Critics also argue that the differences in relationships with the
dimensions are important to theory development (e.g. Johns, 1998).
Advocates of multi-dimensional constructs argue that theories should be general,
combining specific dimensions using general constructs (e.g. Hanisch et al.,
1998). To this end, Edwards (2001) suggests two approaches to theory
development that aim to address both broad and specific questions:
(1) Developing theories that incorporate both multidimensional constructs and
their dimensions and explain their relationships
(2) Treating dimensions as a “set” that collectively represent a concept so as
to enable specific investigation into each dimension and general
questions about the collective dimensions.
Furthermore, Edwards and Bagozzi (2000) indicate the importance of developing
an auxiliary theory to join abstract constructs to measurable phenomena.
Looking at the relationships between the constructs and variables developing
theory enables meaningful testing to occur subsequently.

Business Process Management: Progression and Maturity
- 10:379 -
10.7.2 Reflective –v– Formative Models
Traditionally constructs within many measurement models have been reflective
and consequently subject to classical theory testing (Freeze & Rashke, 2007;
Law & Wong, 1999). Despite this, there is increasing debate over the role of
constructs of a formative nature (Diamantopoulos et al., 2008). This interest
arises from the differences between the two types of constructs and the effects of
misspecification. The call for researchers to consider the nature of constructs
during development, or before reuse, is gaining momentum (Diamantopoulos,
2008).
Reflective constructs are the most common in IS and Management research
(Law & Wong, 1999; Podsakoff et al., 2003). MacCallum and Browne (1993)
refer to these as latent variables. The assumption underpinning reflective
constructs is that variation within the construct reflects in the observed measures.
This means that the direction of causality runs from the construct to the measure.
In this instance, the correlation between the measures must be high and it is
possible to remove or replace a measure with another measure with little or no
effect (Edwards & Bagozzi, 2000; Diamantopoulos, 2008). Reflective constructs
and models comply with requirements of classical theory testing such as critical
scale properties including convergent and discriminant validity, internal
consistency and dimensionality (Nunnally & Bernstein, 1994). Consequently,
correctly defined reflective models are eminently suitable for testing using
popular statistical techniques.
Formative constructs on the other hand, are not so common in extant literature,
although, that is not to say that they should not be. MacCallum and Browne
(1993) refer to these as composite variables rather than latent variables. Unlike
reflective constructs, where changes in the construct cause changes in the
measures, in a formative construct a change in the measures results in a change
in the construct. This means the direction of causality runs from the measures to
the construct. Put another way, this means that for formative constructs the
measures form or define the construct (Bollen & Lennox, 1991; Edwards &

Chapter 10 – Theory Building
- 10:380 -
Bagozzi, 2000). Podsakoff et al. (2006) state that in this case it is not necessary
that measures be highly correlated109. For testing formative models, Miller and
Friesen (1982) suggest a number of alternate methods to use in place of other
standard statistical methods such as linear multivariate techniques and path or
regression analyses. These methods include taxonomy and Q-technique or Q
factor-analysis.
10.7.3 Choosing between Reflective and Formative Models
Blalock (1968) and Costner (1969) state that the choice of measurement model
should be a theoretical decision. In many cases, the causality between the
indicators and construct is evident, although this is not always the case
(Diamantopoulos & Siguaw, 2006).
Choosing the correct measurement perspective is important to avoid the
consequences of measurement model misspecification (Podsadoff et al. 2006).
An example of misspecification is the errors that Diamantopoulos and Siguaw
describe as Type I and Type II errors. According to Jarvis et al. (2003) Type I
errors (i.e. those that lead to spurious results by showing a false positive result)
are more common than Type II errors (i.e. those that fail to detect an effect by
giving a false negative result) and arise from choosing a reflective approach
when a formative one is more appropriate. Other effects of misspecification
include construct validity due to causality issues, evaluation of scale
measurement properties and erroneous statistical conclusions about
relationships between constructs (Jarvis et al. 2003; Podsadoff et al. 2006).
Based on literature (Bollen, 1984; Bollen & Lennox, 1991; Jarvis et al., 2003;
MacKenzie et al., 2005), Podsakoff et al. (2006) propose four criteria for choosing
between reflective and formative models. The basis of these is the relationships
between the constructs and measures or dimensions, and the relationships
between the measures and/or dimensions. Table 131 summarises these criteria.
109
Some researchers argue that high correlation between measures can result in multicollinearity and may be a sign to consider removal of a measure (Podsakoff et al. 2006).
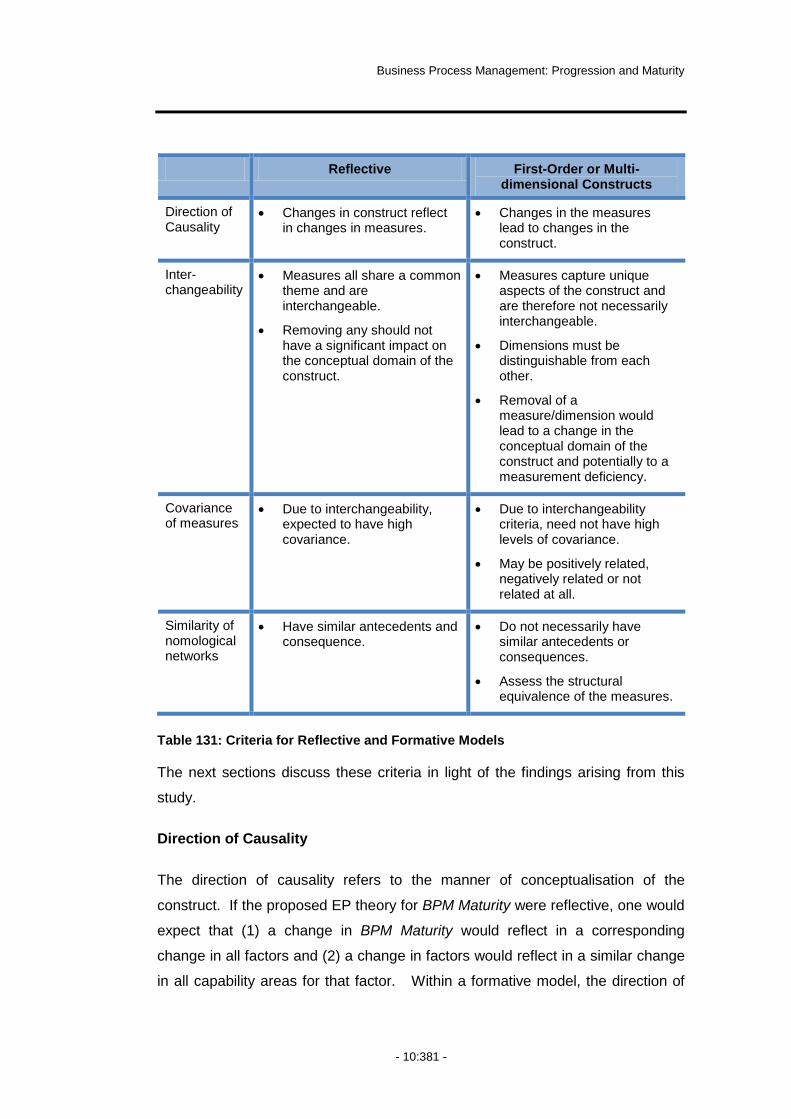
Business Process Management: Progression and Maturity
- 10:381 -
Reflective First-Order or Multi-dimensional Constructs
Direction of Causality
Changes in construct reflect in changes in measures.
Changes in the measures lead to changes in the construct.
Inter-changeability
Measures all share a common theme and are interchangeable.
Removing any should not have a significant impact on the conceptual domain of the construct.
Measures capture unique aspects of the construct and are therefore not necessarily interchangeable.
Dimensions must be distinguishable from each other.
Removal of a measure/dimension would lead to a change in the conceptual domain of the construct and potentially to a measurement deficiency.
Covariance of measures
Due to interchangeability, expected to have high covariance.
Due to interchangeability criteria, need not have high levels of covariance.
May be positively related, negatively related or not related at all.
Similarity of nomological networks
Have similar antecedents and consequence.
Do not necessarily have similar antecedents or consequences.
Assess the structural equivalence of the measures.
Table 131: Criteria for Reflective and Formative Models
The next sections discuss these criteria in light of the findings arising from this
study.
Direction of Causality
The direction of causality refers to the manner of conceptualisation of the
construct. If the proposed EP theory for BPM Maturity were reflective, one would
expect that (1) a change in BPM Maturity would reflect in a corresponding
change in all factors and (2) a change in factors would reflect in a similar change
in all capability areas for that factor. Within a formative model, the direction of
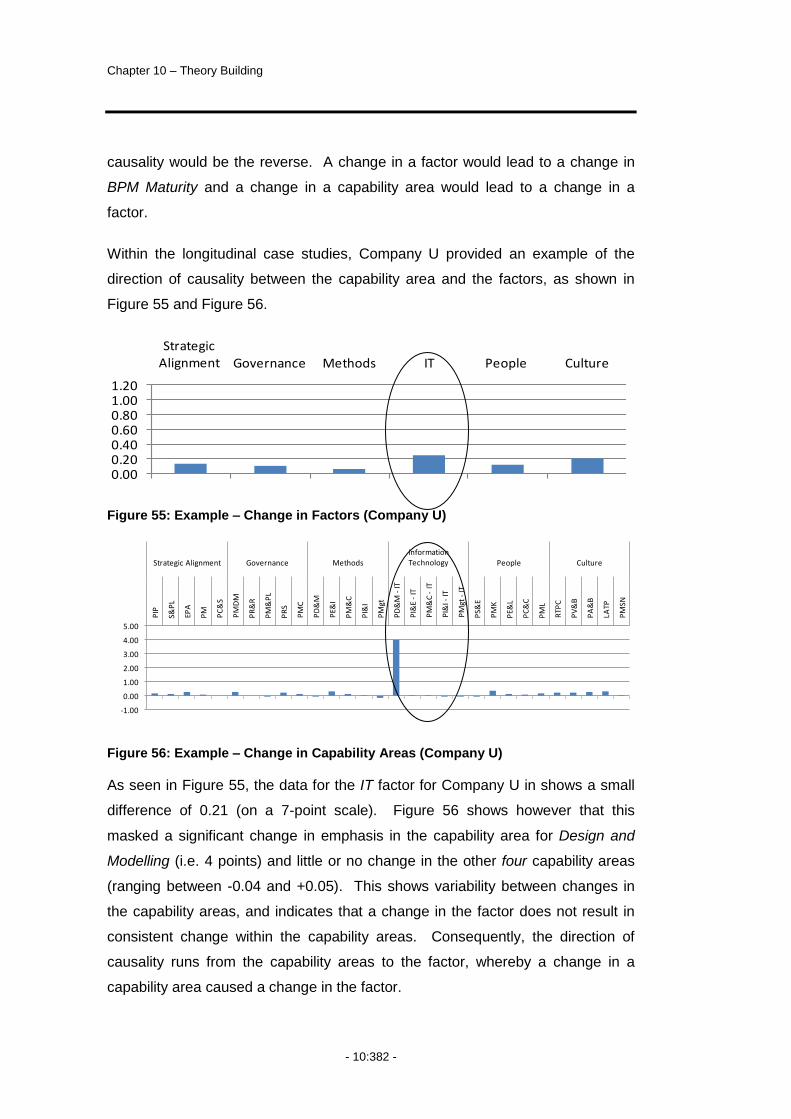
Chapter 10 – Theory Building
- 10:382 -
causality would be the reverse. A change in a factor would lead to a change in
BPM Maturity and a change in a capability area would lead to a change in a
factor.
Within the longitudinal case studies, Company U provided an example of the
direction of causality between the capability area and the factors, as shown in
Figure 55 and Figure 56.
Figure 55: Example – Change in Factors (Company U)
Figure 56: Example – Change in Capability Areas (Company U)
As seen in Figure 55, the data for the IT factor for Company U in shows a small
difference of 0.21 (on a 7-point scale). Figure 56 shows however that this
masked a significant change in emphasis in the capability area for Design and
Modelling (i.e. 4 points) and little or no change in the other four capability areas
(ranging between -0.04 and +0.05). This shows variability between changes in
the capability areas, and indicates that a change in the factor does not result in
consistent change within the capability areas. Consequently, the direction of
causality runs from the capability areas to the factor, whereby a change in a
capability area caused a change in the factor.
0.000.200.400.600.801.001.20
Strategic Alignment Governance Methods IT People Culture
Company U
-1.00
0.00
1.00
2.00
3.00
4.00
5.00
PIP
S&P
L
EPA
PM
PC
&S
PM
DM
PR
&R
PM
&P
L
PR
S
PM
C
PD
&M
PE&
I
PM
&C
PI&
I
PM
gt
PD
&M
-IT
PI&
E -
IT
PM
&C
-IT
PI&
I -IT
PM
gt -
IT
PS&
E
PM
K
PE&
L
PC
&C
PM
L
RTP
C
PV
&B
PA
&B
LATP
PM
SN
Strategic Alignment Governance Methods
Information Technology People Culture
Company U Change

Business Process Management: Progression and Maturity
- 10:383 -
The evidence from this study indicates that the direction of causality runs from
the factors to BPM Maturity and from the capability areas to the factors.
Consequently, with regard to direction of causality, the proposed EP theory for
BPM Maturity is formative.
Interchangeability
Interchangeability refers to the extent to which one can substitute or remove
variables from a construct without causing a fundamental change in its character.
If the proposed EP theory for BPM Maturity were reflective (1) the removal of a
factor would not fundamentally change the meaning of BPM Maturity (2) the
factors would be mutually substitutable (3) the removal of a capability area would
not cause a fundamental change in the meaning of a factor and (4) the capability
areas would be mutually substitutable. Within a formative model however, the
removal of a factor would result in a fundamental change in the intent of the BPM
Maturity construct and similarly, the removal of a capability area would result in a
fundamental change in the intent of the factor.
To be reflective, measures must share a common theme. The factors and
capability areas of the proposed EP Theory for BPM Maturity do not share a
common theme. The Researcher initially selected the factors from the extant
literature due to their independence, a point further supported by the individual
definition of each factor during the Delphi studies. The independent intent of the
factors is also evident in the diversity of their nature (e.g. IT and Culture).
Similarly, the identification and coding process used to derive the capability areas
during the Delphi studies defined unique measures, not interchangeable
measures for each of the factors. Furthermore, the variability in emphasis placed
on the capability areas during the longitudinal studies is additional evidence of
their separate and distinct natures.
The evidence from this study indicated that both the factors and the capability
areas do not share common themes. Consequently, with regard to
interchangeability, the proposed EP theory for BPM Maturity is formative.
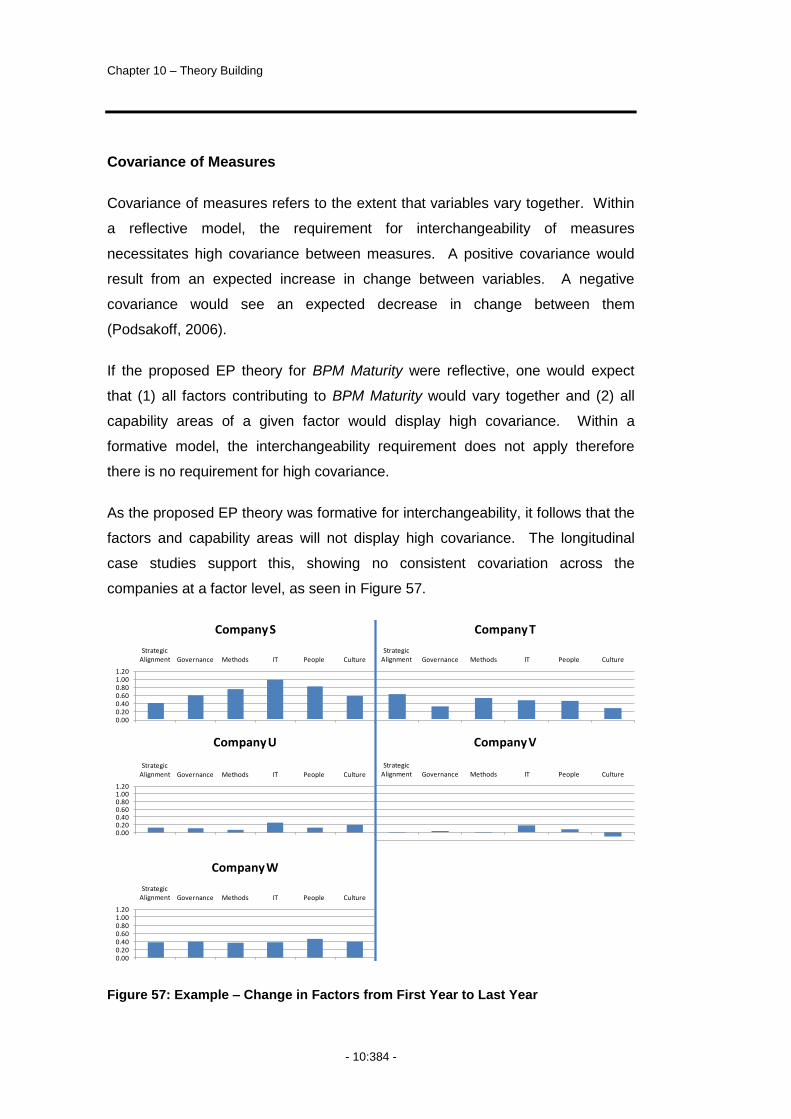
Chapter 10 – Theory Building
- 10:384 -
Covariance of Measures
Covariance of measures refers to the extent that variables vary together. Within
a reflective model, the requirement for interchangeability of measures
necessitates high covariance between measures. A positive covariance would
result from an expected increase in change between variables. A negative
covariance would see an expected decrease in change between them
(Podsakoff, 2006).
If the proposed EP theory for BPM Maturity were reflective, one would expect
that (1) all factors contributing to BPM Maturity would vary together and (2) all
capability areas of a given factor would display high covariance. Within a
formative model, the interchangeability requirement does not apply therefore
there is no requirement for high covariance.
As the proposed EP theory was formative for interchangeability, it follows that the
factors and capability areas will not display high covariance. The longitudinal
case studies support this, showing no consistent covariation across the
companies at a factor level, as seen in Figure 57.
Figure 57: Example – Change in Factors from First Year to Last Year
0.000.200.400.600.801.001.20
Strategic Alignment Governance Methods IT People Culture
Company S
Strategic Alignment Governance Methods IT People Culture
Company T
0.000.200.400.600.801.001.20
Strategic Alignment Governance Methods IT People Culture
Company U
0.000.200.400.600.801.001.20
Strategic Alignment Governance Methods IT People Culture
Company W
Strategic Alignment Governance Methods IT People Culture
Company V
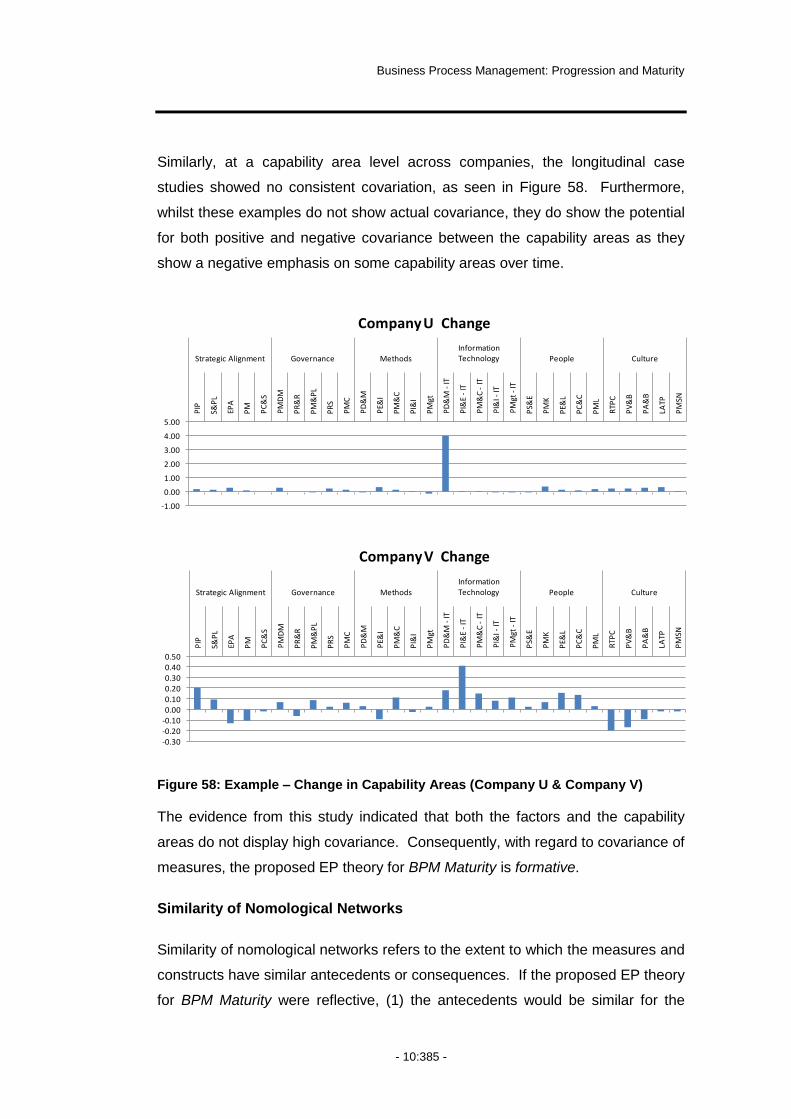
Business Process Management: Progression and Maturity
- 10:385 -
Similarly, at a capability area level across companies, the longitudinal case
studies showed no consistent covariation, as seen in Figure 58. Furthermore,
whilst these examples do not show actual covariance, they do show the potential
for both positive and negative covariance between the capability areas as they
show a negative emphasis on some capability areas over time.
Figure 58: Example – Change in Capability Areas (Company U & Company V)
The evidence from this study indicated that both the factors and the capability
areas do not display high covariance. Consequently, with regard to covariance of
measures, the proposed EP theory for BPM Maturity is formative.
Similarity of Nomological Networks
Similarity of nomological networks refers to the extent to which the measures and
constructs have similar antecedents or consequences. If the proposed EP theory
for BPM Maturity were reflective, (1) the antecedents would be similar for the
-1.00
0.00
1.00
2.00
3.00
4.00
5.00
PIP
S&P
L
EPA
PM PC
&S
PM
DM
PR
&R
PM
&P
L
PR
S
PM
C
PD
&M
PE&
I
PM
&C
PI&
I
PM
gt
PD
&M
-IT
PI&
E -
IT
PM
&C
-IT
PI&
I -IT
PM
gt -
IT
PS&
E
PM
K
PE&
L
PC
&C
PM
L
RTP
C
PV
&B
PA
&B
LATP
PM
SN
Strategic Alignment Governance Methods
Information Technology People Culture
Company U Change
-0.30-0.20-0.100.000.100.200.300.400.50
PIP
S&P
L
EPA
PM
PC
&S
PM
DM
PR
&R
PM
&P
L
PR
S
PM
C
PD
&M
PE&
I
PM
&C
PI&
I
PM
gt
PD
&M
-IT
PI&
E -
IT
PM
&C
-IT
PI&
I -IT
PM
gt -
IT
PS&
E
PM
K
PE&
L
PC
&C
PM
L
RTP
C
PV
&B
PA
&B
LATP
PM
SN
Strategic Alignment Governance Methods
Information Technology People Culture
Company V Change
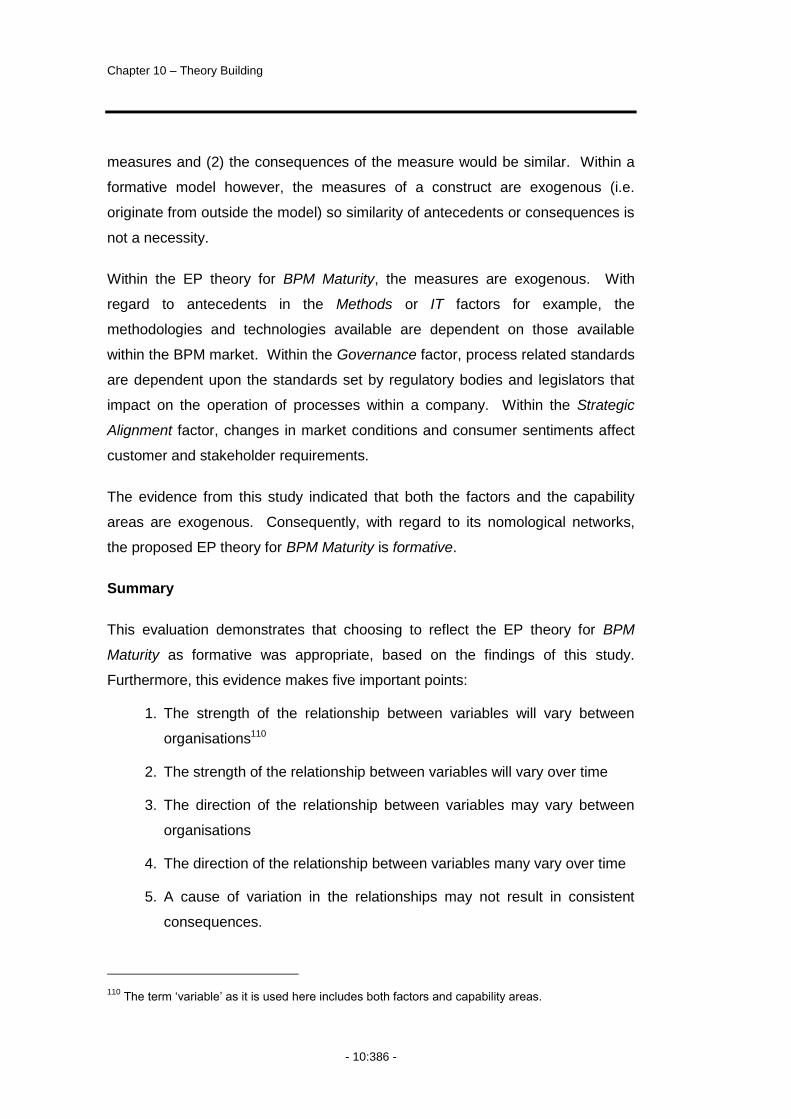
Chapter 10 – Theory Building
- 10:386 -
measures and (2) the consequences of the measure would be similar. Within a
formative model however, the measures of a construct are exogenous (i.e.
originate from outside the model) so similarity of antecedents or consequences is
not a necessity.
Within the EP theory for BPM Maturity, the measures are exogenous. With
regard to antecedents in the Methods or IT factors for example, the
methodologies and technologies available are dependent on those available
within the BPM market. Within the Governance factor, process related standards
are dependent upon the standards set by regulatory bodies and legislators that
impact on the operation of processes within a company. Within the Strategic
Alignment factor, changes in market conditions and consumer sentiments affect
customer and stakeholder requirements.
The evidence from this study indicated that both the factors and the capability
areas are exogenous. Consequently, with regard to its nomological networks,
the proposed EP theory for BPM Maturity is formative.
Summary
This evaluation demonstrates that choosing to reflect the EP theory for BPM
Maturity as formative was appropriate, based on the findings of this study.
Furthermore, this evidence makes five important points:
1. The strength of the relationship between variables will vary between
organisations110
2. The strength of the relationship between variables will vary over time
3. The direction of the relationship between variables may vary between
organisations
4. The direction of the relationship between variables many vary over time
5. A cause of variation in the relationships may not result in consistent
consequences.
110
The term „variable‟ as it is used here includes both factors and capability areas.

Business Process Management: Progression and Maturity
- 10:387 -
These points support the explanatory theory on BPM Progression proposed in
Section 10.4. Furthermore, these points are important to future testing of the
model as they have the potential to produce spurious results if not taken into
account during measurement and future empirical testing.
10.8 Chapter Summary
Using classifications from Gregor (2002, 2006), Sabherwal et al. (2001) and
Edwards and Bagozzi (2000) the Researcher presented a number of theories
regarding the progression and measurement of BPM Initiatives.
First, the Researcher proposed analytical theories (Gregor 2002, 2006)
including the BPM Capability Framework and a typology for classifying BPM
Initiatives. The BPM Capability Framework provided a consistent means of
defining the factors critical for progressing BPM Initiatives, including the
delineation of measures for these factors, being the capability areas. The
typology for BPM Initiatives combined common interpretations of BPM from
extant literature together with the scope and approach of the BPM Initiative to
provide a consistent means of classification.
Second, the Researcher proposed an explanatory theory on BPM Progression,
including a number of conjectures derived from the case studies conducted
during the study. The Researcher used Sabherwal et al.‟s (2001) classification to
show that this study supported theory regarding BPM Initiatives using the
principles of punctuated equilibrium theory. In doing so, the Researcher showed
how universalistic, contingency and lifecycle theory is not appropriate to BPM
Progression and measurement, based on the findings of this study.
Third, the Researcher proposed an EP theory for BPM Maturity, presenting a
multi-dimensional, formative model. Following this, the Researcher discussed
the difference between reflective and formative measurement models, using the
data from the longitudinal case studies to show why a formative model is more
appropriate for measuring BPM Maturity.
The next chapter concludes this thesis, providing a summary of its contributions,
limitations and the areas of potential future research.


Business Process Management: Progression and Maturity
- 11:389 -
11 Research Contributions, Limitations & Outlook
he preceding ten chapters presented the systematic conduct of
organisational level research exploring the progression and
measurement of BPM Initiatives within organisations. This study
culminated in the development of analytic and explanatory theory regarding the
progression of BPM Initiatives and the EP theory for BPM Maturity in the form of
a multi-dimensional, formative measurement model for BPM Maturity. In
conclusion, it is appropriate to reflect upon how the study delivered against the
initial research questions it aimed to address. Furthermore, no study is complete
without consideration of (1) its inherent limitations and (2) the opportunities it
presents for future research.
11.1 Chapter Overview
The structure of this chapter is as follows. Section 2 revisits the research
questions proposed in Chapter 1 and summarises how the study has addressed
each of these. Section 3 confirms the relevance of the study, presenting the
major contributions based on their theoretical and practical implications. Section
4 discusses the research limitations inherent in the study, including the mitigation
strategies the Researcher adopted to limit the impact of these. Section 5
proposes future research opportunities resulting from the conduct of this study.
Section 6 concludes the chapter presenting an overall summary of the study.
T

Chapter 11 – Research Contributions, Limitations and Outlook
- 11:390 -
11.2 Reiterating the Study Questions
The purpose of this study was to address shortcomings identified in extant
research with regard to the progression and measurement of BPM Initiatives in
organisations. The Researcher defined the terms BPM Progression and BPM
Maturity in Chapter 1, using these terms when proposing the study questions.
These questions included managerial, research and investigative questions, as
reiterated in Figure 59.
Figure 59: The Study Questions: Managerial, Research and Investigative
The study therefore had two complementary arms (1) to build theory about the
progression of BPM Initiatives and (2) to enable the future measurement of such
progression, by proposing theory to enable the measurement of this progression.
Level 1 – Managerial Questions
MQ1:How can organisations progress their
BPM Initiatives?
MQ2:How can organisations measure the
progress of their BPM Initiatives?
Level 2 – Research Questions
RQ1:What constitutes theory on BPM Progression within organisations?
RQ2:What constitutes a model for measuring
BPM Maturity that leverages existing research and practice?
Level 3 – Investigative Questions
What factors are important to BPM Progression?
What existing theory is useful in explaining BPM Progression?
How can BPM Progression be conceptualised?
How do temporal and contextual aspects affect BPM Progression?
How can factors critical to BPM Progression be measured?
What existing theory is useful in measuring BPM Maturity?
How can BPM Maturity measurement be conceptualised?
How do temporal and contextual aspects of progression affect BPM Maturity measurement?
IQ1(a):
IQ1(b):
IQ1(c):
IQ2(a):
IQ2(b):
IQ2(c):
IQ2(d):IQ1(d):

Business Process Management: Progression and Maturity
- 11:391 -
11.2.1 Answering the Study Questions
With regard to BPM Progression, at the managerial and research level, this study
asked the questions:
MQ1: How can organisations progress their BPM Initiatives?
RQ1: What constitutes theory on BPM Progression within organisations?
Whilst not being normative research that provides definitive guidance on how
organisations should progress BPM Initiatives, this study provided
comprehensive insights into how a number of organisations have progressed
their BPM Initiatives. From this, the study provided insights into the critical role of
organisational context, contextual variables and temporal aspects affecting the
progression of BPM Initiatives. In doing so, the study resulted in the proposal of
theory on BPM Progression including a typology for classifying BPM Initiatives.
With regard to BPM Maturity, at the managerial and research level, this study
asked the questions:
MQ2: How can organisations measure the progress of their BPM Initiatives?
RQ2: What constitutes a model for measuring BPM Maturity that leverages existing research and practice?
In addressing these questions, this study provided comprehensive insights into
important aspects of measurement. These insights had a base in an extensive
review of extant literature and the progression of the BPM Initiatives in a number
of organisations. Subsequently, the Researcher proposed a BPM Capability
Framework, a conceptual formative measurement model for BPM Maturity and a
number of conjectures that act to inform future research. Importantly, the
formative measurement model caters for those aspects identified as critical to
progressing BPM Initiatives. This included the impact of the contextual
environment, changes in contextual variables and the temporal nature of
progression, as well as the structure of the BPM Initiative itself.
The study achieved these outcomes by addressing a number of more detailed
investigative questions as discussed in the following paragraphs.
Chapter 11 – Research Contributions, Limitations and Outlook
- 11:392 -
Chapter 2 provided details of the design and proposed conduct of the study. In
particular, this chapter separated “fact-finding research” from “theory building
research”, and resulted in the Researcher subsequently presenting the thesis in
two stages. Recognising the complexity of both organisational level research
and the phenomenon of BPM, the Researcher adopted a multi-paradigmatic
approach to the study using multi-methods of case study and survey.
Consequently, this chapter provided a solid theoretical foundation for addressing
all the managerial and research questions within the study.
Chapter 3 provided a comprehensive review of extant literature within the BPM
domain, including existing measurement models. From this investigation, the
Researcher established the critical elements of an Initial Conceptual Model for
exploring BPM Progression and BPM Maturity. This review also identified a
number of issues for measuring BPM Progression.
Chapter 3 contributed to investigative questions including:
IQ1 (a): What factors are important to BPM Progression?
IQ1 (b): What existing theory is useful in explaining BPM Progression?
IQ1 (c): How can BPM Progression be conceptualised?
IQ2 (a): How can factors critical to BPM Progression be measured?
IQ2 (b): What existing theory is useful in measuring BPM Maturity?
IQ2 (c): How can BPM Maturity measurement be conceptualised?
Chapter 4 detailed case studies with two companies adopting an enterprise-wide
BPM Initiative. The purpose of these case studies was to test the Initial
Conceptual Model in a practical environment. The case studies showed the
influence organisational context and contextual variables could have on BPM
Progression. The case studies also resulted in modifications to the factors
included in the conceptual model. Furthermore, the case studies enabled the
Researcher to trial early efforts to operationalise the Initial Conceptual Model. In

Business Process Management: Progression and Maturity
- 11:393 -
doing so, the case studies provided important feedback on the use of terminology
and other practical issues in measuring BPM Maturity, such as the variability in
practice between different organisational units.
Chapter 4 contributed to investigative questions including:
IQ1 (c): How can BPM Progression be conceptualised?
IQ1 (d): How do temporal and contextual aspects affect BPM Progression?
IQ2 (d): How do temporal and contextual aspects of progression affect BPM Maturity measurement?
Chapter 5 presented the conduct and outcomes of a series of Delphi studies.
Six studies were conducted, one for each of the factors in the Revised
Conceptual Model arising from Chapters 3 and 4. The principal aim of these
studies was to advance the issue of measuring the progression of BPM
Initiatives. Use of the Delphi technique resulted in the systematic identification
and categorisation of key items whose measurement was indicative of BPM
Progression. The final list of measurement items, referred to as capability areas,
acted to define the six factors in an Extended Conceptual Model subsequently
referred to as the BPM Capability Framework. Furthermore, mapping all items
raised by the Expert Panel to each of these capability areas enabled the
Researcher to refine the operationalisation of the measurement model. This
included developing a framework for questions based on extant literature and
deriving potential measurement questions for the capability areas using a
combination of extant literature and the mapped items.
The Delphi Studies detailed in Chapter 5 contributed to investigative questions:
IQ2 (a): How can factors critical to BPM Progression be measured?
IQ2 (c): How can BPM Maturity measurement be conceptualised?
Chapter 6 detailed the exploration of a BPM Initiative in a global mining
organisation using the frame of the extended conceptual model developed in the
Delphi Studies. This case study provided insights into potential relationships
between the factors and capability areas of the BPM Capability Framework, and
further insights into the impact of contextual and temporal aspects.

Chapter 11 – Research Contributions, Limitations and Outlook
- 11:394 -
Chapters 7, 8 and 9 detailed the design, conduct and analysis of a longitudinal
case study with five organisations. These studies acted to refine the emerging
conceptual themes into theory for BPM Progression and BPM Maturity, and to
improve its generalisability. Chapter 7 detailed the design of the longitudinal
case study including the design of data collection instruments, the selection of
cases and the approach to data analysis. Chapters 8 and 9 presented the
findings from the five longitudinal case organisations. Chapter 8 included the
within case analysis and outcomes and Chapter 9 detailed the cross-case
analysis and outcomes.
The exploratory case study detailed in Chapter 6, and the five longitudinal case
studies from Chapters 7, 8 and 9 addressed the investigative questions:
IQ1 (c): How can BPM Progression be conceptualised?
IQ1 (d): How do temporal and contextual aspects affect BPM Progression?
IQ2 (c): How can BPM Maturity measurement be conceptualised?
IQ2 (d): How do temporal and contextual aspects of progression affect BPM Maturity measurement?
Chapter 10 drew together all aspects of the study. The Researcher proposed an
explanatory theory on BPM Progression and analytic theory including the BPM
Capability Framework and a typology for classifying BPM Initiatives. The
Researcher also proposed an EP theory on BPM Maturity and detailed why the
less common approach of formative measurement, is more suitable than a
reflective approach for measuring BPM Maturity. Furthermore, the Researcher
presented a number of conjectures arising from the experiences gained during
the study, to inform future research.
Consequently, Chapter 10 addressed all of the managerial, research and
investigative questions of the study.

Business Process Management: Progression and Maturity
- 11:395 -
11.3 Research Contributions
The BPM domain lacks a cumulative body of BPM theory and knowledge and is
rife with inconsistent use of terminology. This study aimed to address these
issues with regard to the progression and measurement of BPM Initiatives within
organisations. In doing so, this study made significant contributions to both the
theoretical aspects of BPM research and the practical aspects of BPM
implementation and progression within organisations as detailed in the following
sections.
11.3.1 Theoretical Implications
The following theoretical contributions support the achievement of the aims of
this study, as do the publications and presentations, listed in Chapter 1, and
selectively highlighted here.
Contribution 1 – Conceptual BPM Success Model
Chapter 1 presented an a priori model, showing the relationship between the
concepts of BPM Progression and BPM Maturity together with their theorised
relationship with three constructs of BPM Success, Process Success and
Organisational Performance. The model depicts six critical BPM factors, their
capability areas and denotes the role of context and contextual variables. The
focus of this study was BPM Progression and BPM Maturity and further research
is required to understand the impact these have on BPM Success, Process
Success and ultimately Organisational Performance. The theorised BPM
Success Model provides direction for future research.
Publications associated with the conceptual development of the model include:
Rosemann, M., & de Bruin, T. (2005). Towards a business process management
maturity model. Proceedings of the 13th European Conference on Information
Systems, Regensburg, 521-532.
Rosemann, M., de Bruin, T., & Hueffner, T. (2004). A model for business
process management maturity. Proceedings of the 15th Australasian Conference
on Information Systems, Hobart.

Chapter 11 – Research Contributions, Limitations and Outlook
- 11:396 -
Rosemann, M., & de Bruin, T. (2004). Application of a holistic model for
determining BPM. Proceedings of the AIM Pre-ICIS Workshop on Process
Management and Information Systems, Washington D.C.
Contribution 2 – BPM Capability Framework
Chapter 5 presented a series of six separate Delphi studies. The purpose of
these studies was to define the factors in the refined conceptual model and to
identify measurement items for each factor. The outcome of these studies was a
so-called, BPM Capability Framework, that in itself is a theory for analysing (as
defined by (Gregor, 2006).
This framework provided the basis for the exploratory case study detailed in
Chapter 6 and the multiple longitudinal case studies detailed in Chapters 7 – 9.
In doing so, the framework enabled the comparative study of BPM Initiatives in
multiple organisations and provided a consistent basis from which to compare
and contrast the progression of the BPM Initiatives within this study.
Furthermore, this framework provides a solid theoretical basis and the beginnings
of a common language for future research in the BPM domain.
Publications associated with the development of the BPM Capability Framework
include:
de Bruin, T., & Rosemann, M. (2007). Identifying BPM capability areas using the
Delphi technique. Proceedings of the 18th Australasian Conference on
Information Systems, Toowoomba, 643-653.
Contribution 3 – Multi-dimensional, Formative BPM Model
Chapter 10 detailed a proposed EP theory (as defined by Gregor, 2006) for the
construct of BPM Maturity, in the form of a measurement model. This model
depicted BPM Maturity as a multi-dimensional, formative construct. Moreover,
the model showed that at three of the four defined levels, formative measurement
is appropriate. The study also resulted in the proposal of a number of
conjectures about potential relationships between the variables of the model.
Additional research is required to explore these relationships. Further research is

Business Process Management: Progression and Maturity
- 11:397 -
also required to develop measurement items at the fourth level of this model,
although this study has made progress in this area by piloting early
operationalisation efforts.
Contribution 4 – Typology of BPM Initiatives
Chapter 10 presented a typology of BPM Initiatives as a theory for analysing (as
defined by Gregor, 2006). Building upon the experiences in all eight case
studies, this typology extended concepts initially raised by Porter (1996) in his
work into Strategic Management, to the BPM domain. The typology depicted
BPM Initiatives as a composition of both their scope and approach. Whilst further
testing is required, this typology makes an important contribution to overcoming
issues arising from inconsistent use of terminology within the BPM domain,
providing a means by which to classify BPM Initiatives.
Contribution 5 – Theory on BPM Progression
Chapter 10 presented an explanatory theory (as defined by Gregor, 2006) on
BPM Progression including the proposal of a number of conjectures that inform
future research. This theory is significant in that it is the first theory on the
progression of BPM Initiatives within organisations. The development of the
theory is also significant, as its derivation addressed a number of complex and
contentious issues such as the recognition of a formative measurement model
and the measurement of change. Furthermore, this theory captured the dynamic
nature of progression and the complexity of organisations by recognising the
impact of contextual and temporal aspects. Consequently, whilst the theory itself
is high-level it is extremely rich and challenges common perceptions of BPM111.
Publications associated with this theory development include:
de Bruin, T. (2007). Insights into the evolution of BPM in organisations.
Proceedings of the 18th Australasian Conference on Information Systems,
Toowoomba, 632-642.
111
For example, that there is a single best way to do BPM or that a prescriptive approach to BPM implementation will result in sustainable practices.

Chapter 11 – Research Contributions, Limitations and Outlook
- 11:398 -
Contribution 6 – Methodological and Paradigmatic Insights
This study utilised a comprehensive research design to investigate a complex
phenomenon, at an organisational level. The study has shown how research in
emerging domains can benefit from taking a multi-paradigmatic view of the world.
It has also shown that in such emerging domains, researchers can benefit from
undertaking “fact finding research” before undertaking theory building research,
by enabling refinement and increased understanding of the research problem.
Contribution 7 – Contribution to Qualitative Research
The study provided an exemplary example of the conduct of qualitative research.
The design itself is unique in its iterative use of methods, including the three
distinct and distinctive applications of the case study method. The study was an
exemplar in how this method can be utilised in multiple ways to provide rich
insights that progressively build a comprehensive body of knowledge.
The use of the Delphi Technique provided an example of an alternative means of
identifying and defining constructs using a panel of experts. In doing so, it
provided a means to overcoming geographical and disciplinary boundaries to
take advantage of dispersed expertise without losing the rich detail common to
qualitative research.
The use of multiple complementary data collection methods, data analysis
techniques and reporting cycles, as evidenced in the extensive documentation in
the Appendix, provided an exemplary example of how to conduct systematic,
rigorous qualitative research.
Publications with a methodological focus include:
de Bruin, T. (2005, November). BPM maturity. In I. Hawryszkiewycz (Chair),
Doctoral Consortium for the 16th Australasian Conference of Information
Systems, Sydney.
de Bruin, T. (2005, November). BPM maturity. In K. Fielden & B. Rowlands (Co-
Chairs), Doctoral Consortium for the 2nd International conference on Qualitative
Research in IT & IT in Qualitative Research, Brisbane.

Business Process Management: Progression and Maturity
- 11:399 -
11.3.2 Practical Implications
The following practical contributions support the achievements of the aims of this
study, as do the publications, presentations and inquiries listed in Chapter 1, and
selectively highlighted here.
Contribution 1 – Unique Insights into BPM Progression
Through the development of the theory for BPM Progression, this research
provided the first empirical guidance for assisting organisations to progress their
BPM Initiatives. Furthermore, it provided the first consolidated insights into the
progression of BPM Initiatives, including how this potentially differs between
different structures of BPM Initiatives. The study also showed how the contextual
environment is likely to influence the progression of BPM Initiatives, including the
potential impact from changes in contextual variables and time.
Contribution 2 – Informal Guidance on BPM Progression
The BPM Capability Framework provided guidance to BPM practitioners on the
capability areas that enable the progression of BPM Initiatives. Although the
study does not give deep insights into how and why to develop these capability
areas, practitioners can use the framework to select which BPM capability areas
to develop within their own organisations.
Contribution 3 – Formal Measurement of BPM Progression
Through the practical operationalisation of the BPM Capability Framework, this
study provided practitioners with access to a range of instruments to assess BPM
Maturity, enabling the independent measurement of BPM Progression. The case
studies provided an opportunity to pilot and test these instruments, which the
Researcher has since used in commercial endeavours. The Researcher‟s
comprehensive understanding of BPM Progression and the focus of this research
on understanding the development of BPM capability makes these instruments
unique to the marketplace. Application of these instruments allows the derivation
of a comprehensive BPM roadmap, enabling the selection of BPM strategies for
building capabilities that match the specific circumstances of each organisation.

Chapter 11 – Research Contributions, Limitations and Outlook
- 11:400 -
Contribution 4 – Executive Buy-In to BPM
A prominent issue in progressing BPM is the need for Executive Buy-In. This
study argued that Executive Buy-In plays a vital role in the progression of BPM
Initiatives. The study showed that progression of an organisational approach to
BPM is not sustainable without high levels of Executive Buy-In. The survey
developed for the longitudinal case studies provided practitioners with a means of
measuring existing levels of Executive Buy-In112. Furthermore, in supplementary
research conducted during this study, the Researcher identified strategies for
increasing the level of Executive Buy-In.
Industry Oriented Publications
A number of publications reinforce the practical relevance of this research and
provide practitioners with insights on aspects of this study. These include:
de Bruin, T., & Doebeli, G. (in press). BPM as an organizational approach: The
experience of an Australian transport provider. In M. Rosemann & J. vom Brocke
(Eds.), Handbook on Business Process Management: Vol.1. Berlin: Springer
Publishing Company.
de Bruin, T., & Doebeli, G. (2009). Progressing an organizational approach to
BPM: Integrating experience from industry and research. Proceedings of the 21st
International Conference on Advanced Information Systems (Industrial Track),
Amsterdam.
de Bruin, T. (2008). Strategies for increasing executive commitment to BPM.
Proceedings of the 16th European Conference on Information Systems, Galway,
1620-1631.
de Bruin, T., & Rosemann, M. (2006). Towards understanding strategic alignment
of BPM. Proceedings of the 17th Australasian Conference on Information
Systems, Adelaide.
112
These measures derive from existing literature but this study did not undertake any further validation of the measures.
Business Process Management: Progression and Maturity
- 11:401 -
Rosemann, M., de Bruin, T., & Power, B. (2006). A model to Measure BPM
Maturity and Improve Performance. In J. Jeston & J. Nelis, Business process
management: Practical guidelines to successful implementations, (pp. 299-315).
Burlington, Massachusesetts: Butterworth-Heinemann.
de Bruin, T (2005). Embedding BPM. In: Self study course in Business Process
Management, Module 9. Sydney: Informa Australia Pty.
11.4 Research Limitations
As with any research design, there are limitations presented by the research
design, the research execution and potential bias from the Researcher. The
following sections discuss a number of limitations of this study, including their
potential impact on the outcomes, together with the strategies adopted by the
Researcher to mitigate this.
11.4.1 Selection Issues
A potential limitation in any study lies in the selection and application of methods.
This section discusses limitations and mitigations strategies arising from the use
of the Case Study method and the Delphi Technique.
One limitation when conducting case study research lies in the case selection.
In-depth organisational level case studies are both time and resource intensive.
As a result, whilst they enable the exploration of ideas, the ability to conduct
more than a small number of in-depth case studies is not possible given the
constraints of PhD research. The small number of organisations may be a
limitation, potentially restricting the generalisability of research findings due to
what some would refer to as a “small sample size”. Nevertheless, using the case
study method was appropriate to the theory building nature of this study.
The selection process and the availability of cases can also act as a further
limitation. Due to the resource constraints, it can be difficult to get organisations
to participate in case research, for example. It can be even more difficult to get
organisations to participate if they are (a) not actively involved with the
phenomenon in question or (b) not successfully involved with the phenomenon in
question. Denrell (2005) shows the effect of selection bias in a number of
Chapter 11 – Research Contributions, Limitations and Outlook
- 11:402 -
studies. In this case, the exclusion of organisations that are (a) not continuing
with their BPM journey or (b) that have not experienced a high level of success
with their BPM endeavours has the potential to introduce bias to the findings.
In this instance, whilst a number of organisations were continuing with their BPM
Initiatives, one organisation from the multiple longitudinal case studies fit both of
these situations. In this organisation, an „in-progress‟ merger had put a hold on
the BPM Initiative until such time as the new parent company had determined
where they wanted to go with BPM. This case gave important insights into the
impact of such a change.
Case selection can also be constrained by budgetary and accessibility issues. In
this research, the selection of Australian based organisations, due to their
accessibility and the Researcher‟s budget, reflects this. To mitigate this, the
Researcher aimed to select some organisations that had global aspects to their
operations. In one case, the organisation was a wholly owned subsidiary of a
parent company. The subsidiary company had direct operations in Australia,
New Zealand and South Africa and the parent company had over 50 wholly
owned or controlled entities operating in Europe, America, China and Africa. In
another case, the organisation mostly operated in regional Australia but also had
offices in Canada and their client base was a mix of Australian and non-
Australian. For yet another case, an Australian based organisation was adopting
BPM as a means of achieving globalisation, thus they saw their immediate
market competitors as international organisations.
A potential limitation also arose during the conduct of the Delphi studies in the
selection of the Expert Panel. In this study, the Expert Panel represented a
number of regions but was not representative of BPM within those regions. The
represented regions included only Europe, America and Australia however.
There were attempts to identify potential panellists from other regions through
literature searches, with limited success. In the few cases identified, the potential
panellists from other regions did not accept the invitation to participate in the
Delphi study. As such, there is a possibility that the outcomes of the Delphi
studies could have a bias towards the represented regions.

Business Process Management: Progression and Maturity
- 11:403 -
11.4.2 Data Bias
Another limitation in research that relies heavily on qualitative data is the quality
of the data that is collected. To mitigate this, in all stages of the study, the
Researcher aimed to design complementary data collection instruments that
facilitated triangulation between data sources, and approaches to data collection
that facilitated feedback and confirmation loops.
By way of example, during the Delphi study series bias could arise from having a
single researcher coding the data from multiple regions. To counter this, the
Researcher used a Coding Team consisting of PhD qualified researchers from
each of the regions represented. In addition, an iterative process guided coding
so that each coder first coded independently before all coders convened to
compare and discuss outcomes. Furthermore, the Researcher used a fully
transparent approach for the return of data to the Expert Panel whereby all
coding and categorisation was summarised in the documents for subsequent
Delphi rounds.
In addition, in both the Delphi studies and all Case Studies, the Researcher
provided participants with a report and a presentation of findings. In each case,
participants were encouraged to provide further clarification and input where they
believed interpretation was not consistent with their intent.
11.4.3 Starting Points
During the later stages, this study explored the emphasis that organisations
placed on developing BPM capability at two points in time (i.e. First Year and
Last Year), and the change that occurs between the two points. Whilst the Last
Year was consistent across organisations, the starting year differed for some.
This meant that the period over which the Researcher measured the change in
capability differed in two of the five companies. To limit this impact the
Researcher calculated the relative change between these two points.

Chapter 11 – Research Contributions, Limitations and Outlook
- 11:404 -
11.4.4 Future Theory Testing Implications
The scope of this thesis was limited to theory building in an emerging domain that
lacked a theoretical foundation upon which to build. Consequently, the focus was
on adopting methods and approaches most suited to this situation. The selection
of methods inevitably leads to potential limitations for future theory refinement
and theory testing research. This study used methods such as case studies and
longitudinal studies as opposed to an alternative approach using cross-sectional
studies. This creates potential issues for subsequent theory testing.
Within the longitudinal study for example, the Researcher used a simplistic
approach to measure change, using the proportional differences between data at
two points in time. There is debate however, around the measurement of
change, including the various ways in which to calculate change and whether we
should measure change at all. Some of the debate also deals with the
correlation between the variables and the impact of this correlation on the
reliability of results (Bergh & Fairbanks 2002; Cronbach & Furby 1970).
Similarly, this study proposed a multidimensional, formative measurement model
for BPM Maturity. Proposing a formative model goes against the flow of popular
research, with much of the published research in management fields being
reflective in nature. As with the measurement of change, there is considerable
debate over the use of formative models. Critics argue that collective dimensions
explain less variance, their relationships are confounded between and within
dimensions, and that these models are conceptually ambiguous (Edwards 2001).
Alternatively, advocates such as Hanisch, Hulin and Roznoski (1998) claim that
multidimensional constructs allow the matching of broad predictors and
outcomes, greater explained variance and thus enable holistic representations of
complex phenomena (Edwards, 2001).
The Researcher believes that the systematic approach taken to the study
supports both the choices made during the study, and the subsequent outcomes
of the study. At the same time, the need to investigate the implications of these
debates on the future refinement and testing of the theory arising from this study
requires further research.

Business Process Management: Progression and Maturity
- 11:405 -
11.4.5 Researcher Ability
A further potential limitation inevitably lies in the ability and experience of the
Researcher, and the extent to which this has influenced the study.
Experience working in organisations prior to undertaking PhD research has
undoubtedly affected the Researcher‟s view of the world and created a desire to
conduct both relevant and rigorous research. This experience potentially
influenced the collection and interpretation of data, particularly with qualitative
data. This experience, for example, can affect the Researcher‟s interaction with
individuals in the case study organisations, interviewing style and the questions
asked during in semi-structured interviews.
Where possible, recording and transcribing interviews and workshops occurred,
enabling thick descriptions (Myers & Newman, 2007) from the data to support
conclusions. Furthermore, the design of the study incorporated many
checkpoints and reporting to participants to gain feedback about the
interpretation of data. During the longitudinal case studies, for example, the
Researcher undertook within-case analysis to provide participants with an
opportunity to clarify and extend initial interpretations of the data. In all cases,
the Researcher ensured that such reporting was after the collection of data so as
not to bias the collection of future data. Furthermore, throughout this thesis the
Researcher endeavoured to make the data collection and analysis as transparent
as possible, showing the progression of the thoughts throughout the study.
During the study, the Researcher gained supplementary insights into the BPM
domain outside of the study itself. This included regularly attending industry
events and seminars, participating in BPM forums, presenting at conferences and
conducting training and education in BPM, where possible. This provided the
Researcher with exposure to different perspectives and experiences of BPM.
Finally, throughout the entire PhD journey, the Researcher remained as
objective, as unbiased, as receptive and as open-minded as possible.

Chapter 11 – Research Contributions, Limitations and Outlook
- 11:406 -
11.5 Research Outlook
The focus of this study has been on theory building, producing a number of
significant theoretical and practical implications for the progression and
measurement of BPM Initiatives in organisations. In doing so, this study provided
a platform for the progression of future research in a number of areas, including
but not limited to, the testing of the theory produced by the study. The following
sections present some ideas for potential future research.
11.5.1 Recognising Dynamic Capabilities
In strategic management literature, Porter (1996) introduced the concept of a
productivity frontier for optimising operational effectiveness and strategic
positioning. The distinction Porter (1996) made between the availability of
processes, technologies and best practice and the strategies combining these, is
similar to the distinctions other researchers draw when discussing dynamic
capabilities or competences and their role in achieving and sustaining
competitive advantage within organisations113. In particular Teece et al. (1997,
509) state:
“…The competitive advantage of firms is seen as resting on
distinctive processes (ways of coordinating and combining), shaped
by the firm‟s (specific) asset positions (such as the firm‟s portfolio of
difficult-to-trade knowledge assets and complementary assets), and
the evolution path(s) it has adopted or inherited...”
This work builds on early research in this area including Porter‟s (1980)
competitive forces approach and the strategic conflict approach (Shapiro, 1989).
These approaches do not see competition as a process but rather as a series of
“sophisticated plays and counterplays”. Furthermore, Teece et al. (1997)
extended the resource-based perspective that Wernerfelt (1984) first
distinguished as being separate from the earlier approaches. In introducing the
resource-based perspective to organisational theory, Wernerfelt (1984)
113
Such researchers include Bhatt, (2000), Eisenhardt & Martin (2000), Helfat & Peteraf (2003), Leonard-Barton (1992), Prahalad & Hamel (1990) and Teece et al. (1997).
Business Process Management: Progression and Maturity
- 11:407 -
highlighted the existence of organisation specific assets and capabilities and the
importance to performance of combining scarce resource capabilities that are
difficult to imitate. The efficiency-based approach offered by Teece et al. (1997,
510), known as dynamic capabilities, sought to extend earlier work to:
“...identify the dimensions of firm-specific capabilities that can be
sources of advantage, and to explain how combinations of
competences and resources can be developed, deployed, and
protected. We refer to this as the „dynamic capabilities‟ approach in
order to stress exploiting existing internal and external firm-specific
competences to address changing environments...”
Bhatt (2000, 120) holds similar views stating that:
“…Neither capabilities nor resources, alone, are sufficient to offer
above average rents to the organization…”
The Researcher contends that BPM as an organisational approach is
conceptually similar to the extension of Wernerfelt‟s (1984) resource-based view
made by Teece et al. (1997). Furthermore, whilst BPM as a lifecycle approach
focuses on process competences and resources, BPM as an organisational
approach focuses on the development, deployment and protection of these
capabilities within an organisations changing environment. Thus, in
understanding the progression of BPM as an organisational approach, there is a
need to adopt a “dynamic capabilities view” and consider both which BPM
capabilities an organisation focuses on, as well as how the organisation‟s
changing environment affects this focus. How and why an organisation selects
specific strategies has been outside of the scope of this study, but raises an
interesting area for future research.
11.5.2 Paradigmatic Research
This thesis was multi-paradigmatic, exploring BPM within organisations using a
lens that suited the inquiry, in this case, a combination of positivistic and critical
approaches (as defined by Orlikowski & Baroudi, 1991). Giore and Pitre (1990)
and Lee (1991) indicate that a multi-paradigmatic approach is suited to exploring

Chapter 11 – Research Contributions, Limitations and Outlook
- 11:408 -
complex issues in emerging domains and as a precursor to subsequent single
paradigmatic research.
Consequently, there is scope for advancing a cohesive and cumulative body of
BPM theory within paradigms. Interpretive research could advance theory into
BPM Progression by addressing questions such as:
Why and how do organisations respond to contextual variables in the
manner in which they do? How do these responses vary from
organisation to organisation?
How and why do organisations select BPM practices in the capability
areas? Are some practices more or less successful, and why is that?
Alternatively, positivistic research could further investigate the relationships
between variables, taking into account the temporal and contextual issues found
in this study. Such research could further the investigation of commonalities
across different groups such as, regions, industry types, stage of progression,
scope of BPM Initiative, approach to implementing BPM Initiatives. Future
research is also required to test the theory produced by this study.
11.5.3 BPM Success, Process Success and Organisational
Performance
The initial conceptual model, presented first in Chapter 1, showed critical factors
and contextual variables of BPM Progression combining to produce a construct
of BPM Maturity. This model also showed the potential relationship of BPM
Maturity with the constructs of BPM Success, Process Success and
Organisational Performance. Aside from BPM Progression and BPM Maturity
however, these constructs have received little or no attention during the study,
other than their initial identification. Thus, the study provided a platform for future
studies exploring BPM Success, Process Success and Organisational
Performance and their relationship with BPM Maturity.

Business Process Management: Progression and Maturity
- 11:409 -
11.5.4 Change and Relationship Research
This thesis proposed initial insights and conjectures regarding the relationships,
and the change in relationships, between the variables in the measurement
model for BPM Maturity. In doing so, this research took a simplistic approach to
the measurement of change. The study provided early insights into potential
relationships but these are by no means exhaustive or conclusive. Rather, the
study confirmed aspects about the relationships and the way in which they
change, that is that the:
1. Relationships vary between organisations
2. Relationships vary over time
3. Relationships vary dependent on the structure of the BPM Initiative.
There is much debate around the impact of measuring change and this, together
with these findings, has obvious implications on how to test relationships during
subsequent theory testing research.
11.5.5 Measures for Capability Areas
Another area that requires further research is the refinement of the capability
areas including the development of measures for these areas. The Researcher
has made progress in this area with the piloting of initial surveys however further
work is required based on the outcomes of the study.
11.6 Chapter Summary
In concluding this thesis, this chapter has presented:
1. How the study has delivered against the initial study questions
2. A summary of the practical and theoretical contributions of the study
3. A discussion on its inherent limitation and the mitigation strategies
adopted by the Researcher to minimise the impact of these
4. A discussion on potential areas of future research.
Chapter 11 – Research Contributions, Limitations and Outlook
- 11:410 -
To commence the study, an in-depth review of extant literature positioned BPM
as a new and emerging domain, plagued by inconsistent use of terminology and
lacking in a cumulative body of knowledge and theory. To address these issues,
the Researcher adopted a multi-paradigmatic stance and a staged approach to
the study that incorporated methods including literature review, case studies and
the Delphi Technique.
From this base, the Researcher systematically explored the progression of BPM
Initiatives within organisations, first, developing a conceptual model for
understanding BPM Progression and BPM Maturity. This model was then refined
and extended using a combination of case studies and a series of Delphi studies.
Using an iterative case study approach, involving exploratory and longitudinal
cases studies, the Researcher then showed that a formative approach to
measuring BPM Maturity was appropriate for capturing the contextual and
temporal implications of progression, and for avoiding spurious results.
In adopting this approach, the Researcher has shown the value in separating the
concepts of BPM Maturity (a static construct capturing the state of progression at
a given point in time) and BPM Progression (a dynamic concept that requires a
longitudinal view to capture adequately the contextual and temporal aspects of
progression). Consequently initial theory on BPM Progression and a formative
measurement model BPM Maturity were developed.
Through all stages of the study, the Researcher has maintained high standards
of rigour whilst undertaking highly relevant research. The theoretical and
practical contributions and publications are indicative of the success of this effort.
Consequently, the outcomes of this study provide a significant contribution to the
BPM body of knowledge for both academia and industry.

Business Process Management: Progression and Maturity
12 Bibliography

Bibliography
- 12:412 -
Adesola, S., & Baines, T. (2005). Developing and evaluating a methodology for
business process improvement. Business Process Management Journal,
11(1), 37-46.
Adler, N. (1983). Cross-cultural management research: The ostrich and the trend.
Academy of Management Review, 8(2), 226-232.
Ahrens, T. & Dent, J. F. (1998). Accounting and organizations: Realizing the
richness of field research. Journal of Management Accounting Research, 10,
1-39.
Allison, P. D. (1990). Change scores as dependent variables in regression
analysis. Sociological Methodology, 20, 93-114.
Amaratunga, D., Sarshar, M., & Baldry, D. (2002). Process improvement in
facilities management: The SPICE approach. Business Process Management
Journal, 8(4), 318-337.
Anderson, J. C., Rungtusanatham, M., & Schroeder, R. G. (1994). A theory of
quality management underlying the Deming management method. Academy
of Management Review, 19(3), 472-509.
Armistead, C. (1996). Principles of business process management. Managing
Service Quality, 6(4), 48-52.
Armistead, C., & Machin, S. (1997). Implications of business process
management for operations management. International Journal of Operations
& Production Management, 17(9), 886-898.
Bacharach, S. B. (1989). Organizational theories: Some criteria for evaluation.
Academy of Management Review, 14(4), 496-515.
Bacon, D., & Fitzgerald, B. (2001). A systemic framework for the field of
information systems. Database for Advances in Information Systems, 32(2),
46-67.

Business Process Management: Progression and Maturity
- 12:413 -
Bandara, W. (2007). Process Modeling Critical Success Factors and Measures.
(Doctoral dissertation, Queensland University of Technology, 2007). Australian
Digital Theses Program, http://eprints.qut.edu.au/16397/.
Bandara, W., Gable, G. G., & Rosemann, M. (2005). Factors and measures of
business process modelling: Model building through a multiple case study.
European Journal of Information Systems, 14(4), 347-360.
Barton, K., Martin, D., Tein, M., & Matthews, G. (2001). Management: A Pacific
Rim Focus. Sydney: McGraw-Hill.
Benbasat, I., Goldstein, D. K., & Mead, M. (1987). The case research strategy in
studies of information systems. MIS Quarterly, 11(3), 369-386.
Bergh, D. D. (1995). Problems with repeated measures analysis: Demonstration
with a study of the diversification and performance relationship. Academy of
Management Journal, 38(6), 1692-1708.
Bergh, D. D. & Fairbank, J. F. (2002). Measuring and testing change in strategic
management research. Strategic Management Journal, 23(4) 359-366.
Bergh, D. D., & Holbein, G. F. (1997). Assessment and redirection of longitudinal
analysis: Demonstration with a study of the diversification and divesture
relationship. Strategic Management Journal, 18(7), 557-572.
Bhatt, G. D. (2000). A resource-based perspective of developing organizational
capabilities for business transformation. Knowledge and Process
Management, 7(2), 119-129.
Biazzo, S. (2000). Approaches to business process analysis: A review. Business
Process Management Journal, 6(2), 99-112.
Blalock, H. M. (1968). The measurement problem: A gap between the languages
of theory and research. In: H. M. Blalock and A. B. Blalock (Eds.).
Methodology in Social Research. New York: McGraw-Hill Education.
Bollen, K. A. (2007). Interpretational confounding is due to misspecification, not
to type of indicator: Comment on Howell, Breivik and Wilcox (2007).
Psychological Methods, 12(2), 219-228.

Bibliography
- 12:414 -
Bollen, K., & Lennox, R. (1991). Conventional Wisdom on Measurement: A
structural equation perspective. Psychological Bulletin, 110(2), 305-314.
Bonoma, T. V. (1985). Case research in marketing: Opportunities, problems and
a process. Journal of Marketing Research, 22(2), 199-208.
Booz, Allen, Hamilton (2003). Process ownership: The overlooked driver of
sustained BPR success. Retrieved February 16, 2005 from
http://www.boozallen.com/media/file/138265.pdf.
Bowen, H. P., & Wiersema, M. F. (1999). Matching method of paradigm in
strategy research: Limitations of cross sectional analysis and some
methodological alternatives. Strategic Management Journal, 20(7), 625-636.
Box, S., & Platts, K. (2005). Business process management: Establishing and
maintaining project alignment. Business Process Management Journal, 11(4),
370-387.
Braganza, A., & Lambert, R. (2000). Strategic integration: Developing a process
governance framework. Knowledge and Process Management, 7(3), 177-186.
Brancheau, J. C. & Wetherbe, J. C. (1987). Key Issues in information systems
management. MIS Quarterly, 11(1), 23-45.
Brancheau, J. C., Janz, B. D., & Wetherbe, J. C. (1996). Key issues in
information systems management: 1994-95 SIM Delphi results. MIS Quarterly,
20(2), 225-242.
Chalofsky, N. E. (1996). Professionalization comes from theory and research:
The why instead of the how to. New Directions for Adult and Continuing
Education, 72, 51-56.
Collins, J. C., & Porras, J. I. (2000). Build to Last: Successful Habits of Visionary
Companies, London: Random House Business Books.
Colorado State University. (2004). Writing@CSU: Writing Guide: Advantages and
disadvantages of the survey method. Retrieved November 16, 2005, from
http://writing.colostate.edu/guides/research/survey/com2d1.cfm.

Business Process Management: Progression and Maturity
- 12:415 -
Corrigan, S. (1996). Human and organisational aspects of business process
reengineering. Retrieved March 1, 2006, from http://www.faculty.css.edu/
dswenson/web/REENGIN.HTM.
Costner, H. L. (1969). Theory, deduction, and the rules of correspondence.
American Journal of Sociology, 75(2), 245-263.
Couger, J. D. (1988). Key human resource issues in IS in the 1990‟s.
Proceedings of the Twenty-First Annual Hawaii International Conference on
Information Systems, Kailua-Kona, HI USA, 4, 162-170.
Cronbach, L. J., & Furby, L. (1970). How we should measure “change” – or
should we? Psychological Bulletin, 74(1), 68-80.
Crowston, K. (1997). A co-ordination theory approach to organizational process
design. Organization Science, 8 (2), 157-75.
Curtis, B., & Alden, J. (2006) Business process improvement guided by the
BPMM. Retrieved February 26, 2007, from http://www.bptrends.com/
resources_publications.cfm.
Dalkey, N (1969). The Delphi method: An experimental study of group opinion
(RM5888PR). Santa Monica, CA: Rand.
Dalkey, N., & Helmer, O. (1963). An experimental application of the Delphi
method to the use of experts. Management Science, 9(3), 458-467.
Damianides, M. (2005). Sarbanes-Oxley and IT governance: New guidance on IT
control and compliance. Information Systems Management, 22(1), 77-85.
Davenport, T. H. (1993a). Process Innovation: Reengineering Work through
Information Technology. New York: Harvard Business School Press.
Davenport, T. H. (1993b). Need radical innovation and continuous improvement?
Integrate process reengineering and TQM. Planning Review, 21(3), 6-12.
de Bruin, T. (2005, November). BPM maturity. In I. Hawryszkiewycz (Chair),
Doctoral Consortium for the 16th Australasian Conference of Information
Systems, Sydney.
Bibliography
- 12:416 -
de Bruin, T. (2005, November). BPM maturity. In K. Fielden & B. Rowlands (Co-
Chairs), Doctoral Consortium for the 2nd International conference on Qualitative
Research in IT & IT in Qualitative Research, Brisbane.
de Bruin, T. (2007). Insights into the evolution of BPM in organisations.
Proceedings of the 18th Australasian Conference on Information Systems,
Toowoomba, 632-642.
de Bruin, T. (2008). Strategies for increasing executive commitment to BPM.
Proceedings of the 16th European Conference on Information Systems, Galway,
1620-1631.
de Bruin, T., & Doebeli, G. (2009). Progressing an organizational approach to
BPM: Integrating experience from industry and research. Proceedings of the 21st
International Conference on Advanced Information Systems (Industrial Track),
Amsterdam.
de Bruin, T., & Doebeli, G. (in press). BPM as an organizational approach: The
experience of an Australian transport provider. In M. Rosemann & J. vom Brocke
(Eds.), Handbook on Business Process Management: Vol. 1. Berlin: Springer
Publishing Company.
de Bruin, T., & Rosemann, M. (2007). Identifying BPM capability areas using the
Delphi Technique. Proceedings of the 18th Australasian Conference on
Information Systems, Toowoomba, 643-653.
de Bruin, T., & Rosemann, M. (2006). Towards understanding strategic alignment
of BPM. Proceedings of the 17th Australasian Conference on Information
Systems, Adelaide.
de Bruin, T., Rosemann, M., Freeze, R., & Kulkarni, U (2005). Understanding the
main phases of developing a maturity model. Proceedings of the 16th
Australasian Conference on Information Systems, Sydney.
Deming, W. (1986). Out of the Crisis. Cambridge: Cambridge University Press.

Business Process Management: Progression and Maturity
- 12:417 -
Denrell, J. (2005). Selection bias and the perils of Benchmarking. Harvard
Business Review, 83(4), 114-119.
DeToro, I., & McCabe, T. (1997). How to stay flexible and elude fads. Quality
Progress, 30(3), 55-60.
Diamantopoulos, A. (2008). Formative indicators: Introduction to the special
issue. Journal of Business Research, 61(12), 1201-1202.
Diamantopoulos, A., Riefler, P., & Roth, K. P. (2008). Advancing formative
measurement models. Journal of Business Research, 61(12), 1203-1218.
Diamantopoulos, A., & Siguaw, J. A. (2006). Formative versus reflective
indicators in organizational measure development: A comparison and
empirical illustration. British Journal of Management, 17, 263-282.
Doty, D. H. & Glick, W. H. (1994). Typologies as a unique form of theory building:
Towards improved understanding and modelling. Academy of Management
Review, 19(2), 230-251.
Dubin, R. (1976). Theory building in applied areas. In M. D. Dunnette (Ed.).
Handbook of industrial and organizational psychology, 17-39, Skokie, IL: Rand
McNally.
Dubin, R. (1978). Theory Building (rev. Ed) New York: Free Press.
Dumas, M., van der Aalst, W. M., & ter Hofstede, H. M. (2005). Process Aware
Information Systems. Hoboken, New Jersey: John Wiley & Sons.
Edwards, C., Braganza, A., & Lambert, R. (2000). Understanding and managing
process initiatives: A framework for developing consensus. Knowledge and
Process Management, 7(1), 29-36.
Edwards, J. R. (1994). Regression analysis as an alternative to difference
scores. Journal of Management, 20(3), 683-689.
Edwards, J. R. (2001). Multidimensional constructs in organizational behaviour
research: An integrative Analytical Framework. Organizational Research
Methods, 4(2), 144-192.

Bibliography
- 12:418 -
Edwards, J. R., & Bagozzi, R. P. (2000). On the nature and direction of
relationships between constructs and measures. Psychological Methods, 5(2),
155-174.
EFQM (2005). Retrieved May 15, 2006, from http://www.efqm.org/.
Eisenhardt, K. M. (1989). Building theories from case study research. Academy
of Management Review, 14(4), 532-550.
Eisenhardt, K. M., & Martin, J. A. (2000). Dynamic capabilities: What are they?
Strategic Management Journal, 21(10/11), 1105-1121.
Elderidge,N., & Gould, S. (1972). Punctuated equilibria: An alternative to phyletic
gradualism. T. J. Schopf ed. Models in Paleobiology, pages 82-115. San
Franciscon, CA: Freeman, Cooper, & Co.
Elzinga, D. J., Horak, T., Lee, C-Y., & Bruner, C. (1995). Business process
management: Survey and methodology. IEEE Transactions on Engineering
Management, 42(2), 119-128.
Emory, C. W. (1985). Business Research Methods (3rd ed.). Homewood, Illinois:
R. D. Irwin.
Erffmeyer, R. C., Erffmeyer, E. S., & Lane, I. M. (1986). The Delphi technique: An
empirical evaluation of the optimal number of rounds. Group and Organisation
Studies, 11(1-2), 120-128.
Fink, A., & Kosecoff, J. B. (1985). How to conduct surveys: A step-by-step guide.
Beverly Hills: Sage Publications.
Fisher, D.M. (2004). The business process maturity model: A practical approach
for identifying opportunities for optimization. Retrieved March 17, 2006, from
http://www.bptrends.com/resources_publications.cfm.
Forza, C. (2002). Survey research in operations management: A process based
perspective. International Journal of Operations and Production Management,
22(2), 152-194.

Business Process Management: Progression and Maturity
- 12:419 -
Freeze, R. D., & Raschke, R. L. (2007). An assessment of formative and
reflective constructs in IS research. Retrieved July 10, 2007, from
http://csrc.lse.ac.uk/asp/aspecis/20070055.pdf.
Gable, G. G. (1991). Consultant engagement success factors: A case study
affecting client involvement in, and satisfaction with, consultant engagement in
computer system selection projects, carried out for the small enterprise
computerisation programme, in Singapore. University of Bradford.
Gable, G. G. (1994). Integrating case study and survey research methods: An
example in information systems. European Journal of Information Systems,
3(2), 112-126.
Galliers, R. D. & Sutherland, A. R. (1991). Information systems management and
strategy formation: The “stages of growth” model revisited. Information
Systems Journal, 1(2), 89-114.
Gartner (2005). Business process management‟s success hinges on business-
led initiatives. Author: Melenovsky, M. J., Note Number: G00129411.
Gartner Group (2009). Meeting the challenge: The 2009 CIO Agenda.
EXPPremier Report. January. Connecticut: Gartner Inc. Stamford.
Garvin, D. A. (1998). The process of organisation and management. Sloan
Management Review, 39(4), 33-50.
Gersick, C. J. G. (1991). Revolutionary change theories: A multilevel exploration
of the punctuated equilibrium paradigm. Academy of Management, 16(1), 10-
36.
Gioia, D. A., & Pitre, E. (1990). Multiparadigm Perspectives on Theory Building.
The Academy of Management Review, 15(4), 584-602.
Glaser, B. G., & Strauss, A. L., (1967). The Discovery of Grounded Theory.
Chicago, IL: Aldine Publishing.
Gottman, J. M., & Rushe, R. H. (1993). The analysis of change: Issues, fallacies,
and new ideas. Journal of Consulting and Clinical Psychology, 61(6), 907-910.

Bibliography
- 12:420 -
Greasley, A. (2003). Using business-process simulation within a business-
process reengineering approach. Business Process Management Journal,
9(4), 408-420.
Gregor, S. (2002). A theory of theories in information systems. Information
Systems Foundations: Building the Theoretical Base, Australian National
University, Canberra, 1-20.
Gregor, S. (2006). The nature of theory in information systems. MIS Quarterly,
30(3), 611-642.
Gulledge Jr, T. R., & Sommer, R. A. (2002). Business process management:
Public sector implications. Business Process Management Journal, 8(4), 364-
376.
Hammer, M. (2001). The process enterprise: An executive perspective. Retrieved
February 10, 2006, from http://www.hammerandco.com/ publications.asp.
Hammer, M. (2007). The Process Audit. Harvard Business Review, 85(4), 111-
123.
Hammer, M. & Champy, J. (1993). Reengineering the Corporation, New York,
NY: Free Press.
Hammersley, M. (1999) Deconstructing the qualitative-quantitative divide.
Bryman, A., & Burgess, R. Eds., Chapter 4 in Qualitative Research: Volume 1.
London: Sage Publications.
Handfield, R. B., & Melnyk, S. (1998). The scientific theory-building process: A
primer using the case of TQM. Journal of Operations Management, 16(4),
322-339.
Hanish, K. A., Hulin, C. L., & Roznowski, M. (1998). The importance of
individuals‟ repertoires of behaviors: The scientific appropriateness of studying
multiple behaviours and general attitudes. Journal of Organizational Behavior,
19(5), 463-480.
Harmon, P. (2003). Business Process Change: A Manager's Guide to Improving,
Redesigning, and Automating Processes. San Francisco: Morgan Kaufmann.
Business Process Management: Progression and Maturity
- 12:421 -
Harmon, P. (2004). Evaluating an organisation's business process maturity.
Retrieved February 10, 2006, from http://www.bptrends.com/
resources_publications.cfm.
Harmon, P. (2005). Best practices in the governance of BPM. Retrieved January
28, 2006, from http://www.bptrends.com/resources_publications.cfm.
Harmon, P., & Wolf, C. (2008). The state of business process management.
Retrieved August 8, 2008, from http://www.bptrends.com/
resources_publications.cfm.
Harrington, H. J. (1991). Business Process Improvement: The Breakthrough
Strategy for Total Quality, Productivity and Competitiveness. New York, NY:
McGraw-Hill.
Harrington, J.J and Tumay, K. (2000). Simulation Modeling Methods: To Reduce
Risks and Increase Performance, New York, NY: McGraw-Hill.
Harrison, A. (1998). Investigating business processes: does process
simplification always work? Business Process Management Journal, 4(2),
137-153.
Hatten, K. J., & Rosenthal, S. R. (1999). Managing the process-centred
Enterprise. Long Range Planning, 32(3), 293-310.
Hattie, J. (1985). Methodology review: Assessing unidimensionality of tests and
items. Applied Psychological Measurement, 9(2), 139-164.
Hayne, S., & Pollard, C. (2000). A comparative analysis of critical issues facing
Canadian information systems personnel: A national and global perspective.
Information and Management, 38(2), 73-86.
Helfat, C. E., & Peteraf, M. A. (2003). The dynamic resource-based view:
Capability lifecycles. Strategic Management Journal, 24(10), 997-1010.
Hill, C. W. L., & Hansen, G. S. (1991). A longitudinal study of the cause and
consequences of changes in diversification in the U.S. pharmaceutical
industry 1977 – 1986. Strategic Management Journal, 12(3), 665-676.

Bibliography
- 12:422 -
Hirschman, E. C. (1986). Humanistic Inquiry in Marketing Research: Philosophy,
Method and Criteria. Journal of Marketing Research, 23, 237-249.
Huang, S.-J., & Han, W.-M. (2006). Selection priority of process areas based on
CMMI continuous representation. Information & Management, 43(3), 297-307.
Huber G. P., & Van de Ven, A. (1995). Longitudinal Field Research Methods:
Studying Processes of Organizational Change. Thousand Oaks: Sage
Publications, Inc.
Hung, R.Y.-Y. (2006). Business process management as competitive advantage:
A review and empirical study. Total Quality Management, 17(1), 2-40.
Ittner, C. D., & Larcker, D. F. (1997). The performance effects of process
management techniques. Management Science, 43(4), 522-534.
Jarrar, Y.F., Al-Mudimigh, A., & Zairi, M. (2000). ERP implementation critical
success factors - the role and impact of business process management.
Management of Innovation and Technology – Conference Proceedings, IEEE
ICMIT Conference, Singapore, 122-127.
Jarvis, C.B., MacKenzie, S. B., & Podsakoff, P. M. (2003). A critical review of
construct indicators and measurement model misspecification in marketing
and consumer research. Journal of Consumer Research, 30(2), 199-218.
Jick, T. (1979). Mixing qualitative and quantitative methods: Triangulation in
action. Administrative Science Quarterly, 24(4), 602-611.
Johns, G. (1981). Difference score measures of organizational behavior
variables: A critique. Organizational Behavior and Human Performance, 27(3),
443-463.
Johns, G. (1998). Aggregation or aggravation? The relative merits of a broad
withdrawal construct. Journal of Organizational Behavior, 19(5), 453-462.
Kaplan, B., & Duchon, D. (1988). Combining qualitative and quantitative methods
in information systems research: A case study. MIS Quarterly, 12(4), 571-586.

Business Process Management: Progression and Maturity
- 12:423 -
Kaplan, R. S., & Norton, D. P. (1993). Putting the balanced scorecard to work.
Harvard Business Review, 71(5), 134-147.
Kaplan, R. S., and Norton, D. P. (2004). Strategy Maps. Boston, Massachusetts:
Harvard Business School Publishing.
Kaplan, R. S., & Norton, D. P. (2007). Using the balanced scorecard as a
strategic management system. Harvard Business Review, 85(7/8), 150-161.
Kerssens-van Drongelen, I. (2001). The iterative theory-building process:
Rationale, principles and evaluation. Management Decision, 39(7), 503-512.
Kettinger, W. J., Teng, J. T. C., & Guha, S. (1997). Business process change: A
study of methodologies, techniques, and tools. MIS Quarterly, 21(1), 55-80.
Kiraka, R. N., & Manning, K. (2005). Managing organisations through a process-
based perspective: Its challenges and benefits. Knowledge and Process
Management, 12(4), 288-298.
Kirkham, A. (1996). Mitel Telecom business process reengineering: Notes from
the leading edge. In: C. Armistead & P. Rowlands (Eds.) Managing Business
Processes: BPR and Beyond, 7-20. Chichester: Wiley.
Klein, M. M. (1994). Reengineering methodologies and tools. Information
Systems Management, 11(2), 30-35.
Labovitz, G. and Rosansky, V. (1997). The Power of Alignment. New York, NY:
Wiley.
Law K. S., and Wong, C. (1999). Multidimensional constructs in structural
equation analysis: An illustration using the job perception and job satisfaction
constructs. Journal of Management, 25(2), 143-160.
Lee, A. S. (1989). A scientific methodology for MIS case studies. MIS Quarterly,
13(1), 33-50.
Lee, A. S. (1991). Integrating positivist and interpretive approaches to
organizational research. Organization Science, 2(4), 342-365.

Bibliography
- 12:424 -
Lee, R. G., & Dale, B. G. (1998). Business process management: A review and
evaluation. Business Process Management Journal, 4(3), 214-225.
Leedy, P. D., & Ormrod, J. E. (2001). Practical Research: Planning and Design
(7th ed.). Upper Saddle River, N.J.: Merrill Prentice Hall.
Leonard-Barton, D. (1990). A dual methodology for case studies: Synergistic use
of a longitudinal single site with replicated multiple sites. Organization
Science, 1(3), 248-266.
Leonard-Barton, D. (1992). Core capabilities and core rigidities: A paradox in
managing new product development. Strategic Management Journal,
13(Special Edition), 111-125.
Lesser, S., & McCormack, K. (2004). Bottom-line results through global logistics
structures. Supply Chain Practice, 6(4), 64-76.
Lincoln, Y. S., & Guba, E. G. (1985). Naturalistic Inquiry. Beverly Hills, California:
Sage Publications.
Linn, R. L. & Slinde, J. A. (1977). The determination of the significance of change
between pre- and posttesting periods. Review of Educational Research, 47(1),
121-150.
Llewellyn, N., & Armistead, C. (2000). Business process management: Exploring
social capital within processes. International Journal of Service Industry
Management, 11(3), 225-243.
Loo, R. (2002). The Delphi method: A powerful tool for strategic management.
Policing an International Journal of Police Strategies & Management, 25(4),
762-769.
Lord, F. M. (1963). Elementray models for measuring change. In: Harris, C. W.
(Ed.), Problems in Measuring Change, (pp. 21-38). Madison WI: University of
Wisconsin Press.
Luftman, J. N. (2003). Assessing Strategic Alignment Maturity. In: Luftman, J. N.
(Ed.), Competing in the Information Age: Align in the Sand 2nd Ed., (pp. 15-
48). Oxford, New York: Oxford University Press.
Business Process Management: Progression and Maturity
- 12:425 -
Lynham, S. A. (2000). Theory building in the human resource development
profession. Human Resource Development Quarterly, 11(2), 159-178.
MacCallum, R., & Browne, M. W. (1993). The use of causal indicators in
covariance structure models: Some practical issues. Psychological Bulletin,
114(3), 533-541.
MacKenzie, S. B., Podsakoff, P. M., & Jarvis, C. B. (2005). The problem of
measurement model misspecification in behavioral and organizational
research and some recommended solutions. Journal of Applied Psychology,
90(4), 710-730.
Markus, M. L. & Robey, D. (1988). Information technology and organizational
change: Causal structure in theory and research. Management Science, 34(5),
583-598.
Marsick, V. J. (1990). Altering the paradigm for theory building and research in
human resource development. Human Resource Development Quarterly, 1(1),
5-24.
Martino, J. P. (1972). Technological Forecasting for Decision Making. New York:
American Elsevier Publishing Co.
Maull, R. S., Tranfield, D. R., & Maull, W. (2003). Factors characterizing the
maturity of BPR programmes. International Journal of Operations &
Production Management, 23(6), 596-624.
McCormack, K. (2001). Business process orientation: Do you have it? Quality
Progress, 34(1), 51-59.
McDaniel, T. (2001). Ten pillars of business process management. eAI Journal,
November, 30-34.
McPhee, R. D. (1990). Alternate approaches to integrating longitudinal case
studies. Organization Science, 1(4), 393-405.
Melan, E. H. (1989). Process management: A unifying framework for
improvement. National Productivity, 8(4), 395-406.

Bibliography
- 12:426 -
Meredith, J. (1998). Building operations management theory through case and
field research. Journal of Operations Management, 16(4), 441-454.
Miers, D., & Harmon, P. (2005). The 2005 BPM suites report. Retrieved January
10, 2006, from http://www.bptrends.com.
Miles, M. B., & Huberman, A. M. (1984). Qualitative Data Analysis: A Source
Book of New Methods. Beverly Hills, California: Sage Publications.
Miles, R. E., & Snow, C. C. (1978). Organization, Strategy, Structure and
Process. New York: McGraw-Hill.
Miller, D., & Friesen, P. H. (1982). The longitudinal analysis of organizations: A
methodological perspective. Management Science (pre-1986), 28(9), 1013-
1034.
Mingers, J. (2001). Combining IS research methods: Towards a pluralist
methodology. Information Systems Research, 12(3), 240-259.
Mohr, L. B. (1982). Explaining Organizational Behavior. San Francisco: Jossey-
Bass.
Molden, D., & Symes, J. (1999). Realigning for Change. London: Financial Times
Professional Ltd.
Mulligan, P. (2002). Specification of a capability-based IT classification
framework. Information & Management, 39, 647-658.
Murphy, M. K., Black, N. A., Lamping, D. L., McKee, C. M., Sanderson, C. F. B.,
Askham, J., et al. (1998). Consensus development methods, and their use in
clinical guideline development. Health Technology Assessment, 2(3).
Myers, M. D., & Newman, M. (2007). The qualitative interview in IS research:
Examining the craft. Information and Organization, 17(1), 2-16.
Nambisan, S., Agarwal, R., & Tanniru, M. (1999). Organizational mechanisms for
enhancing user innovation in information technology. MIS Quarterly, 23(3),
365-395.

Business Process Management: Progression and Maturity
- 12:427 -
Newman, M., & Robey, D. (1992). A social process model of user-analyst
relationships. MIS Quarterly, 16(2), 249-266.
Newsted, P. R., Huff, S. L., & Munro, M. C. (1998). Survey instruments in IS. MIS
Quarterly, 22(4), 553-554.
Nickols, F. (1998). The difficult process of identifying processes. Knowledge and
Process Management, 5(1), 14-19.
Nunnally, J. C., & Bernstein, I. H. (1994). Psychometric theory. 3rd edition. New
York: McGraw-Hill.
Okoli, C., & Pawlowski, S. D. (2004). The Delphi method as a research tool: an
example, design considerations and applications. Information & Management,
42(1), 15-29.
Olian, J. D., & Rynes, S. L. (1991). Making total quality work: Aligning
organisational processes, performance measures, and stakeholder. Human
Resource Management, 30(3), 303-333.
Ono, R., & Wedemeyer, D. J. (1994). Assessing the validity of the Delphi
technique. Futures, 26(3), 289-304.
Orlikowski, W. J. (1993). CASE tools as organizational change: Investigating
incremental and radical changes in systems development. MIS Quarterly,
17(3), 309-340.
Orlikowski, W. J., & Baroudi, J. J. (1991). Studying information technology in
organizations: Research approaches and assumptions. Information Systems
Research, 2(1), 1-28.
Parkhe, A. (1993). “Messy” research, methodological predispositions, and theory
development in international joint ventures. The Academy of Management
Review, 18(2), 227-268.
Paulk, M. C., Curtis, B., Chrissis, M. B., & Weber, C. V. (1993). The Capability
Maturity Model for Software, Version 1.1 (No. CMU/SEI-93-TR-24): Software
Engineering Institute.
Bibliography
- 12:428 -
Pettigrew, A. M. (1990). Longitudinal field research on change: Theory and
practice. Organization Science, 1(3), 267-292.
Pinsonneault, A., & Kraemer, K. L. (1993). Survey research methodology in
management information systems: An assessment. Journal of Management
Information Systems, 10(2), 75-105.
Podsakoff, P. M., MacKenzie, S. B., Podsakoff, N. P., & Lee, J. Y. (2003). The
mismeasure of man(agement) and its implications for leadership research.
The Leadership Quarterly, 14(6), 615-656.
Podsakoff, P. M., Shen, W., & Podsakoff, N. P. (2006). The role of formative
measurement models in strategic management research: Review, critique and
implications for future research. Research Methodology in Strategy and
Management, 3, 197-252.
Porter, M. E. (1980). Competitive Strategy: Techniques for Analyzing Industries
and Competitors. New York: Free Press.
Porter, M. E. (1996). What is Strategy? Harvard Business Review, 74(6), 61-78.
Powell, C. (2003). The Delphi technique: myths and realities. Journal of
Advanced Nursing, 41(4), 376-382.
Prahalad, C. K., & Hamel, G. (1990). The core competence of the corporation.
Harvard Business Review, 68(3), 79-91.
Preble, J. F. (1984). The selection of Delphi panels for strategic planning
purposes. Strategic Management Journal, 5(2), 157-170.
Pritchard, J.-P., & Armistead, C. (1999). Business process management -
lessons from European business. Business Process Management Journal,
5(1), 10-32.
Puah K. Y. P., & Tang K. H. N. (2000). Business process management: A
consolidation of BPR and TQM. Proceedings of the IEEE Management of
Innovation and Technology, Singapore, 110-115.

Business Process Management: Progression and Maturity
- 12:429 -
Richards, J. I., & Curran, C. M. (2002). Oracles on "advertising": Searching for a
definition. Journal of Advertising, 31(2), 63-76.
Robinson, S. (1994). Simulation projects: Building the right conceptual model.
Industrial Engineering, 26(9), 43-77.
Rogosa, D. (1988). Myths about longitudinal research. In D. W. Schaie, R. T.
Campbell, W. Meredith, & S. C. Rawlings, (Eds.). Methodological Issues in
Aging Research (pp 171-209). New York: Springer.
Rogosa, D., & Willett, J. B. (1985). Understanding correlates of change by
modelling individual differences in growth. Psychometrika, 50(2), 203-228.
Romanelli, E., & Tushman, M. L. (1994). Organizational transformation as
punctuated equilibrium: An empirical test. Academy of Management Journal,
37(5), 1141-1166.
Rosemann, M., & de Bruin, T. (2004). Application of a holistic model for
determining BPM. Proceedings of the AIM Pre-ICIS Workshop on Process
Management and Information Systems, Washington D.C.
Rosemann, M., & de Bruin, T. (2005). Towards a business process management
maturity model. Proceedings of the 13th European Conference on Information
Systems, Regensburg, 521-532.
Rosemann, M., de Bruin, T., & Hueffner, T. (2004). A model for business
process management maturity. Proceedings of the 15th Australasian Conference
on Information Systems, Hobart.
Rosemann, M., de Bruin, T., & Power, B. (2006). A model to Measure BPM
Maturity and Improve Performance. In J. Jeston & J. Nelis, Business Process
Management: Practical guidelines to successful implementations, (pp. 299-315).
Burlington, Massachusesetts: Butterworth-Heinemann.
Rummler, G., & Brache, A. (1995). Improving Performance. How to Manage the
White Space of the Organisational Chart. San Francisco, CA: Jossey-Bass
Publishers.

Bibliography
- 12:430 -
Sabherwal, R., Hirschheim, R., & Goles, T. (2001). The dynamics of alignment:
Insights from a punctuated equilibrium model. Organization Science, 12(2),
179-197.
Sastry, M. A. (1997). Problems and paradoxes in a model of punctuated
organizational change. Administrative Science Quarterly, 42(2), 237-275.
Schmidt, R. C. (1997). Managing Delphi surveys using nonparametric statistical
techniques. Decision Science, 28(3), 763-774.
Scholl, W., Konig, C., Meyer, B., & Heisig, P. (2004). The future of knowledge
management: An international Delphi study. Journal of Knowledge
Management, 8(2), 19-35.
Seddon, P. B. (1997). A respecification and extension of the DeLone and
McLean model of IS success. Information Systems Research, 8(3), 240-254.
Senge, P.M., Roberts, C., Ross, R.B., Smith, B.J., & Kleiner, A. (1994). The Fifth
Discipline Field Book: Strategies and Tools for Building a Learning
Organisation. New York: Currency Doubleday.
Sinclair, D., & Zairi, M. (1995). Effective process management through
performance measurement. Business Process Re-engineering & Management
Journal, 1(3), 50-65.
Shapiro, C. (1989). The theory of business strategy. The RAND Journal of
Economics, 20(1), 125-137.
Smart, P. A., Childe, S. J., & Maull, R. S. (1998). Supporting business process
reengineering in industry: Towards a methodology. In Gulledge, R. and
Elzinga, J. (Eds.), Process Engineering: Advancing the State-of-the-Art, 283-
317. Boston, MA: Kluwer Academic.
Smith, H., & Fingar, P. (2002). Business Process Management: The Third Wave.
Florida: Meghan Kiffer Pr.
Smith, H., & Fingar, P. (2004). Process management maturity models. Retrieved
February 9, 2006, from http://www.bptrends.com/resources_publications.cfm.

Business Process Management: Progression and Maturity
- 12:431 -
Spanyi, A. (2003). Business Process Management is a Team Sport: Play it to
win! Florida: Meghan Kiffer Pr.
Spanyi, A. (2004). Towards process competence. Retrieved May 26, 2005, from
http://www.bptrends.com/resources _publications.cfm.
Stalk, G., Evans, P., & Shulman, L. E. (1992). Competing on capabilities: The
new rules of corporate strategy. Harvard Business Review, 70(2), 54-66.
Stuart, I., McCutcheon, R. Handfield, R., & McLachlin, D. S. (2002). Effective
case research in operations management: A process perspective. Journal of
Operations Management, 20(5), 419-433.
Sutton, R. I., & Staw, B. M. (1995). What theory is not. Administrative Science
Quarterly, 40(3), 371-384.
Tashakkori, A., & Teddlie, C. (1998). Combining Qualitative and Quantitative
Approaches. Thousand Oaks, CA: Sage Publications, Inc.
Teece, D. J., Pisano, G. & Shuen, A. (1997). Dynamic capabilities and strategic
management. Strategic Management Journal, 18(7), 509-533.
Toracco, R. J. (2002). Research Methods for Theory Building in Applied
Disciplines: A Comparative Analysis. Advances in Developing Human
Resources, 4, 355-376.
Valiris, G., & Glykas, M. (1999). Critical review of existing BPR methodologies:
The need for a holistic approach. Business Process Management Journal,
5(1), 65-86.
van de Ven, A. H. (1989). Nothing is quite so practical as a good theory.
Academy of Management Review, 14(4), 486-489.
van de Ven, A. H., & Delbecq, A. L., (1974). The effectiveness of nominal, Delphi,
and interacting group decision making processes. Academy of Management
Journal, 17(4), 605-621.
van de Ven, A. H., & Huber, G. P. (1990). Longitudinal field research methods for
studying processes of organizational change. Organization Science, 1(3), 213-
219.
Bibliography
- 12:432 -
van de Ven, A. H., & Poole, M. S. (1990). Methods for studying innovation
development in the Minnesota Innovation Research Program. Organization
Science, 1(3), 313-335.
van de Ven, A. H., & Poole, M. S. (1995). Explaining development and change in
organizations. The Academy of Management Review, 20(3), 510-540.
Wacker, J. G. (1998). A definition of theory: Research guidelines for different
theory-building research methods in operations management. Journal of
Operations Management, 16(4), 361-385.
Walsham, G. (1995). Interpretive case studies in IS research: Nature and
method. European Journal of Information Systems, 4(2), 74-81.
Weick, K. E. (1995). What theory is not, theorizing is. Administrative Science
Quarterly, 40(3), 385-390.
Wernerfelt, B. (1984). A resource-based view of the firm. Strategic Management
Journal, 5(2), 171-180.
Whetten, D. A. (1989). What constitutes a theoretical contribution? Academy of
Management Review, 14(4), 490-495.
Woudenberg, F. (1991). An evaluation of Delphi. Technological Forecasting and
Social Change, 40(2), 131-150.
Yin, R. K. (1981). The case study crisis: Some answers. Administrative Science
Quarterly, 26, 58-65.
Yin, R. K. (2003). Case Study Research: Design and Methods (3rd Ed.).
Thousand Oaks, CA: Sage Publications.
Zairi, M. (1997). Business process management: A boundaryless approach to
modern competitiveness. Business Process Management Journal, 3(1), 64-80.
Zairi, M. & Sinclair, D. (1995). Business process re-engineering and process
management. Business Process Re-engineering & Management Journal, 1(1),
8-30.
Zimmerman, D. W. (1994). A note of interpretation of formulas for the reliability of
differences. Journal of Educational Measurement, 31(2), 143-147.
Business Process Management: Progression and Maturity
- 13:433 -
13 Appendices

Business Process Management: Progression and Maturity
- 13:435 -
13.1 Multiple Case Study Supporting Documentation (1)
13.1.1 Invitation to Participate
The BPM Maturity Model
A/Prof. Michael Rosemann
Student: Tonia de Bruin
Visiting Student: Tapio Hueffner
Purpose
The purpose of this document is to provide background on the BPM Maturity
project being undertaken by QUT and to provide context for <COMPANY>‟s
participation in a multi-faceted Case Study.
Background

Appendices
- 13:436 -
<COMPANY> management and QUT researchers have recognised that
Business process management is emerging as an important management
practice, providing organisations with a means of increasing competitiveness and
sustainability in times of market uncertainty, increasing globalisation and
constantly changing business environments and conditions.
Initial investigations undertaken by QUT researchers from July 2003 until now
has shown that, despite the potential benefits to be gained, there are few
organisations that have been able to successfully implement comprehensive
business process management (BPM) practices. A number of studies have
highlighted anomalies in meaning and application of BPM whilst identifying
factors critical to the success of BPM practices together with approaches and
barriers to successful implementation of such practices. These studies however
provide little context for BPM application or assistance to organisations in
understanding how to progress with BPM implementation and improvements.
QUT researchers are working to develop a generic BPM Maturity model that can
be used as a tool within a comprehensive BPM toolkit. The BPM Maturity model
will enable the diagnosis of current BPM maturity stages and enable the
construction and implementation of a BPM Maturity Roadmap, based on current
strengths and weaknesses, for use in progressing to higher BPM Maturity stages.
This will enable organisations to improve their success, in BPM activities and in
attaining BPM benefits.
QUT/<COMPANY> Industry Collaboration
QUT has approached <COMPANY> with a view to advancing research on the
BPM Maturity model that has been developed. In particular, the researchers see
working with an industry partner as an opportunity to:
Assess the BPM Maturity model with regard to its practicality and
significance to organisations that are practicing BPM;
Conduct in-depth discussions with industry practitioners in order to assess
the relevance and appropriateness of each of the Factors within the
model (i.e. IT/IS, Culture, Accountability, Methodology and Performance);

Business Process Management: Progression and Maturity
- 13:437 -
Assess the validity and relevance of research questions that are intended
for use in gathering data via case studies and surveys into BPM maturity;
and
Ensure that the model has a strong practical basis that will provide benefit
to industry practitioners and improve BPM practices both within Australia
and internationally.
The structure of this collaborative partnership will include 4 distinct phases
including:
Initial Meeting
One-on-one Case Study Sessions
Survey Sessions
Final Presentation
Details of each of these phases are provided below.
Initial Meeting
The initial meeting will take approximately 2 hours during which time the
researchers will give a presentation on the work conducted on the BPM Maturity
model thus far. Following the presentation, a short questionnaire will be
completed by <COMPANY> representatives, in conjunction with the researchers.
The purpose of the questionnaire is to enable the researchers to gain a more
detailed understanding of <COMPANY>‟s position and history with respect to
BPM.
<COMPANY> representatives are encouraged to ask questions and provide their
initial opinions of the model at this session.
One-on-one Sessions
Following the initial meeting, one-on-one sessions will be conducted with
<COMPANY> representatives that have been identified as specialists in each of
Appendices
- 13:438 -
the model “Factor” areas. These sessions are likely to be approximately 1.5
hours in duration. Each session will involve the QUT researchers and the
nominated <COMPANY> representative and will focus on the Factor that the
<COMPANY> representative is a specialist in. The aim of these sessions is to
conduct in-depth research into the Factor including investigating: the relevance of
the factor; the appropriateness of the research questions developed thus far; and
to further develop Factor concepts based on the practical experiences of
<COMPANY>. Participants will be provided with a Case Study Worksheet
approximately one week prior to each session to enable preparation for the
session.
The major outcomes from these sessions will be used to improve the BPM
Maturity model concepts and in particular, the questions used to gather data via
the model.
Survey Sessions
Following the one-on-one case study sessions, a survey session will be held with
representatives from <COMPANY>‟s business divisions. In total, two survey
sessions will be conducted – one with Retail and one with Distribution. Each of
these sessions will include the QUT researchers and 1 participant from the
business. The aim of these sessions will be to test the validity and relevance of
the Survey that has been designed. These sessions will cover all 5 Factors.
Whilst the <COMPANY> representative will complete the Survey within these
sessions, the researchers will use this opportunity to discuss the survey
questions. This will be done with a view to assessing: the validity of the
questions; the suitability of the answer scale; the ease of survey completion;
general survey attributes such as the length of the survey and ways in which the
researchers can approach potential survey participants to gain the best possible
completion rate.
The outcome of these sessions will be a rudimentary assessment of
<COMPANY>‟s position within the model as perceived by the two divisional
representatives.

Business Process Management: Progression and Maturity
- 13:439 -
Outcomes
The outcomes from all sessions will be analysed and detailed in a final
presentation to <COMPANY>, expected to take place in May - June 2004. This
will include a rudimentary positioning of <COMPANY> within the model based on
the feedback received throughout the above sessions.


Business Process Management: Progression and Maturity
- 13:441 -
13.1.2 Information Sheet and Informed Consent
– Case Study with Company A –
Information Sheet
Chief Investigators: Ms. Tonia de Bruin (Student, QUT)
Email: [email protected]
Mr. Tapio Hueffner (Visiting Student, QUT)
Email: [email protected]
Project Description
QUT researchers have recognised that business process management is
emerging as an important management practice, providing organisations with a
means of increasing competitiveness and sustainability in times of market
uncertainty, increasing globalisation, and constantly changing business
environments and conditions.
Initial investigations undertaken by QUT researchers from July 2003 until now
has shown that, despite the potential benefits to be gained, there are few
organisations that have been able to successfully implement comprehensive
business process management (BPM) practices. A number of studies have
highlighted anomalies in meaning and application of BPM whilst identifying
factors critical to the success of BPM practices together with approaches and
barriers to successful implementation of such practices. These studies however
provide little context for BPM application or assistance to organisations in
understanding how to progress with BPM implementation and improvements.
QUT researchers are working to develop a generic BPM Maturity model that can
be used as a tool within a comprehensive BPM toolkit. The BPM Maturity model
will enable the diagnosis of current BPM maturity stages and enable the
construction and implementation of a BPM Maturity Roadmap, based on current

Appendices
- 13:442 -
strengths and weaknesses, for use in progressing to higher BPM Maturity stages.
This will enable organisations to improve their success, in BPM activities and in
attaining BPM benefits.
About this phase of the study:
QUT has approached Company A with a view to advancing research on the BPM
Maturity model that has been developed. In particular, the researchers see working
with an industry partner as an opportunity to:
Assess the BPM Maturity model with regard to its practicality and
significance to organisations that are practicing BPM;
Conduct in-depth discussions with industry practitioners in order to
assess the relevance and appropriateness of each of the Factors within
the model (i.e. IT/IS, Culture, Accountability, Methodology and
Performance);
Assess the validity and relevance of research questions that are
intended for use in gathering data via case studies and surveys into
BPM maturity; and
Ensure that the model has a strong practical basis that will provide
benefit to industry practitioners and improve BPM practices both within
Australia and internationally.
The structure of this collaborative partnership will include 4 distinct phases
including:
Initial Meeting
One-on-one Case Study Sessions
Survey Sessions
Final Presentation
The one-on-one sessions are conducted with Company A representatives that
have been identified as specialists in each of the model “Factor” areas. These
sessions are likely to be approximately 1.5 hours in duration. Each session will

Business Process Management: Progression and Maturity
- 13:443 -
involve the QUT researchers and the nominated Company A representative and
will focus on the Factor that the Company A representative is a specialist in. The
aim of these sessions is to conduct in-depth research into the Factor including
investigating: the relevance of the factor; the appropriateness of the research
questions developed thus far; and to further develop Factor concepts based on
the practical experiences of Company A. Participants will be provided with a
Case Study Worksheet approximately one week prior to each session to enable
preparation for the session. The major outcomes from these sessions will be
used to improve the BPM Maturity model concepts and in particular, the
questions used to gather data via the model.
Expected Benefits and Risks
Participation in this study is expected to lead to improvements in the Business
Process Management Maturity Model. Company A will receive first hand results
of the study whilst Company A representatives will receive exposure to current
BPM research and information. The outcomes from all sessions will be collated
and provided to Company A in a final presentation expected to take place in May
– June 2004. This presentation will include a rudimentary positioning of Company
A within the model based on the feedback received throughout the various
sessions. There are no foreseen risks associated with Company A
representative‟s involvement in this study.
Audio Recording of Interviews
With Company A‟s permission, the research team would like to audio record the
interviews for better data capture. Company A may wish not to grant permission
to have the interview with their representatives recorded. This will not impact on
Company A‟s continuing participation in the project. If permission is granted for
the use of audio recording, all audio files will be destroyed once they have been
transcribed.
Confidentiality
All recordings and transcripts from interviews will be kept strictly confidential.
Transcripts will be assigned a sequential number and no names will be entered
Appendices
- 13:444 -
to the study database. Furthermore, no one outside the research team will have
access to the information provided by Company A representatives. In general,
aggregated results will be reported. While, some individual responses may be
reported, no individual will be identified with any of these responses.
Voluntary Participation
Participation in this study is purely voluntary. Company A may wish to withdraw
participation of their representatives at any time, without penalty or judgement.
Questions / further information
If an Company A representative would like to obtain additional information or has
any queries they would like addressed, they can contact the research team
members below:
Feedback
Feedback will be in the form of results of the study given during a presentation to
Company A representatives.
Thank you for Company A‟s interest and support of this project.
Ms Tonia de Bruin
(Chief Investigator / Researcher) Information Systems Management
Centre for IT Innovation Faculty of Information Technology QUT Level 5, 126 Margaret St Brisbane 4000,
Australia Tel: (07) 3864 9475 Fax: (07) 3864 9390
Mobile: 0402 794 866 Email: [email protected]
Mr. Tapio Hueffner
(Chief Investigator / Researcher) Information Systems Management
Centre for IT Innovation Faculty of Information Technology QUT Level 5, 126 Margaret St Brisbane 4000,
Australia Tel: (07) 3864 9475 Fax: (07) 3864 9390
Mobile: 0415 992 235
Email: [email protected]
Dr. Michael Rosemann
(Associate Professor)
Information Systems Management
Centre for IT Innovation Faculty of Information Technology QUT Level 5, 126 Margaret St Brisbane 4000,
Australia Tel: (07) 3864 9473 Fax: (07) 3864 9390
Email: [email protected]
Business Process Management: Progression and Maturity
- 13:445 -
– Case Study with Company A –
Informed Consent Form
Chief Investigators: Ms. Tonia de Bruin (QUT)
Email: [email protected]
Mr. Tapio Hueffner (Visiting Student, QUT)
Email: [email protected]
Statement of consent
By signing below, you are indicating that you (on-behalf of Company A):
have read and understood the information sheet about this project;
have had any questions satisfactorily answered;
understand that any additional questions can be raised with the research team at any point;
understand that Company A is free to withdraw participation of its representatives at any time, without comment or penalty;
(Please tick only one)
agree for Company A representatives to participate in the project.
And grant permission to audio record interviews
But, do not grant permission to audio record any interviews
Name
Signature
Position
Date / /


Business Process Management: Progression and Maturity
- 13:447 -
13.1.3 Interview Guide: Performance
Business Process Management Maturity
Case Study Worksheet
Session: Interview – Performance: Qualitative and quantitative
measurement of performance
Timing: 1.5 hours
Purpose: The purpose of this worksheet is to provide participants with
details of questions and issues that will be addressed during the
interview. This will assist participants in the preparation of
notes and materials (eg sample source documentation) prior to
attending the workshop.
Contact: If you have any questions regarding the content or
requirements of the proposed workshop please contact Tonia
de Bruin on 0402 794 866 or Tapio Hueffner on 0423 168 155.
Questions – Coverage
1. How does the measurement of performance of process and resources assist in aligning BPM with organisational goals and objectives?
2. How is the performance of processes and resources incorporated into the design of BPM?
3. How is the performance of BPM design measured?
4. How is the performance of processes and resources incorporated into the execution of BPM?
5. How is performance of process and resource execution measured?
6. How is performance of processes and resources used in the control of BPM policies and practices?
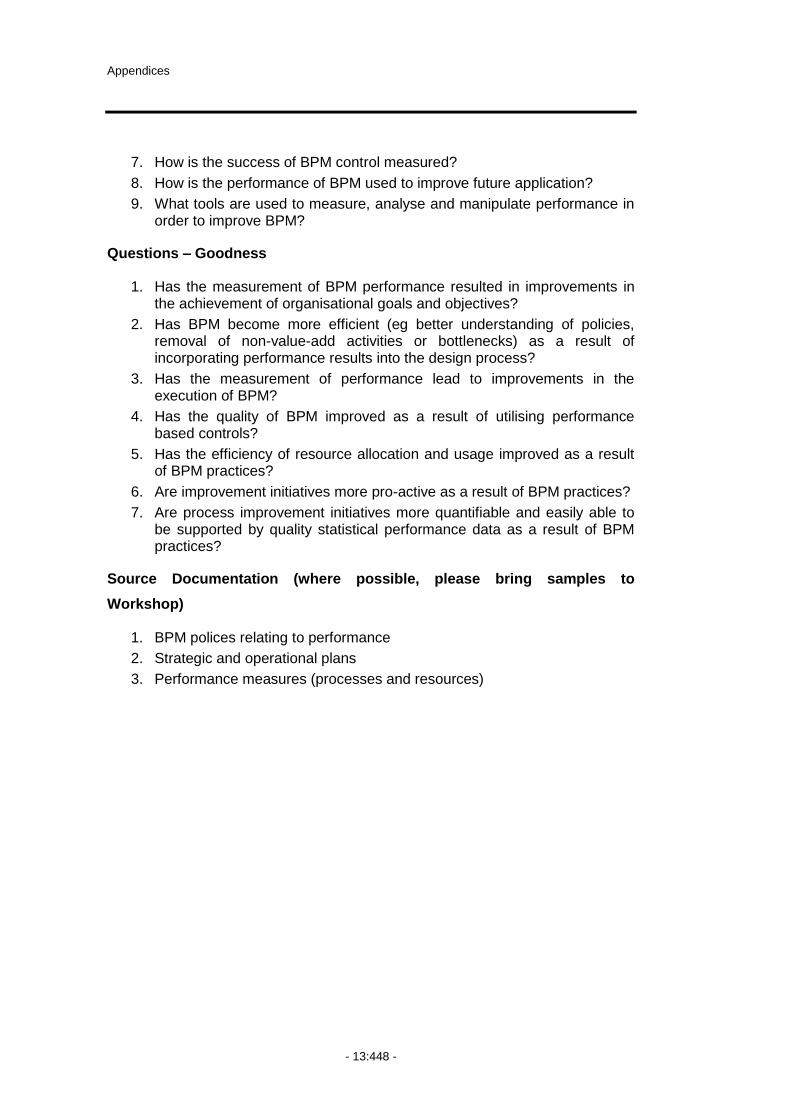
Appendices
- 13:448 -
7. How is the success of BPM control measured?
8. How is the performance of BPM used to improve future application?
9. What tools are used to measure, analyse and manipulate performance in order to improve BPM?
Questions – Goodness
1. Has the measurement of BPM performance resulted in improvements in the achievement of organisational goals and objectives?
2. Has BPM become more efficient (eg better understanding of policies, removal of non-value-add activities or bottlenecks) as a result of incorporating performance results into the design process?
3. Has the measurement of performance lead to improvements in the execution of BPM?
4. Has the quality of BPM improved as a result of utilising performance based controls?
5. Has the efficiency of resource allocation and usage improved as a result of BPM practices?
6. Are improvement initiatives more pro-active as a result of BPM practices?
7. Are process improvement initiatives more quantifiable and easily able to be supported by quality statistical performance data as a result of BPM practices?
Source Documentation (where possible, please bring samples to
Workshop)
1. BPM polices relating to performance
2. Strategic and operational plans
3. Performance measures (processes and resources)
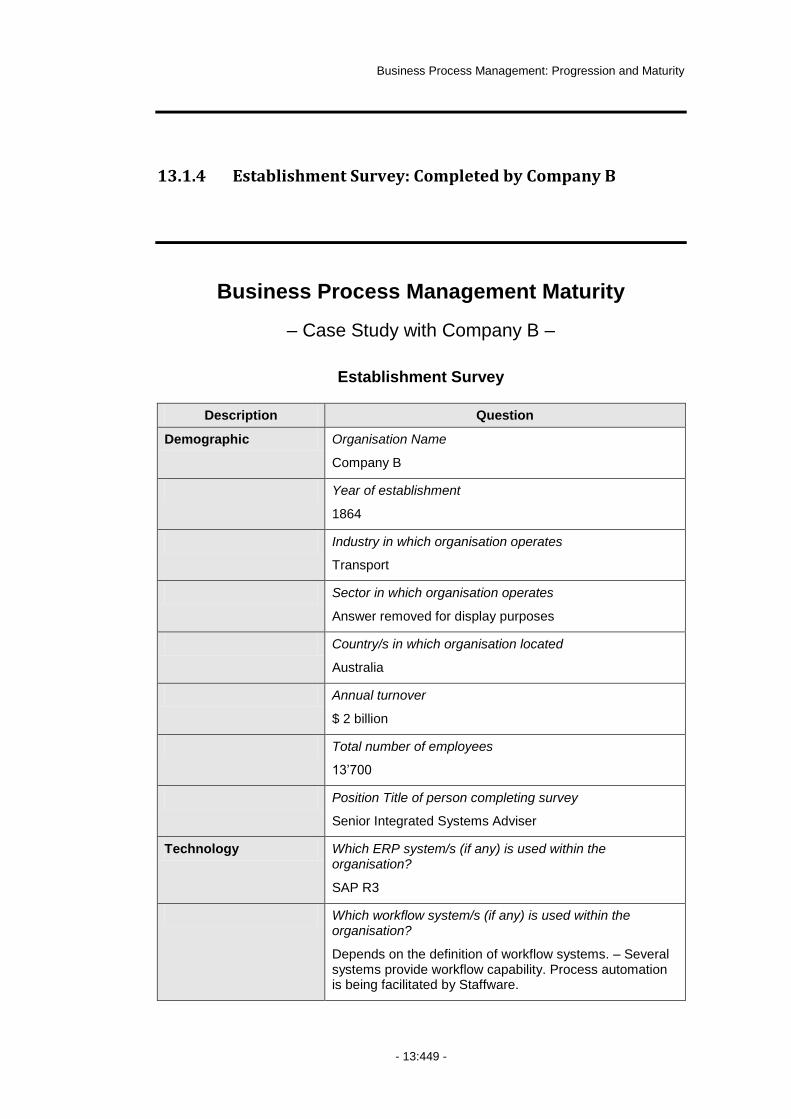
Business Process Management: Progression and Maturity
- 13:449 -
13.1.4 Establishment Survey: Completed by Company B
Business Process Management Maturity
– Case Study with Company B –
Establishment Survey
Description Question
Demographic Organisation Name
Company B
Year of establishment
1864
Industry in which organisation operates
Transport
Sector in which organisation operates
Answer removed for display purposes
Country/s in which organisation located
Australia
Annual turnover
$ 2 billion
Total number of employees
13‟700
Position Title of person completing survey
Senior Integrated Systems Adviser
Technology Which ERP system/s (if any) is used within the organisation?
SAP R3
Which workflow system/s (if any) is used within the organisation?
Depends on the definition of workflow systems. – Several systems provide workflow capability. Process automation is being facilitated by Staffware.
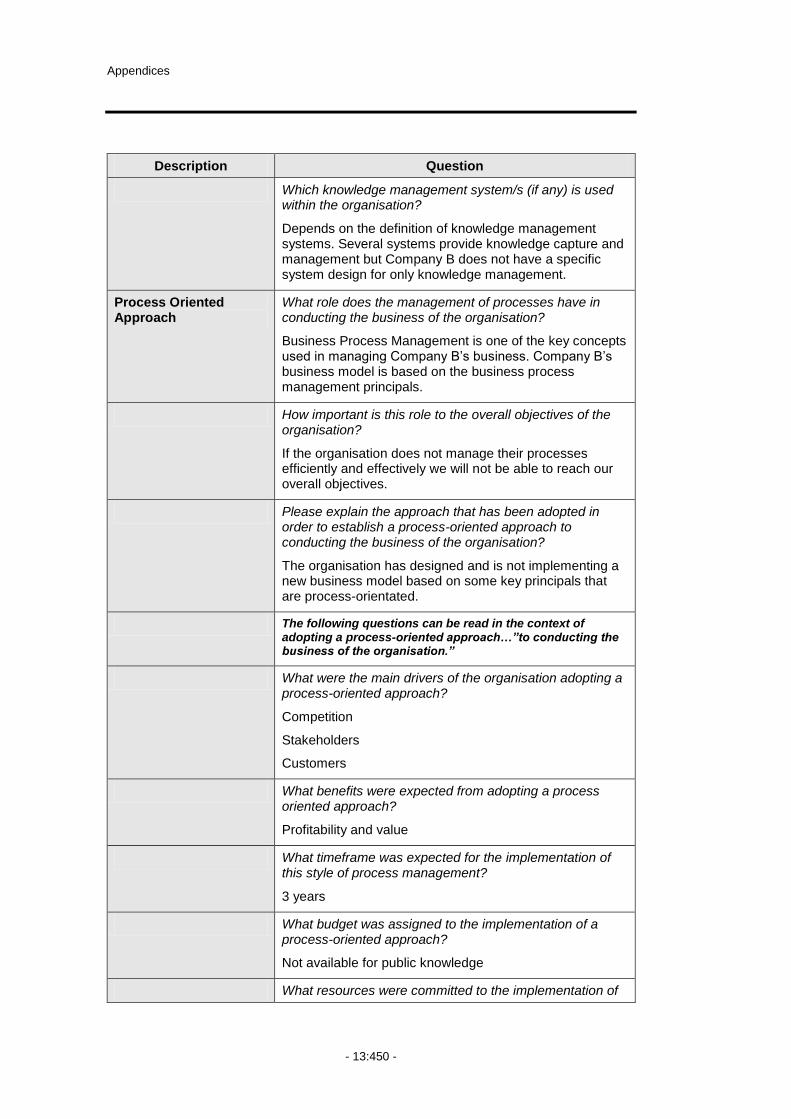
Appendices
- 13:450 -
Description Question
Which knowledge management system/s (if any) is used within the organisation?
Depends on the definition of knowledge management systems. Several systems provide knowledge capture and management but Company B does not have a specific system design for only knowledge management.
Process Oriented Approach
What role does the management of processes have in conducting the business of the organisation?
Business Process Management is one of the key concepts used in managing Company B‟s business. Company B‟s business model is based on the business process management principals.
How important is this role to the overall objectives of the organisation?
If the organisation does not manage their processes efficiently and effectively we will not be able to reach our overall objectives.
Please explain the approach that has been adopted in order to establish a process-oriented approach to conducting the business of the organisation?
The organisation has designed and is not implementing a new business model based on some key principals that are process-orientated.
The following questions can be read in the context of adopting a process-oriented approach…”to conducting the business of the organisation.”
What were the main drivers of the organisation adopting a process-oriented approach?
Competition
Stakeholders
Customers
What benefits were expected from adopting a process oriented approach?
Profitability and value
What timeframe was expected for the implementation of this style of process management?
3 years
What budget was assigned to the implementation of a process-oriented approach?
Not available for public knowledge
What resources were committed to the implementation of
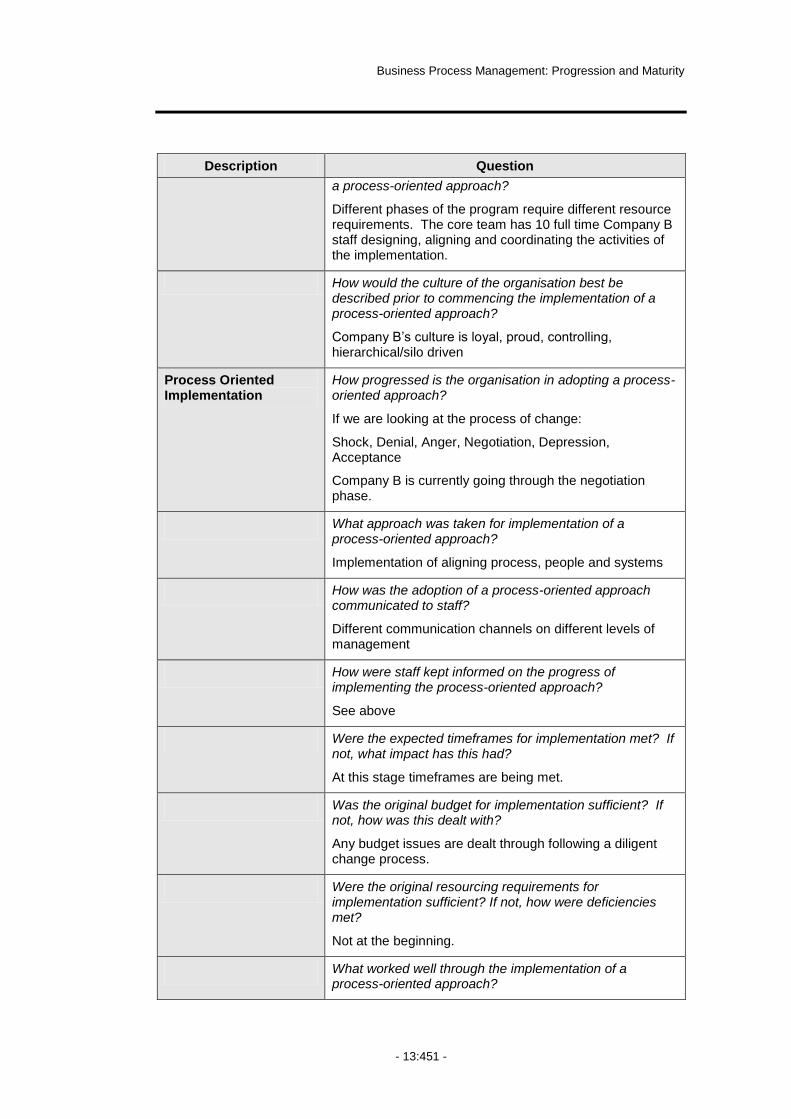
Business Process Management: Progression and Maturity
- 13:451 -
Description Question
a process-oriented approach?
Different phases of the program require different resource requirements. The core team has 10 full time Company B staff designing, aligning and coordinating the activities of the implementation.
How would the culture of the organisation best be described prior to commencing the implementation of a process-oriented approach?
Company B‟s culture is loyal, proud, controlling, hierarchical/silo driven
Process Oriented Implementation
How progressed is the organisation in adopting a process-oriented approach?
If we are looking at the process of change:
Shock, Denial, Anger, Negotiation, Depression, Acceptance
Company B is currently going through the negotiation phase.
What approach was taken for implementation of a process-oriented approach?
Implementation of aligning process, people and systems
How was the adoption of a process-oriented approach communicated to staff?
Different communication channels on different levels of management
How were staff kept informed on the progress of implementing the process-oriented approach?
See above
Were the expected timeframes for implementation met? If not, what impact has this had?
At this stage timeframes are being met.
Was the original budget for implementation sufficient? If not, how was this dealt with?
Any budget issues are dealt through following a diligent change process.
Were the original resourcing requirements for implementation sufficient? If not, how were deficiencies met?
Not at the beginning.
What worked well through the implementation of a process-oriented approach?
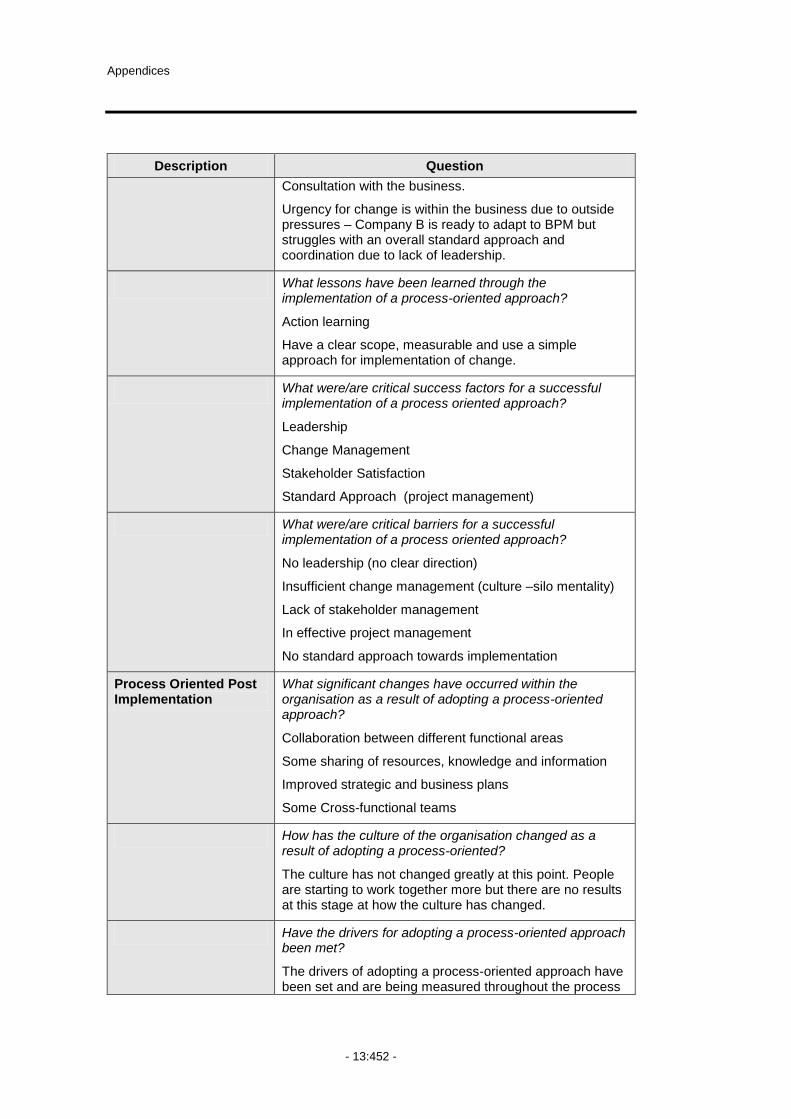
Appendices
- 13:452 -
Description Question
Consultation with the business.
Urgency for change is within the business due to outside pressures – Company B is ready to adapt to BPM but struggles with an overall standard approach and coordination due to lack of leadership.
What lessons have been learned through the implementation of a process-oriented approach?
Action learning
Have a clear scope, measurable and use a simple approach for implementation of change.
What were/are critical success factors for a successful implementation of a process oriented approach?
Leadership
Change Management
Stakeholder Satisfaction
Standard Approach (project management)
What were/are critical barriers for a successful implementation of a process oriented approach?
No leadership (no clear direction)
Insufficient change management (culture –silo mentality)
Lack of stakeholder management
In effective project management
No standard approach towards implementation
Process Oriented Post Implementation
What significant changes have occurred within the organisation as a result of adopting a process-oriented approach?
Collaboration between different functional areas
Some sharing of resources, knowledge and information
Improved strategic and business plans
Some Cross-functional teams
How has the culture of the organisation changed as a result of adopting a process-oriented?
The culture has not changed greatly at this point. People are starting to work together more but there are no results at this stage at how the culture has changed.
Have the drivers for adopting a process-oriented approach been met?
The drivers of adopting a process-oriented approach have been set and are being measured throughout the process

Business Process Management: Progression and Maturity
- 13:453 -
Description Question
which will take approximately 3 years.
If not, which ones and why not?
NA
Have the expected benefits from adopting a process oriented approach been achieved?
As above. We are in the process of implementation.
If not, which ones and why not?
NA
How satisfied is the organisation with the results of adopting a process oriented approach?
At this point stakeholder satisfaction is high but there is still some confusion of how wide the changes are going to be due to moving towards being a process-oriented organisation.
How has this satisfaction been measured?
Surveys, one-on-one sessions, participation, improved leadership etc
Maturity of Process Orientation
How can maturity of a process oriented approach be characterised? How can it be measured?
Achievement of transparent performance information, clear accountability and profitability and value.
What value-proposition can yield a process oriented approach?
Maturity Model What is the main driver to apply a process maturity model?
Staying in business
Stakeholder/Customer Satisfaction
Profitability
What value-proposition can yield a business process maturity model?


Business Process Management: Progression and Maturity
- 13:455 -
13.1.5 Feedback Survey
Business Process Management Maturity
Case Study with Company X
A „factor‟ is defined as a specific, measurable and independent aspect of
management that reflects the fundamental characteristics of BPM. The five
factors that are used in the model are detailed in the following table.
Based on the rating scale where: 1 is Not Important; 3 is Important and 5 is Very
Important please rate each factors with respect to its relevance to the
organisation‟s approach to BPM.
Factor Definition Rating
IT/IS The use of IT/IS resources in the implementation and conduct of BPM practices.
1 2 3 4 5
Culture The acceptance, practice and promotion of BPM by staff within the organisation.
1 2 3 4 5
Accountability The assignment and acceptance of responsibility for BPM practices.
1 2 3 4 5
Methodology The adoption of formal methodologies for use in BPM.
1 2 3 4 5
Performance The measurement of BPM related performance, including activities within individual processes and the performance of process workers.
1 2 3 4 5
A „perspective‟ is defined as a high-level repeatable phase that applies to all
aspects of BPM (including individual processes). In a functional sense, a
perspective may represent an area of expertise or responsibility already existing
within the organisation. The five perspectives used within the model are detailed
in the following table.
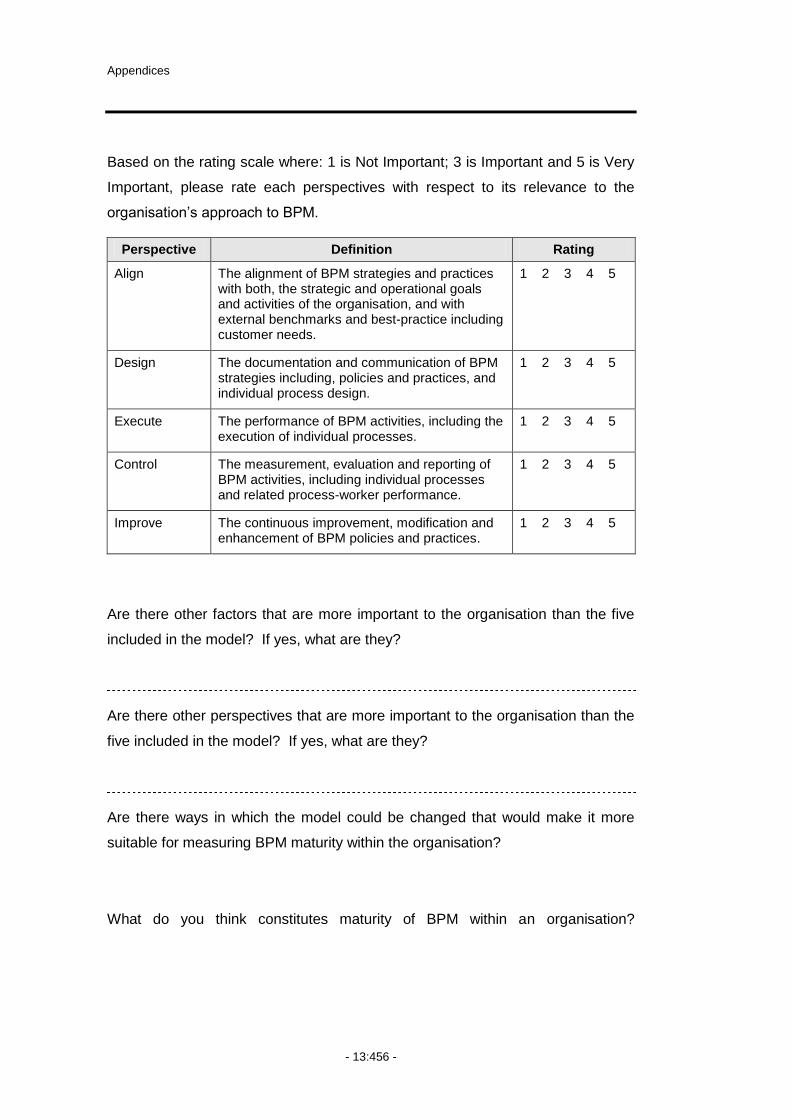
Appendices
- 13:456 -
Based on the rating scale where: 1 is Not Important; 3 is Important and 5 is Very
Important, please rate each perspectives with respect to its relevance to the
organisation‟s approach to BPM.
Perspective Definition Rating
Align The alignment of BPM strategies and practices with both, the strategic and operational goals and activities of the organisation, and with external benchmarks and best-practice including customer needs.
1 2 3 4 5
Design The documentation and communication of BPM strategies including, policies and practices, and individual process design.
1 2 3 4 5
Execute The performance of BPM activities, including the execution of individual processes.
1 2 3 4 5
Control The measurement, evaluation and reporting of BPM activities, including individual processes and related process-worker performance.
1 2 3 4 5
Improve The continuous improvement, modification and enhancement of BPM policies and practices.
1 2 3 4 5
Are there other factors that are more important to the organisation than the five
included in the model? If yes, what are they?
Are there other perspectives that are more important to the organisation than the
five included in the model? If yes, what are they?
Are there ways in which the model could be changed that would make it more
suitable for measuring BPM maturity within the organisation?
What do you think constitutes maturity of BPM within an organisation?

Business Process Management: Progression and Maturity
- 13:457 -
13.1.6 Maturity Survey Questions: Culture Factor
The following block of questions starting with "What percent of…" asks for the percentage of coverage and is based on following scale:
1. 0% to ≤20% 2. 20% to ≤40% 3. 40% to ≤60% 4. 60% to ≤80% 5. 80% to ≤100%
1 2 3 4 5 Not
aware
What percent of core processes are aligned with personnel that support and promote process management practices?
X
What percent of non-core processes are aligned with personnel that support and promote process management practices?
X
What percent of core processes have alignment adversely affected by cultural issues? X
What percent of non-core processes have alignment adversely affected by cultural issues? X
What percent of core processes have been designed by personnel that support and promote process management practices?
X
What percent of non-core processes have been designed by personnel that support and promote process management practices?
X
What percent of core processes have design adversely affected by cultural issues? X
.....

Appendices
- 13:458 -
The following block of questions starting with "What personnel…" asks for the type of personnel involved in activities related to process management practices and is based on following scale:
1. Key personnel 2. Executives & key personnel 3. Executives, management & key personnel 4. Executives, management, employees & key vendors 5. Executives, management, employees & select vendors and customers
1 2 3 4 5 Not
aware
What personnel support and promote the alignment of process management practices? X
What personnel support and promote the alignment of core processes? X
What personnel support and promote the alignment of non-core processes? X
What personnel have process related reward/remuneration programs linked to strategic and operational goals and objectives?
X
What personnel have process related personal performance programs that are aligned with process related goals and objectives?
X
....

Business Process Management: Progression and Maturity
- 13:459 -
The following block of questions starting with "To what extent …" asks for the extent of implementation of process management practices and is based on following scale:
1. Extremely narrow 2. Fairly narrow 3. About half 4. Fairly broad 5. Extremely broad
1 2 3 4 5 Not
aware
To what extent is support and promotion of process management practices displayed by leaders within the organisation?
X
To what extent do leaders of the organisation support the recognition of end-to-end processes?
X
To what extent do process management practices include a customer focus? X
To what extent do process management practices include a supplier focus? X
To what extent are process management practices aligned with strategic and operational goals and objectives?
X
....

Appendices
- 13:460 -
The following block of questions starting with "How regularly…" asks for the regularity of process management practices being conducted and is based on following scale:
1. Ad hoc 2. Annually 3. Semi-annually 4. Monthly 5. Continuously
1 2 3 4 5 Not
aware
How regularly are process related change management programs aligned with organisational strategic and operational goals and objectives?
X
How regularly are process related training programs aligned with organisational strategic and operational goals and objectives?
X
How regularly are process related reward and remuneration programs aligned with organisational strategic and operational goals and objectives?
X
How regularly are personnel aligned with core processes reviewed and assessed? X
How regularly are personnel aligned with non-core processes reviewed and assessed? X
How regularly are details of process related change management programs communicated to staff?
X
How regularly are details of process related training programs communicated to staff? X
.....
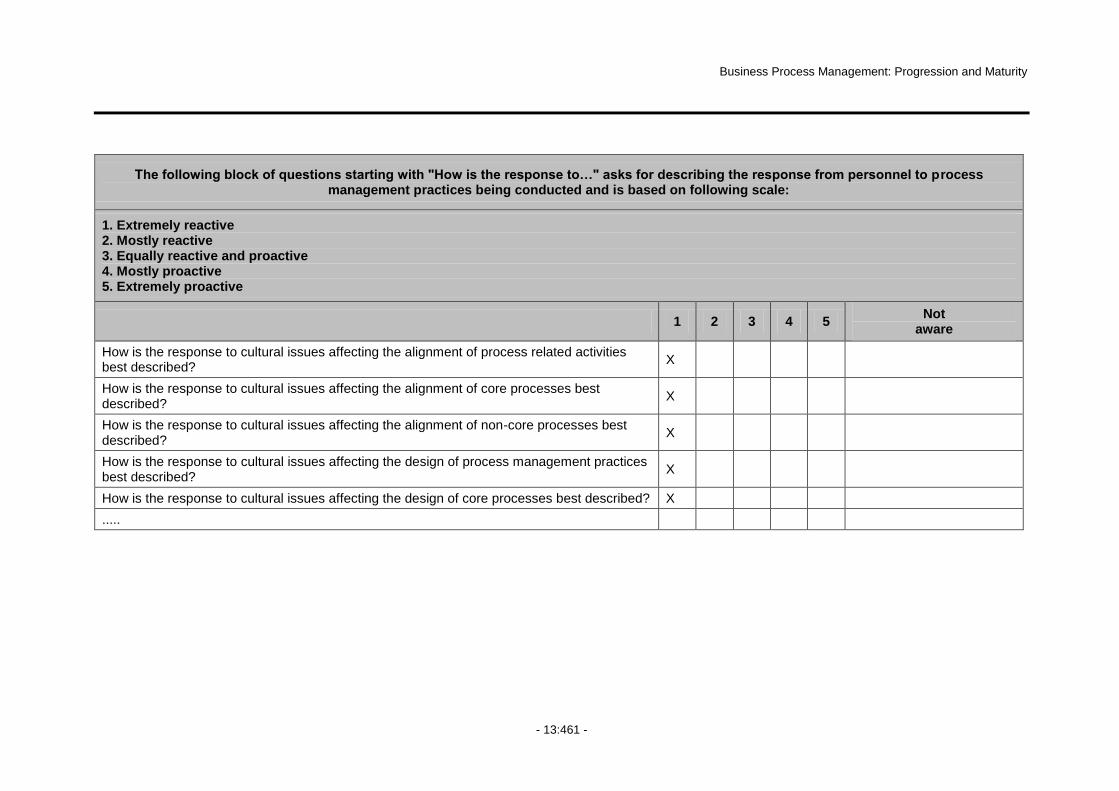
Business Process Management: Progression and Maturity
- 13:461 -
The following block of questions starting with "How is the response to…" asks for describing the response from personnel to process management practices being conducted and is based on following scale:
1. Extremely reactive 2. Mostly reactive 3. Equally reactive and proactive 4. Mostly proactive 5. Extremely proactive
1 2 3 4 5 Not
aware
How is the response to cultural issues affecting the alignment of process related activities best described?
X
How is the response to cultural issues affecting the alignment of core processes best described?
X
How is the response to cultural issues affecting the alignment of non-core processes best described?
X
How is the response to cultural issues affecting the design of process management practices best described?
X
How is the response to cultural issues affecting the design of core processes best described? X
.....

Appendices
- 13:462 -
The following block of questions starting with "How is the suitability..." asks for the suitability of process management practices and is based on following scale:
1. Extremely unsuitable 2. Mostly unsuitable 3. Equally suitable and unsuitable 4. Mostly suitable 5. Extremely suitable
1 2 3 4 5 Not
aware
How is the suitability of cultural tools used in the alignment of process related activities best described?
X
How is the suitability of cultural tools used in the alignment of core processes best described?
X
How is the suitability of cultural tools used in the design of process management practices best described?
X
....

Business Process Management: Progression and Maturity
- 13:463 -
13.1.7 Write up of Interview Notes: Company A
Performance
A perceived problem for Company A was that they “had functional management
combined with end-to-end processes that cut across functions”. The
Procurement-to-Pay process went across four areas. There were no
performance measures for processes although there were KPI‟s and bonuses for
some roles within a process. Senior management performance reviews
incorporate milestones/goals linked to change programs and there was a strong
link between the change management and process areas. For each person
there are KPI‟s “around their section of the process and for accountability for
resources”. The functional boundaries created issues around “hand-over points”.
At a corporate level key result areas e.g. operational excellence, used network
service level agreements (SLA‟s) and customer SLA‟s to cascade through the
lower levels of the organisation. The concept was similar to balanced score card
and thus linked to stakeholders rather than core processes. Common means of
monitoring performance included “external stakeholder needs analysis,
benchmarking with peers and business (e.g. with manager each 6 months and
other staff annually) and feedback sessions”. Customer service surveys (internal
and external) gather information and feed it back into the process. Internal
surveys are annual and external surveys are quarterly. Some areas had
“escalation processes in place” for unacceptable performance. For major
process redesign projects, post audit reviews were undertaken. The focus of
most projects was on standardisation with limited attention paid to value-add.
Going forward there was an expectation that “benefits needed to be delivered”.
Performance did not play a major role in process design although areas of
strength and weakness helped target areas of improvement within a process. In
particular, people looked for “improvement in outputs from a process”. Company
A was at a point where core processes were standardised and they were looking
Appendices
- 13:464 -
at which processes to improve and how to prioritise improvements. The
perceived level of importance helped prioritise process improvement projects, if
“just continual improvement” then it was part of “normal operations not at a
corporate level”.
It was felt that there were “an inordinate number of policies and practices” being
used to control processes. There are 3700 written and available on the intranet
and “some have 7 doing the same thing”. There was a view that “the pendulum
had swung too far” and if a process is seen to fail or is not performing well, a
detailed procedure is being written to micro manage the process. There are
policies and procedures that are easy to follow with success measured through
feedback from managers and staff. Despite attempts to measure progress, they
“don‟t do anything about it” once the measures are captured. Other
measurement mechanisms include staff feedback using normal management
lines, forums conducted by business units and two senior business forums,
employee surveys and customer surveys.
There is a planning process to go through feedback and align it with opportunities
and resources (human, financial and capability) in order to prioritise it with future
needs. The current business process model feeds into this and indicates known
issues with process X. Despite this, “measurement is on the functional
components of the process rather than the process itself”.
There is strong use of benchmarking against financial, operational performance
(e.g. time to connect in call centres network performance) and corporate
capability (e.g. number of support staff per workforce). Other measures include
number of outages, duration of outages, maintenance and surveying customers
for satisfaction with sub-processes. There was a feeling that these measures did
not result in efficient or effective processes due, in part, to external influences
where independent reviews by external bodies lead to revenue adjustment. An
independent regulator, reviews Distribution and sets prices, then measures
against different measures. In Retail, the Office of Energy benchmarks customer
services and cost to set prices.
Both areas of the business (i.e. Distribution and Retail) were effectively monopoly

Business Process Management: Progression and Maturity
- 13:465 -
(or non-competitive) businesses. For example:
Generation (of electricity) is largely government owned.
Transmission (of energy) is through a separate government owned
company.
Distribution (i.e. Poles and Wires) is through only two companies
(including Company A).
Retail is only contestable in the market of more than 200 megawatts per
hour in south-east Queensland, New South Wales and Victoria and there
are only 4 companies operating in this market (including Company A).
All customers are effectively government voters.
A focus on BPM was having a positive effect on achieving goals and objectives.
When Company A first formed, it had 6 ways of doing asset management,
ranging from reasonable systems to no systems. They did not know how many
poles, where they were or what condition they were in. Now they do 70 tests
using palm pilots to record the information and use satellite tracking to locate
them. They have identified approximately 70 thousand defective poles (out of 1
million). This has led to the identification of significant risk and the potential for
litigation issues should anything go wrong with the defective poles. A
subsequent defect identification program then led to finding all the defects and
fixing them during a 6- month period and setting in place a new process (i.e.
AIDM – Asset Inspection and Defect Management process) for identifying future
defects in line with statutory requirements. This has led to a significant change in
culture.
Early emphasis has been on stamping out fires and whilst there has been
process improvement in some areas, it is not so much in the policies and
procedures areas. The “bureaucratic nature of the organisation has lead to a
(too heavy) focus on risk management and not on process efficiency”. There is
still a need to look at priorities and plan these in the future, working in with the
risk management perspective. In Retail there is a contract with the customer for

Appendices
- 13:466 -
a per hour rate for each megawatt. Standard electricity prices can be $27 or $28
per hour, per megawatt, but the price can move markedly. At any point, there is
no knowledge of what electricity demand is going to be for a customer. Consider
the difference in a dragline - if a dragline needs to walk it will cause a power
surge – or if it does not walk, it does not use power. This can lead to a significant
mismatch between usage and pricing dependent upon whether the dragline
walks or not. Therefore, Company A uses hedging and contracting to cover price
movements. In fact, it is a world leader in processes around forecasting, hedging
and contracting.
There has been an improvement from using BPM controls. Although there is a
feeling that Company A needs to get to measuring the process itself rather than
just measuring the outcomes. Advantages of a process focus have been both
“cost reduction and resource allocation” although a lot of this comes down to the
maturity of the processes and the level of improvement possible within them.
The age of the electricity network (i.e. met the needs of 20-30 years ago) is like
to lead to enormous upcoming maintenance where capital expenditure is coming
up but financial and human resources are limited so efficiency and effectiveness
of future operations is critical. Furthermore, the quality of supply and its
consistency is important as surges/spurts also cause problems. The focus has
been on “getting capability, but this needs to move on to improving capability”.
In the beginning, the focus was very top-down but over time it is becoming more
bottom-up with more change initiatives being driven by the process workers.
There is a desire to move towards improving on the use of KPI‟s and linking to
performance of process. There is increased use of technology to improve
processes however some systems are still just “band-aids”. To improve the
process there is a need to improve the management of information around the
process. Advancement in this area has been in the move to link funding for
projects to articulation of the benefits and explicit statements on measures.
Accountability
Company A recognises various levels of accountability with the company seen to
be “autocratic and bureaucratic”, although there was a view that the new CEO
Business Process Management: Progression and Maturity
- 13:467 -
was looking to devolve this. The new CEO has been able to look across the
high-level goals and objectives and was reportedly “not happy with the
outcomes”. There is a perceived “lack of understand and poor reaction” to the
need for accepting accountability and the company falls short of “doing anything
about it”. The two business areas of Company A were (1) Distribution and (2)
Retail. In retail where there is a real commercial need to deliver something (such
as in the distribution or retail areas) “things are a bit better but again it comes
back to the maturity of the organisation”.
There is some linkage between accountability and organisational goals and
objectives at a CEO and senior executive level although this is at a strategic
rather than an operational level. Furthermore, this happens on a functional and
not a process basis, with lower levels done on a procedural basis within
functions. For example, L1-4 managers (i.e. direct reports to the CEO) have
process based Performance Agreements although the “entire process is not done
satisfactorily”. Other than with finance processes, there is little accountability for
processes at lower levels. Within finance processes accountabilities are well
defined but at an operational and not a strategic level.
The business planning process for determining strategic values was “quite
strong”. Although there was a feeling that the way this is subsequently devolved
through the organisation was not so and that “it becomes operationalised too
early”. One of the strategies is to get into the Top 5 companies in Queensland
and the Top 100 companies in Australia but senior managers need to break this
down and make it happen. Similarly, a review by the CEO had led to the
identification of 3 processes that were seen to take too much time and resources
being: contractors, recruitment and selection and cultural issues. This provided
senior management with the strategic direction but it was up to the business
managers to define how to do this. The perceived problem is that “people at the
bottom end don‟t know what the deliverables are or who are accountable for the
outcomes”. A possible exception was the call-centre where all technicians‟
record, measure and relate performance to defined outcomes.
To assign accountability, Company A has a process whereby key deliverables /
key result areas (i.e. what we are doing strategically and how it is to be done) are

Appendices
- 13:468 -
pushed down from the top. All managers have key deliverables tied back to
these although few are process based. Despite this, Company A does not
recognise accountability in many process areas with “managers focused on
managing the budget and not the 25 processes that sit underneath this”. At
lower levels, there is only functionally based accountability and there is “no
motivation to perform well”. The feeling was that senior-levels were almost there,
as expressed by the comment: “The Performance Agreements with L1-4
managers seem to be almost right, we haven‟t been doing it long but it seems to
be working soundly. Although these can have up to 25 key deliverables, best
practice indicates they should have 5-6 so they are defeated before they start”.
Whilst there is so much detail being included in the Performance Agreements it is
felt that at lower levels this will be an issue due to the inability to prioritise
between key deliverables due to a tendency to think that they are all important.
There is the view that “because Company A is only 5-6 years old it does not do
this well and that is a sign of low level of maturity of the company”. The company
was looking more at the balanced score card approach and the ability to link
reward and remuneration on this basis. In designing accountability there is a
feeling that “less is better than more” and a “need to establish and train in
KRA‟s”.
Accountability for the performance of processes is through negotiation. Formal
(12 months) and informal (6 months) reviews include analysis and reports.
Projects are separate and are reviews are against project deliverables. If a non-
award person, good performance possibly links to reward and bonus schemes114.
If an award person, performance links to an Enterprise Bargaining Agreement
(EBA) that incorporates automatic pay increases.
There is the view that “there is a blameless society so people do not accept
responsibility is something goes belly-up”. Even when accountability is assigned,
the company does not “hold people accountable”. This is evident in views such
114
In Australia use of the terms “non-award” and “award” is in relation to working conditions of employees. Those covered by an industrial agreement are “award” employees and those not covered by an agreement are “non-award”. Further details on the distinction between award and non-award can be found at: http://www.wageline.qld.gov.au/nonaward/index.html.
Business Process Management: Progression and Maturity
- 13:469 -
as “this is the way things are done so don‟t rock the boat”. There was also an
element of rejection with people “holding on to old values as they did not see that
they were failing”. There was a view that this had resulted in greater resistance
to changes in accountability as people are “too frightened to make decisions or
do something, with lots of arse covering to ensure nobody is at fault”. An
example of this was in the project to improve the appointment of contractors and
expert consultants. The project took 18 months – 2 years to complete and now
there is a process that is so well documented it is too unwieldy to use. This was
because people were so afraid to make decisions and accept accountability that
they developed a process that would never get them in trouble but that is
completely unworkable.
The role of the CEO and leadership was evident in the view that “accountability
needs to be driven from the top”. Similarly, the execution of BPM has failed in
many instances because it is “a product of the culture and the environment” and
the affect of these needs to be considered. To support this notion, an example of
the retail division was given whereby this area was seen to “be much more black
and white, more measurable, less open to variables such as climate, disasters,
and geographic spread, less unionised, newer with less history and more
commercially driven”.
Methodologies
Company A uses a combination of internal and external methods. At the highest
level, many methodologies are custom designed, such as the Process
Management Manual that is available to all staff via the intranet. A legacy from
the merger of the six old businesses is a focus on jobs and functional issues not
processes. Consequently, although a Process and Quality Strategy exists
although it is 3 years since the last update. There is a loose version of the
balanced score card approach is used, although there is no direct link between
strategic planning and process, it is more indirect. A transitional period is
commencing where Company A is looking at two stages “now” and “what may
be”. Work has commenced on a new process framework although this needs
“buy-in”. This framework incorporates a process model constructed from other
industry reference models and Accenture‟s model for the industry. In total, there
Appendices
- 13:470 -
are 25 identified enterprise processes with seven partially documented and three
completely documented. Some processes need to be compliant with ISO9000
and have already implemented a quality view of process. Other methods used
include benchmarking (e.g. UMS utilities benchmarking) and customer surveys
once a year to assess progress.
The design of processes utilises 4TQ software and its supporting
methodologies115. There is both centralised and decentralised use of
methodologies as anyone can design and model processes. There are process
analysts in most business units that support BPM. Analysts can be either
internal or external to the organisation. Historically multiple methodologies were
used to model processes, based on the experience and skills of the analyst. The
present use of the intranet as a single point of process documentation has seen
the introduction of controls around the published process documentation.
Projects now drive the identification and modelling of processes. Requests come
from the business (i.e. middle management) and subject matter experts come
together to design the process. It is more difficult to design processes that are
outside projects. The core process team provides training in the methodologies.
There are no recognised process improvement methodologies in use although
this is marked for inclusion in the next stage. Company A is considering the use
of the Australian Business Awards Framework allowing business areas to decide
independently on whether or not to adopt116. Innovation methodologies have
been trialled but these “did not get off the ground” and there is a feeling that the
“environment needs to conducive to them before they are introduced”.
Methodologies for change management are formalised through the corporate
culture area making process people more closely aligned with this area.
Historically there has not been much consultation and a lot of informal
communication surrounding methodologies for controlling BPM. There is now a
Business Unit Working Group consisting of the process managers. This is a
115
4TQ is business process management software provided by Axion. Further details about 4TQ can be found at: http://www.axioninnovations.com.au/.
116 The ABEF is now known as the Business Excellence Framework. Further details about the BEF
can be found at : http://www.saiglobal.com/Improve/ExcellenceModels/Business ExcellenceFramework /default.htm.
Business Process Management: Progression and Maturity
- 13:471 -
formal network responsible for “updates, the quality of content, the new process
framework and any interface agreement”. This group is “quite supportive” and
with the passage of time, people are beginning to see the value of process
material.
Company A have a federated model with a centralised process team and
decentralised business areas that have a stake in the outcomes. Consequently,
the core BPM team does not have any authority for mandating the use of
methodologies. The use of a Quality Manager was seen as a “bad thing as
people view BPM as being their responsibility”. The team does have a training
arm and has developed manuals in process documents. This team does not
usually do formal audits but have done one. This audit indicated that there was
“some level of understanding of process”. The problem was though that “only 20
processes use process in a holistic sense and for other others, procedure equals
process or workflow equals process”. The new process model that is being used
to guide future process development includes 4 levels: Level 1 – Process, Level
2 – Sub Process, Level 3 – Activities and Level 4 – Tasks, Procedures and Work
Instructions.
The environment has influenced the effectiveness of methodologies. Although
the CEO is “quite process oriented” coming from a process re-engineering
background, it is felt that his laissez-faire view resulted in his high-level view not
flowing through to practice. The affect of personality and leadership was raised
and whilst the process side was viewed as “relatively straight-forward and the
soft bit such as negotiation and compromise is the hard bit”. The view was that
“difference styles of people resulted in a sub-optimal approach” and furthermore,
“that success factors were skewed to top level support having knowledge and
doing something”.
Information Technology / Information Systems
Company A used a Statement of Corporate Intent to set budget factors through a
rigorous, six-month planning cycle. This incorporated a Programs of Work that
used matrix and evaluation options to approve funding for various projects. A
Change Program looked at projects implementing solutions and including cultural
Appendices
- 13:472 -
change and a Line Program looked at projects to maintain existing IT facilities. Of
the projects included in the Program of Works it was stated, “only 50% of projects
actually happen”. The Program of Works provides direction for the IT budgets
and planning. When aligning IT with process requirements, there was some
thought that “this doesn‟t really happen”. Further evidence of a lack of alignment
was evident in comments concerning the allocation of resources and funds that
“didn‟t need to be improved as money is not a constraint and if there is a
legitimate use for it”. Despite this resourcing projects that affect (defined)
processes was “based on the availability of resource rather than the person that
owns the end process resulting in a mismatch between requirements”.
There is an apparent disconnect between process and function within Company
A with reports that “at a high level they are talking process but the low level is
thinking function” and that “processes still live in silos”. Despite this, Company A
uses System Enterprise Architecture documentation to maintain the relationship
between process and function, going so far as to internally develop procedures
for ensuring people maintain the spreadsheet that maps relationship diagrams.
There was little integration with other stakeholders within the supply chain
although Company A was “looking to implement a new system to deal with this
soon”. An internet based sales point was available although this was “not
integrated and requires manual intervention to get onto the internal sales
system”. Company A used an Oracle Financials and Logistics system to
integrate financial processes117.
Processes were modelled using flow charts and input-output processes within a
product called 4TQ115. There was little control over the use of the 4TQ software
with access given to “those who want to use it”. It was felt that the product was
“fairly user friendly” although there were moves to consider a replacement
software as the company was “thinking about new software like ARIS”118. The
use of IT/IS in process design was seen as positive. An example provided was
117
Oracle provides software for industry-specific processes. Further details about Oracle financial software can be found at: http://www.oracle.com/applications/financials/intro.html.
118 ARIS is a business process management software provided by IDS-Scheer. Further details
about ARIS can be found at: http://www.ids-scheer.com/en/Software/ARIS_Software/3730.html.
Business Process Management: Progression and Maturity
- 13:473 -
the release of a new “Contractors and Consultancy Process” that acted to merge
6 processes into 1. The ability to search process documentation and models and
to see the level of duplication evident had resulted in an increased awareness of
duplication and the need to streamline.
There was a level of in-house development and use of externally supplied IT and
IS with over 1000 systems and more than 800 desktop applications used within
Company A. Despite the significance of IT to the operations of the business, the
view was that systems were “largely disjointed”. There were plans to “look at
integration through a new ERP as opposed to a best of breed system” and that
this would encapsulate about “50% of existing systems”. There was a view that
“processes were not looked at deeply enough and that improvement projects do
not incorporate the needs of all business areas”. An example given was that of
automated timesheets which were believed to have become “less efficient”
although changes to the travel process were perceived more positively. Despite
this, there were success stories perceived as helping future process-automation
efforts. The implementation of an automated pole inspection process within SAP
saw the replacement of a manual system of asset identification used to inspect
poles, for example.
The intranet plays a major role in the control of BPM policies and procedures
within Company A. Everyone has access to it and a dedicated process
management site (i.e. Process Zone) provides access to “current, authorised
process documentation”. In an attempt to control individual use, Company A
uses a Systems Agreement signed by all staff to agree the manner in which they
will operate. A number of process automation activities have resulted in on-line
forms becoming available to staff through Process Zone (e.g. there is one for
Travel but not yet for Leave). Company A has implemented an authorisation
process to control process models and documentation available to staff through
Process Zone with the approval name put on all documentation. The Process
Group Publication Controls document details this process. Company A can see
a “need for IT/IS to be used in the control of high impact processes”.
Mostly Company A uses e-mail functionality as a means of improving BPM. In
particular, people use e-mail to solicit feedback from “SLA meetings, agreements
Appendices
- 13:474 -
and the help desk”. IT/IS is used to improve process documentation as the
intranet site provides access to one source of process documentation. From
here, individuals can “search the system for a process, find out the process
owner, download and change the documentation or model and submit revisions
for update”. Process Zone provides access to details of recognised roles of
“Process Owner”, “System Owner” and a “Business Process Document Co-
ordinator”. Another example of where IT/IS had improved process management
included the implementation of a customer management system to respond to
customer calls. During this project, the “accuracy of addresses was improved by
80% making roll-out far more effective”.
Despite the clear affect of IT/IS on various aspects of BPM, BPM is not seen to
be a vehicle for improving IT/IS functionality, as reflected in the comment “I don‟t
think that it is thought through that way” when asked if the suitability of IT/IS had
improved because of BPM. Similarly, people did not see BPM as having
improved relationships between IT and the business. It was felt that people
within the IT area “don‟t understand what is being pushed from the process area”
and that while there is “lip service” and “agreement on the surface” they choose
to “resist in strange ways” with people not “living it day to day”.
Culture
Company A had aligned BPM with the strategic vision of the organisation
although there was continuing debate around the separation of process and
function. Company A was functionally structured and there were no plans at this
stage to change this. It was felt that as the “industry was functionally based it
made sense to leave it this way to enable benchmarking”. Despite this, the
existence of functional boundaries was contributing to the “degree of duplication”
and to “low levels of trust between functions”.
The culture of the Company A was seen to impact on BPM in 3 ways, expressed
as “opposition, avoidance and conventional”. Opposition was “doing their own
thing and not accepting new guidelines”. Avoidance was expressed as “a sense
of, it‟s just going to change so don‟t worry about it”. Conventional as “following
policy, process and procedure i.e. I was just following policy, with no acceptance

Business Process Management: Progression and Maturity
- 13:475 -
of responsibility”. Similarly, there were comments about the affect of personality
types on the acceptance of BPM. Company A was described as being
“engineering and technical” with people being “questioning, challenging and
critical”, for example. Company A was looking to psychological principles of
acceptance and responsibility and looking to introduce change management,
coaching and mapping leader profiles to change the impact of these. There was
a view that “when change management was done well” people were increasingly
positive about process but “when change management not done well” it was not
so good.
There was a high reliance on governance and a tendency to “overcompensate
through the use of rules and policies” making for a rules-based organisation.
Over 3200 documents included details of processes ranging from process
through to procedural. It was felt that many people within Company A
“misinterpret process and think of it as a procedure”. An internal review of
delegation levels had found that people felt restricted by the rule driven culture.
By building awareness of the current culture and thinking about where the
organisation wanted to go with process management Company A was
experiencing a bottom-up, groundswell of support from people being too
restricted to be able to do their jobs. Further evidence of this was in the lack of
discussion during the first 12-18 months of the BPM Initiative whereas, BPM was
now a key topic of discussion and “people were fighting back”. Compounding the
rules-based view of Company A was the view that the unionised environment led
to “one-way to do things”. This authoritative approach resulted in a “chicken and
egg” situation. Rather than a “constructive-consulting” approach between
Company A and the unions, there was the use of a “blame-allocation” approach.
It was felt that the only way to resolve such issues was by leadership.
There was no clear way of making decisions about BPM policies and practices
within Company A – rather the described approach was to “stick a finger in the
air” and largely “driven out of projects”. A principle driver of BPM was the lack of
co-ordination and high disparity between projects and an aim to try and “bring
things together”. A contributing factor to this was the high use of consultants and
contractors that had a penchant for “doing things their own way”. Consequently,
there was no clear path for becoming involved in process-based projects with

Appendices
- 13:476 -
resourcing sometimes based on expertise and sometimes relying on an invitation
to join a project. To some extent, “the importance of project and the need to
have a pool of process resources utilised somewhere” affected this decision.
Communication about process within Company A was a perceived issue with the
feeling that they were “better at target audiences and not so good at internal
consulting”. There were communication up-dates such as monthly emails
detailing the work underway on process/procedures. Despite this, there was the
feeling that view was on the end gain and that people were not really listening to
the communications resulting in a lot of micro variation evident at lower levels.
The ambiguity of BPM was an issue with senior managers reportedly taking up to
2 years to come to terms with the concept. Similarly, within Company A there
was a realisation about the affect of “the behaviour, beliefs and mind-sets of
organisations” and an awareness of both the “social pressure” and the
“socialisation impact” of BPM. Educating about BPM in order to “build
knowledge” was critical within Company A. There was a view that they “did quite
well at training”, that “dealing with change and communication was improving”
and that “reward and remuneration was in its infancy”. The continuing low
acceptance of process was evident in “low levels of innovation with this not being
a natural reaction to the operation” although it was believed there was “growing
understanding of its importance”.
Business Process Management: Progression and Maturity
- 13:477 -
13.2 Delphi Study Supporting Documentation
13.2.1 Email Invitation Sent to Prospective Participants
Dear All
At our last BPM Meeting facilitated by Brad, it was agreed that a series of Delphi
studies was the most appropriate way of progressing Level 2 of the BPM
Capability Model. This process will enable experts to provide responses to set
questions via email. Responses are only sent to the Delphi Study Coordinator
(Tonia) to ensure open and equal opportunity for all participants. The
Codification Team consolidates all responses and returns codified results to the
wider group for consensus. In order for the Delphi Studies to be effective strict
timeframes must be adhered to. All non-responses within the required
timeframes will be removed from further participation.
To ensure the Model captures our broad spectrum of expertise we are now
seeking your active contribution and consensus between all participants. As
such, this email serves as your invitation to participate in the proposed Studies.
Attached is a brief word document that provides further details including:
Page 1: Background and Methodology
Page 2: Timeframe and Schedule
Page 3: Questions and Responses
Page 4: Participation Questionnaire
Page 5: Contact Details
If you are interested in participating in any of these studies we would ask that, by
the end of this week, you complete and return the Participation Questionnaire on
Page 4 and, if required, update your contact details shown on Page 5.
If you are not interested in participating in these studies we would ask that you
advise by reply email so that your name is removed from future correspondence.
If you have any questions regarding the Delphi Studies please contact me.


Business Process Management: Progression and Maturity
- 13:479 -
13.2.2 Proposal Sent to Prospective Participants
BPMM Model - Delphi Study
Background
As members of the BPM Maturity group we have been meeting over the past six
months to progress a model that will enable the assessment of BPM Maturity
within organisations. The aim of this group was to develop a model that met the
needs of varying audiences and stakeholders with respect to assessing BPM
Maturity. To this end the model has been developed on 3 levels represented by
varying levels of granularity.
Level 1 of the model included the identification of 6 BPM critical success factors:
Strategic Alignment, Governance, Method, IT/IS, People and Culture. This level
was derived primarily from an extensive literature review, supported by
application in case studies and surveys and limited individual involvement.
Level 2 of the model is to include identification of BPM capability areas within
each of these factors together with formalising the definition of each factor. To
ensure the model encapsulates a broad representation of BPM capabilities, a
more expansive and inclusive approach to development is proposed for Level 2.
This approach will leverage the expertise available within the group in a more
rigorous and controlled environment. The result of this approach will be a
comprehensive and supportable level within the model that incorporates the
expertise of participants.
Level 3 of the model is to include specific questions within each of the BPM
capability areas that will enable the assessment of BPM maturity. The approach
to developing Level 3 will be confirmed at a later date.
Methodology
In developing Level 2 of the BPMM Model a series of Delphi studies will be
conducted. The Delphi Technique is traditionally used by researchers conducting

Appendices
- 13:480 -
studies where identification of emerging issues and consensus of opinion on
such issues from a group of experts is required.
A Delphi study consists of a series of brief questionnaires used to elicit
responses from participants over a number of study iterations (generally 2 or 3).
Questionnaires and responses are forwarded via an efficient communication
channel such as e-mail to ensure anonymity of responses. Experts participating
in the study are asked to identify issues or to evaluate responses until consensus
is reached.
To ensure timely progression of the study, a strict timetable is adhered to with
non-responses being excluded from that iteration.
Purpose
The purpose of the Delphi studies is twofold:
3. Agree the definition of each factor in the context of BPM; and
4. Determine and agree the BPM capability areas within each factor.
Outcome/s
1. BPMM model – Level 2.
Delphi Study Timeframe and Schedule
Individual studies will be conducted for each of the six critical success factors:
Strategic Alignment, Governance, Method, IT/IS, People and Culture. As experts
may be involved in more than one study, individual studies will be conducted
primarily on a consecutive basis. Each study will be conducted over an 8 week
period with a two week overlap between studies.
Individual participation by experts is expected to involve approximately 1 hour for
each study. Final results will be presented to the entire group via phone
conference to be scheduled at the end of the 8 week timeframe.

Business Process Management: Progression and Maturity
- 13:481 -
Week Action Timeframe
1 Send email re participation
Confirm participation and collect demographic details
W1, D1 (Week 1, Day 1 i.e. Monday)
1 week to respond
2 Circulate Question 1 – In the context of BPM, how would you define Factor X?
W2, D1
1 week to respond
3 Consolidate responses
Circulate proposed definition of Factor X
W3, D7
4 Further investigate and clarify variations
Reach consensus
Circulate final definition of Factor X
W4, D7
5 Circulate Question 2 – Within Factor X (as defined in Week 4), what do you consider to be the BPM Capability Areas critical for achieving BPM success?
W5, D1
1 week to complete
6 Consolidate responses
Circulate proposed BPM Capability Areas
W6, D7
7 Further investigate and clarify variations
Reach consensus
W7, D7
8 Circulate final BPM Capability Areas
Phone conference with broader group to advise results
W8, D3
W8, D5
Factor Start Finish
Strategic Alignment 21st February 2005 17
th April 2005
Governance 4th April 2005 29
th May 2005
Method 16th May 2005 10
th July 2005
IT/IS 27th June 2005 28
th August 2005
People 8th August 2005 2
nd October 2005
Culture 19th September 2005 13
th November 2005

Appendices
- 13:482 -
Delphi Study Questionnaire
The Delphi study conducted for each BPM factor (Strategic Alignment,
Governance, Method, IT/IS, People, Culture) will address the following questions:
Question 1.
In the context of BPM, how would you define Factor X?
Question 2.
Within Factor X (as defined in Week 4), what do you consider to be the BPM
Capability Areas critical for achieving BPM success?
Responses will be consolidated by the Codification Team prior to being circulated
back to the expert participants for consensus.
Delphi Study Participation
Please complete the following table to indicate your intended participation in the
upcoming Delphi Studies. Participation will be confirmed prior to the
commencement of individual studies.
Please complete by inserting your details
Organisation:
Department:
Occupation:
Location:
Please complete by placing an X in the applicable box
Category: Academic Industry
Participation: Strategic Alignment
IT/IS
Method
Governance

Business Process Management: Progression and Maturity
- 13:483 -
Delphi Study Contact Details
The details below will be used for all correspondence regarding the Delphi study.
Please advise if your details need to be updated.
BPM Experts – Delphi Study Participants
The following table includes details of BPM experts that will be approached
regarding participation in the individual Delphi studies. This list will be updated
as details of additional experts are provided.
Participant A [email protected] ........
Participant B [email protected] ........
People
Culture
Please complete by inserting details of other known experts that may like to participate in these studies
Name:
e-mail:
Area/s of expertise:
Category: Academic Industry
Name:
e-mail:
Area/s of expertise:
Category: Academic Industry
Name:
e-mail:
Area/s of expertise:
Category: Academic Industry

Appendices
- 13:484 -
BPM Experts – Codification Team
The following table includes details of BPM experts that will be approached
regarding membership of the Delphi Study Codification Team. Members of this
team will not provide individual responses to Delphi Study questions but will be
responsible for collating and codification of responses. Tonia de Bruin will be
responsible for the overall administration and co-ordination of the studies with
Coder A and Coder B providing expert assistance in the codification of
responses.
de Bruin, Tonia [email protected]
Coder A [email protected]
Coder B [email protected]

Business Process Management: Progression and Maturity
- 13:485 -
13.2.3 Confirmation Email Sent to Participants
Dear Michael
Thank you for accepting our invitation to participate in this international study on
Business Process Management Maturity. We are pleased to advise that we have
between 14 and 17 experts participating for each of the six Factors of our model.
This email signals the start of the first Delphi Study in our series that will facilitate
finding consensus between all participants. Round 1 will focus on the factor
Strategic Alignment of Business Process Management. The first question for
this round is:
In the context of BPM, how do you define Strategic Alignment?
Please provide your response to this question by return email no later than
Friday 4th March 2005. Responses should be no more than 2 or 3 sentences.
If you have any questions, please contact me.
Best regards
Tonia


Business Process Management: Progression and Maturity
- 13:487 -
13.2.4 Report to Panel Following Pilot
Business Process Management
– Strategic Alignment Final Summary –
Introduction
A series of Delphi studies are in the process of being undertaken with the view of
further developing the proposed BPM Maturity Model. The data gathering stage
of the Strategic Alignment study is now complete. The purpose of this paper is to
provide participants with a summary of outcomes including discussion of both 1)
major points raised during the study and 2) outstanding issues at the completion
of the study.
Each study seeks to answer two primary questions:
1) In the context of business process management, how is Factor x defined?
2) What areas of Factor x should a contemporary maturity model be able to assess?
Detailed timeframe
The Strategic Alignment Delphi study commenced on 28th February 2005 and
consisted of four rounds conducted over an eight week timeframe.
Participants
In total 18 experts participated in the study.
Participant A USA I
Participant B.... USA A

Appendices
- 13:488 -
A summary of participant demographic information is:
Category
Region
I A
USA 8 5
Australia 2 1
Europe 2 -
Category Total 12 7
Definition
The final definition proposed definition for Strategic Alignment was:
In the context of business process management, Strategic Alignment is
the tight linkage of organizational priorities and enterprise processes
enabling continual and effective response to achieving business goals.
The aim of the Delphi study was to have all participants satisfied with the
definition to at least a Rating of 5.
Final ratings for the definition were provided by 14 of the 18 experts.
Rating 0 1 2 3 4 5 6 7 8 9 10 Total
Count - - - - - 1 - 2 6 3 2 14
Average: 8.143 Standard Deviation:
1.292
The change in the average and standard deviation of ratings over time are shown
below.

Business Process Management: Progression and Maturity
- 13:489 -
Results: Average and Standard Deviation
0
1
2
3
4
5
6
7
8
9
1 2 3
Round
Rati
ng
Average
Standard Deviation
Results: Responses per Rating
0
1
2
3
4
5
6
7
1 2 3 4 5 6 7 8 9 10
Rating
Nu
mb
er
of
Re
sp
on
se
s
Responses

Appendices
- 13:490 -
Areas of Agreement
The major area of agreement with the definition was that it was short and to the
point. Comments provided by the Expert Panel included:
I like it – simple and to the point. (3)
It‟s Ok that you try to make it shorter…. (9)
Better because it is shorter and focused. (14)
I like it more because it‟s more concise… (15)
Previous comments indicating that length of the definition was an issue included:
Too wordy. (1)
….too wordy and too fuzzy…. (10)
Overall great. A little long, but OK. (5)
A little bit too long but I understand why. (12)
Outstanding Comments
Whilst achieving this aim, a number of participants have highlighted areas where
they believe the definition could still be improved.
Proactive Nature of BPM
The most recognised issue remaining with the definition focuses on the proactive
nature of BPM. Comments provided by the Expert Panel were:
Highlight “proactive” approach….(3)
“response to achieving goals” sounds awkward, is there a better way to phrase it? You don‟t respond to achieving a goal (because by then it is too late), you respond to the progress made in the pursuit of a goal…. (10)
I‟d change the word „enabling‟ to „driving to enhance the view that process based management is a proactive activity. (13)
I am not convinced that the term „response‟ is well chosen. It gives BPM a reactive flavour. Alternatives would be “is the tight, effective and continuous linkage of” and delete everything from “processes” or to replace response with “achievement of business goals”. (14)
Major Discussion Areas
During the development of the definition there were a number of areas that were
common discussion points.
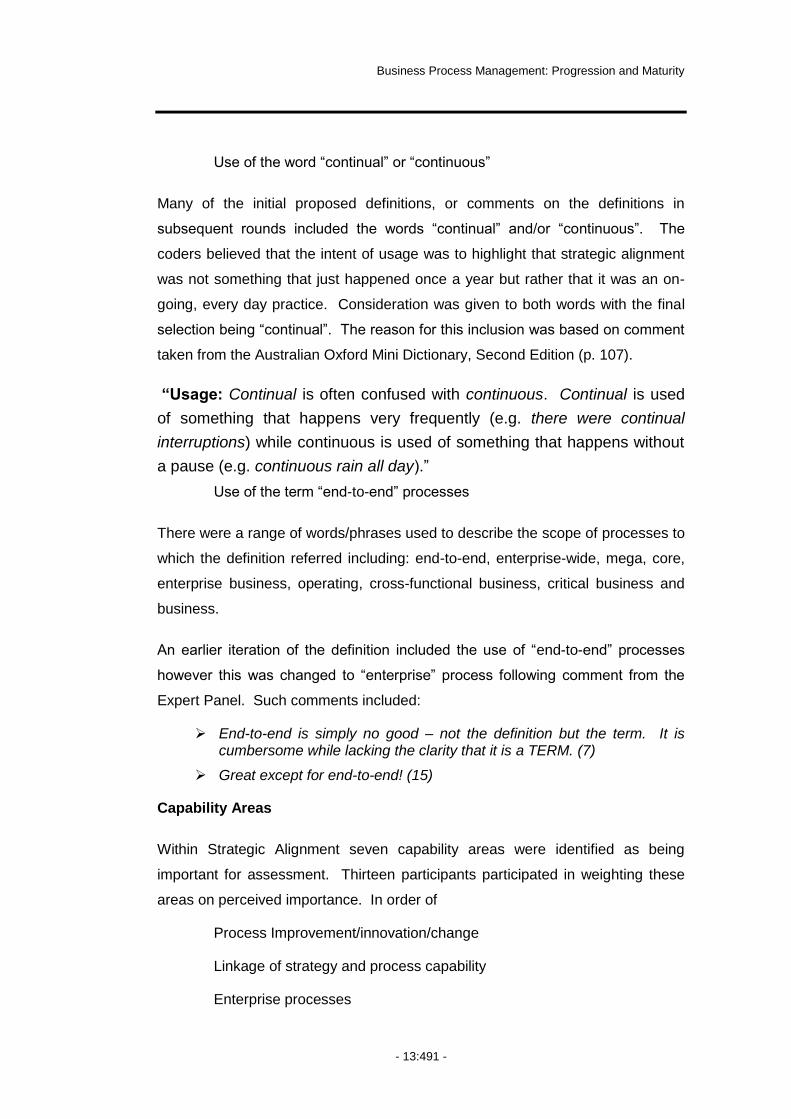
Business Process Management: Progression and Maturity
- 13:491 -
Use of the word “continual” or “continuous”
Many of the initial proposed definitions, or comments on the definitions in
subsequent rounds included the words “continual” and/or “continuous”. The
coders believed that the intent of usage was to highlight that strategic alignment
was not something that just happened once a year but rather that it was an on-
going, every day practice. Consideration was given to both words with the final
selection being “continual”. The reason for this inclusion was based on comment
taken from the Australian Oxford Mini Dictionary, Second Edition (p. 107).
“Usage: Continual is often confused with continuous. Continual is used
of something that happens very frequently (e.g. there were continual
interruptions) while continuous is used of something that happens without
a pause (e.g. continuous rain all day).”
Use of the term “end-to-end” processes
There were a range of words/phrases used to describe the scope of processes to
which the definition referred including: end-to-end, enterprise-wide, mega, core,
enterprise business, operating, cross-functional business, critical business and
business.
An earlier iteration of the definition included the use of “end-to-end” processes
however this was changed to “enterprise” process following comment from the
Expert Panel. Such comments included:
End-to-end is simply no good – not the definition but the term. It is cumbersome while lacking the clarity that it is a TERM. (7)
Great except for end-to-end! (15)
Capability Areas
Within Strategic Alignment seven capability areas were identified as being
important for assessment. Thirteen participants participated in weighting these
areas on perceived importance. In order of
Process Improvement/innovation/change
Linkage of strategy and process capability
Enterprise processes

Appendices
- 13:492 -
Process output measurement
Extended value chain
Strategic priorities
Operational translation

Business Process Management: Progression and Maturity
- 13:493 -
13.2.5 Diary Note: Pilot Study
Based on the feedback/comments and experiences of the first 4 weeks together
with my improved understanding of Delphi studies, I have detailed below what I
believe to be a significant improvement in the structure of the Delphi studies. I
have separated Aim 1 and 2 purely for readability purposes – in practice there
would only be 1 Round 1 that covers both Aim 1 and Aim 2.
Each round would take 2 weeks with 1 week for Experts and 1 week for
consolidation thereby still meeting current timeframes. However if we add this
process to the initial proposal where we asking for a definition first then obviously
the time for each study would lengthen by 4 weeks. The question is…other than
showing that the process is necessary as is the current case and as a
comparison over the course of the study….is there any additional value in
requesting the initial definition?
I believe this (or a similar approach) will be beneficial because it will improve the
quality of the final definition and capabilities and improve commitment and
motivation for continuing participation in the overall study. I do not think people
will continue to participate if they cannot see the value of their input and I think
there is a real chance this could happen if we do not respond quickly.
Aim 1 – Level 1 Definitions
Round 1 (or 3 for this study):
Ask for lists (single word or related phrase only) up to 5 things they believe must
be
stated in a definition of "factor x". For each of these they should also provide a
brief definition if clarity is required.
From here, consolidate a list of such words/phrases, deleting direct commonality
and grouping where descriptions are similar but words/phrase are different (max
20).

Appendices
- 13:494 -
When deleting, continue to show all descriptions, and when grouping show all
original words and descriptions but suggest (or maybe leave blank and ask) a
common word/phrase for use. For example:
Proposed Word/Phrase Provided Word/Phrase Description
Stakeholder Customer
Government regulator
Supplier/vendor, etc
1.
2.
3.
Goals and objectives Goals
Goals and objectives
Objectives
1.
2.
3.
Process Improvement Process Improvement 1.
2.
Round 2
Return the list to individuals requesting that they:
1. rate these based on perceived importance for inclusion in the
definition (with a scale provided such as (1) absolutely must stay, (2)
either-way and (3) not necessary and
2. where the original word has been grouped - select/nominate the
word/term that they feel is most representative or advise if they feel the
grouping should not be used.
Round 3
Consolidate on the basis of ratings - show in order of importance (most number
of 1's first) but also show how many of each were received e.g.
Responses Proposed Word/Phrase
Provided Word/Phrase Description
1 – 8
2 – 5
3 – 1
Stakeholder Customer
Government regulator
Supplier/vendor, etc
1.
2.
3.
Return to group suggesting a cut-off point (perhaps when the number 2‟s or 3‟s
are greater than the 1‟s). Request further comments regarding cut-off point.

Business Process Management: Progression and Maturity
- 13:495 -
Round 4
Devise a proposed definition and return for rating of satisfaction. If we stick with
current process of asking for starting definition we could then compare 1 (initial),
2 (original proposed) and 3 (final proposed) to see the changes.
Aim 2 – Level 2 Capabilities
Round 1
Request list of words/phrases of things about Factor x they want to be able to
assess using the proposed maturity model (max 7). Do not link to any work on
definitions.
Consolidate list of words/phrases, deleting direct commonality and grouping
where descriptions are similar but words/phrase are different (maximum 20).
When deleting continue to show all descriptions, and when grouping show all
original words and descriptions but suggest (or maybe leave blank and ask) a
common word/phrase for use.
Round 2
Return the list to individuals requesting that they:
1. rate these based on perceived importance for inclusion in the model (with a scale provided such as (1) absolutely must stay, (2) either-way and (3) not necessary: and
2. where the original word has been grouped - select/nominate the word/term that they feel is most representative or advise if they feel the grouping should not be used.
Round 3
Consolidate on the basis of ratings - show in order of importance (most number
of 1's first) but also show how many of each were received e.g.
Return to group suggesting a cut-off point (the least of „7” or „when the number
2‟s or 3‟s are greater than the 1‟s‟). Request further comments regarding cut-off
point.

Appendices
- 13:496 -
Round 4
Incorporate additional comments, confirm final list and return for rating of
satisfaction of how well the model would meet assessment needs if developed to
include these.

Business Process Management: Progression and Maturity
- 13:497 -
13.2.6 Delphi Study Structure Following Pilot Study
Week Action Resp. Timeframe
1 Circulate Round 1 questions:
In the context of BPM, how would you define Factor x?
Detail (up to) 5 elements (single word or phrase) that you consider to be crucial to a BPM definition on Factor x?
List 7 items under Factor x that you would like to be able to assess/measure by applying the proposed model.
TDB
EP
W1,D1 (Week 1, Day 1 i.e. Monday)
1 week
2 Consolidate definition elements into list of no more than 10.
Consolidate capability items into list of no more than 10. Use tree structure to retain lower level detail which will be useful in providing guidance for level 3 development.
Incorporate terminology into consolidation process i.e. glossary development. Link glossary to lists i.e. wording from initial responses in the description.
Return both consolidated lists to experts for ranking, use scale of 1 – 3 where 1 = essential, 2 = nice to have, 3 = not required, 4 – belongs in factor y.
Return glossary to experts for consideration and input.
CT
W2, D1
1 week
3 Circulate Round 2 questions:
Rank definition elements using 1 – 4 scale. Provide further comment if required.
Rank capability items using 1 – 4 scale. Provide further comment if required.
Provide input into glossary development.
TDB
EP
W3, D1
1 week
3 Consolidate ranked definition elements based on ratings. Provide to CT for use in developing proposed definition.
Consolidate ranked capability items based on ratings. Shorten list using rankings as a guide but with a final list of no more than 7 capability areas.
Update glossary based on feedback received.
TDB W3, w/e

Appendices
- 13:498 -
Week Action Resp. Timeframe
4 Develop proposed definition on the basis of initial definitions and ranked definition elements. As a guide, incorporate into proposed definition ranked definition elements that have more 1‟s than 2‟s or 3‟s.
Review consolidated capability items.
Review combined glossary terms.
CT W4, D1
1 week
5 Circulate Round 3 questions:
Rate proposed definition on the basis of satisfaction and provide comment as required.
Rank/weight Capability items on the basis of perceived importance. Provide additional comment as required.
Review updated glossary and provide comment.
TDB
EP
W5, D1
1 week
5 Consolidate list of capability items based on rank/weighting.
Update glossary to incorporate any changes.
TDB W5, w/e
6 Consider modification to proposed definition in light of ratings and comments received. Determine final definition.
Review final list of ranked/weighted capability items.
Review changes to glossary.
CT W6, D1
3 days
6 Circulate Round 4 questions:
Rate satisfaction with final definition
Rate satisfaction with final list of capability areas
TDB
EP
W6, D4
2 days
7 Summarise findings for feedback to group TDB
Key
EP Expert Panel
CT Codification Team (i.e. Coder A, Coder B and Tonia)
TDB Tonia de Bruin
Notes
To avoid unnecessary duplication of effort within the codification team, when
tasks involve consolidation of lists following the rating/weighting/ranking by the
expert panel this will be undertaken only by TDB. The resultant consolidated list
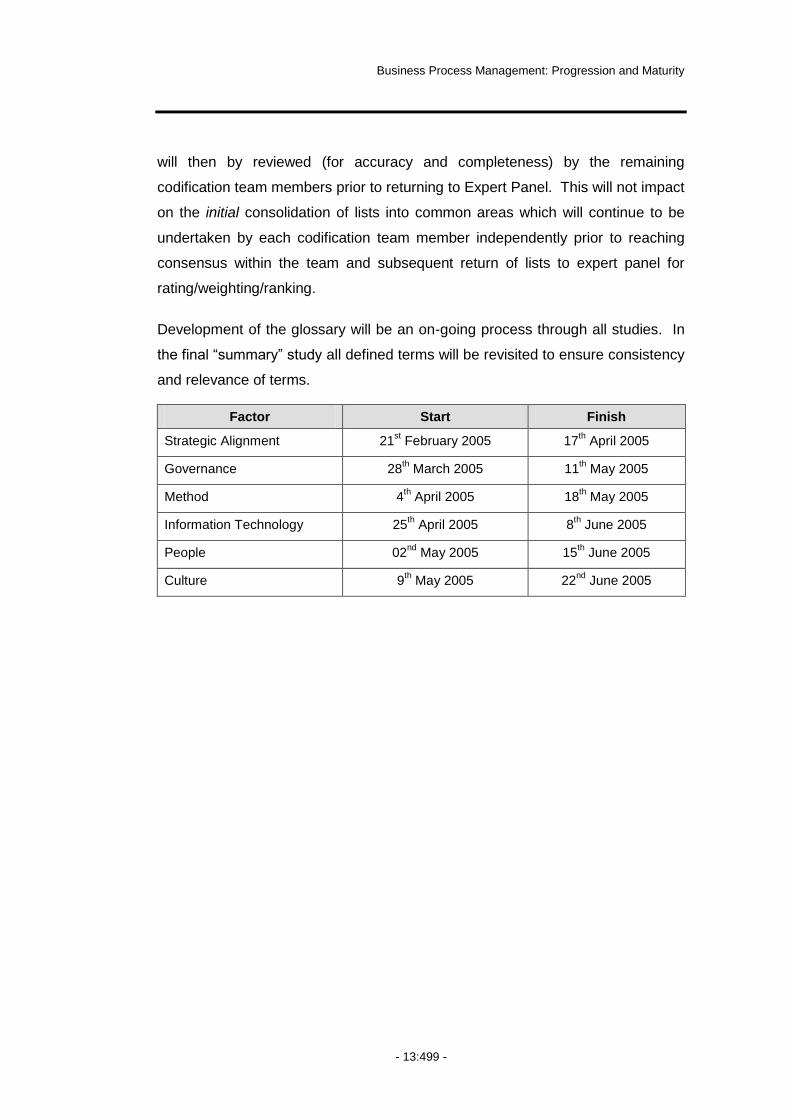
Business Process Management: Progression and Maturity
- 13:499 -
will then by reviewed (for accuracy and completeness) by the remaining
codification team members prior to returning to Expert Panel. This will not impact
on the initial consolidation of lists into common areas which will continue to be
undertaken by each codification team member independently prior to reaching
consensus within the team and subsequent return of lists to expert panel for
rating/weighting/ranking.
Development of the glossary will be an on-going process through all studies. In
the final “summary” study all defined terms will be revisited to ensure consistency
and relevance of terms.
Factor Start Finish
Strategic Alignment 21st February 2005 17
th April 2005
Governance 28th March 2005 11
th May 2005
Method 4th April 2005 18
th May 2005
Information Technology 25th April 2005 8
th June 2005
People 02nd
May 2005 15th June 2005
Culture 9th May 2005 22
nd June 2005
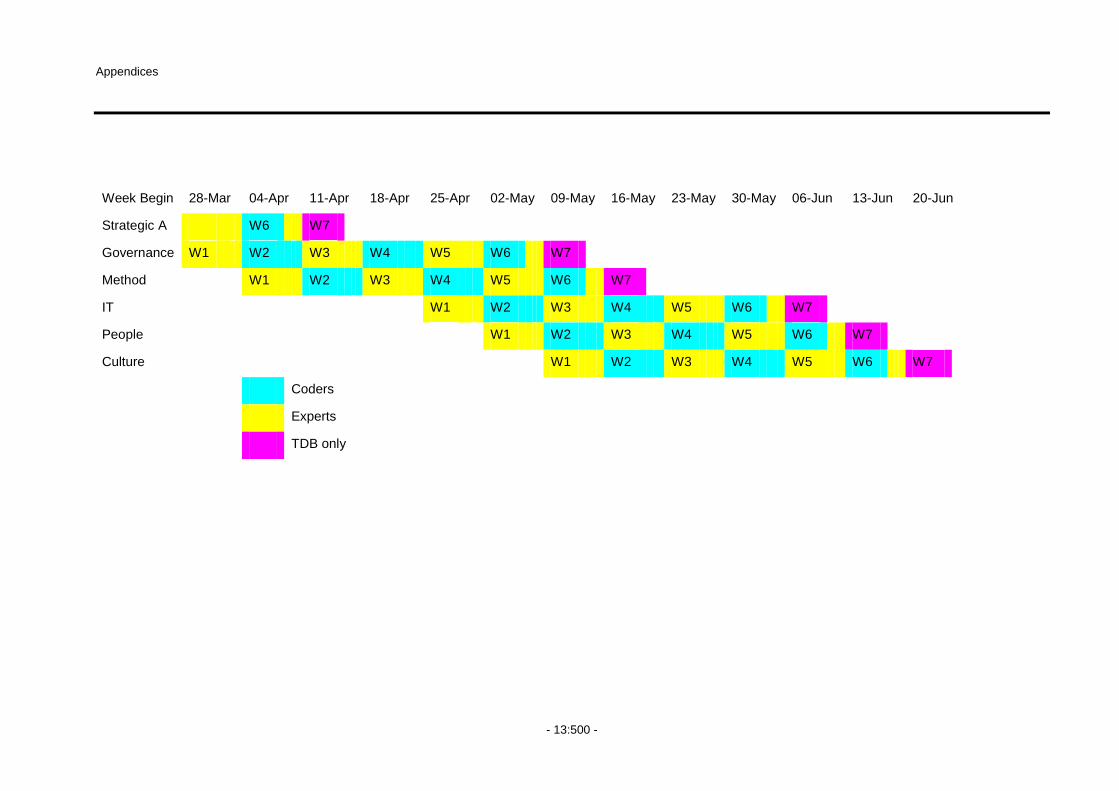
Appendices
- 13:500 -
Week Begin 28-Mar 04-Apr 11-Apr 18-Apr 25-Apr 02-May 09-May 16-May 23-May 30-May 06-Jun 13-Jun 20-Jun
Strategic A W6 W7
Governance W1 W2 W3 W4 W5 W6 W7
Method W1 W2 W3 W4 W5 W6 W7
IT W1 W2 W3 W4 W5 W6 W7
People W1 W2 W3 W4 W5 W6 W7
Culture W1 W2 W3 W4 W5 W6 W7
Coders
Experts
TDB only

Business Process Management: Progression and Maturity
- 13:501 -
13.2.7 Email to Panel Member for Round
Dear
Welcome to Round 2 of the Business Process Management – Governance
Delphi study.
In Round 1 you were asked to provide a definition of 'Governance in the context
of business process management' and to identify „up to 7 major items‟ you would
like to be able to assess by applying the new BPM Maturity model. Responses
have been received from 18 experts.
Based on this feedback the following consolidated definition is proposed:
In the context of BPM, Governance establishes accountability, decision-
making and reward structures to manage compliance with relevant
standards and controls and monitor the degree to which enterprise
processes achieve required business performance.
And the proposed list of Capability Areas (in no particular order) is:
Roles and Responsibilities
Decision Making Structures
Standards
Controls
Metrics
Process Architecture
If you require additional detail relating to the Capability Areas, it is provided in the
attached document.
Appendices
- 13:502 -
Round 2 Questions
Please rate your satisfaction with the proposed definition using a 10
point scale (1 – not satisfied to 10 – very satisfied). Please provide any
additional comment/s as required.
Please rate your satisfaction with the proposed list of Capability Areas
using a 10 point scale with 1 (not satisfied) and 10 (very satisfied).
Please provide any additional comment/s as required.
Note: you will be asked to weight the final list of Capability Areas based
on perceived importance in a following round.
Please respond to Round 2 questions either via email or within the attached
document by Friday 22nd April, 2005.
Best regards
Tonia

Business Process Management: Progression and Maturity
- 13:503 -
13.2.8 Follow-up Emails Sent to Participants
Dear
A reminder that your response to People Round 1 questions (as shown below)
are due by Monday 18th April 2005.
To maintain your place in the Delphi study, please forward your response by this
time.
Best regards
Tonia
Dear
The Codification Team will commence analysis of Round 2 responses on
Monday.
Please forward your response to ensure it is included in the analysis process.
Best regards
Tonia


Business Process Management: Progression and Maturity
- 13:505 -
13.2.9 Summary of Responses from Delphi Study Round
Round 1 - Question 1
In the context of BPM, how do you define Strategic Alignment?
Participant
No
Response
1 In the context of BPM, strategic alignment requires that the firm‟s leadership team work in a deliberate and collaborative way to define the firm‟s major cross-functional business processes and then by looking at the business from the „outside-in‟ or customer‟s point of view, measure the firm‟s current performance, desired performance and the size of the gap in providing products and services to customers via these large cross-functional business processes, and thereby determine what level of performance improvement in business process terms is needed in order to achieve strategic objectives.
This thought process will lead to the creation of a one-page business process relationship map or schematic and the development of a business process management plan which specifies who will need to work collaboratively to assure which business processes need to be improved by how much, by when to achieve the firm‟s strategic objectives.
2 Strategic alignment is a dynamic capability that allows a firm:
to sense predictable as well as unpredictable events in customer demands, markets, technology, and government regulations,
to interpret these events in the light of the firm‟s interests, and
to respond consequentially by adjusting or innovating its network of business processes.
3 The identification and management of cause and effect relationships between business processes and critical business issues showing the impact of BPM on the execution of enterprise strategy.
4 A BPM solution must integrate and coordinate specific company assets (human capital, partners, customers, information, technology and applications) to realize specific goals that are aligned strategically with the expectations and desires of the stakeholders (customers, shareholders and financial entities).
The solution must be able to leverage these assets to move the organization forward towards it‟s goals yet flexible to allow for changing market and financial conditions.
5 Strategic alignment in a BPM context is ensuring that the processes the organization is attempting to improve, and its improvement objectives for those processes, are consistent with the strategy of the organization.

Appendices
- 13:506 -
Participant
No
Response
6 For strategic alignment, an organization should have:
Identification of mega-processes, the scope of process management
A plan for improvement of each mega-process
A sourcing strategy (principles for what processes will be done in-house vs. contracted)
Line-of-sight to customers (how processes impact customers)
Strategy as an input to process designs and vice versa
Process measurement linkage to business scorecard
Operating strategy (customer value proposition) and operating model (translation into processes, organization, measures, culture)
Clarity on common vs. unique processes
Existence and quality of sensing processes
Supplier and customer management and linkage
7 BPM does not define strategy. BPM supports the effective achievement of organizational strategy. Specifically, through the effective management of core and support processes, an organization will be able to obtain competitive advantage.
8 Strategic Alignment in BPM is characterized by the existence of enterprise business processes (enterprise business processes are those that span the organization and have no leading or trailing processes) whose output is tightly linked to customer outcomes (defined from the customer view) that have been identified as core to the operation of the business. The measure of Strategic Alignment assesses the degree of completeness in an organization against this definition, the extent to which this has been applied within the organization, and the relative emphasis against other corporate goals and activities.
9 Strategic Alignment of Business Process Management means to consider relevant strategies in the (re)design of business processes as well as to (re-)evaluate an organisation's strategies in terms of its business process capabilities.
10 Strategic objectives define process performance measures and their targets, and the measures are actively followed to see if they comply. Strategy is the single most important input when deciding about process improvement activities.
11 In the context of BPM, Strategic Alignment is the ongoing adjustment of work to the strategic priorities of the organization – “work” being defined here as the execution of „live‟ business processes, encompassing the primary elements of execution, i.e. people and systems, together with the culture and politics that surround them.
Note: When “strategic priorities” change BPM needs to be adaptive
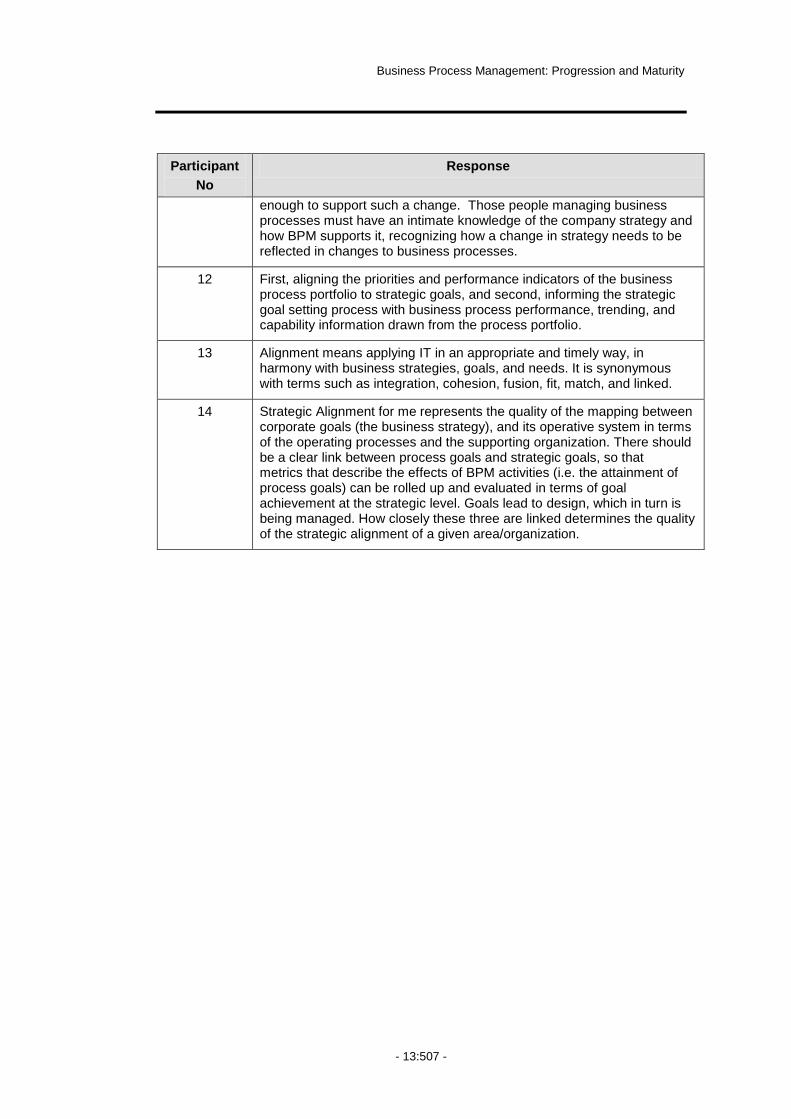
Business Process Management: Progression and Maturity
- 13:507 -
Participant
No
Response
enough to support such a change. Those people managing business processes must have an intimate knowledge of the company strategy and how BPM supports it, recognizing how a change in strategy needs to be reflected in changes to business processes.
12 First, aligning the priorities and performance indicators of the business process portfolio to strategic goals, and second, informing the strategic goal setting process with business process performance, trending, and capability information drawn from the process portfolio.
13 Alignment means applying IT in an appropriate and timely way, in harmony with business strategies, goals, and needs. It is synonymous with terms such as integration, cohesion, fusion, fit, match, and linked.
14 Strategic Alignment for me represents the quality of the mapping between corporate goals (the business strategy), and its operative system in terms of the operating processes and the supporting organization. There should be a clear link between process goals and strategic goals, so that metrics that describe the effects of BPM activities (i.e. the attainment of process goals) can be rolled up and evaluated in terms of goal achievement at the strategic level. Goals lead to design, which in turn is being managed. How closely these three are linked determines the quality of the strategic alignment of a given area/organization.

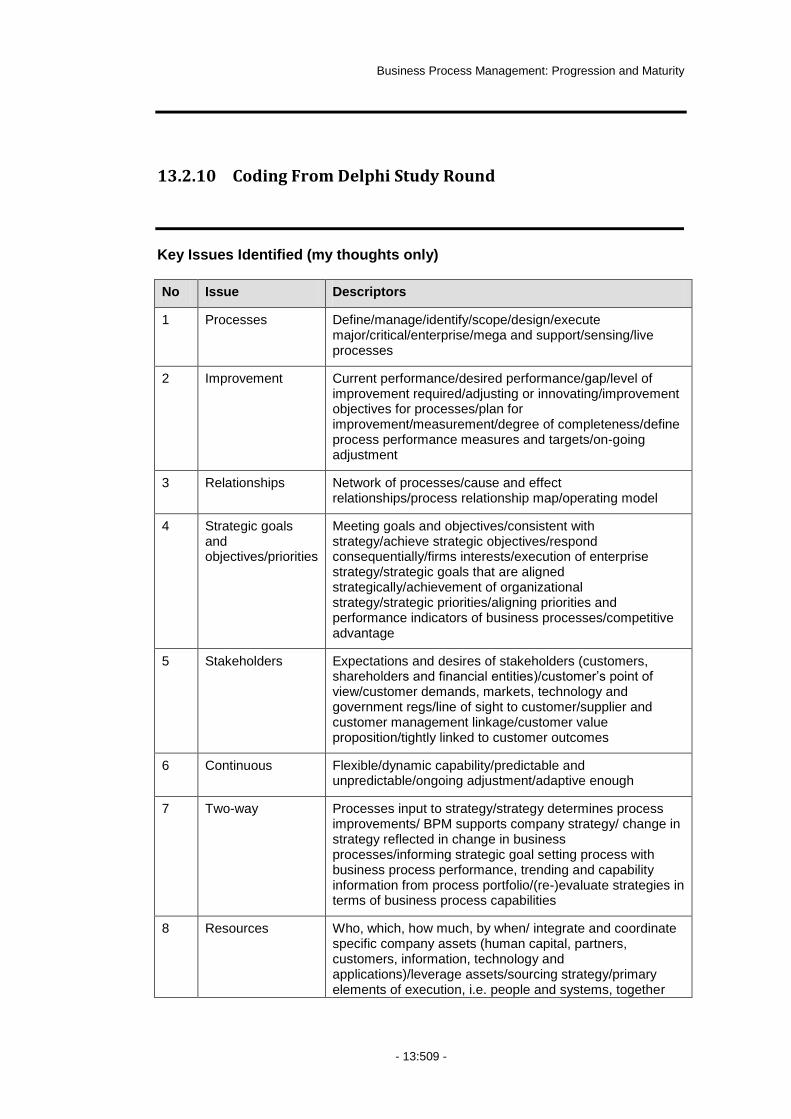
Business Process Management: Progression and Maturity
- 13:509 -
13.2.10 Coding From Delphi Study Round
Key Issues Identified (my thoughts only)
No Issue Descriptors
1 Processes Define/manage/identify/scope/design/execute major/critical/enterprise/mega and support/sensing/live processes
2 Improvement Current performance/desired performance/gap/level of improvement required/adjusting or innovating/improvement objectives for processes/plan for improvement/measurement/degree of completeness/define process performance measures and targets/on-going adjustment
3 Relationships Network of processes/cause and effect relationships/process relationship map/operating model
4 Strategic goals and objectives/priorities
Meeting goals and objectives/consistent with strategy/achieve strategic objectives/respond consequentially/firms interests/execution of enterprise strategy/strategic goals that are aligned strategically/achievement of organizational strategy/strategic priorities/aligning priorities and performance indicators of business processes/competitive advantage
5 Stakeholders Expectations and desires of stakeholders (customers, shareholders and financial entities)/customer‟s point of view/customer demands, markets, technology and government regs/line of sight to customer/supplier and customer management linkage/customer value proposition/tightly linked to customer outcomes
6 Continuous Flexible/dynamic capability/predictable and unpredictable/ongoing adjustment/adaptive enough
7 Two-way Processes input to strategy/strategy determines process improvements/ BPM supports company strategy/ change in strategy reflected in change in business processes/informing strategic goal setting process with business process performance, trending and capability information from process portfolio/(re-)evaluate strategies in terms of business process capabilities
8 Resources Who, which, how much, by when/ integrate and coordinate specific company assets (human capital, partners, customers, information, technology and applications)/leverage assets/sourcing strategy/primary elements of execution, i.e. people and systems, together

Appendices
- 13:510 -
with the culture and politics that surround them/those people managing processes/leadership team
Proposed Consolidated Definition (Researcher‟s thoughts only)
Strategic alignment of business process management is a cycle whereby process
capability enables achievement of strategic goals and strategic priority drives
improvement in process capability. Alignment is achieved by mapping
relationships between processes, stakeholders and organisational priorities and
continuously identifying, executing and improving processes and process
resources to best meet strategic priorities.
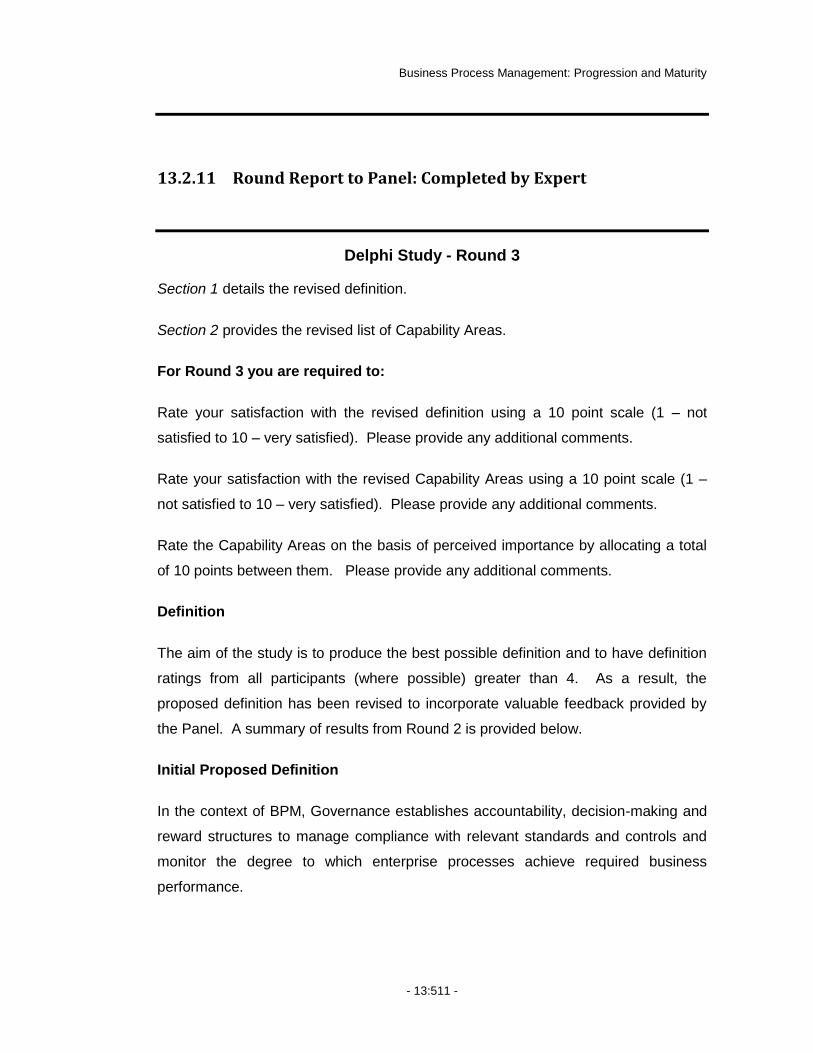
Business Process Management: Progression and Maturity
- 13:511 -
13.2.11 Round Report to Panel: Completed by Expert
Delphi Study - Round 3
Section 1 details the revised definition.
Section 2 provides the revised list of Capability Areas.
For Round 3 you are required to:
Rate your satisfaction with the revised definition using a 10 point scale (1 – not
satisfied to 10 – very satisfied). Please provide any additional comments.
Rate your satisfaction with the revised Capability Areas using a 10 point scale (1 –
not satisfied to 10 – very satisfied). Please provide any additional comments.
Rate the Capability Areas on the basis of perceived importance by allocating a total
of 10 points between them. Please provide any additional comments.
Definition
The aim of the study is to produce the best possible definition and to have definition
ratings from all participants (where possible) greater than 4. As a result, the
proposed definition has been revised to incorporate valuable feedback provided by
the Panel. A summary of results from Round 2 is provided below.
Initial Proposed Definition
In the context of BPM, Governance establishes accountability, decision-making and
reward structures to manage compliance with relevant standards and controls and
monitor the degree to which enterprise processes achieve required business
performance.

Appendices
- 13:512 -
Round 2 Satisfaction Ratings Received from Expert Panel
Rating 0 1 2 3 4 5 6 7 8 9 10 Total
Count 0 0 0 1 0 2 1 2 4 2 1 13
Average: 7.154 Standard Deviation: 1.951
Summary of Round 2 Comments Received from Expert Panel
It‟s too long.
I don‟t like the abbreviation BPM.
This is a very rationalistic view mainly focused on productivity and control.
In business process management, it is essential to also: “effectively
sensing and responding to changes in customer and market demands”.
Good definition. “Relevant standards and controls” is a bit vague, because
compliance with predefined process structures should probably be included
as well.
I am becoming increasingly concerned with the way in which definitions are
being phrased in this study. As I read the definitions I get a sense of
something that is rigid, structured and inflexible. I am concerned that we
are losing sight of the fact that processes are how work gets done. Where
are purpose, passion and people?
Maybe “achieve required” should be simply “support”.
I would prefer if we could explicitly include the word „process‟ in order to
capture governance processes, e.g. it could be inserted after „decision
making‟.
I would prefer to delete “to manage compliance with relevant standards”
what if we do not have such standards? If a standard (e.g. Sarbanes-
Oxley) matters, it will impact the design of accountability and decision-
making processes, but there is no need to make this an explicit part of the
definition.

Business Process Management: Progression and Maturity
- 13:513 -
Monitoring of process performance should be part of governance to the
extent that this is about defining how to monitor, not what to monitor (which
should be part of strategic alignment).
Great.
Apart from complex phrasing: coherence and transparency are words that
come to mind as preconditions for governance.
The definition is too academic. It doesn‟t mention the use of power (formal
and informal) to support the process perspective vs. other axes. It also
doesn‟t link BPM governance to BP improvement, a vital linkage. BP
governance is also a set of decision principles that helps an org optimize its
process performance i.e. decision rights for processes.
Revised Definition
In the context of business process management, Governance establishes coherent
and transparent accountability, decision-making and reward processes to guide
actions and optimize business performance.
Please provide a rating of the proposed definition (1 – not satisfied to 10 – very
satisfied) together with any additional comment/s.
Rating: 9
Additional Comment/s: Replace „optimize‟ with „improve‟
Capability Areas
The aim of the study is to produce the best possible list of Capability Areas and have
ratings from all participants (where possible) greater than 4. A summary of results
from Round 2 is provided below.

Appendices
- 13:514 -
Round 2 Satisfaction Ratings Received from Expert Panel
Rating 0 1 2 3 4 5 6 7 8 9 10 Total
Count 0 0 1 0 0 0 2 2 6 2 0 13
Average: 7.231 Standard Deviation: 1.833
Summary of Round 2 Comments Received from Expert Panel
I‟d combine “standards” and “controls”.
I‟d add a capability about the trade-off between process and function,
geography, product/market.
This list is missing out on one of the most important governance
mechanisms: values and culture. Also, there is no emphasis on the
capability to effectively communicate and change values as part of
adapting to change.
Good set.
Roles and responsibilities
Important that the role of any “governance body” is clear and the roles and responsibilities within those bodies are clear – accountability of these roles is also important.
Looks good.
Decision Making Structures
I like the inclusion of “speed of decision making” as being significant.
Instead of structures: processes, structure sounds too static and sounds more like accountability.
Standards
I think the term “strategies” should be replaced with “principles” when talking about Standards in order to distinguish this factor from Strategic Alignment.
OK but the word “standards” might be too wide, too fuzzy.
Delete Process Architecture – it is part of Strategic Alignment.
The details need clarification: what are good/best practices? I would also

Business Process Management: Progression and Maturity
- 13:515 -
prefer a shorter description. Both of these can be further defined in the 3rd
level (definitions of levels 1– 5).
It has no mention of resources, $ and people which is what power and
governance produces.
Please rate the revised list of “Capability Areas” in two ways.
Please rate your satisfaction with the revised list of Capability Areas (1 – not
satisfied to 10 – very satisfied) together with any additional comment/s.
Rating: 9
Additional Comment/s:
You have a total of 10 points. Please allocate these 10 points to the
Capability Areas based on perceived importance.

Appendices
- 13:516 -
Capability Area Additional Detail Points Allocated
Comments
Roles and Responsibilities
a) Examples: Process sponsor, process owner, business owner, chief process officer, process leaders, process councils, process steering groups, process governance board
b) Clearly defined and documented roles c) Identification of only 1 process owner per Enterprise
Process d) Delineation of local & global performer roles e) Incorporation of authority-to-change and accountability f) Degree to which process roles and responsibilities are
recognized and accepted
4 Add: business process analysts
Decision Making Processes
a) Existence of clearly defined and documented processes for decision making in both anticipated and unanticipated circumstances
b) Speed of decision making c) Ability to influence resource allocation d) Formal and informal power influences e) Authority to instigate and communicate process
change f) Ability to influence organizational reaction to process
change
4 Add to a) “communicated and continuously reviewed”
Standards a) Well defined process management principles b) Review cycle to maintain quality of process
management principles c) Co-ordination of process management initiatives
throughout the organization d) Guidelines for the establishment and management of:
Linking strategic & enterprise process priorities
Measures and metrics
Issue Resolution & decision making
Process change management, risk and
1 a-b (and some elements of d) can go into 2 c can go into 1
first bullet point of d) belongs to strategic alignment
second bullet point: metrics are defined in strat. Alignment, in governance we
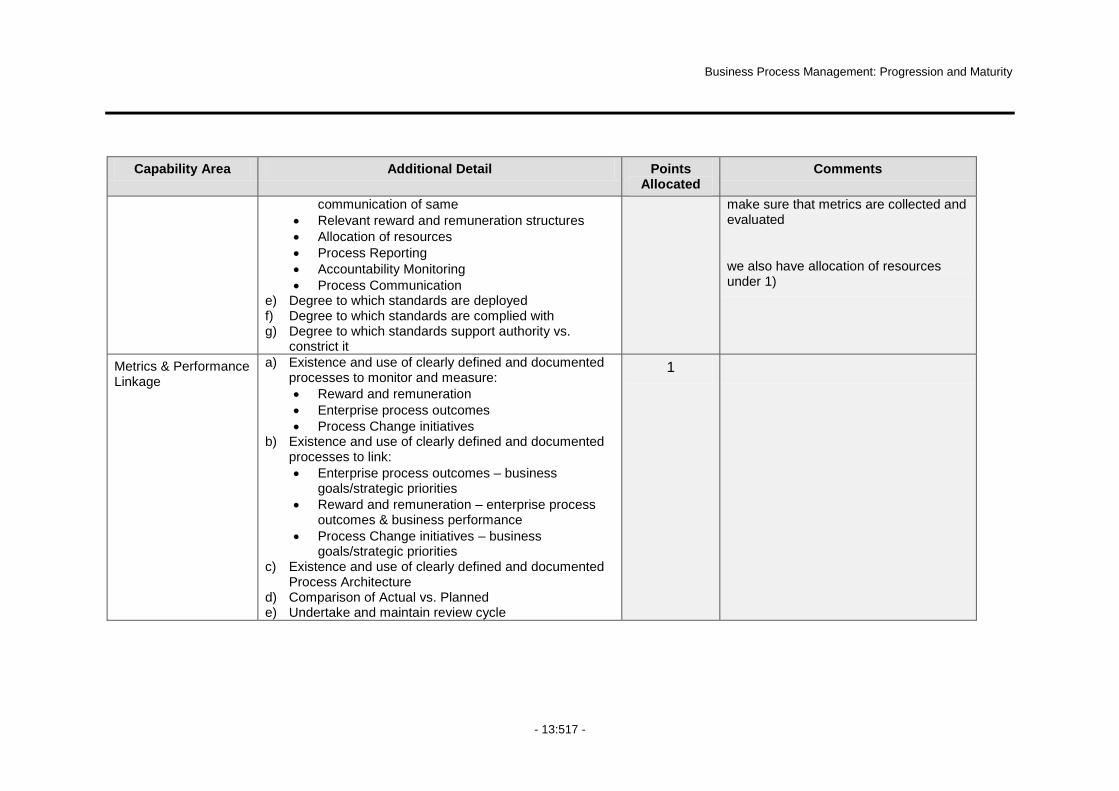
Business Process Management: Progression and Maturity
- 13:517 -
Capability Area Additional Detail Points Allocated
Comments
communication of same
Relevant reward and remuneration structures
Allocation of resources
Process Reporting
Accountability Monitoring
Process Communication e) Degree to which standards are deployed f) Degree to which standards are complied with g) Degree to which standards support authority vs.
constrict it
make sure that metrics are collected and evaluated
we also have allocation of resources under 1)
Metrics & Performance Linkage
a) Existence and use of clearly defined and documented processes to monitor and measure:
Reward and remuneration
Enterprise process outcomes
Process Change initiatives b) Existence and use of clearly defined and documented
processes to link:
Enterprise process outcomes – business goals/strategic priorities
Reward and remuneration – enterprise process outcomes & business performance
Process Change initiatives – business goals/strategic priorities
c) Existence and use of clearly defined and documented Process Architecture
d) Comparison of Actual vs. Planned e) Undertake and maintain review cycle
1

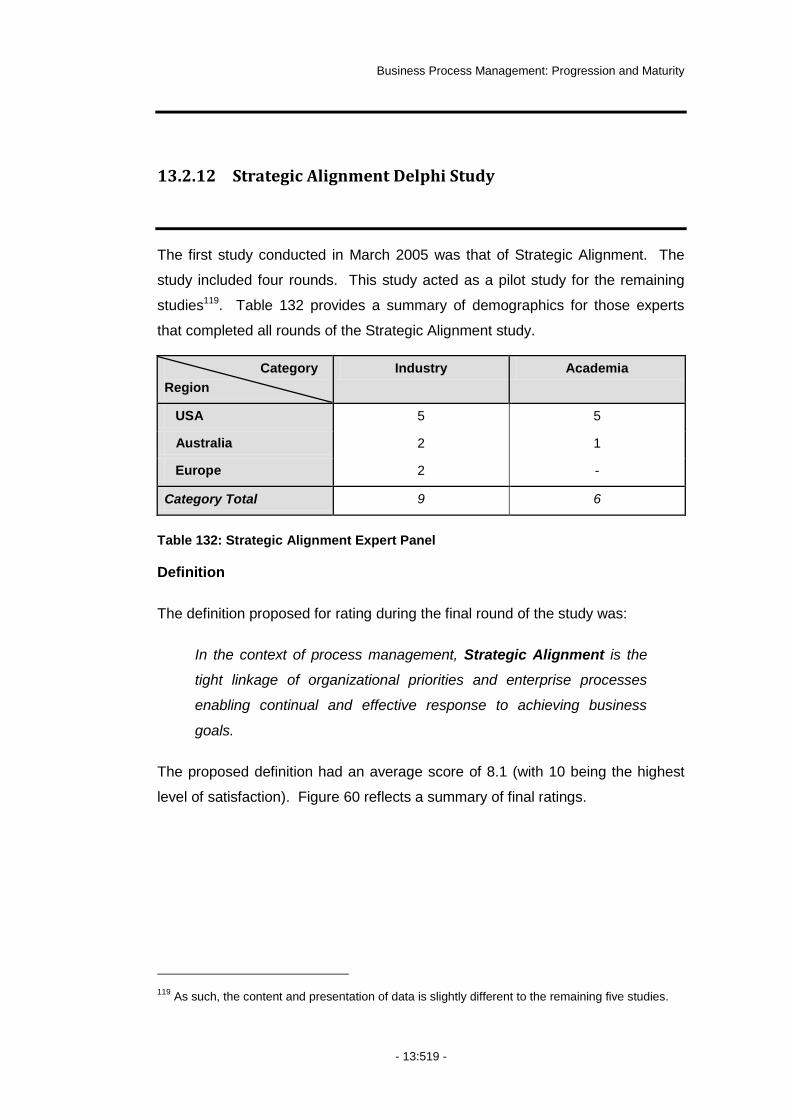
Business Process Management: Progression and Maturity
- 13:519 -
13.2.12 Strategic Alignment Delphi Study
The first study conducted in March 2005 was that of Strategic Alignment. The
study included four rounds. This study acted as a pilot study for the remaining
studies119. Table 132 provides a summary of demographics for those experts
that completed all rounds of the Strategic Alignment study.
Category
Region
Industry Academia
USA 5 5
Australia 2 1
Europe 2 -
Category Total 9 6
Table 132: Strategic Alignment Expert Panel
Definition
The definition proposed for rating during the final round of the study was:
In the context of process management, Strategic Alignment is the
tight linkage of organizational priorities and enterprise processes
enabling continual and effective response to achieving business
goals.
The proposed definition had an average score of 8.1 (with 10 being the highest
level of satisfaction). Figure 60 reflects a summary of final ratings.
119
As such, the content and presentation of data is slightly different to the remaining five studies.

Appendices
- 13:520 -
Figure 60: Strategic Alignment Definition – Responses per Rating
Figure 61 reflects the change in the average and standard deviation of ratings
over the three rating rounds of the Delphi study.
Figure 61: Strategic Alignment Definition – Average & Standard Deviation
Final Round Comments
A number of Participants highlighted areas where they believed further
improvements in final proposed definition were possible. Comments mostly
related to the proactive nature of process management and included:
0
1
2
3
4
5
6
7
1 2 3 4 5 6 7 8 9 10
Definition Rating
Nu
mb
er
of
Resp
on
ses
Responses
0
1
2
3
4
5
6
7
8
9
10
1 2 3
Round
Defi
nit
ion
Rati
ng
Average
Standard Deviation
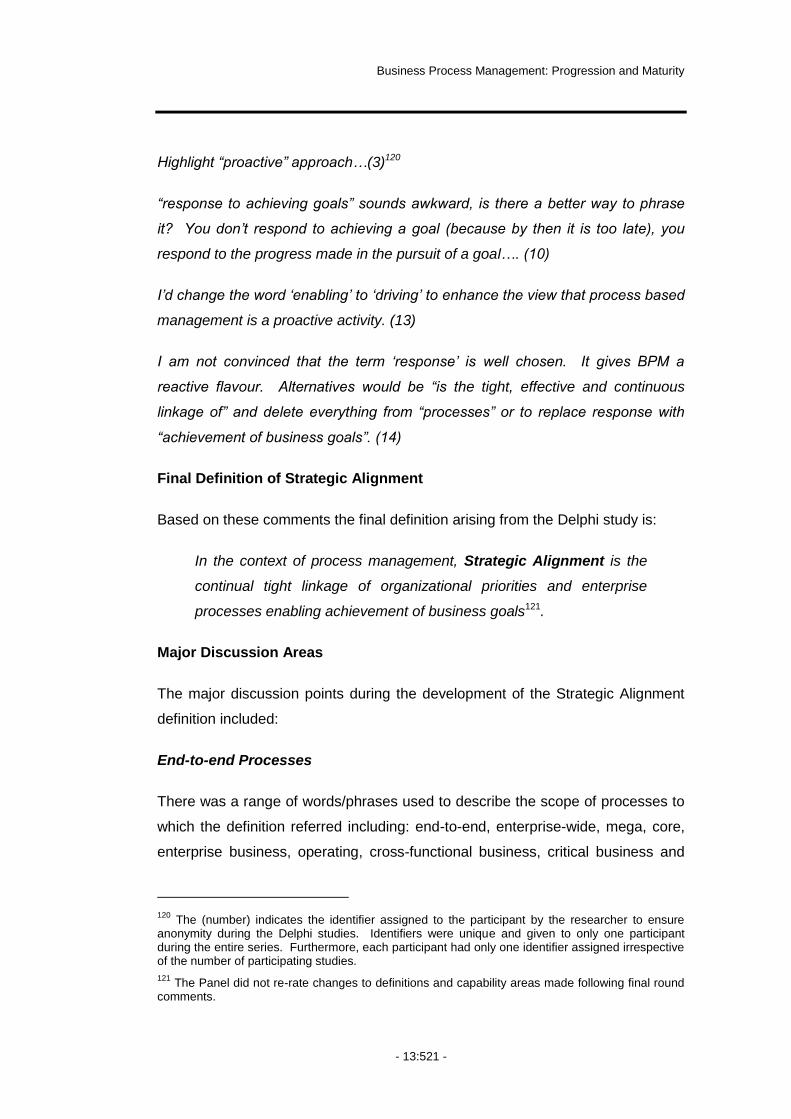
Business Process Management: Progression and Maturity
- 13:521 -
Highlight “proactive” approach…(3)120
“response to achieving goals” sounds awkward, is there a better way to phrase
it? You don‟t respond to achieving a goal (because by then it is too late), you
respond to the progress made in the pursuit of a goal…. (10)
I‟d change the word „enabling‟ to „driving‟ to enhance the view that process based
management is a proactive activity. (13)
I am not convinced that the term „response‟ is well chosen. It gives BPM a
reactive flavour. Alternatives would be “is the tight, effective and continuous
linkage of” and delete everything from “processes” or to replace response with
“achievement of business goals”. (14)
Final Definition of Strategic Alignment
Based on these comments the final definition arising from the Delphi study is:
In the context of process management, Strategic Alignment is the
continual tight linkage of organizational priorities and enterprise
processes enabling achievement of business goals121.
Major Discussion Areas
The major discussion points during the development of the Strategic Alignment
definition included:
End-to-end Processes
There was a range of words/phrases used to describe the scope of processes to
which the definition referred including: end-to-end, enterprise-wide, mega, core,
enterprise business, operating, cross-functional business, critical business and
120
The (number) indicates the identifier assigned to the participant by the researcher to ensure anonymity during the Delphi studies. Identifiers were unique and given to only one participant during the entire series. Furthermore, each participant had only one identifier assigned irrespective of the number of participating studies.
121 The Panel did not re-rate changes to definitions and capability areas made following final round
comments.

Appendices
- 13:522 -
business.
An earlier iteration of the definition included the use of “end-to-end” processes.
This generated a number of comments from Participants including:
End-to-end is simply no good – not the definition but the term. It is cumbersome
while lacking the clarity that it is a TERM. (7)
Great except for end-to-end! (15)
The term “enterprise processes” replaced “end-to-end”.
Inclusion of People
A number of initial definitions and comments included reference to people, such
as:
….is senior management making the tight link between…(4)
….requires that the firm‟s leadership team work in a way …... (11)
….those people managing business process must have…(12)
Strategic Alignment deals with „linkage‟ and „enabling‟. „Who‟ is responsible for
this is included in the Governance factor that includes Process Roles and
Responsibilities.
Other „people‟ comments included:
….line of sight to customers (how processes impact customers…(5)
….aligned strategically with the expectations and desires of stakeholders
(customers, shareholders and financial entities)…(6)
….whose output is tightly linked to customer outcomes …(7)
….gap in providing products and services to customers …..(11)
With regard to these comments, an early definition attempted to capture these
points by referring to “relationships between stakeholders, processes and
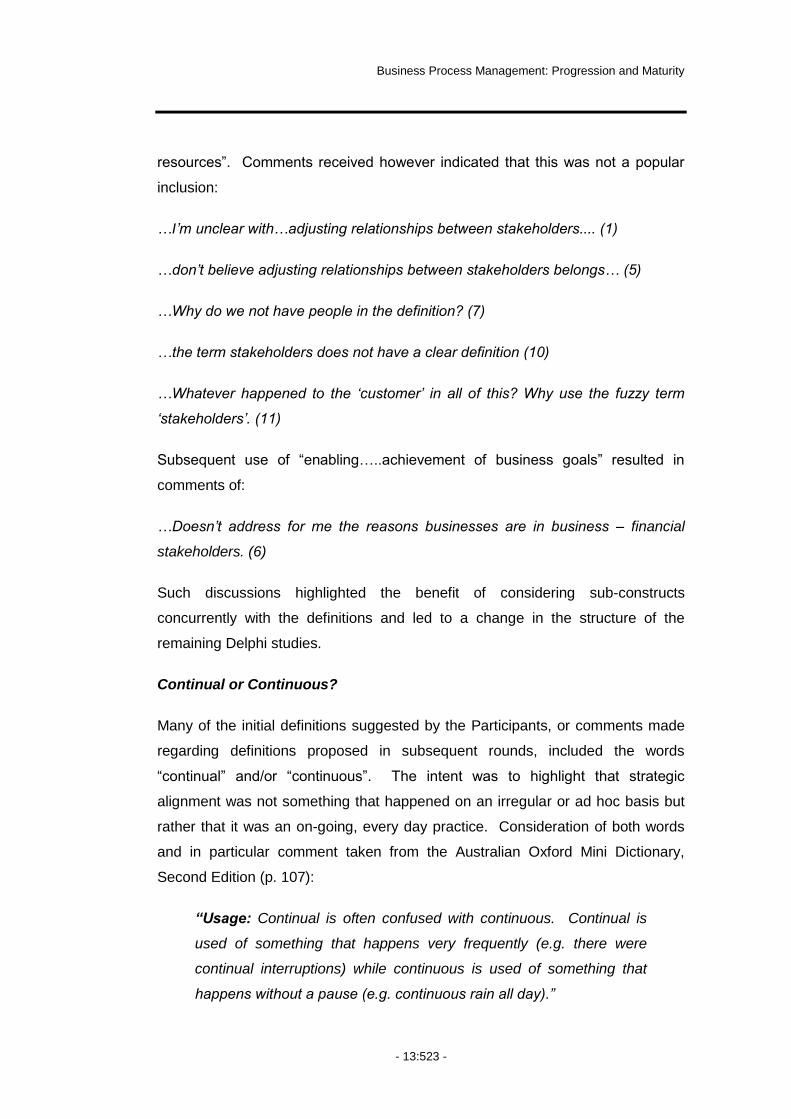
Business Process Management: Progression and Maturity
- 13:523 -
resources”. Comments received however indicated that this was not a popular
inclusion:
…I‟m unclear with…adjusting relationships between stakeholders.... (1)
…don‟t believe adjusting relationships between stakeholders belongs… (5)
…Why do we not have people in the definition? (7)
…the term stakeholders does not have a clear definition (10)
…Whatever happened to the „customer‟ in all of this? Why use the fuzzy term
„stakeholders‟. (11)
Subsequent use of “enabling…..achievement of business goals” resulted in
comments of:
…Doesn‟t address for me the reasons businesses are in business – financial
stakeholders. (6)
Such discussions highlighted the benefit of considering sub-constructs
concurrently with the definitions and led to a change in the structure of the
remaining Delphi studies.
Continual or Continuous?
Many of the initial definitions suggested by the Participants, or comments made
regarding definitions proposed in subsequent rounds, included the words
“continual” and/or “continuous”. The intent was to highlight that strategic
alignment was not something that happened on an irregular or ad hoc basis but
rather that it was an on-going, every day practice. Consideration of both words
and in particular comment taken from the Australian Oxford Mini Dictionary,
Second Edition (p. 107):
“Usage: Continual is often confused with continuous. Continual is
used of something that happens very frequently (e.g. there were
continual interruptions) while continuous is used of something that
happens without a pause (e.g. continuous rain all day).”

Appendices
- 13:524 -
On this basis, for the purposes of the definition, „continual‟ was considered to be
more appropriate than „continuous‟.
Sensing of the Environment
Inclusion of the concept of „continuously sensing the environment‟ in an earlier
version of the proposed definition caused some concern among participants.
First sentence is not bad. Second needs a lot of work…. (11)
I'm a little uneasy about the second sentence as it might imply that BPM/SA is
the same as strategy development/planning. BPM/SA is about strategy
execution and not about strategy creation. (13)
However, exclusion of the concept from the final proposed definition was not
entirely popular:
…it is not okay that you leave out the continuous sensing of the environment
….allows for traditional internal alignment of business processes and goals
without inclusion of environmental sense and respond cycles. That is contrary to
the very idea of business process management”. (9)
Such a phrase is more appropriate in a definition of process management rather
than in the factor definitions that are in the context of process management.
Capability Areas
Seven capability areas were on the final proposed list arising from the Strategic
Alignment study including:
Enterprise Processes
Strategic Priorities
Linkage of Strategy and Process Capability
Process Improvement/Innovation/Change
Operational Translation
Process Output Measurement
Extended Value Chain
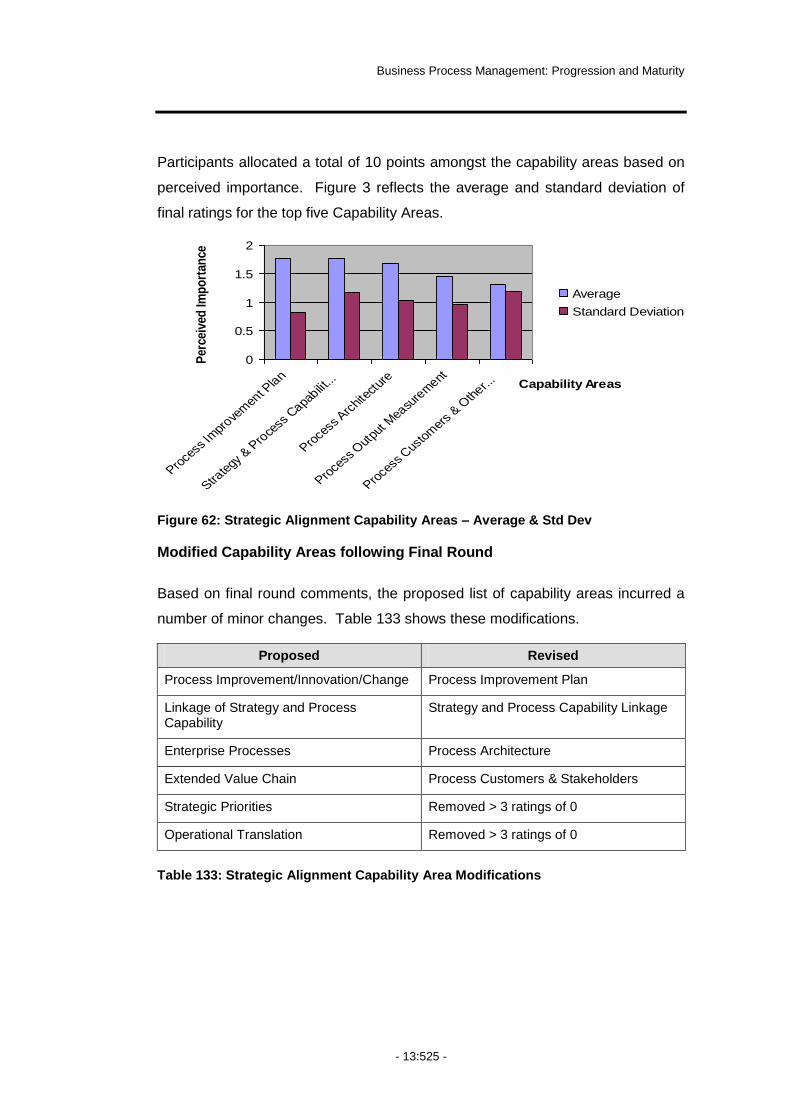
Business Process Management: Progression and Maturity
- 13:525 -
Participants allocated a total of 10 points amongst the capability areas based on
perceived importance. Figure 3 reflects the average and standard deviation of
final ratings for the top five Capability Areas.
Figure 62: Strategic Alignment Capability Areas – Average & Std Dev
Modified Capability Areas following Final Round
Based on final round comments, the proposed list of capability areas incurred a
number of minor changes. Table 133 shows these modifications.
Proposed Revised
Process Improvement/Innovation/Change Process Improvement Plan
Linkage of Strategy and Process Capability
Strategy and Process Capability Linkage
Enterprise Processes Process Architecture
Extended Value Chain Process Customers & Stakeholders
Strategic Priorities Removed > 3 ratings of 0
Operational Translation Removed > 3 ratings of 0
Table 133: Strategic Alignment Capability Area Modifications
0
0.5
1
1.5
2
Proce
ss Im
prove
men
t Pla
n
Strate
gy &
Pro
cess
Capa
bilit...
Proce
ss A
rchi
tect
ure
Proce
ss O
utpu
t Mea
sure
ment
Proce
ss C
usto
mer
s & O
ther..
. Capability Areas
Per
ceiv
ed Im
po
rtan
ce
Average
Standard Deviation

Appendices
- 13:526 -
The final list of capability areas is therefore:
Process Improvement Plan
Strategy and Process Capability Linkage
Process Architecture
Process Output Measurement
Process Customers and Stakeholders

Business Process Management: Progression and Maturity
- 13:527 -
13.2.13 Governance Delphi Study
The Governance study included three rounds. Table 134 provides a summary of
demographics for experts that completed all rounds of the Governance study.
Category
Region
Industry Academia
USA 3 4
Australia 2 1
Europe 1 -
Category Total 6 5
Table 134: Governance Expert Panel
Definition
The definition proposed for rating during the final round of the study was:
In the context of process management, Governance establishes
coherent and transparent accountability, decision-making and reward
processes to guide actions and optimize business performance.
Figure 63 shows the final ratings for the proposed definition and Figure 64 shows
the change in the average and standard deviation of ratings over the three
rounds of the Delphi Study.
Figure 63: Governance Definition – Responses per Rating
0
1
2
3
4
5
6
1 2 3 4 5 6 7 8 9 10
Definition Rating
Nu
mb
er
of
Resp
on
ses
Responses

Appendices
- 13:528 -
Figure 64: Governance Definition – Average & Standard Deviation
Major Discussion Areas
The major discussion points during the development of the Governance definition
included:
Rationalistic and Rigid wording
The wording used in definitions was of some concern:
…this is a very rationalistic view…In business process management, it is
essential to also: “effectively sensing and responding to changes in customer and
market demands”. (9)
…increasingly concerned with the way in which definitions are being phrased in
this study. As I read the definitions, I get a sense of something that is rigid,
structured and inflexible. I am concerned that we are losing sight of the fact that
processes are how work gets done. Where are purpose, passion and people?
(11)
The definition is too academic. It doesn‟t mention the use of power (formal or
informal) to support the process perspective vs. other axes. It also doesn‟t link
BP governance to BP improvement, a vital linkage. BP governance is also a set
0
1
2
3
4
5
6
7
8
9
10
1 2
Round
Defi
nit
ion
Rati
ng
Average
Standard Deviation
Business Process Management: Progression and Maturity
- 13:529 -
of decision principles that helps an organisation optimize its process performance
i.e. decision rights for processes (22)
These comments are not dissimilar to those made during the Strategic Alignment
study where there was concern over the use of the word “response” and the need
to capture the “here and now” focus of process management. The identification
and definition of six independent factors leads to an element of rigidity as
“independence” is sort with each definition. Furthermore, each factor definition is
“In the context of process management”. As such, a definition of Process
Management would incorporate global aspects such as improving business
performance and proactive action in continuously changing environments and
demands.
Final Definition Comments
A number of the expert panel highlighted areas to improve upon the final
proposed definition. These included:
“optimize”
I definitely don‟t like „optimize‟. Please consider „improve‟. The other suggests a
far too rational view. (9)
Replace „optimize‟ with „improve‟. (14)
“coherent”
Not sure if I like the word “coherent” as it is used in the definition. I would be with
“appropriate” or “relevant” instead. I also liked the phrase “standards and
controls” in the previous version… (3)
“reward processes”
I don‟t like the term “reward processes”. It is confusing. You might like to
consider using “aligned rewards” instead. (11)
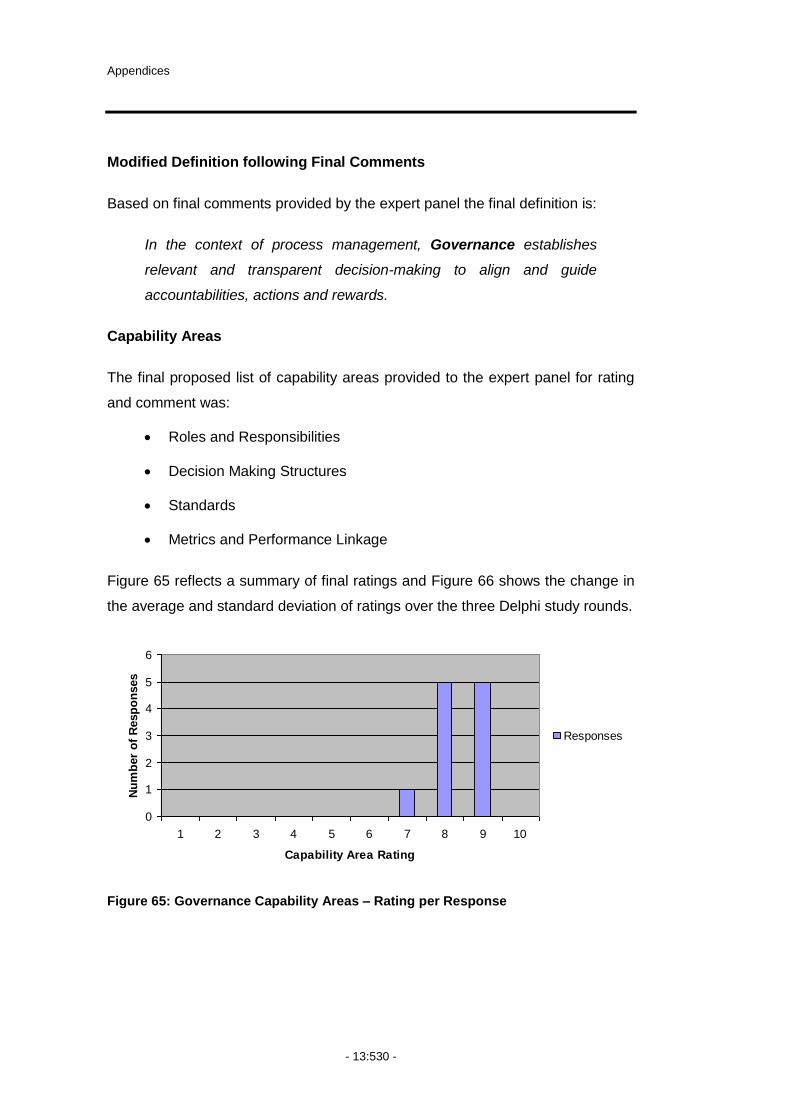
Appendices
- 13:530 -
Modified Definition following Final Comments
Based on final comments provided by the expert panel the final definition is:
In the context of process management, Governance establishes
relevant and transparent decision-making to align and guide
accountabilities, actions and rewards.
Capability Areas
The final proposed list of capability areas provided to the expert panel for rating
and comment was:
Roles and Responsibilities
Decision Making Structures
Standards
Metrics and Performance Linkage
Figure 65 reflects a summary of final ratings and Figure 66 shows the change in
the average and standard deviation of ratings over the three Delphi study rounds.
Figure 65: Governance Capability Areas – Rating per Response
0
1
2
3
4
5
6
1 2 3 4 5 6 7 8 9 10
Capability Area Rating
Nu
mb
er
of
Resp
on
ses
Responses
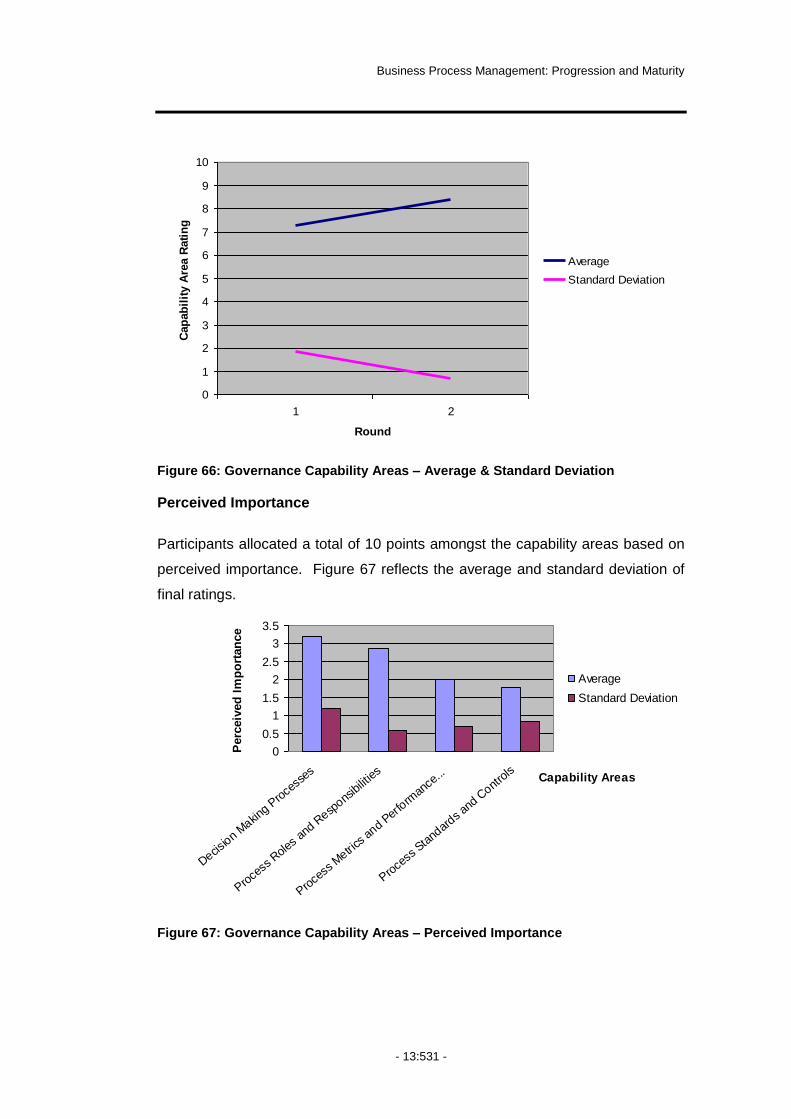
Business Process Management: Progression and Maturity
- 13:531 -
Figure 66: Governance Capability Areas – Average & Standard Deviation
Perceived Importance
Participants allocated a total of 10 points amongst the capability areas based on
perceived importance. Figure 67 reflects the average and standard deviation of
final ratings.
Figure 67: Governance Capability Areas – Perceived Importance
0
1
2
3
4
5
6
7
8
9
10
1 2
Round
Cap
ab
ilit
y A
rea R
ati
ng
Average
Standard Deviation
0
0.5
1
1.5
2
2.5
3
3.5
Decisio
n M
aking
Proce
sses
Proce
ss R
oles
and
Resp
onsib
ilitie
s
Proce
ss M
etrics
and
Perfo
rman
ce...
Proce
ss S
tand
ards
and
Contro
ls Capability Areas
Perc
eiv
ed
Im
po
rtan
ce
Average
Standard Deviation

Appendices
- 13:532 -
Final Capability Area Comments
A number of the expert panel highlighted improvements to the final proposed list
of capability areas including:
…I would add back in “controls” (3)
…metrics are defined in Strategic Alignment, in Governance we make sure that
metrics are collected and evaluated... (14)
…we should look at how the capability areas link… (15)
Modified Capability Areas following Final Comments
Based on final comments a number of minor changes occurred in the proposed
list of capability areas. Table 135 shows all such modifications.
Proposed Revised
Decision Making Structures Process Management Decision Making
Roles and Responsibilities Process Roles and Responsibilities
Metrics and Performance Linkage Process Metrics and Performance Linkage
Standards Process Standards and Process Controls
Table 135: Governance Capability Area Modifications
The final list of capability areas122 is:
Process Management Decision Making
Process Roles and Responsibilities
Process Metrics and Performance Linkage
Process Management Standards
Process Management Controls
122
The expert panel did not re-rate minor changes arising from the final round.

Business Process Management: Progression and Maturity
- 13:533 -
13.2.14 Methods Delphi Study
The Methods study included four rounds. Table 136 provides a summary of
demographics for those experts that completed all rounds of the Methods study.
Category
Region
Industry Academia
USA 3 4
Australia 2 1
Europe 1 1
Category Total 6 6
Table 136: Methods Expert Panel
Definition
The final definition proposed for rating by the expert panel was:
In the context of process management, Methods are the structured
approaches and techniques that support process-related activities to
improve business performance.
Figure 68 shows a summary of final ratings and Figure 69 shows the change in
the average and standard deviation of ratings over the four rounds of the Delphi
study.
Figure 68: Methods Definition – Responses per Rating
0
1
2
3
4
5
6
1 2 3 4 5 6 7 8 9 10
Definition Rating
Nu
mb
er
of
Resp
on
ses
Responses

Appendices
- 13:534 -
Figure 69: Methods Definition – Average and Standard Deviation
Major Discussion Areas
The major discussion points during the development of the Methods definition
included:
Methodologies, Practices, Approaches, Techniques?
The terminology used in the definition generated a significant level of discussion:
…not completely happy with the phrase “approaches and practices” (1)
Methodologies is almost redundant with “methods” so I think we should leave it
out (5)
Methods are techniques, practices, methodologies that are applied by… (10)
…”approaches” and “practices” seem similar…don‟t mention “tools and
techniques” which are different. (5)
…techniques, methodologies and practices” is rather imprecise “provides
systematic approaches…” is simpler”. (9)
0
1
2
3
4
5
6
7
8
9
10
1 2 3
Round
Defi
nit
ion
Rati
ng
Average
Standard Deviation
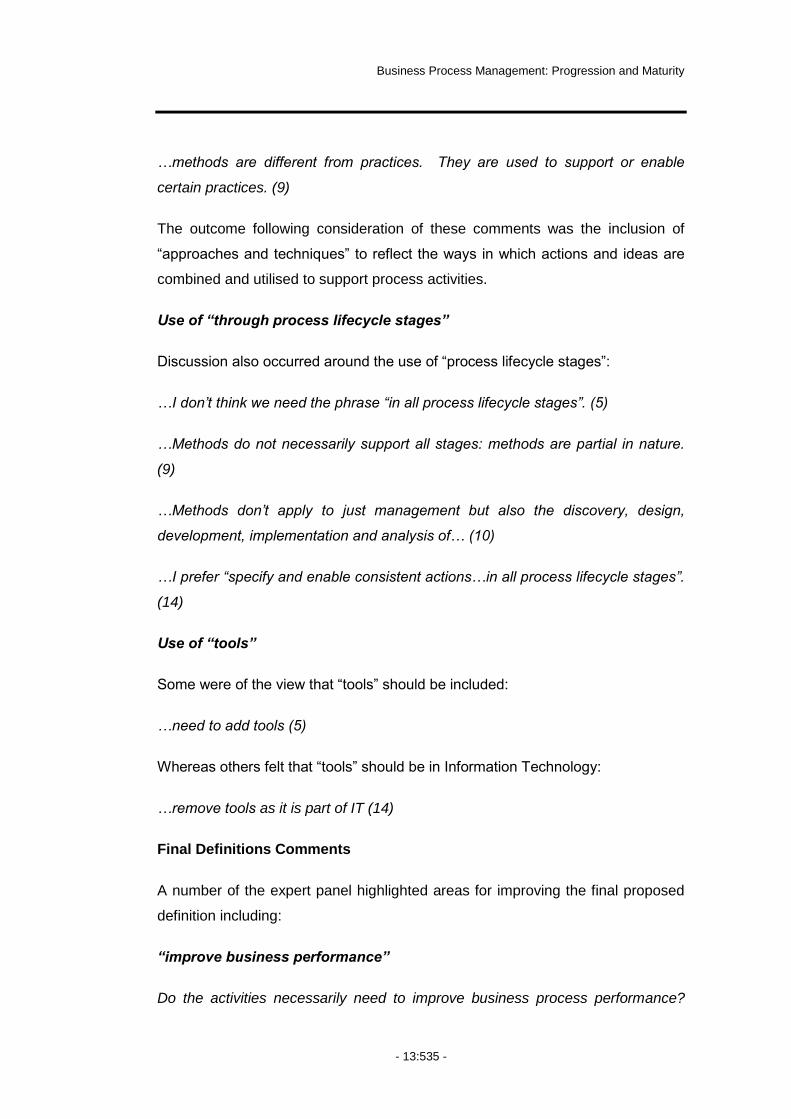
Business Process Management: Progression and Maturity
- 13:535 -
…methods are different from practices. They are used to support or enable
certain practices. (9)
The outcome following consideration of these comments was the inclusion of
“approaches and techniques” to reflect the ways in which actions and ideas are
combined and utilised to support process activities.
Use of “through process lifecycle stages”
Discussion also occurred around the use of “process lifecycle stages”:
…I don‟t think we need the phrase “in all process lifecycle stages”. (5)
…Methods do not necessarily support all stages: methods are partial in nature.
(9)
…Methods don‟t apply to just management but also the discovery, design,
development, implementation and analysis of… (10)
…I prefer “specify and enable consistent actions…in all process lifecycle stages”.
(14)
Use of “tools”
Some were of the view that “tools” should be included:
…need to add tools (5)
Whereas others felt that “tools” should be in Information Technology:
…remove tools as it is part of IT (14)
Final Definitions Comments
A number of the expert panel highlighted areas for improving the final proposed
definition including:
“improve business performance”
Do the activities necessarily need to improve business process performance?

Appendices
- 13:536 -
What if they only monitor or model “as-is”? (5)
Performance is not the only goal, think about compliance. You may want to have
methods that ensure compliance…we can just drop the “to improve business
performance”. (10)
It may be useful to state “improve and manage” instead of only “improve”. (11)
I doubt that we need “to improve business performance”. We could otherwise
have this in every definition. (14)
“process-related activities”
…”process-related activities” is a little vague. If we could be more specific with
that phrase this would be a solid definition. (3)
…”process-related activities” is too fuzzy. Personally I prefer, “specific and
enable consistent actions, behaviours and outcomes in all process lifecycle
stages”. (14)
“structured”
Do we need the word “structured”? I think an unstructured technique or
approach could qualify as a method. (5)
Modified Definition following Final Comments
Based on final comments provided by the expert panel the final definition is:
In the context of process management, Methods are the approaches
and techniques that support and enable consistent process actions
and outcomes.
Capability Areas
The final proposed list of capability areas provided to the expert panel for rating
and comment was:
Process Design and Modelling

Business Process Management: Progression and Maturity
- 13:537 -
Process Implementation and Execution
Process Control and Measurement
Process Improvement and Innovation
Process Project and Program Management
Figure 70 shows a summary of final ratings and Figure 71 shows the change in
the average and standard deviation of ratings over the four rounds of the Delphi
study.
Figure 70: Methods Capability Areas – Responses per Rating
Figure 71: Methods Capability Areas – Average & Standard Deviation
0
1
2
3
4
5
6
7
1 2 3 4 5 6 7 8 9 10
Capability Area Rating
Nu
mb
er
of
Resp
on
ses
Responses
0
1
2
3
4
5
6
7
8
9
10
1 2 3
Round
Cap
ab
ilit
y A
rea R
ati
ng
Average
Standard Deviation
Appendices
- 13:538 -
Perceived Importance
Participants allocated a total of 10 points amongst the capability areas based on
perceived importance. Figure 72 reflects the average and standard deviation of
final ratings.
Figure 72: Methods Capability Areas – Perceived Importance
Final Capability Area Comments
A number of the expert panel highlighted improvements for the final capability
areas including:
Should include a capability area of change management methods (e.g.
stakeholder analysis). (5)
…concern that we change over to general criteria earlier than in other factors.
Why do we not continue with „content‟…additional detail is confusing as they are
very selective. (14)
These comments did not result in any further changes to the list.
0
0.5
1
1.5
2
2.5
Proce
ss D
esig
n an
d Mod
elling
Proce
ss Im
plem
entatio
n and
Exe
...
Proce
ss C
ontro
l and
Meas
urem
ent
Proce
ss Im
prov
ement
and
Innov
ation
Proce
ss P
roje
ct a
nd P
rogra
m M
...Capability Areas
Perc
eiv
ed
Im
po
rtan
ce
Average
Standard Deviation

Business Process Management: Progression and Maturity
- 13:539 -
Modified Capability Areas following Final Comments
The final list of capability areas is:
Process Design and Modelling
Process Implementation and Execution
Process Control and Measurement
Process Improvement and Innovation
Process Project and Program Management


Business Process Management: Progression and Maturity
- 13:541 -
13.2.15 Information Technology Delphi Study
The Information Technology study included four rounds. Table 137 provides a
summary of demographics for those experts that completed all rounds of the
Information Technology study.
Category
Region
Industry Academia
USA 3 3
Australia 2 1
Europe 1 1
Category Total 6 5
Table 137: Information Technology Expert Panel
Definition
The final definition proposed for rating by the expert panel was:
In the context of process management, Information Technology is
the software, hardware and information systems that enable process
awareness, productivity and flexibility to improve business
performance.
Figure 73 shows a summary of final ratings and Figure 74 shows the change in
the average and standard deviation of ratings over the four rounds of the Delphi
study.

Appendices
- 13:542 -
Figure 73: Information Technology Definition – Responses per Rating
Figure 74: IT Definition – Average and Standard Deviation
Major Discussion Areas
The major discussion points during the development of the Information
Technology definition included:
Automated Support?
The terminology used in the definition generated a significant level of discussion:
…disagree with describing IT as “automated support”. IT = software, hardware
and information (5)
0
1
2
3
4
5
6
1 2 3 4 5 6 7 8 9 10
Definition Rating
Nu
mb
er
of
Resp
on
ses
Responses
0
1
2
3
4
5
6
7
8
9
10
1 2 3
Round
Defi
nit
ion
Rati
ng
Average
Standard Deviation

Business Process Management: Progression and Maturity
- 13:543 -
…does not define information technology in relation to other technologies that
automate support (9)
…should only cover the information related tools, systems and infrastructures (9)
Automated support is too much…automation is not the main focus (10)
…IT function can also provide the inspiration to innovation by way of informing
(not merely supporting)… (12)
…too generic…could easily be talking about some general support tools…maybe
put “automated” back in i.e. “automated management systems”… (13)
Do not exclude semi-automated, cross-organisational (14)
“Automated support” was therefore removed from the proposed definition.
“efficiency and effectiveness”
Discussion occurred around the use of “efficiency and effectiveness”:
…are too limited not taking agility into account. (9)
…would include office software such as MS-Word which improves efficiency and
effectiveness…too unspecific for my taste. (10)
…need some mechanism to make sure all definitions are similar…why do we
stress improved efficiency and effectiveness here but not with the other
factors…(14)
“infrastructure”
Discussion occurred around the use of “infrastructure”:
…infrastructure can be IT based or not. (5)
There are other infrastructure types (e.g. facilities such as building) that are not
IT specific… (12)
Appendices
- 13:544 -
“through process lifecycle stages”
Discussion occurred around the use of “process lifecycle stages”:
…“all process lifecycle stages” is assumed and therefore not necessary. (5)
why don‟t we just say support for all business process lifecycle stages?...(14)
Final Definition Comments
A number of the expert panel highlighted improvements to the final proposed
definition including:
“improve business performance”
…improve is superfluous taking “enable” into account (9)
…can we phrase more in alignment with methods (14)
“process awareness, productivity, flexibility”
…what is process awareness…what is process productivity…what is process
flexibility…improving process performance = productivity and flexibility hence
redundant… (5)
…sounds more complicated than the previous one…”productivity and flexibility”
sound very selective…(14)
“information systems”
Software, hardware and information systems sound odd. Information systems in
some definitions contain software, hardware and the surrounding organisational
units…does the system label add value…(10)
“is the” or “are the”
Questions over the use of “is the” included:
“is the” should be “are the”. (10)

Business Process Management: Progression and Maturity
- 13:545 -
Should it be “are” not “is”? (14)
Modified Definition following Final Comment
Based on final comments by the expert panel the final definition was:
In the context of process management, Information Technology is
the software, hardware and information management systems that
enable and support process activities.
Capability Areas
The final proposed list of capability areas provided to the expert panel for rating
and comment was:
Process Design and Modelling
Process Implementation and Execution
Process Control and Measurement
Process Improvement and Innovation
Process Project and Program Management
Figure 75 shows a summary of final ratings and Figure 76 shows the change in
the average and standard deviation of ratings over the four rounds of the Delphi
study.
Figure 75: IT Capability Areas – Responses per Rating
0
1
2
3
4
5
6
7
1 2 3 4 5 6 7 8 9 10
Capability Area Rating
Nu
mb
er
of
Resp
on
ses
Responses

Appendices
- 13:546 -
Figure 76: IT Capability Area – Average and Standard Deviation
Perceived Importance
Participants allocated a total of 10 points amongst the capability areas based on
perceived importance. Figure 77 reflects the average and standard deviation of
final ratings.
Figure 77: IT Capability Area – Perceived Importance
0
1
2
3
4
5
6
7
8
9
10
1 2 3
Round
Cap
ab
ilit
y A
rea R
ati
ng
Average
Standard Deviation
0
0.5
1
1.5
2
2.5
3
3.5
Proce
ss D
esig
n an
d Mod
elling
Proce
ss Im
plem
entatio
n and
Exp
e...
Proce
ss C
ontro
l and
Meas
urem
ent
Proce
ss Im
prov
ement
and
Innov
ation
Proce
ss P
roje
ct a
nd P
rogra
m M
... Capability Areas
Perc
eiv
ed
Im
po
rtan
ce
Average
Standard Deviation

Business Process Management: Progression and Maturity
- 13:547 -
Final Capability Area Comments
A number of the expert panel highlighted improvements to the final proposed list
of capability areas including:
What about change management as a capability area? What is an example of
process improvement and innovation information technology? What is that? I
don‟t get that category. (5)
…it would be good if the additional detail column was more IT specific... (14)
These comments did not result in any changes to the list of capability areas.
Modified Capability Areas following Final Comments
The final list of capability areas is:
Process Design and Modelling
Process Implementation and Execution
Process Control and Measurement
Process Improvement and Innovation
Process Project and Program Management


Business Process Management: Progression and Maturity
- 13:549 -
13.2.16 People Delphi Study
The People study included three rounds. Table 138 provides a summary of
demographics for those experts that completed all rounds of People study.
Category
Region
Industry Academia
USA 5 4
Australia 2 1
Europe 1 1
Category Total 8 6
Table 138: People Expert Panel
Definition
The final definition proposed for rating by Participants was:
In the context of process management, People are the individuals
and groups who continually enhance and apply their process-related
skills, expertise and knowledge to improve business performance.
Figure 78 shows a summary of final ratings and Figure 79 shows the change in
the average and standard deviation of ratings over the three rounds of the study.
Figure 78: People Definition – Responses per Rating
0
1
2
3
4
5
6
7
1 2 3 4 5 6 7 8 9 10
Definition Rating
Nu
mb
er
of
Resp
on
ses
Responses

Appendices
- 13:550 -
Figure 79: People Definition – Average and Standard Definition
Major Discussion Areas
The major discussion points during the development of the People definition
include:
Skills, expertise, knowledge, talents, abilities?
The terminology used in the definition generated a significant level of discussion:
…skills is very similar to talents so just use skills (5)
“Abilities, expertise, knowledge and talents” is far too imprecise. Why not simply
knowledge? (9)
I find the distinction between expertise and knowledge too fuzzy (10)
Do you have a clear differentiation for ability, expertise, knowledge, talent? (14)
Education, training, learning?
Discussion occurred around the use of “education and training”:
…education and training are ways of affecting the process skills… (5)
0
1
2
3
4
5
6
7
8
9
10
1 2
Round
Defi
nit
ion
Rati
ng
Average
Standard Deviation

Business Process Management: Progression and Maturity
- 13:551 -
What is the difference between education and training? (10)
I wonder whether „learning‟ might not be a better term than „education? (24)
Process-orientation?
Discussion occurred around the use of “process-orientation”:
Did we address organisational structure in one of the other factors? (3)
…What does “drivers of process-orientation” mean? I think we should take that
out… (5)
“process-orientation” should not be an end in itself, but a means to an end, the
end being improved business performance. (12)
I do not like the „marketing-slang‟… (14)
Replace process-orientation by “learning organisation” and the definition is still
valid. (16)
Final Definition Comments
A number of the expert panel highlighted improvements to the final proposed
definition including:
Skills, expertise and knowledge?
The terminology used in the definition generated a significant level of discussion:
I still think that „skills, expertise and knowledge‟ are too overlapping terms, and
hence too imprecise. Better would be „experience and knowledge‟ in that these
are distinct categories. (9)
I find the distinction between expertise and knowledge too fuzzy (10)
Modified Definition following Final Comment
Based on final comments provided by the expert panel the final definition is:

Appendices
- 13:552 -
In the context of process management, People are the individuals
and groups who continually enhance and apply their process-related
expertise and knowledge.
Capability Areas
The final proposed list of capability areas provided to the expert panel for rating
and comment was:
Process Skills and Expertise
BPM Education and Learning
Process Collaboration and Communication
BPM Knowledge
BPM Leaders
Figure 80 shows a summary of final ratings and Figure 81 shows the change in
the average and standard deviation of ratings over the three rounds of the Delphi
study.
Figure 80: People Capability Areas – Response per Rating
0
1
2
3
4
5
6
7
8
1 2 3 4 5 6 7 8 9 10
Capability Area Rating
Nu
mb
er
of
Resp
on
ses
Responses

Business Process Management: Progression and Maturity
- 13:553 -
Figure 81: People Capability Areas – Average and Standard Deviation
Perceived Importance
Participants allocated a total of 10 points amongst the capability areas based on
perceived importance. Figure 82 reflects the average and standard deviation of
final ratings.
Figure 82: People Capability Areas – Perceived Importance
0
1
2
3
4
5
6
7
8
9
10
1 2
Round
Cap
ab
ilit
y A
rea R
ati
ng
Average
Standard Deviation
0
0.5
1
1.5
2
2.5
Proce
ss S
kills
& E
xperti
se
Proce
ss M
anage
men
t Kno
wle
dge
Proce
ss E
ducatio
n & L
earn
ing
Proce
ss C
olla
borat
ion
& Com
mu.
..
Proce
ss M
anage
men
t Lea
ders Capability Areas
Perc
eiv
ed
Im
po
rtan
ce
Average
Standard Deviation

Appendices
- 13:554 -
Final Capability Area Comments
A number of the expert panel highlighted improvements to the final proposed list
of capability areas including:
“BPM”
I don‟t like the term BPM – I suggest we use process management. (5)
I would prefer not to use the abbreviation BPM as it is too often applied only to
software and not to the broader issues. (11)
I am confused by the terms „process‟ and „BPM – what‟s the distinction between
the two? (24)
“Leaders”
…leadership including Leaders belongs to Culture, I guess it is too difficult to
separate leadership and leaders? (14)
Leadership is critical to make the individuals effective in improving…they must be
encouraged by leaders… (20)
We list „BPM Leaders‟ – don‟t we mean „leadership‟? (24)
Modified Capability Areas following Final Comments
Based on final comments there were a number of minor changes to the proposed
list of capability areas. Table 139 shows all modifications.
Proposed Revised
BPM Knowledge Process Management Knowledge
BPM Education and Learning Process Education & Learning
BPM Leaders Process Management Leaders
Table 139: People Capability Area Modifications

Business Process Management: Progression and Maturity
- 13:555 -
The final list of Capability Areas is:
Process Skills and Expertise
Process Management Knowledge
Process Based Education
Process Collaboration
Process Management Leaders
The expert panel did not re-rate minor changes to the final capability areas.


Business Process Management: Progression and Maturity
- 13:557 -
13.2.17 Culture Delphi Study
The Culture study included three rounds. Table 140 provides a summary of
demographics for those experts that completed all rounds of the Culture study.
Category
Region
Industry Academia
USA 3 4
Australia 2 1
Europe 1 -
Category Total 6 5
Table 140: Culture Expert Panel
Definition
The final definition proposed for rating by the expert panel was:
In the context of process management, Culture is the collective
values and beliefs that shape process-related attitudes and
behaviours to improve business performance.
Figure 83 shows a summary of final ratings and Figure 84 shows the change in
the average and standard deviation of ratings over the three rounds of the study.
Figure 83: Culture Definition – Responses per Rating
0
1
2
3
4
5
6
1 2 3 4 5 6 7 8 9 10
Definition Rating
Nu
mb
er
of
Resp
on
ses
Responses

Appendices
- 13:558 -
Figure 84: Culture Definition – Average and Standard Deviation
Major Discussion Areas
The definition for Culture was highly rated by the expert panel from the first
proposed definition. There was little discussion about the proposed definition.
Final Definition Comments
There were no final comments that led to changes in the final proposed definition.
Comments about the redundancy of the phrase to improve business performance
within all definitions led to its removal.
Modified Definition following Final Comment
The final culture definition is:
In the context of process management, Culture is the collective
values and beliefs that shape process-related attitudes and
behaviours.
0
1
2
3
4
5
6
7
8
9
10
1 2
Round
Defi
nit
ion
Rati
ng
Average
Standard Deviation

Business Process Management: Progression and Maturity
- 13:559 -
Capability Areas
The final proposed list of Capability Areas provided to Participants for rating and
comment was:
BPM Values and Beliefs
Process-related Attitudes and Behaviours
Responsiveness to Change
Attention to BPM
BPM Networks
Figure 85 shows a summary of final ratings and Figure 86 shows the change in
the average and standard deviation of ratings over the three rounds of the Delphi
study.
Figure 85: Culture Capability Areas – Responses per Rating
0
1
2
3
4
5
6
1 2 3 4 5 6 7 8 9 10
Capability Area Rating
Nu
mb
er
of
Resp
on
ses
Responses

Appendices
- 13:560 -
Figure 86: Culture Capability Areas – Average & Standard Deviation
Perceived Importance
Participants allocated a total of 10 points amongst the capability areas based on
perceived importance. Figure 87 reflects the average and standard deviation of
final ratings.
Figure 87: Culture Capability Areas – Perceived Importance
0
1
2
3
4
5
6
7
8
9
10
1 2
Round
Cap
ab
ilit
y A
rea R
ati
ng
Average
Standard Deviation
0
0.5
1
1.5
2
2.5
Respons
iven
ess T
o Pro
cess
Cha
nge
Proce
ss V
alues
& B
elie
fs
Proce
ss A
ttitu
des &
Beh
aviors
Lead
ersh
ip A
ttentio
n to P
roce
ss...
Proce
ss M
anage
men
t Soc
ial N
et...
Capability Areas
Perc
eiv
ed
Im
po
rtan
ce
Average
Standard Deviation

Business Process Management: Progression and Maturity
- 13:561 -
Final Capability Area Comments
There were no direct comments about the final list of capability areas, with most
comments directed at the mapping for the various capability areas.
Modified Capability Areas following Final Comments
Based on final comments minor changes occurred in the proposed list of
capability areas. Table 141 shows all such modifications.
Proposed Revised
Responsiveness to Change Responsiveness to Process Change
BPM Values and Beliefs Process Based Values and Beliefs
Process-related Attitudes and Behaviours Process Based Attitudes and Behaviours
Attention to BPM Leadership Attention to Process
BPM Networks Process Management Social Networks
Table 141: Culture Capability Area Modifications
The final list of capability areas123 is:
Responsiveness to Process Change
Process Based Values and Beliefs
Process Based Attitudes and Behaviours
Leadership Attention to Process
Process Management Social Networks
123
The Panel did not re-rate changes to definitions and capability areas made following final round comments.

Business Process Management: Progression and Maturity
- 13:563 -
13.2.18 Final Executive Summary: Table of Contents
Process Management Maturity
Delphi Study: Executive Summary
Tonia de Bruin
Brisbane, September 2005
Appendices
- 13:564 -
Process Management Maturity Delphi Study
Executive Summary
Table of Contents
1.0 Introduction ................................................................................................ 3
2.0 Final Definitions ......................................................................................... 3
3.0 Final Capability Areas ................................................................................ 4
4.0 Outstanding Issues .................................................................................... 5
5.0 Next Steps ................................................................................................. 5
6.0 Acknowledgements .................................................................................... 5
Figures and Tables Figure 1: Final Definition Ratings ..................................................................... 3
Figure 2: Final Capability Areas ....................................................................... 4
Figure 3: Final Capability Area Ratings ........................................................... 4
Table 1: Expert Panelists ................................................................................. 6

Business Process Management: Progression and Maturity
- 13:565 -
13.2.19 Final Series Summary: Table of Contents & Appendix
Process Management Maturity
Delphi Study: Series Summary
Tonia de Bruin
Brisbane, September 2005

Appendices
- 13:566 -
Table of Contents
1. Strategic Alignment ............................................................................................. 1
1.1 Definition ........................................................................................................ 1
1.1.1 Major Discussion Areas 2
1.1.2 Final Definition Comments 3
1.1.3 Modified Definition following Final Comments 4
1.2 Capability Areas ............................................................................................. 4
1.2.1 Modified Capability Areas following Final Round 5
1.3 Respondents ................................................................................................. 5
2. Governance ......................................................................................................... 6
2.1 Definition ........................................................................................................ 6
2.1.1 Major Discussion Areas 7
2.1.2 Final Definition Comments 7
2.1.3 Modified Definition following Final Comments 7
2.2 Capability Areas ............................................................................................. 8
2.2.1 Perceived Importance 9
2.2.2 Final Capability Area Comments 9
2.2.3 Modified Capability Areas following Final Comments 9
2.3 Respondents ............................................................................................... 10
3. Methods ............................................................................................................ 11
3.1 Definition ...................................................................................................... 11
3.1.1 Major Discussion Areas 12
3.1.2 Final Definitions Comments 13
3.1.3 Modified Definition following Final Comments 13
3.2 Capability Areas ........................................................................................... 13
3.2.1 Perceived Importance 15
3.2.2 Final Capability Area Comments 15
3.2.3 Modified Capability Areas following Final Comments 15
3.3 Respondents ............................................................................................... 16
4. Information Technology ..................................................................................... 17
4.1 Definition ...................................................................................................... 17
4.1.1 Major Discussion Areas 18
4.1.2 Final Definition Comments 18
4.1.3 Modified Definition following Final Comment 19
4.2 Capability Areas ........................................................................................... 19
4.2.1 Perceived Importance 21
4.2.2 Final Capability Area Comments 21
4.2.3 Modified Capability Areas following Final Comments 21
4.3 Respondents ............................................................................................... 22
5. People ............................................................................................................... 23
5.1 Definition ...................................................................................................... 23
5.1.1 Major Discussion Areas 24

Business Process Management: Progression and Maturity
- 13:567 -
Table of Figures
Figure 1: Strategic Alignment Definition Results: Responses per Rating ....................... 1
Figure 2: Strategic Alignment Definition Results: Average & Standard Deviation ........... 1
Figure 3: Strategic Alignment Capability Area Results: Average and Standard Deviation 4
Figure 4: Governance Definition Results: Responses per Rating ................................. 6
Figure 5: Governance Definition Results: Average & Standard Deviation ...................... 6
Figure 6: Governance Capability Area Results: Responses per Rating ......................... 8
Figure 7: Governance Capability Area Results: Average & Standard Deviation ............. 8
Figure 8: Governance Capability Area Results: Perceived Importance ......................... 9
Figure 9: Methods Definition Results: Responses per Rating..................................... 11
Figure 10: Methods Definition Results: Average & Standard Deviation ....................... 11
Figure 11: Methods Capability Area Results: Responses per Rating .......................... 14
Figure 12: Methods Capability Area Results: Average & Standard Deviation............... 14
Figure 13: Methods Capability Area Results: Perceived Importance ........................... 15
Figure 14: Information Technology Definition Results: Responses per Rating ............. 17
Figure 15: Information Technology Definition Results: Average & Standard Deviation . 17
Figure 16: Information Technology Capability Area Results: Responses per Rating..... 20
Figure 17: Information Technology Capability Area Results: Average & Standard Dev . 20
Figure 18: Information Technology Capability Area Results: Perceived Importance ..... 21
Figure 19: People Definition Results: Responses per Rating ..................................... 23
Figure 20: People Definition Results: Average & Standard Deviation ......................... 23
Figure 21: People Capability Area Results: Responses per Rating............................. 25
Figure 22: People Capability Area Results: Average & Standard Deviation ................. 25
Figure 23: People Capability Area Results: Perceived Importance ............................. 26
Figure 24: Culture Definition Results: Responses per Rating ..................................... 28
Figure 25: Culture Definition Results: Average & Standard Deviation ......................... 28
Figure 26: Culture Capability Area Results: Responses per Rating ............................ 29
Figure 27: Culture Capability Area Results: Average & Standard Deviation................. 30
Figure 28: Culture Capability Area Results: Perceived Importance ............................. 30

Appendices
- 13:568 -
List of Tables
Table 1: Strategic Alignment Capability Area Modifications ....................................... 5
Table 2: Strategic Alignment Respondent Demographics .......................................... 5
Table 3: Governance Capability Area Modifications .................................................. 9
Table 4: Governance Respondent Demographics .................................................. 10
Table 5: Methods Respondent Demographics ........................................................ 16
Table 6: Information Technology Respondent Demographics .................................. 22
Table 7: People Capability Area Modifications ....................................................... 27
Table 8: People Respondent Demographics .......................................................... 27
Table 9: Culture Capability Area Modifications ....................................................... 31
Table 10: Culture Respondent Demographics ........................................................ 31

Business Process Management: Progression and Maturity
- 13:569 -
13.2.20 Mapping of Original Items to Capability Areas
Strategic Alignment Additional Details
Capability Area Additional Detail
Process Improvement Plan a) Explicit/specific incorporation of strategy in process improvement plan
b) Model/map showing linkage between process improvement and strategy execution
c) Plan for process improvement based on strategic prioritization
d) Specific process improvement targets
e) Defined PIP review cycles including monitoring and measurement of progress
f) Process performance measures related to business goals
g) Continuous practice enhancement
Strategy and Process Capability Linkage
a) Model/map showing linkage between strategy and process capabilities
b) Clear process for linking strategy and process capability
c) Identification of process bottlenecks / inhibitors
d) Process resourcing strategy (principles for what processes will be done in-house vs. contracted)
e) Defined review cycles incorporating loop between strategy and process
Process Architecture a) Identification/Existence of Enterprise Processes
b) Documentation/Design of Enterprise Processes
c) Model/map of Enterprise Processes
d) Localization/variants of Enterprise Processes
e) Execution/deployment of Enterprise Processes
Process Output Measurement a) Financial Achievement
i) Profitability
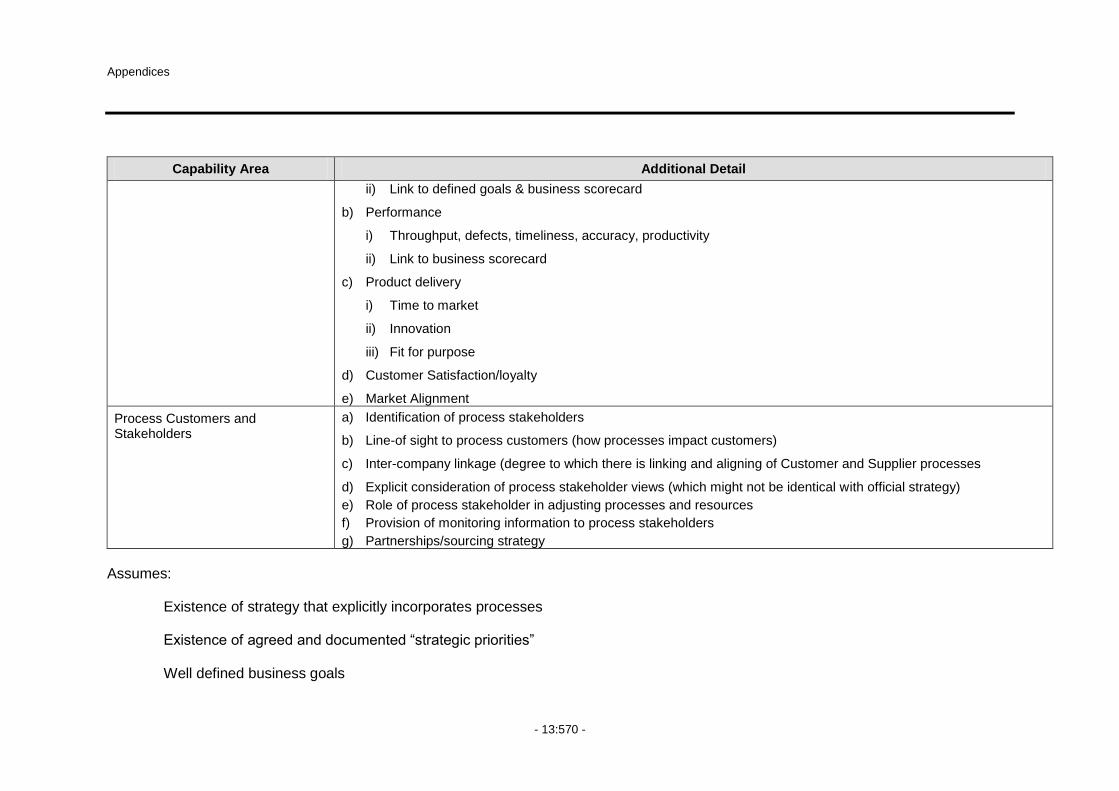
Appendices
- 13:570 -
Capability Area Additional Detail
ii) Link to defined goals & business scorecard
b) Performance
i) Throughput, defects, timeliness, accuracy, productivity
ii) Link to business scorecard
c) Product delivery
i) Time to market
ii) Innovation
iii) Fit for purpose
d) Customer Satisfaction/loyalty
e) Market Alignment
Process Customers and Stakeholders
a) Identification of process stakeholders
b) Line-of sight to process customers (how processes impact customers)
c) Inter-company linkage (degree to which there is linking and aligning of Customer and Supplier processes
d) Explicit consideration of process stakeholder views (which might not be identical with official strategy)
e) Role of process stakeholder in adjusting processes and resources
f) Provision of monitoring information to process stakeholders
g) Partnerships/sourcing strategy
Assumes:
Existence of strategy that explicitly incorporates processes
Existence of agreed and documented “strategic priorities”
Well defined business goals
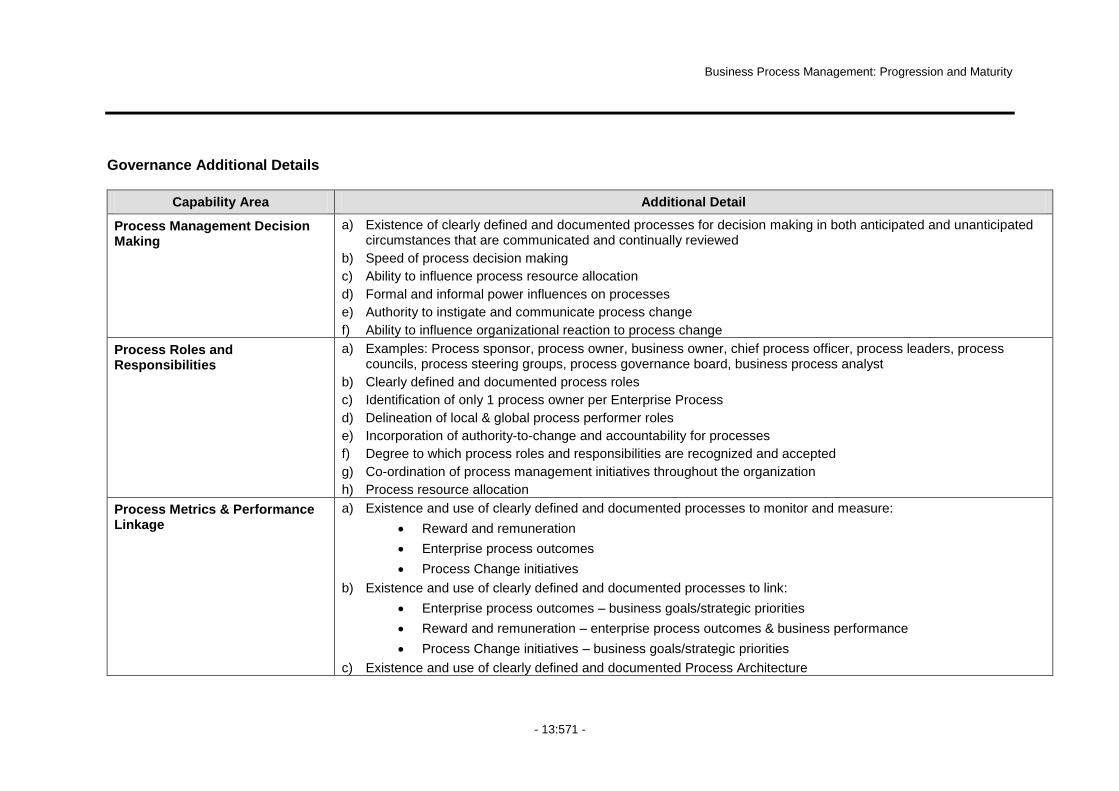
Business Process Management: Progression and Maturity
- 13:571 -
Governance Additional Details
Capability Area Additional Detail
Process Management Decision Making
a) Existence of clearly defined and documented processes for decision making in both anticipated and unanticipated circumstances that are communicated and continually reviewed
b) Speed of process decision making
c) Ability to influence process resource allocation
d) Formal and informal power influences on processes
e) Authority to instigate and communicate process change
f) Ability to influence organizational reaction to process change
Process Roles and Responsibilities
a) Examples: Process sponsor, process owner, business owner, chief process officer, process leaders, process councils, process steering groups, process governance board, business process analyst
b) Clearly defined and documented process roles
c) Identification of only 1 process owner per Enterprise Process
d) Delineation of local & global process performer roles
e) Incorporation of authority-to-change and accountability for processes
f) Degree to which process roles and responsibilities are recognized and accepted
g) Co-ordination of process management initiatives throughout the organization
h) Process resource allocation
Process Metrics & Performance Linkage
a) Existence and use of clearly defined and documented processes to monitor and measure:
Reward and remuneration
Enterprise process outcomes
Process Change initiatives
b) Existence and use of clearly defined and documented processes to link:
Enterprise process outcomes – business goals/strategic priorities
Reward and remuneration – enterprise process outcomes & business performance
Process Change initiatives – business goals/strategic priorities
c) Existence and use of clearly defined and documented Process Architecture
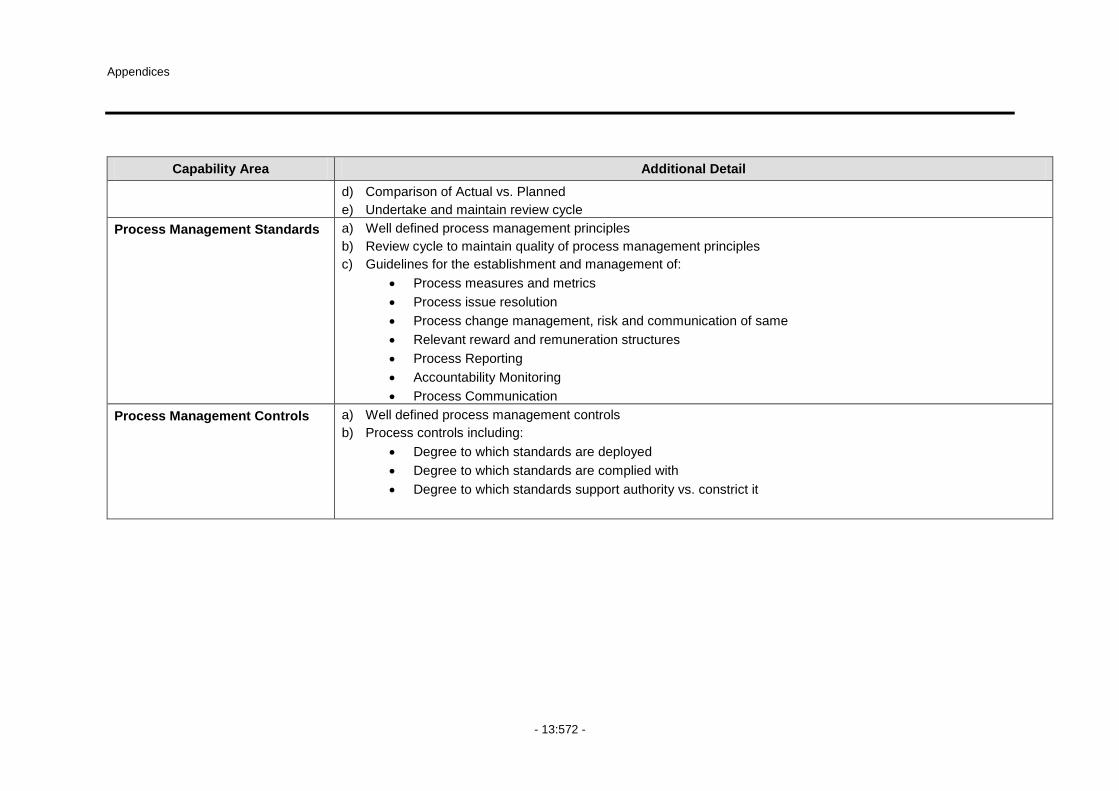
Appendices
- 13:572 -
Capability Area Additional Detail
d) Comparison of Actual vs. Planned
e) Undertake and maintain review cycle
Process Management Standards a) Well defined process management principles
b) Review cycle to maintain quality of process management principles
c) Guidelines for the establishment and management of:
Process measures and metrics
Process issue resolution
Process change management, risk and communication of same
Relevant reward and remuneration structures
Process Reporting
Accountability Monitoring
Process Communication
Process Management Controls a) Well defined process management controls
b) Process controls including:
Degree to which standards are deployed
Degree to which standards are complied with
Degree to which standards support authority vs. constrict it
a)

Business Process Management: Progression and Maturity
- 13:573 -
Methods Additional Details
Capability Area Additional Detail
Process Design and Modelling a) Sophistication of Process Design and Modelling method/s
Level of support and documentation
Ability to customize
Linkage to suitable software/tool
b) Suitability and Fit of Process Design and Modelling method/s
Compatibility with process management approach
Degree of integration with other process-related methods
Assessment against industry practice
c) Accessibility and Usage of Process Design and Modelling method/s
Measurable contribution use makes to achievement of process related objectives
Availability throughout organization
Availability to customers and suppliers
Consistency of application
Process Implementation and Execution
a) Sophistication of Process Implementation and Execution method/s
Level of support and documentation
Ability to customize
Linkage to suitable software/tool
b) Suitability and Fit of Process Implementation and Execution method/s
Compatibility with process management approach
Degree of integration with other process-related methods
Assessment against industry practice
c) Accessibility and Usage of Process Implementation and Execution method/s
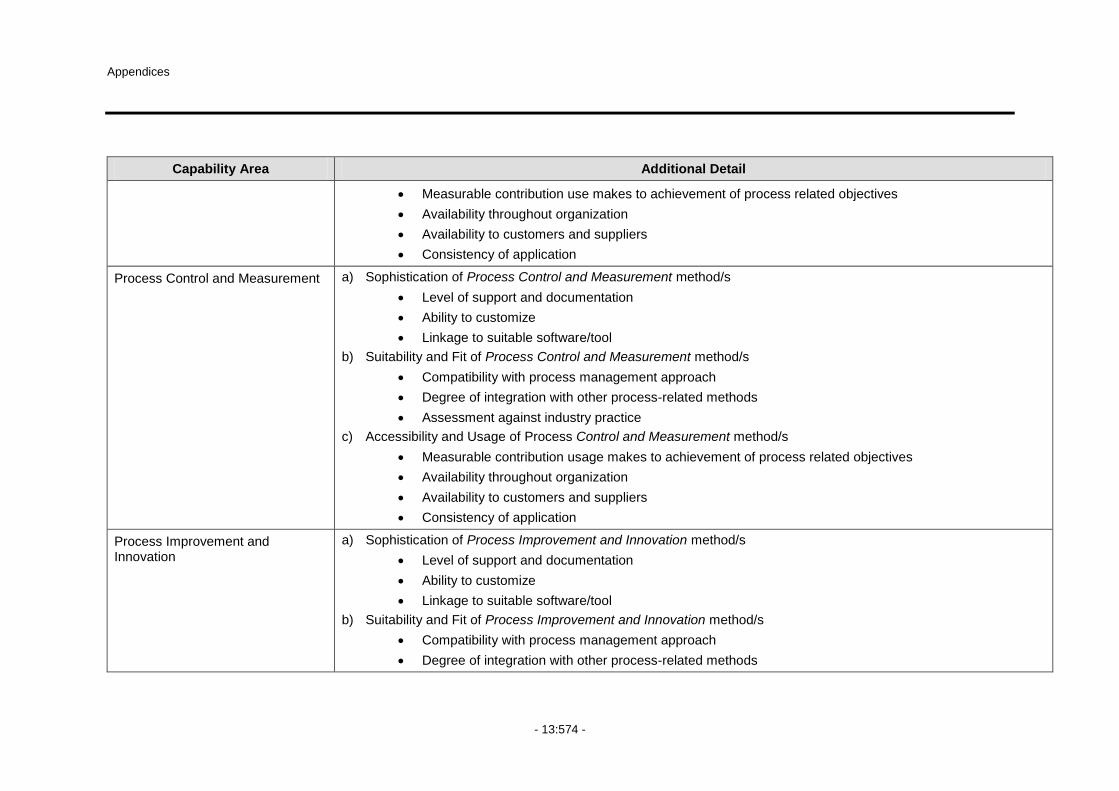
Appendices
- 13:574 -
Capability Area Additional Detail
Measurable contribution use makes to achievement of process related objectives
Availability throughout organization
Availability to customers and suppliers
Consistency of application
Process Control and Measurement a) Sophistication of Process Control and Measurement method/s
Level of support and documentation
Ability to customize
Linkage to suitable software/tool
b) Suitability and Fit of Process Control and Measurement method/s
Compatibility with process management approach
Degree of integration with other process-related methods
Assessment against industry practice
c) Accessibility and Usage of Process Control and Measurement method/s
Measurable contribution usage makes to achievement of process related objectives
Availability throughout organization
Availability to customers and suppliers
Consistency of application
Process Improvement and Innovation
a) Sophistication of Process Improvement and Innovation method/s
Level of support and documentation
Ability to customize
Linkage to suitable software/tool
b) Suitability and Fit of Process Improvement and Innovation method/s
Compatibility with process management approach
Degree of integration with other process-related methods

Business Process Management: Progression and Maturity
- 13:575 -
Capability Area Additional Detail
Assessment against industry practice
c) Accessibility and Usage of Process Improvement and Innovation method/s
Measurable contribution usage makes to achievement of process related objectives
Availability throughout organization
Availability to customers and suppliers
Consistency of application
Process Project and Program Management
a) Sophistication of Process Project and Program Management method/s
Level of support and documentation
Ability to customize
Linkage to suitable software/tool
b) Suitability and Fit of Process Project and Program Management method/s
Compatibility with process management approach
Degree of integration with other process-related methods
Assessment against industry practice
c) Accessibility and Usage of Process Project and Program Management method/s
Measurable contribution usage makes to achievement of process-related objectives
Availability throughout organization
Availability to customers and suppliers
Consistency of application

Appendices
- 13:576 -
Information Technology Additional Details
Capability Area Additional Detail
Process Design and Modelling a) Sophistication of Process Design and Modelling IT
Level of support and documentation (including use of SMART (specific, measurable, agreed, relevant, time-bound) Service Level Agreements)
Ability to customize
Linkage to suitable method
Degree to which process-related ID/security/privacy issues are incorporated
Level of (meaningful) automation
Extent to which design and modelling performance data are captured within the IT
b) Suitability and Fit of Process Design and Modelling IT
Compatibility with process management approach
Degree of integration with other IT
Degree to which based on business requirements
c) Accessibility and Usage of Process Design and Modelling IT
Measurable contribution usage makes to achievement of process related objectives
Availability through organization
Availability to suppliers and customers
Consistency of use
Process Implementation and Execution
a) Sophistication of Process Implementation and Execution IT
Level of support and documentation (including use of SMART (specific, measurable, agreed, relevant, time-bound) Service Level Agreements)
Ability to customize
Linkage to suitable method

Business Process Management: Progression and Maturity
- 13:577 -
Capability Area Additional Detail
Degree to which process-related ID/security/privacy issues are incorporated
Level of (meaningful) automation
Extent to which implementation and execution performance data are captured within the IT
b) Suitability and Fit of Process Implementation and Execution IT
Compatibility with process management approach
Degree of integration with other IT
Degree to which based on business requirements
c) Accessibility and Usage of Process Implementation and Execution IT
Measurable contribution usage makes to achievement of process related objectives
Availability through organization Availability to suppliers and customers
Consistency of use
Process Control and Measurement a) Sophistication of Process Control and Measurement IT
Level of support and documentation (including use of SMART (specific, measurable, agreed, relevant, time-bound) Service Level Agreements)
Ability to customize
Linkage to suitable method
Degree to which process-related ID/security/privacy issues are incorporated
Level of (meaningful) automation
Extent to which control and measurement performance data are captured within the IT
b) Suitability and Fit of Process Control and Measurement IT
Compatibility with process management approach
Degree of integration with other IT
Degree to which based on business requirements
c) Accessibility and Usage of Process Control and Measurement IT
Measurable contribution usage makes to achievement of process related objectives

Appendices
- 13:578 -
Capability Area Additional Detail
Availability through organization
Availability to suppliers and customers
Consistency of use
Process Improvement and Innovation
a) Sophistication of Process Improvement and Innovation IT
Level of support and documentation (including use of SMART (specific, measurable, agreed, relevant, time-bound) SLA‟s
Ability to customize
Linkage to suitable method
Degree to which process-related ID/security/privacy issues are incorporated
Level of (meaningful) automation
Extent to which improvement and innovation performance data are captured the IT
b) Suitability and Fit of Process Improvement and Innovation IT
Compatibility with process management approach
Degree of integrated with other IT
Degree to which based on business requirements
c) Accessibility and Usage
Measurable contribution usage makes to achievement of process related objectives
Availability through organization
Availability to suppliers and customers
Consistency of use
Process Project and Program Management
a) Sophistication of Process Project and Program Management IT
Level of support and documentation (including use of SMART (specific, measurable, agreed, relevant, time-bound) SLA‟s
Ability to customize
Linkage to suitable method

Business Process Management: Progression and Maturity
- 13:579 -
Capability Area Additional Detail
Degree to which process-related ID/security/privacy issues are incorporated
Level of (meaningful) automation
Extent to which project and program management performance data are captured within the IT
b) Suitability and Fit of Process Project and Program Management IT
Compatibility with process management approach
Degree of integration with other IT
Degree to which based on business requirements
c) Accessibility and Usage of Process Project and Program Management IT
Measurable contribution usage makes to achievement of process related objectives
Availability through organization
Availability to suppliers and customers
Consistency of use
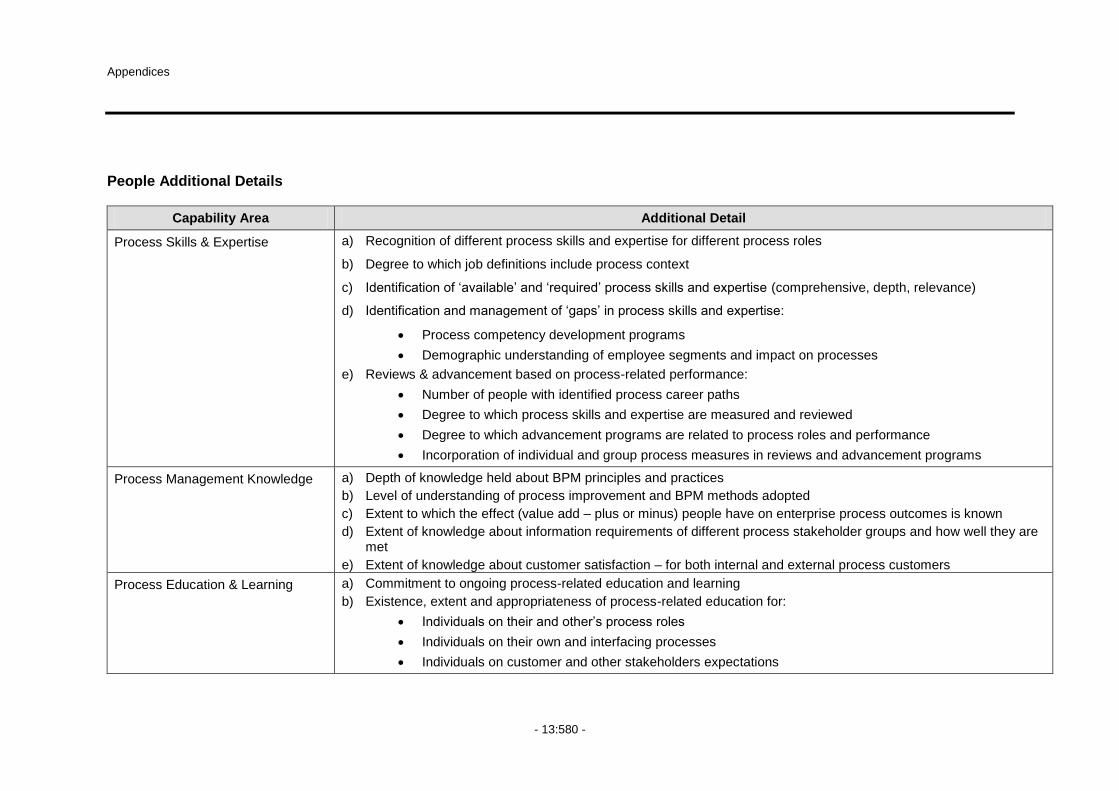
Appendices
- 13:580 -
People Additional Details
Capability Area Additional Detail
Process Skills & Expertise a) Recognition of different process skills and expertise for different process roles
b) Degree to which job definitions include process context
c) Identification of „available‟ and „required‟ process skills and expertise (comprehensive, depth, relevance)
d) Identification and management of „gaps‟ in process skills and expertise:
Process competency development programs
Demographic understanding of employee segments and impact on processes
e) Reviews & advancement based on process-related performance:
Number of people with identified process career paths
Degree to which process skills and expertise are measured and reviewed
Degree to which advancement programs are related to process roles and performance
Incorporation of individual and group process measures in reviews and advancement programs
Process Management Knowledge a) Depth of knowledge held about BPM principles and practices
b) Level of understanding of process improvement and BPM methods adopted
c) Extent to which the effect (value add – plus or minus) people have on enterprise process outcomes is known
d) Extent of knowledge about information requirements of different process stakeholder groups and how well they are met
e) Extent of knowledge about customer satisfaction – for both internal and external process customers
Process Education & Learning a) Commitment to ongoing process-related education and learning
b) Existence, extent and appropriateness of process-related education for:
Individuals on their and other‟s process roles
Individuals on their own and interfacing processes
Individuals on customer and other stakeholders expectations
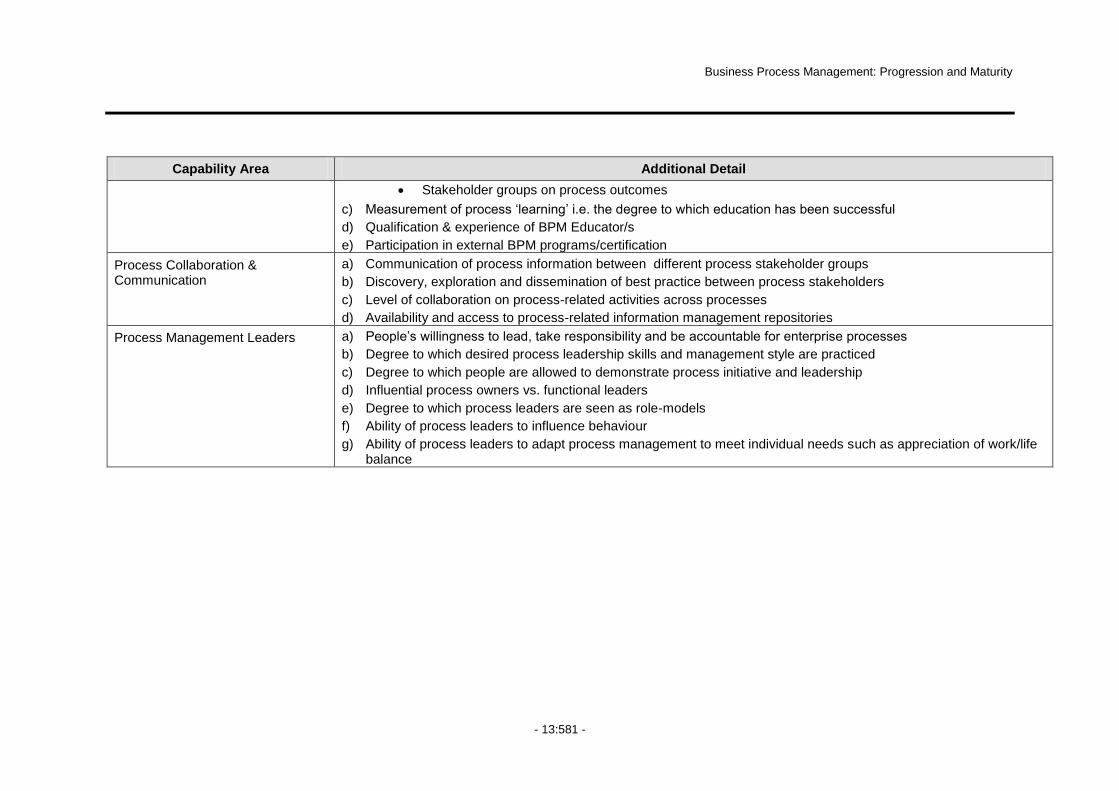
Business Process Management: Progression and Maturity
- 13:581 -
Capability Area Additional Detail
Stakeholder groups on process outcomes
c) Measurement of process „learning‟ i.e. the degree to which education has been successful
d) Qualification & experience of BPM Educator/s
e) Participation in external BPM programs/certification
Process Collaboration & Communication
a) Communication of process information between different process stakeholder groups
b) Discovery, exploration and dissemination of best practice between process stakeholders
c) Level of collaboration on process-related activities across processes
d) Availability and access to process-related information management repositories
Process Management Leaders a) People‟s willingness to lead, take responsibility and be accountable for enterprise processes
b) Degree to which desired process leadership skills and management style are practiced
c) Degree to which people are allowed to demonstrate process initiative and leadership
d) Influential process owners vs. functional leaders
e) Degree to which process leaders are seen as role-models
f) Ability of process leaders to influence behaviour
g) Ability of process leaders to adapt process management to meet individual needs such as appreciation of work/life balance
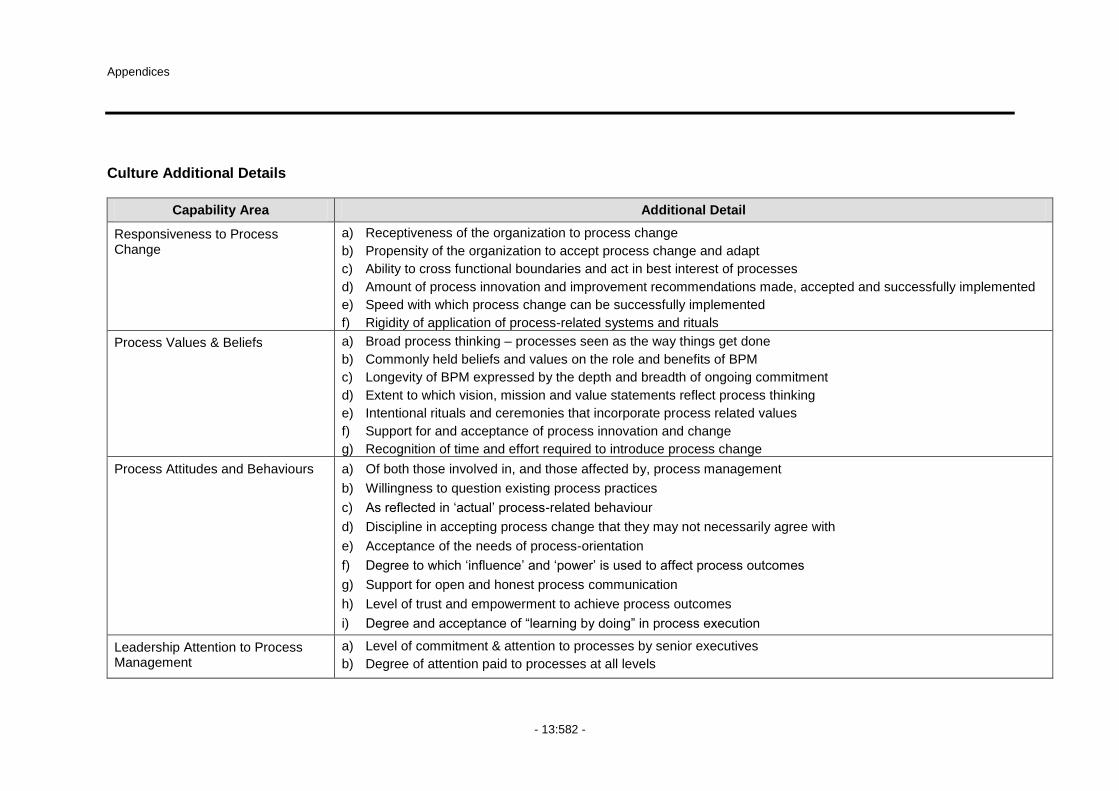
Appendices
- 13:582 -
Culture Additional Details
Capability Area Additional Detail
Responsiveness to Process Change
a) Receptiveness of the organization to process change
b) Propensity of the organization to accept process change and adapt
c) Ability to cross functional boundaries and act in best interest of processes
d) Amount of process innovation and improvement recommendations made, accepted and successfully implemented
e) Speed with which process change can be successfully implemented
f) Rigidity of application of process-related systems and rituals
Process Values & Beliefs a) Broad process thinking – processes seen as the way things get done
b) Commonly held beliefs and values on the role and benefits of BPM
c) Longevity of BPM expressed by the depth and breadth of ongoing commitment
d) Extent to which vision, mission and value statements reflect process thinking
e) Intentional rituals and ceremonies that incorporate process related values
f) Support for and acceptance of process innovation and change
g) Recognition of time and effort required to introduce process change
Process Attitudes and Behaviours a) Of both those involved in, and those affected by, process management
b) Willingness to question existing process practices
c) As reflected in „actual‟ process-related behaviour
d) Discipline in accepting process change that they may not necessarily agree with
e) Acceptance of the needs of process-orientation
f) Degree to which „influence‟ and „power‟ is used to affect process outcomes
g) Support for open and honest process communication
h) Level of trust and empowerment to achieve process outcomes
i) Degree and acceptance of “learning by doing” in process execution
Leadership Attention to Process Management
a) Level of commitment & attention to processes by senior executives
b) Degree of attention paid to processes at all levels

Business Process Management: Progression and Maturity
- 13:583 -
Capability Area Additional Detail
c) Quality of process leadership
d) Level at which functional-structure and its impact on process outcomes is recognized and addressed
Process Management Social Networks
a) Existence and influence of “BPM Communities of Practice” (or similar) b) Use of “social network techniques” c) Recognition and use of informal process management networks d) Inclusion of customers and other process stakeholders in process management networks

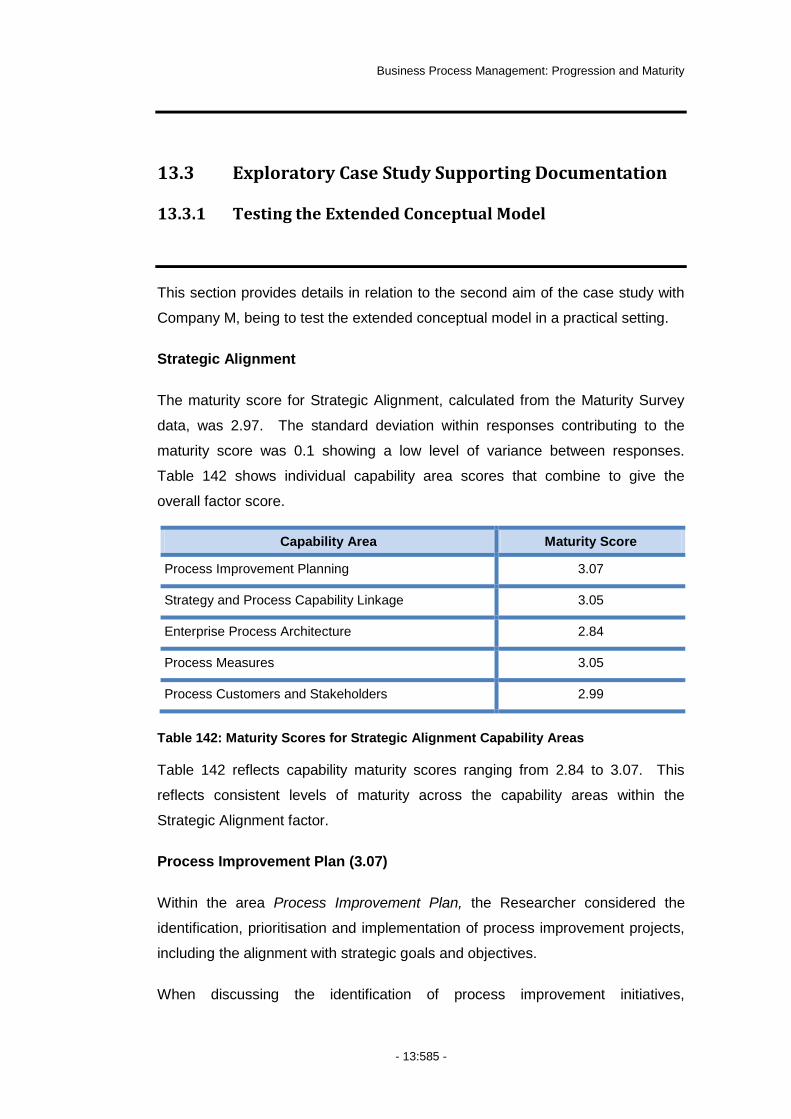
Business Process Management: Progression and Maturity
- 13:585 -
13.3 Exploratory Case Study Supporting Documentation
13.3.1 Testing the Extended Conceptual Model
This section provides details in relation to the second aim of the case study with
Company M, being to test the extended conceptual model in a practical setting.
Strategic Alignment
The maturity score for Strategic Alignment, calculated from the Maturity Survey
data, was 2.97. The standard deviation within responses contributing to the
maturity score was 0.1 showing a low level of variance between responses.
Table 142 shows individual capability area scores that combine to give the
overall factor score.
Capability Area Maturity Score
Process Improvement Planning 3.07
Strategy and Process Capability Linkage 3.05
Enterprise Process Architecture 2.84
Process Measures 3.05
Process Customers and Stakeholders 2.99
Table 142: Maturity Scores for Strategic Alignment Capability Areas
Table 142 reflects capability maturity scores ranging from 2.84 to 3.07. This
reflects consistent levels of maturity across the capability areas within the
Strategic Alignment factor.
Process Improvement Plan (3.07)
Within the area Process Improvement Plan, the Researcher considered the
identification, prioritisation and implementation of process improvement projects,
including the alignment with strategic goals and objectives.
When discussing the identification of process improvement initiatives,
Appendices
- 13:586 -
participants indicated the need for greater consideration of those impacted by
subsequent changes. For example, one participant stated:
“...Previously in our planning session we said we‟re going to go off
and do this but it had a huge impact on these guys and did we ever
talk to anyone? No. It was just when we turned it on and oh, by the
way, you‟ve got to do this now. But we can‟t live in that world any
more...”
In a similar vein, participants identified a need to adopt an integrated approach to
communicating with disparate sites with regard to the scheduling and
implementation of projects, stating:
“…get it more integrated (…) from an operating site perspective, they
feel like they‟re inundated with different initiatives and that it‟s a bit
piecemeal and they struggle with priorities…”
“…look at spreading them out a bit more, not so much at one time…”
In addition to a focus on process improvement, participants indicated a need to
review processes from time to time, evident in comments such as:
“…that business processes provide a good outcome but you have to
be prepared to review and ensure that the processes are going to
deliver the outcome that you want...”
This indicated a need to consider also, process review, as distinct to process
improvement. Furthermore, it highlighted the need to consider process projects
as a collective group and not only in isolation.
Strategy and Process Capability Linkage (3.05)
Within the area of Strategy and Process Capability Linkage, the Researcher
investigated the relationship between setting strategy and the level of process
capability. This included considering the direction of any relationship between
the two and whether existing capability affected strategic requirements.
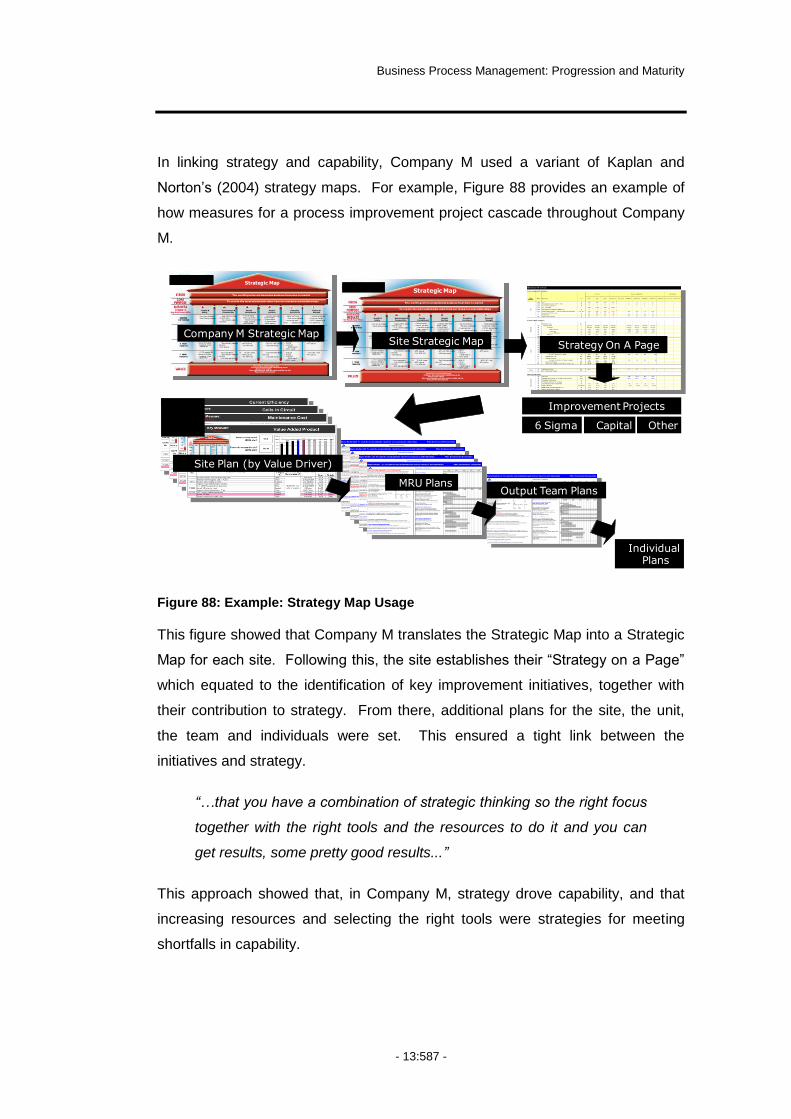
Business Process Management: Progression and Maturity
- 13:587 -
In linking strategy and capability, Company M used a variant of Kaplan and
Norton‟s (2004) strategy maps. For example, Figure 88 provides an example of
how measures for a process improvement project cascade throughout Company
M.
Figure 88: Example: Strategy Map Usage
This figure showed that Company M translates the Strategic Map into a Strategic
Map for each site. Following this, the site establishes their “Strategy on a Page”
which equated to the identification of key improvement initiatives, together with
their contribution to strategy. From there, additional plans for the site, the unit,
the team and individuals were set. This ensured a tight link between the
initiatives and strategy.
“…that you have a combination of strategic thinking so the right focus
together with the right tools and the resources to do it and you can
get results, some pretty good results...”
This approach showed that, in Company M, strategy drove capability, and that
increasing resources and selecting the right tools were strategies for meeting
shortfalls in capability.
1 YEAR
TARGETS
5 YEAR
TARGETS
KEY
DRIVERS
DESIRED
OUTCOMES
• Heal th & safety standards
• NOS A
• ST OP, ‘T ake 5’
• S afety Improvement T eams
• Z ero i nj uri es & I ll nesses
• S afe & heal thy workpl ace
• Negot i ated NGA in pl ace• Mi ni mum waste
• F ul l communi t y support &partnershi p
Strategic Map
• Z ero LT IF R
• Mai ntai n NOS A 5- S tar• Occupat i onal I l l ness
reduced by 40%
• IS O 14001
• E nv . S tandards audi t
• SD st rategi es
• 5 Y ear communi t i es pl an
• Z ero l i cence defaul ts• Z ero communi ty compl ai nts
• 1.86 CO2 e/ t• NGA operat i ng
• LT IF R reduced by 50%
• Mai ntai n NOS A 5- S tar• Occupat i onal I l l ness
reduced by 40%
• Z ero l i cence defaul t s• Z ero communi ty compl ai nts
• 1.94 CO2 e/ t• NGA under negot i at i on
• 5- 7% S taf f turnover
• WP R pl ans met
• F ai r WP R > 95%
• 5- 7% S taf f turnover
• WP R pl ans met
• F ai r WP R > 9x%
• Rol e accountabi l i t i es• T eam Leader:Member I I
• WP A :WP R system
• F T S• E A P
• S uccessi on pl anni ng• Comal co t rai ni ng system
• Z ero Performance defaul ts
• 92% V A P (100% Comal co)
• 4,455 tonnes recycl ed
• Z ero P erformance defaul t s
• 83% V A P
• 2,475 tonnes recycl ed
• 94.5% CE• 13.99 P E• 0.412 NCR
• 367,265 tonnes A l• A B E F score > xx
• 93.9% CE• 14.12 P E• 0.420 NCR
• 338,345 tonnes A l
• ABEF score > xx
• NZ $ 1,451 / t cash
• NP V posi t i ve
• NZ $ 1,397 / t cash
• NP V posi t i ve
• S i x S i gma P roj ects
• V A P Capture
• ISO 9001
• F ord Q 101
• S i x S i gma• A B E F / NZB EF• One Comal co
• One B est Way• P OT 5
• S uperi or A node• Integrated systems
• S i x S i gma P roj ects
• A sset ut i l i sat i on strategy
• Drai ned cathode t ri al s
• P rocess ef f i ci ency
• NP V anal ysi s
• Internal & external audi ts
• Customers hi ghl y val ueNZ A S P roducts
• P referred suppl i er
• P referred customer• Market responsi ve
• P referred empl oyer
• Retai n & grow tal ent• Cont ractors are part of team
• Engage, recogni se & reward empl oyees
• Maxi mi se ef f i ci ency
• B est pract i ce organi sat i on
• A l ways meet pl ans
• Data- based deci si on maki ng
• Increasi ng busi ness val ue
• A l ways meet f l ex plan
• CAPEX generates val ue
• F i rst quart i le ROI
Health & Safety
Environment &Communities
People Commitment
MarketPosition
Operating Excellence
Financial Strength
The world’s preferred aluminium business from mine to market
To create the most sustainable value from our resources and relationships
Tenacity in achieving results
Fairness and honesty in evertything we do
Respect for others
Care about people and the world in which we live
Passion for excellence
1 YEAR
TARGETS
5 YEAR
TARGETS
KEY
DRIVERS
DESIRED
OUTCOMES
• Heal th & safety standards
• NOS A
• S T OP , ‘T ake 5’
• S afety Improvement T eams
• Z ero i nj uri es & I ll nesses
• S afe & heal thy workpl ace
• Negot i ated NGA in pl ace• Mi ni mum waste
• F ul l communi t y support &partnershi p
Strategic Map
• Z ero LT IF R
• Mai ntai n NOS A 5- S tar
• Occupat i onal I l l nessreduced by 40%
• IS O 14001
• E nv . S tandards audi t
• S D st rategi es
• 5 Y ear communi t i es pl an
• Z ero l i cence defaul t s• Z ero communi ty compl ai nts
• 1.86 CO2 e/ t• NGA operat i ng
• LT IF R reduced by 50%
• Mai ntai n NOSA 5- S tar• Occupat i onal I l l ness
reduced by 40%
• Z ero l i cence defaul t s• Z ero communi ty compl ai nts
• 1.94 CO2 e/ t• NGA under negot i at i on
• 5- 7% S taf f turnover
• WP R pl ans met
• F ai r WP R > 95%
• 5- 7% S taf f turnover
• WPR pl ans met
• F ai r WP R > 9x%
• Rol e accountabi l i t i es• T eam Leader:Member I I
• WP A :WP R system• F T S• E A P
• S uccessi on pl anni ng• Comal co t rai ni ng system
• Z ero P erformance defaul t s
• 92% V A P (100% Comal co)
• 4,455 tonnes recycl ed
• Z ero P erformance defaul t s
• 83% VAP
• 2,475 tonnes recycl ed
• 94.5% CE• 13.99 P E
• 0.412 NCR• 367,265 tonnes A l
• A B E F score > xx
• 93.9% CE• 14.12 PE• 0.420 NCR
• 338,345 tonnes A l• A B E F score > xx
• NZ $ 1,451 / t cash
• NP V posi t i ve
• NZ $ 1,397 / t cash
• NPV posi t i ve
• S i x S i gma P roj ects
• V A P Capture
• IS O 9001
• F ord Q 101
• S i x S i gma• A B E F / NZB EF• One Comal co• One B est Way
• P OT 5• S uperi or A node• Integrated systems
• S i x S i gma P roj ects
• A sset ut i l i sat i on strategy
• Drai ned cathode t ri al s
• P rocess ef f i ci ency
• NPV anal ysi s
• Internal & external audi ts
• Customers hi ghl y val ueNZ A S P roducts
• P referred suppl i er• P referred customer• Market responsi ve
• P referred empl oyer
• Retai n & grow tal ent• Cont ractors are part of team
• E ngage, recogni se & reward empl oyees
• Maxi mi se ef f i ci ency
• B est pract i ce organi sat i on
• A l ways meet pl ans
• Data- based deci si on maki ng
• Increasi ng busi ness val ue
• A l ways meet f l ex plan
• CA P E X generates val ue
• F i rst quart i le ROI
Health & Safety
Environment &Communities
People Commitment
MarketPosition
Operating Excellence
Financial Strength
The world’s preferred aluminium business from mine to market
To create the most sustainable value from our resources and relationships
Tenacity in achieving results
Fairness and honesty in evertything we do
Respect for others
Care about people and the world in which we live
Passion for excellence
1 YEAR
TARGETS
5 YEAR
TARGETS
KEY
DRIVERS
DESIRED
OUTCOMES
• Heal th & safety standards
• NOS A
• S T OP , ‘T ake 5’
• Safety Improvement T eams
• Z ero i nj uri es & I ll nesses
• S afe & heal thy workpl ace
• Negot i ated NGA in pl ace• Mi ni mum waste
• F ul l communi t y support &partnershi p
Strategic Map
• Z ero LT IF R
• Mai ntai n NOSA 5- S tar• Occupat i onal I l l ness
reduced by 40%
• IS O 14001
• E nv . S tandards audi t
• S D st rategi es
• 5 Y ear communi t i es pl an
• Z ero l i cence defaul t s• Z ero communi ty compl ai nts
• 1.86 CO2 e/ t• NGA operat i ng
• LT IF R reduced by 50%
• Mai ntai n NOS A 5- S tar• Occupat i onal I l l ness
reduced by 40%
• Z ero l i cence defaul ts• Z ero communi t y compl ai nts
• 1.94 CO2 e/ t• NGA under negot i at i on
• 5- 7% S taf f turnover
• WPR pl ans met
• F ai r WP R > 95%
• 5- 7% S taf f turnover
• WP R pl ans met
• F ai r WP R > 9x%
• Rol e accountabi l i t i es• T eam Leader:Member I I
• WP A :WP R system• F T S
• E A P• S uccessi on pl anni ng• Comal co t rai ni ng system
• Z ero P erformance defaul t s
• 92% VAP (100% Comal co)
• 4,455 tonnes recycl ed
• Z ero Performance defaul ts
• 83% V A P
• 2,475 tonnes recycl ed
• 94.5% CE• 13.99 PE• 0.412 NCR
• 367,265 tonnes A l• A B E F score > xx
• 93.9% CE• 14.12 P E• 0.420 NCR
• 338,345 tonnes A l• A B E F score > xx
• NZ $ 1,451 / t cash
• NP V posi t i ve
• NZ $ 1,397 / t cash
• NP V posi t i ve
• S i x S i gma P roj ects
• V A P Capture
• IS O 9001
• F ord Q 101
• S i x S i gma• A B E F / NZB EF• One Comal co• One B est Way
• P OT 5• S uperi or A node• Integrated systems
• S i x S i gma P roj ects
• A sset ut i l i sat i on strategy
• Drai ned cathode t ri al s
• P rocess ef f i ci ency
• NP V anal ysi s
• Internal & external audi ts
• Customers hi ghl y val ueNZ A S P roducts
• P referred suppl i er• P referred customer
• Market responsi ve
• P referred empl oyer
• Retai n & grow tal ent• Cont ractors are part of team
• E ngage, recogni se & reward empl oyees
• Maxi mi se ef f i ci ency
• B est pract i ce organi sat i on
• A l ways meet pl ans
• Data- based deci si on maki ng
• Increasi ng busi ness val ue
• A l ways meet f l ex plan
• CA P E X generates val ue
• F i rst quart i le ROI
Health & Safety
Environment &Communities
People Commitment
MarketPosition
Operating Excellence
Financial Strength
The world’s preferred aluminium business from mine to market
To create the most sustainable value from our resources and relationships
Tenacity in achieving results
Fairness and honesty in evertything we do
Respect for others
Care about people and the world in which we live
Passion for excellence
1 YEAR
TARGETS
5 YEAR
TARG ETS
K EY
DRIVERS
DESIRED
OUTCOMES
• Heal th & safety standards
• NOS A
• S T OP , ‘T ake 5’
• S afety Improvement T eams
• Z ero i nj uri es & I ll nesses
• S afe & heal thy workpl ace
• Negot i ated NGA in pl ace• Mi ni mum waste
• F ul l communi t y support &partnershi p
Strategic Map
• Z ero LT IF R
• Mai ntai n NOS A 5- S tar• Occupat i onal I l l ness
reduced by 40%
• IS O 14001
• E nv . S tandards audi t
• S D st rategi es
• 5 Y ear communi t i es pl an
• Z ero l i cence defaul t s• Z ero communi ty compl ai nts
• 1.86 CO2 e/ t
• NGA operat i ng
• LT IF R reduced by 50%
• Mai ntai n NOS A 5- S tar• Occupat i onal I l l ness
reduced by 40%
• Z ero l i cence defaul t s• Z ero communi ty compl ai nts
• 1.94 CO2 e/ t• NGA under negot i at i on
• 5- 7% S taf f turnover
• WP R pl ans met
• F ai r WP R > 95%
• 5- 7% S taf f turnover
• WP R pl ans met
• F ai r WPR > 9x%
• Rol e accountabi l i t i es
• T eam Leader:Member I I• WP A :WP R system
• F T S• E A P
• S uccessi on pl anni ng
• Comal co t rai ni ng system
• Z ero P erformance defaul t s
• 92% V A P (100% Comal co)
• 4,455 tonnes recycl ed
• Z ero P erformance defaul t s
• 83% V A P
• 2,475 tonnes recycl ed
• 94.5% CE• 13.99 P E• 0.412 NCR
• 367,265 tonnes A l• A B E F score > xx
• 93.9% CE• 14.12 P E
• 0.420 NCR• 338,345 tonnes A l
• A B E F score > xx
• NZ $ 1,451 / t cash
• NP V posi t i ve
• NZ $ 1,397 / t cash
• NP V posi t i ve
• S i x S i gma P roj ects
• V A P Capture
• IS O 9001
• F ord Q 101
• S i x S i gma
• A B E F / NZB EF• One Comal co• One B est Way
• P OT 5• S uperi or A node
• Integrated systems
• S i x S i gma P roj ects
• A sset ut i l i sat i on strategy
• Drai ned cathode t ri al s
• P rocess ef f i ci ency
• NP V anal ysi s
• Internal & external audi ts
• Customers hi ghl y val ueNZ AS Products
• P referred suppl i er• P referred customer• Market responsi ve
• P referred empl oyer
• Retai n & grow tal ent• Cont ractors are part of team
• E ngage, recogni se & reward empl oyees
• Maxi mi se ef f i ci ency
• B est pract i ce organi sat i on
• A l ways meet pl ans
• Data- based deci si on maki ng
• Increasi ng busi ness val ue
• A l ways meet f l ex plan
• CA P E X generates val ue
• F i rst quart i le ROI
Health & Safety
Environment &Communities
People Commitment
MarketPosition
Operating Excellence
Financial Strength
The world’s preferred aluminium business from mine to market
To create the most sustainable value from our resources and relationships
Tenacity in achieving results
Fairness and honesty in evertything we do
Respect for others
Care about people and the world in which we live
Passion for excellence
Company M Strategic MapSite Strategic Map Strategy On A Page
Improvement Projects
6 Sigma Capital Other
Output Team Plans
Site Plan (by Value Driver)
MRU Plans
IndividualPlans
Appendices
- 13:588 -
Enterprise Process Architecture (2.84)
For the area of Enterprise Process Architecture (EPA), the Researcher
investigated how, and the extent to which, Company M had formalised an
enterprise-wide process framework.
To this end, Company M had identified seven core processes, including Mining
and Refining, Smelting, Managed People, Managed Assets, Contract to Cash,
Purchase to Pay and Health Safety Environment. Furthermore, Company M had
depicted these seven processes on a poster, together with their core values and
mission statements. Company M visibly displayed laminated A3 sized copies of
this poster throughout their premises. Company M referred to this as their
Strategic Map124. However, the level of detail behind the seven core processes
depicted on the Strategic Map was, according to participants, less consistent.
For example, one participant indicated:
“…there‟s various degrees (…) we have a business model that has
come from Company P (…) but depending on who you ask you will
get quite different answers (…) if you take Managed People (…) there
are sub-processes very well documented and laid out…”
Whilst another participant recognised the work done in this area of the past
eighteen months, indicating:
“…those process maps at that level of detail didn‟t exist eighteen
months ago (…) a lot of work has gone into them but they‟re a means
to an end…”
Another participant highlighted the importance of undertaking this work stating:
“…its about risk (…) the whole idea about going through the business
process was to make sure we‟ve got a common way of doing things
before we implement this computer layer on top, and if there is a
disconnect then you‟re in big trouble…”
124
For confidentiality reasons, there is no depiction of Company M‟s Strategic Map.

Business Process Management: Progression and Maturity
- 13:589 -
Despite this, there was no evidence that Company M applied a consistent
approach or structure to the definition of processes at a lower level, rather the
approach was to develop these layers on a case-by-case basis. In the words of
one participant:
“…they help with a project then sit on a dusty shelf as opposed to
being used for going back and looking for innovative touch points (…)
we can probably finesse that…”
This indicated that participants view an EPA as beneficial for managing risk and
for progressing projects. However, developing a structure for getting consistency
below the level of core processes requires time, during which process models are
not used to their potential.
Process Measures (3.05)
For the area of Process Measures, the Researcher considered the means by
which Company M ensured process measures align with strategic goals.
In defining and setting process measures, Company M used a variant of Kaplan
and Norton‟s (1993, 2007) Balanced Scorecards. Figure 89 shows how
measures cascade through various levels of Company M when setting process
improvement targets.
Figure 89: Aligning Process Measures to Strategy
CEO & MD‟s
Context
Strategic
5 Yr Plan
GMs & Business
Services Managers
Initial
Valuations
Corporate Business
Analysis
Detailed
5 Yr Plan
Final
Valuations
GMs & Business
Services Managers &
Analysts
Corporate Business
Analysis
MD sign off
MD sign off
MD sign off
SoaP
Overall targets set
By CEO / MD

Appendices
- 13:590 -
This diagram reflected the process for setting measures within a process
improvement project. It shows how the initial targets are set at a strategic level
before filtering throughout the organisation. It links to the governance structure,
showing the respective sign-off authorities and the use of valuations for ensuring
the appropriateness of the measures being set. Participants highlighted the
importance of having a series of checkpoints and iterative sign-offs in comments
such as:
“…how you put it all together, having timelines, having points to stop
and check where you are, milestones to make sure you are getting
there and that you don‟t jut continually throw resources at it without
meeting certain milestones...”
Process Customers and Stakeholders (2.99)
In the area of Process Customers and Stakeholders, the Researcher considered
how Company M identified and engaged with process customers and
stakeholders, and subsequently how Company subsequently aligned activities
within the BPM Initiative between the groups.
When referring to the manner in which Company M engaged customers and
stakeholders, participants indicated:
“…we‟ve got a change management system in place which says you
must consult your stakeholders (…) there‟s a clear understanding you
do need to do that…”
In discussing the role of customers and stakeholders on the BPM Initiative and
the extent to which interaction and outcomes were voluntary or required,
participants indicated:
“…it could be either (…) if something is mandated from Company P
(…) let‟s face it, that‟s the way it goes…”
This highlighted the potential for conflict between all stakeholder groups. For
example, when talking about the move to One Company P, participants stated:

Business Process Management: Progression and Maturity
- 13:591 -
“…it was a strategic decision, the board made it…if you ask one site
GM he‟d go, I‟ve got all this other stuff to do and I don‟t want to do
it…but other sites where absolutely engaging (…) very much into
getting the initial ideas out there and soliciting feedback on how this is
going to go and how effective it will be…”
However, participants also indicated that the priority was with (internal)
customers.
“…keep the focus on the customer e.g. corporate is here to support
the sites and not vice versa…”
This highlighted that, in practice, organisations need to balance potentially
competing requirements of multiple stakeholders to achieve desired outcomes
from BPM Initiatives.
Governance
The maturity score for Governance, calculated from the Maturity Survey data,
was 2.73. This positioned the maturity of the Governance factor as being slightly
below the average of all the factors for Company M. The standard deviation
within responses to Governance questions was 0.2 reflecting a low level of
variance between responses. Table 143 shows individual capability area scores
that combine to give the overall factor score.
Capability Area Maturity Score
Process Management Decision Making 3.12
Process Roles and Responsibilities 2.58
Process Metrics and Performance Linkage 2.82
Process Management Standards 2.58
Process Management Controls 2.55
Table 143: Maturity Scores for Governance Capability Areas
This table reflects capability maturity scores ranging from 2.55 to 3.12, a total
range of .57.

Appendices
- 13:592 -
Process Management Decision Making (3.12)
In the area of Process Management Decision Making, the Researcher explored
how Company M made decisions with respect to both processes and the BPM
Initiative.
In discussing the development of decision-making frameworks, participants
indicated that Company M had not developed an integrated governance
framework around process. For example, participants indicated:
“…overall our business process governance (…) is implied rather
than explicit (…) it‟s explicit within each area. I think the integration
area is where it‟s implied as opposed to being a specific thing…”
A number of participants raised similar points when discussing the governance
pertaining to the conduct of process improvement projects. For example:
“…we have a fairly informal process, there‟s a small group of people
doing this and we communicate between the groups (…) I wouldn‟t
say it was formalised in any fashion (…) we‟re still playing with that in
Project X, it‟s one of the main issues…”
“…there‟s not a formal one and some of the teams are making
decisions in isolation without thinking of the ramifications on other
teams…”
These comments reflect potential difficulties that arise when there is a lack of a
formalised process for governing the conduct of process projects. However, it
was apparent within Company M that there was a more defined and structured
approach to the approval and initiative of the process improvement projects. For
example, the existing EXCO and the recognised process owners and other
senior management roles was instrumental in the approval of all process
improvement projects, as indicated in comments such as125:
125
EXCO is the Executive Committee and includes all Managing Directors and the CEO. Below this are the General Managers. In Company M, the General Managers were the designated Process Custodians at the time of the case study.

Business Process Management: Progression and Maturity
- 13:593 -
“…during the planning process the strategic improvement projects go
up to EXCO for approval (…) it doesn‟t have to be a big expensive
project but it can be something that impacts the whole business (…)
the EXCO which is run be our CEO makes a call…”
“…before it gets to EXCO it does the rounds (…) it goes through the
GM‟s (…) all GM‟s are trying to get sign-off (…) if you‟ve got the site
GM‟s lined up everything‟s sweet (…) the GM – Process
Improvement (…) he‟s a filter for all of the strategic projects as part of
the annual planning process”
“…so really the purpose of EXCO is it‟s more of a rubber stamp by
the time it gets there…”
These comments show that prior to getting to EXCO for consideration, Process
Owners and other Senior Managers negotiate for the process projects that EXCO
considers.
As with other areas of BPM, the impact of the increasing role of Company P was
evident in the area of decision-making. For example, one participant indicated
that:
“…it used to be a lot clearer. Company P has muddied the waters a
substantial bit, especially on the Purchase to Pay side. We used to
have a structure and there was a decision made at the GM level,
what the strategic direction was and which are the improvement
projects and then we filtered that up and down via consultation…”
This highlights the potential for BPM capabilities and decision making within
Company M to become sub-optimal, for improving the performance of Company
M, due to involvement and competing priorities of Company P.
Process Roles and Responsibilities (2.58)
For the area Process Roles and Responsibilities, the Researcher explored the
process roles Company M defined, the assignment of people to these roles, the
visibility of process roles, evidence of a process career-paths and the treatment
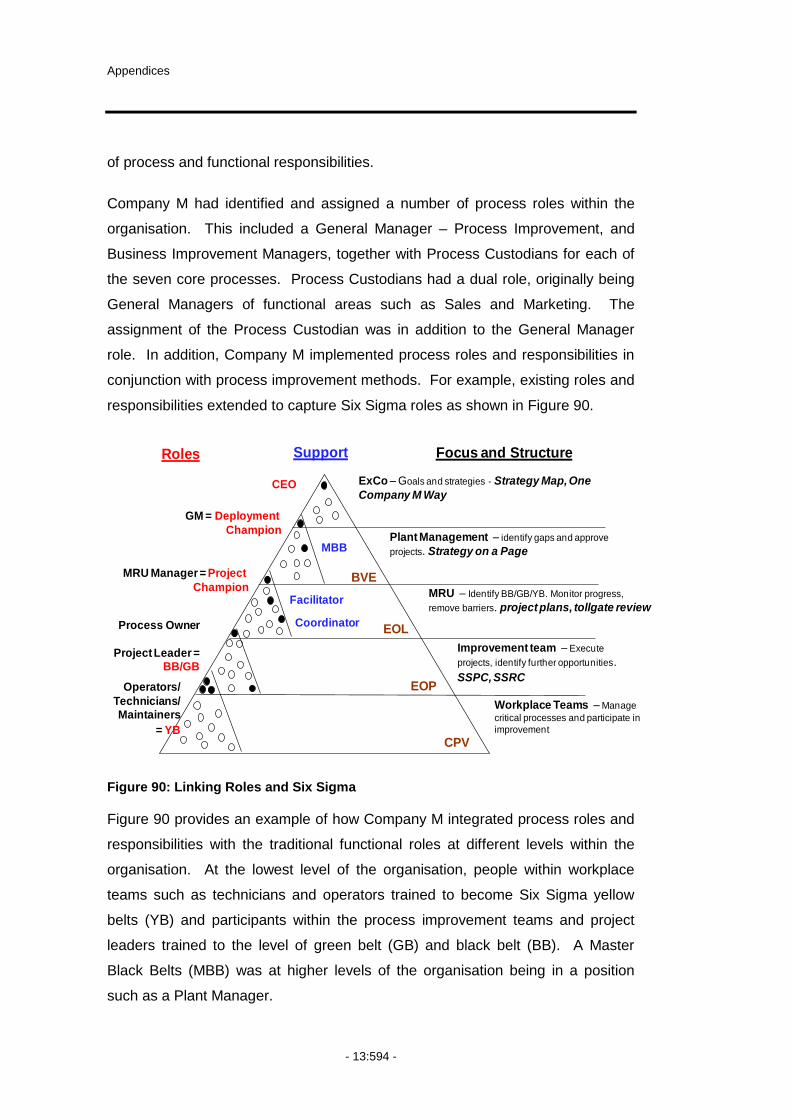
Appendices
- 13:594 -
of process and functional responsibilities.
Company M had identified and assigned a number of process roles within the
organisation. This included a General Manager – Process Improvement, and
Business Improvement Managers, together with Process Custodians for each of
the seven core processes. Process Custodians had a dual role, originally being
General Managers of functional areas such as Sales and Marketing. The
assignment of the Process Custodian was in addition to the General Manager
role. In addition, Company M implemented process roles and responsibilities in
conjunction with process improvement methods. For example, existing roles and
responsibilities extended to capture Six Sigma roles as shown in Figure 90.
Figure 90: Linking Roles and Six Sigma
Figure 90 provides an example of how Company M integrated process roles and
responsibilities with the traditional functional roles at different levels within the
organisation. At the lowest level of the organisation, people within workplace
teams such as technicians and operators trained to become Six Sigma yellow
belts (YB) and participants within the process improvement teams and project
leaders trained to the level of green belt (GB) and black belt (BB). A Master
Black Belts (MBB) was at higher levels of the organisation being in a position
such as a Plant Manager.
BVE
EOL
EOP
CPV
CEO
GM = Deployment
Champion
MRU Manager = Project
Champion
Process Owner
Project Leader = BB/GB
Operators/
Technicians/Maintainers
= YB
Roles
MBB
Coordinator
Facilitator
Support
ExCo – Goals and strategies - Strategy Map, One
Company M Way
Plant Management – identify gaps and approve
projects. Strategy on a Page
MRU – Identify BB/GB/YB. Monitor progress,
remove barriers. project plans, tollgate review
Improvement team – Execute
projects, identify further opportunities.
SSPC, SSRC
Workplace Teams – Manage
critical processes and participate in
improvement
Focus and Structure
Business Process Management: Progression and Maturity
- 13:595 -
Despite the recognition of a number of process roles, according to workshop
participants there was a lack of clarity evident in the assignment and acceptance
of these. For example, a participant stated:
“…if you went out to some of the safety specialists and said who‟s the
business process owner for safety, you‟d get varying theories (…)
people have got the idea of business process owners but we‟re not
very good yet at clearly defining them, giving them accountabilities
and making sure that accountability is well communicated across the
organisation…”
However, the importance of defining and assigning process roles and
responsibilities was evident in comments including:
“...BPM roles have to be formalised. Roles, responsibilities and
authorities, and process ownership must be clear...”
Process Metrics and Performance Linkage (2.82)
For Process Metrics and Performance Linkage, the Researcher explored how
Company M linked performance to the achievement of process metrics. In this
regard, Company M had some linkage with external customers but not internally.
This was evident in comments such as:
“...we‟ve got service level agreements with our external customers
but internally we don‟t do it…”
There was further evidence that internally, Company M had not actively
progressed individual performance with process metrics, with participants stating:
“…the levers or the drivers or the way we reward people formally and
informally aren‟t necessarily properly aligned with the commonality or
within the business process management view…”

Appendices
- 13:596 -
“…the formal recognition of other things which are a bit more fuzzy
like collaboration, knowledge sharing, process improvement (…) I
don‟t think that we, at the individual level, reward people for that
formally enough…”
One participant within Company M indicated the potential difficulty in aligning
operational performance with the broader notion of end-to-end processes,
suggesting that:
“…the simple tension between operational and strategic, how we
motivate people and how we recognise them for contributing to the
big picture rather than just doing their job…”
These comments highlight the tensions that can exist within organisations that
can affect the progression of BPM Initiatives. On the one hand, there is the need
to affect entities external to the organisation that impact performance. On the
other, there is the need to review and potentially change the internal mechanisms
within the organisation for linking performance and process metrics. For
example, internally there are potential tensions between operational and strategic
drivers whereby performance traditionally links to shorter-term and more direct
operational performance, rather than the less direct or visible strategic
performance. Furthermore, there are areas of individual performance that are
difficult to capture and measure such as collaboration and knowledge sharing
which present challenges to organisations.
Process Related Standards (2.58)
In exploring Process Related Standards, the Researcher considered the adoption
of standards that affect processes and practices within the BPM Initiative. The
historic need for legislative compliance meant that participants were familiar with
the notion of standards and their relationship with processes. This reflected in
comments such as:

Business Process Management: Progression and Maturity
- 13:597 -
“…things like common policies and procedures at a Company P level
(…) they‟re another way of just talking about business process and
what‟s expected (…) those from a compliance point of view (…) the
code of conducts (…) the common expectations and behaviours…”
Despite this, there was no requirement within Company M to develop standards
to guide process activities. For example, when discussing whether there were
standards established around process modelling methods, one participant
indicated:
“…we‟re all going to model our process using a particular
methodology (…) but if someone‟s got enough passion to drive it,
they will (…) I could probably do it in my role if I really felt moved to
do so, but I don‟t, I think that‟s probably a little black hole…”
In this comment, the participant also highlighted the potential issues arising from
relying on the willingness of individuals, that is that nobody has the willingness
and consequently standards are not applied. A potential consequence of this is
inconsistent application of practices stemming from a lack of standardisation.
However, with regard to standardisation one participant indicated:
“…I guess there is some form of standardisation from the GM –
Process Improvement (…) but we just don‟t have a standard…”
This suggests that, at this time, Company M relies on individuals to ensure
standardisation within practices rather than the use of standards to achieve this
end. However, comments such as the reference to “a little black hole” suggest
that participants do not see this situation as ideal, and that it is an area they need
to progress.
Process Management Compliance (2.55)
For Process Management Compliance, the Researcher explored how Company
M ensured performance, behaviours and actions were in accordance with agreed
standards and governance structures.
In the main, existing forums such as Corporate Governance ensure that

Appendices
- 13:598 -
Company M meets legislative requirements. For example, one participant stated:
“…legislatively compliant, typical compliance work eventually ends up
at the Company M Audit Forum (…) part of Corporate Governance…”
There was use of both internal and external audit for checking on the
performance of processes, although from an internal perspective there is little
audit of IT systems. This was evident in comments from participants including:
“…we do audits through an internal audit program with warning
systems on a regular basis (…) there‟s not much IT stuff in this
unfortunately… ”
“…external auditors come in and say this is not right, it‟s got to be
fixed. There‟s no question …”
There are internal surveys regarding employee satisfaction that provide direction
to improvements, for example:
“…the employee survey, that‟s a formal process and it‟s going to
have defined targets. Like we might want over 60% of employees
totally satisfied in this area. Now where we‟re below that the divisions
have to come up with a plan to move above the line, that‟s the
standard…”
However, the lack of standards in use means that the performance of individuals
with regard to the BPM Initiative goes largely unchecked.
Methods
The maturity score for Methods, calculated from the Maturity Survey data, was
2.66. This was lower than the average maturity score for all factors within
Company M of 2.89. The standard deviation within responses contributing to the
Methods maturity score was 0.07 showing a low level of variance between
responses. This represented the lowest standard deviation of all factors within
Company M. Table 144 shows individual capability area scores that combine to
give the overall factor score of 2.66.

Business Process Management: Progression and Maturity
- 13:599 -
Capability Area Maturity Score
Process Design & Modelling 2.58
Process Implementation & Execution 2.65
Process Monitoring & Control 2.78
Process Improvement & Innovation 2.64
Process Program & Project Mgmt 2.65
Table 144: Maturity Scores for Capability Areas
The closeness of these scores is consistent with the view expressed earlier, that
a part of the BPM Initiative was to equip people with the right tools and
techniques to perform there jobs.
During the workshop, participants identified the methods used within each of the
capability areas, together with the major opportunities and challenges they
perceived in each of these areas. Table 145 provides a summary of this data.
Design and Modelling Processes Opportunities and Challenges
Design for Six Sigma Long duration of processes
Not consistently seeing end-to-end processes
Understanding the underlying principles for use
Speed with which methods change
Engagement of users
Cost drivers
Implementing and Executing Processes Opportunities and Challenges
Lean
Asset Management (some SAP some not)
ITIL / ITSMF
DuPont Safety
None noted
Monitoring and Controlling Processes Opportunities and Challenges
Six Sigma
Lean
Trending
Redundant data
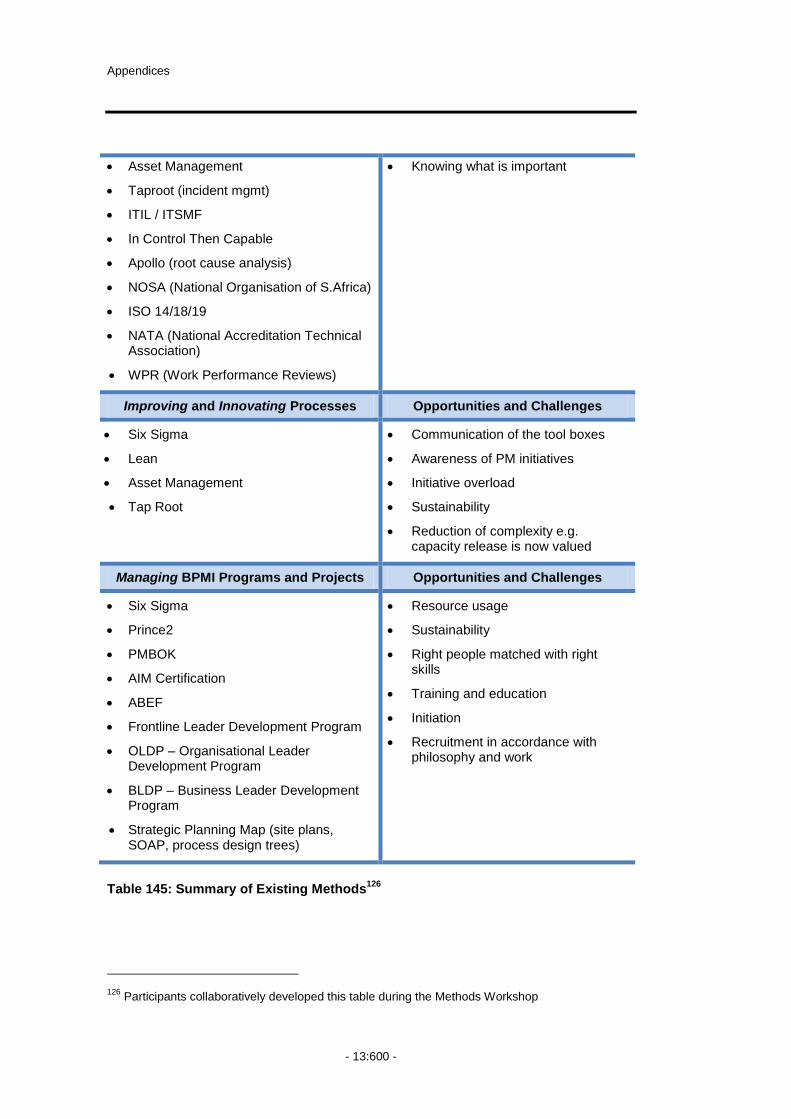
Appendices
- 13:600 -
Asset Management
Taproot (incident mgmt)
ITIL / ITSMF
In Control Then Capable
Apollo (root cause analysis)
NOSA (National Organisation of S.Africa)
ISO 14/18/19
NATA (National Accreditation Technical Association)
WPR (Work Performance Reviews)
Knowing what is important
Improving and Innovating Processes Opportunities and Challenges
Six Sigma
Lean
Asset Management
Tap Root
Communication of the tool boxes
Awareness of PM initiatives
Initiative overload
Sustainability
Reduction of complexity e.g. capacity release is now valued
Managing BPMI Programs and Projects Opportunities and Challenges
Six Sigma
Prince2
PMBOK
AIM Certification
ABEF
Frontline Leader Development Program
OLDP – Organisational Leader Development Program
BLDP – Business Leader Development Program
Strategic Planning Map (site plans, SOAP, process design trees)
Resource usage
Sustainability
Right people matched with right skills
Training and education
Initiation
Recruitment in accordance with philosophy and work
Table 145: Summary of Existing Methods126
126
Participants collaboratively developed this table during the Methods Workshop

Business Process Management: Progression and Maturity
- 13:601 -
The data in Table 145 shows that an organisation can adopt a range of methods
in each of the capability areas. In a number of areas, the methods are
recognised process-based methods such as Six Sigma for process improvement.
However, in the area of Process Program and Project Management the methods
tend to be more general and less process specific, including recognised
project/program management methods such as Prince2 and PMBOK as well as
leadership development methods. The methods identified also represent a mix
of publicly available methods such as Six Sigma, Lean, PMBOK, ITIL, ISO and
ABEF together with a number of proprietary methods such as Organisational and
Business Leader Development Programs and In Control Then Capable.
An example of the intended complementary use of selected methods was evident
in the communication of Six Sigma and Lean within Company M, an example of
which is in Figure 91.
Figure 91: Linking Six Sigma and Lean
Six Sigma Projects • Small number of high value projects
• Involvement of a few (mainly highly skilled
BB‟s)
• Slow to fix- longer cycle times
• Powerful statistical tools improve precision
of cause and effect analysis
Company M Operational Excellence System
Complex
ProblemsSystemic/Complex
Waste Elimination
Every Day/Humbug
Waste Elimination
Lean • Everyone Involved in root cause problem
solving to maintain performance against
plan on a day to day, shift to shift basis
• Large number of small, incremental
,cheap improvements
• Quick to fix- fast cycle times
Six sigma precision & accuracy + Lean speed & agility = Optimum $$$$$
The range of methods in use affects the measurement of maturity to the
extent that measurement questions focus on the attributes and purpose of
the methods rather than the name of the method.
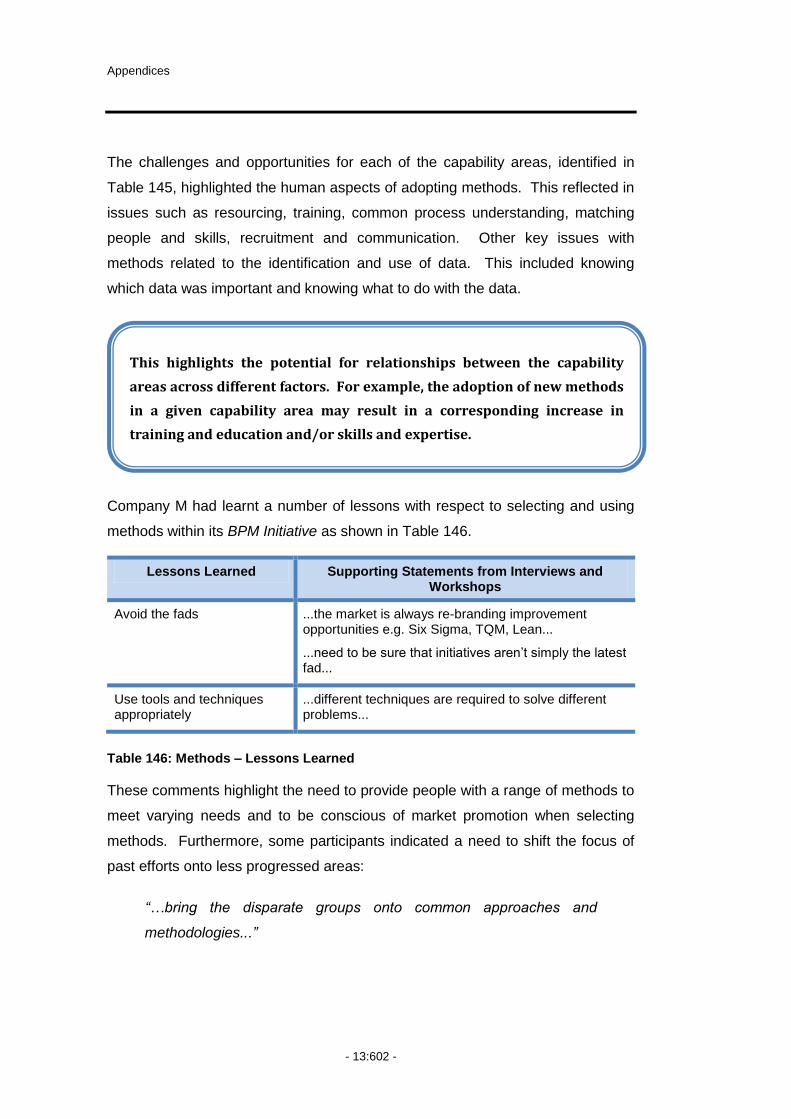
Appendices
- 13:602 -
The challenges and opportunities for each of the capability areas, identified in
Table 145, highlighted the human aspects of adopting methods. This reflected in
issues such as resourcing, training, common process understanding, matching
people and skills, recruitment and communication. Other key issues with
methods related to the identification and use of data. This included knowing
which data was important and knowing what to do with the data.
Company M had learnt a number of lessons with respect to selecting and using
methods within its BPM Initiative as shown in Table 146.
Lessons Learned Supporting Statements from Interviews and Workshops
Avoid the fads ...the market is always re-branding improvement opportunities e.g. Six Sigma, TQM, Lean...
...need to be sure that initiatives aren‟t simply the latest fad...
Use tools and techniques appropriately
...different techniques are required to solve different problems...
Table 146: Methods – Lessons Learned
These comments highlight the need to provide people with a range of methods to
meet varying needs and to be conscious of market promotion when selecting
methods. Furthermore, some participants indicated a need to shift the focus of
past efforts onto less progressed areas:
“…bring the disparate groups onto common approaches and
methodologies...”
This highlights the potential for relationships between the capability
areas across different factors. For example, the adoption of new methods
in a given capability area may result in a corresponding increase in
training and education and/or skills and expertise.
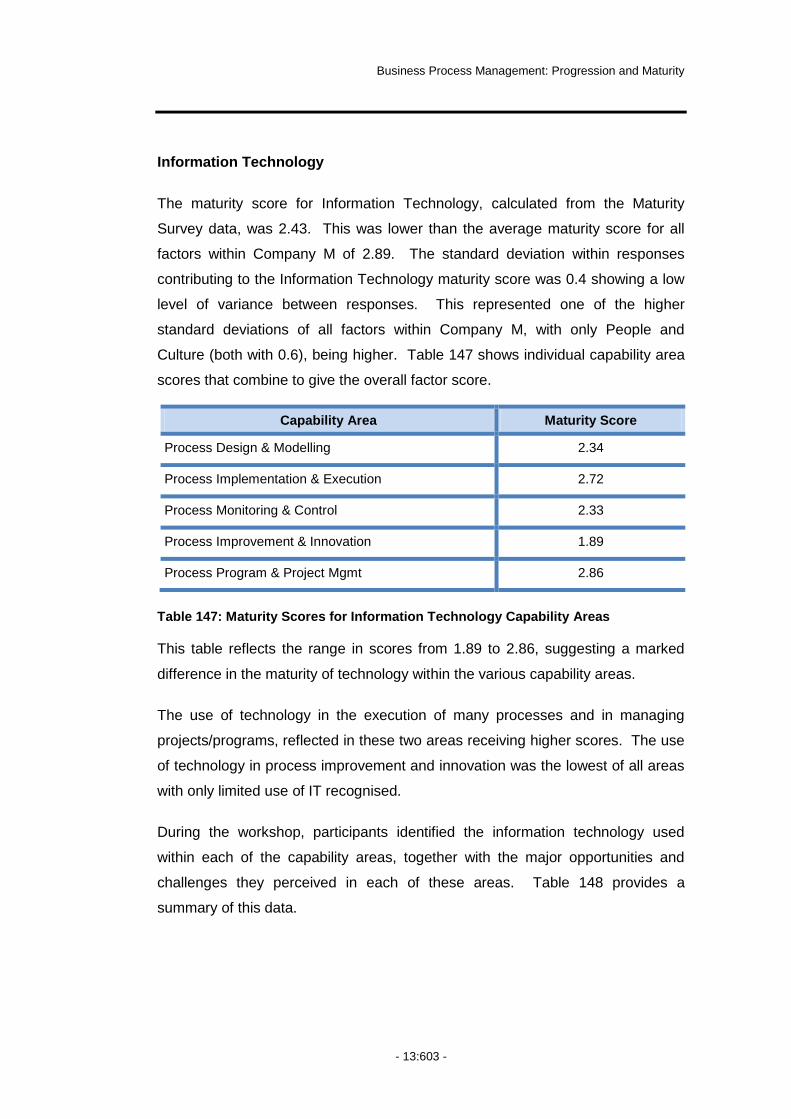
Business Process Management: Progression and Maturity
- 13:603 -
Information Technology
The maturity score for Information Technology, calculated from the Maturity
Survey data, was 2.43. This was lower than the average maturity score for all
factors within Company M of 2.89. The standard deviation within responses
contributing to the Information Technology maturity score was 0.4 showing a low
level of variance between responses. This represented one of the higher
standard deviations of all factors within Company M, with only People and
Culture (both with 0.6), being higher. Table 147 shows individual capability area
scores that combine to give the overall factor score.
Capability Area Maturity Score
Process Design & Modelling 2.34
Process Implementation & Execution 2.72
Process Monitoring & Control 2.33
Process Improvement & Innovation 1.89
Process Program & Project Mgmt 2.86
Table 147: Maturity Scores for Information Technology Capability Areas
This table reflects the range in scores from 1.89 to 2.86, suggesting a marked
difference in the maturity of technology within the various capability areas.
The use of technology in the execution of many processes and in managing
projects/programs, reflected in these two areas receiving higher scores. The use
of technology in process improvement and innovation was the lowest of all areas
with only limited use of IT recognised.
During the workshop, participants identified the information technology used
within each of the capability areas, together with the major opportunities and
challenges they perceived in each of these areas. Table 148 provides a
summary of this data.

Appendices
- 13:604 -
Design and Modelling Processes Opportunities and Challenges
MS-Visio
MS-Excel
MS-Access
MS-SQL
MS-Powerpoint
Mini-tab (Six Sigma)
Mine Planning (Town C)
Simulation Model (Product B) [#]
Performance Driver Tree Models (80% capacity and financial, 20% capability)
Widespread use/access making it difficult to manage application
Control over model versions
Accuracy of modelling (in excel)
Fragmented and ad hoc approach to modelling
Poor visibility of models
Knowledge still resides within individuals
Implementing and Executing Processes Opportunities and Challenges
Fuel Management [*]
Metpro [* !]
SAP (commercial is workflowed) [# ^]
Documentum [#]
Ship Scheduling
LMS (Learning Management System) [^]
EBI (Enterprise Building, security monitoring, gate keeping, linked to SAP ID‟s, stats for safety) [!]
EMS (Environment Manager System (linked to everything) [* !]
B2B suites (custom interfaces, customer / supplier, invoice scanning – workflowed) [*]
CRM (Client Relationship Management)– SAP integrated [^]
More integration with a view to rationalisation (B2B area)
Need to remove manual intervention
Integration between sites is required
Too much interfacing
Not all on same version (e.g. sites have different versions of EBI and Documentum)
Company P integration (e.g. EMS)
Monitoring and Controlling Processes Opportunities and Challenges
Compass (Product A shuts down if controls are breached, Product B – no signal easy determinant) [* = !]
SCADA systems (Supervisory Control and Data Acquisition)
PIMS (Plant / production Information Management System) [=]
LIMS (Laboratory Information Management System) [=]
Business Warehouse [^]
Interface between gathering data and reporting (production and SAP)
Standard tool-set for data extraction and manipulation
Simplification
Consistency
Standardisation of controls

Business Process Management: Progression and Maturity
- 13:605 -
Improving and Innovating Processes Opportunities and Challenges
MS-Visio (process mapping)
Mini-tab (Six Sigma)
Simulation Model (CAR) [#]
Tap Root [!]
OEE (Overall Equipment Effectiveness)
Integration with execution IT e.g. SAP
Data mining
Managing Process Projects and Programs
Opportunities and Challenges
Project Centre (OPCP–Six Sigma) [* !]
Documentum (Next version workflowed) [# ^]
Intranet (document & information mgmt) [*]
Change Recording (to capture change management documents, not mandatory, workflowed) [* !]
Open View Service Desk (IT – collects stats) [^]
Drawing Register (Town C – every site has one, drawings of plants, electrical and mechanical)
MS-Project
Primevera (building refinery)
Estimation tools
Data mining
Standardisation across Company M e.g. intranet
Change recording
Document management standardisation
Legend:
*
!
=
^
#
Internal Company M
One Company M Initiative
Internal Alert
Company P Corporate
Heavily customised/configured
Table 148: Existing Information Technology
The data in Table 148 shows that an organisation can adopt a range of
information technology in each of the capability areas. Within Company M, there
was little use of recognised process-based technology such as the use of
process modelling software in the design and modelling of processes. Rather
there was use of generic diagram drawing software such as MS-Visio.
Furthermore, the use of MS-Excel, MS-Access and MS-SQL in modelling
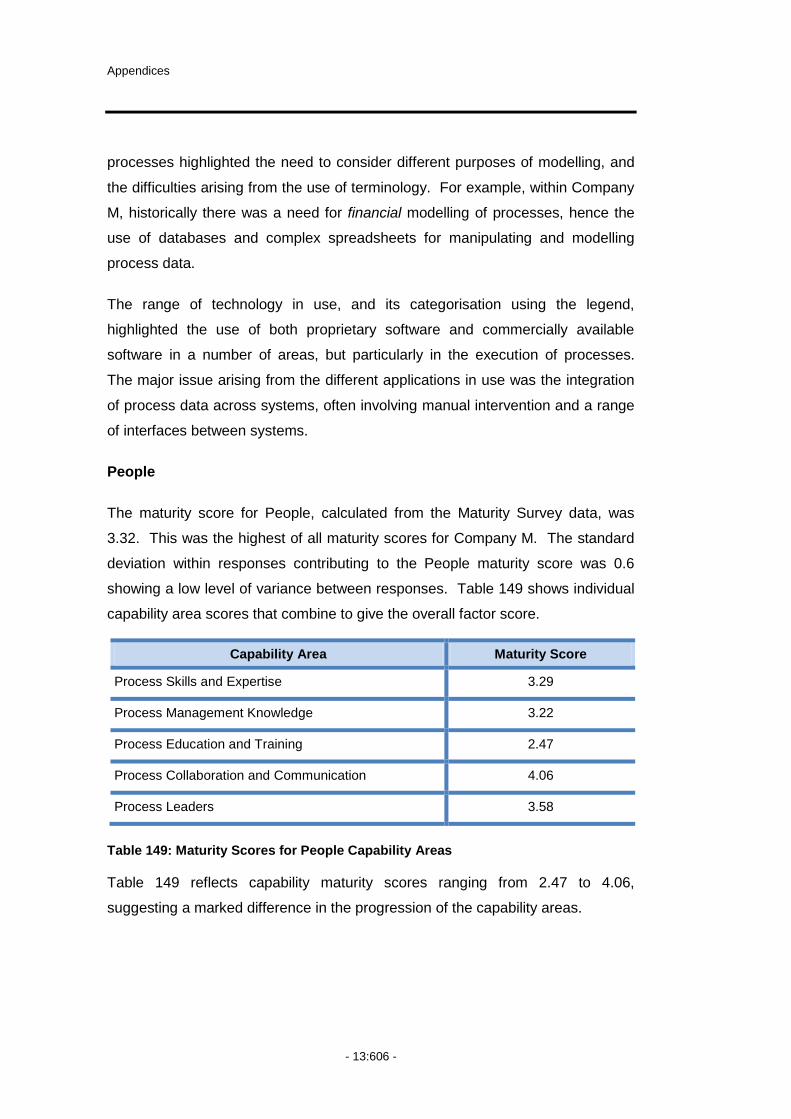
Appendices
- 13:606 -
processes highlighted the need to consider different purposes of modelling, and
the difficulties arising from the use of terminology. For example, within Company
M, historically there was a need for financial modelling of processes, hence the
use of databases and complex spreadsheets for manipulating and modelling
process data.
The range of technology in use, and its categorisation using the legend,
highlighted the use of both proprietary software and commercially available
software in a number of areas, but particularly in the execution of processes.
The major issue arising from the different applications in use was the integration
of process data across systems, often involving manual intervention and a range
of interfaces between systems.
People
The maturity score for People, calculated from the Maturity Survey data, was
3.32. This was the highest of all maturity scores for Company M. The standard
deviation within responses contributing to the People maturity score was 0.6
showing a low level of variance between responses. Table 149 shows individual
capability area scores that combine to give the overall factor score.
Capability Area Maturity Score
Process Skills and Expertise 3.29
Process Management Knowledge 3.22
Process Education and Training 2.47
Process Collaboration and Communication 4.06
Process Leaders 3.58
Table 149: Maturity Scores for People Capability Areas
Table 149 reflects capability maturity scores ranging from 2.47 to 4.06,
suggesting a marked difference in the progression of the capability areas.

Business Process Management: Progression and Maturity
- 13:607 -
Process Skills and Expertise (3.29)
Within Process Skills and Expertise, the Researcher explored how Company M
identified and management process skills and expertise. This included how
Company M captured available skills and expertise, how they matched those
required and how they managed any imbalance.
When discussing the identification and mapping of process skills and expertise
within Company M, participants indicated:
“…our competency development system is about individual or
organisational development. What you need to do, how you‟re going,
what gaps have you got, where can we take you, what do you want to
do, where do you want to go, what do you want to see (…) against
the organisational requirement…”
“…what is it that key roles need in order to be competent (…) there is
a significant process that‟s been followed, both using internal and
external resources – Duke University, Harvard, Princeton, Curtin
University in Australia for asset management. They are using
educational psychologists and then working with experts within the
group and then doing benchmarking against world best practices
organisations, GE, Shell and so on…”
This highlights the potential for a lack of high correlation between
measures of capability areas within a given factor.
This is important to the development of a theoretical measurement
model for BPM Maturity as it brings into question the suitability of
reflective measures that require high levels of correlation between
measures.
Appendices
- 13:608 -
The competency program was not specific to process competency, also including
functional competency. However, the development of the competency program,
and the inclusion of process competencies, showed that Company M (and
Company P) was committed to the identification and management of process
skills and expertise. This was evident in comments such as:
“…we are looking at people understand our business models, our
business improvement models such as Six Sigma and Lean,
understanding our strategic vision, understanding the key result
areas, the pillars and where they fit…”
Furthermore, participants discussed the potential for integrating resource
capability with other aspects of business. For example, participants indicated:
“…over the next 5 years we‟ll be implementing the business solution
which is based on the SAP, enterprise resource platform (…)
Company P are looking at developing it as a whole of business cycle
system as opposed to just an accounting system or a production
management or a learning management system…”
“…via a common port (…) to do knowledge management work,
identify the processes and then store all that data and then use that
data objects multiple times in multiple different areas to derive
benefit, capacity planning, workforce planning, skills development,
individual development…”
These comments reflect the integrative role of processes throughout the
business and the need to identify, build and align process skills and expertise.
Process Management Knowledge (3.22)
In the area of Process Management Knowledge, the Researcher explored how
Company M used and built knowledge about the BPM Initiative within the
organisation. In discussing the benefits of developing process-based knowledge,
participants stated:
Business Process Management: Progression and Maturity
- 13:609 -
“…it‟s aligning the way that we do work so that if we want to move
this manager to this organisation they don‟t spend the first six months
trying to figure out how to order (…) they can walk in and they‟ve got
general familiarity…”
“…you don‟t have to retrain and relearn and so the portability of staff
and the portability of knowledge becomes that much greater…”
This suggests that a key benefit for building this knowledge was the increased
effectiveness of staff that transferred to different locations within the business.
Participants also acknowledged the benefit of retaining process management
knowledge stemming from the increased integration of BPM across the wider
Company P group.
When discussing how individuals built knowledge of BPM within the organisation,
participants credited process improvement methods such as Six Sigma with
increasing BPM knowledge, indicating
“…there‟s probably a good understanding of process management at
crew leader level, previously it would‟ve been at superintendent level
so I think Six Sigma has pushed that down…”
“…knowledge of process management initiatives would be varied
across MRU‟s (…) I think the driver of that would be the number of
projects that have gone on in those particular MRU‟s…”
This suggest that direct involvement in process projects will lead to higher levels
of BPM knowledge that through other tacit means of knowledge acquisition. To
this end, participants noted the difficulty in capturing and embedding tacit process
management knowledge and experience. For example, participants indicated:

Appendices
- 13:610 -
“…that is one of the issues at the higher levels, people probably stay
in roles three to four years and then move on (…) it is very difficult to
actually hand over that knowledge (…) reading through doesn‟t really
explain why decisions were made (…) it doesn‟t give context (…) and
a lot of things which relate to a decision aren‟t written down in the
documentation anyway…”
“…we do capture in our systems the way we document and the
process but we don‟t necessarily document the experience that we
got from that. We‟re hoping that the people who interact with
consultants in the project team pick up knowledge but it‟s not part of
their task to say okay, you shall become the expert from this
person...”
“…I don‟t think we capture it and embed it. We have it there for a
fleeting moment and then it goes again…”
As seen earlier with the reliance on individuals for ensuring standardisation of
practices, in deference to implementing standards, an inability to easily and
successfully capture and transfer BPM knowledge raises the potential for such
knowledge to remain within individuals.
Process Education and Training (2.47)
For the area of Process Education and Training, the Researcher explored the
means by which people are able to gain and develop their required process
related competencies and knowledge.
The importance of Process Education and Training was evident in comments
including:
“...business process education is critical...”
“...communication and training is key...”
The lower level of maturity calculated for Process Education and Training may
seem contradictory to earlier evidence of education and training occurring with
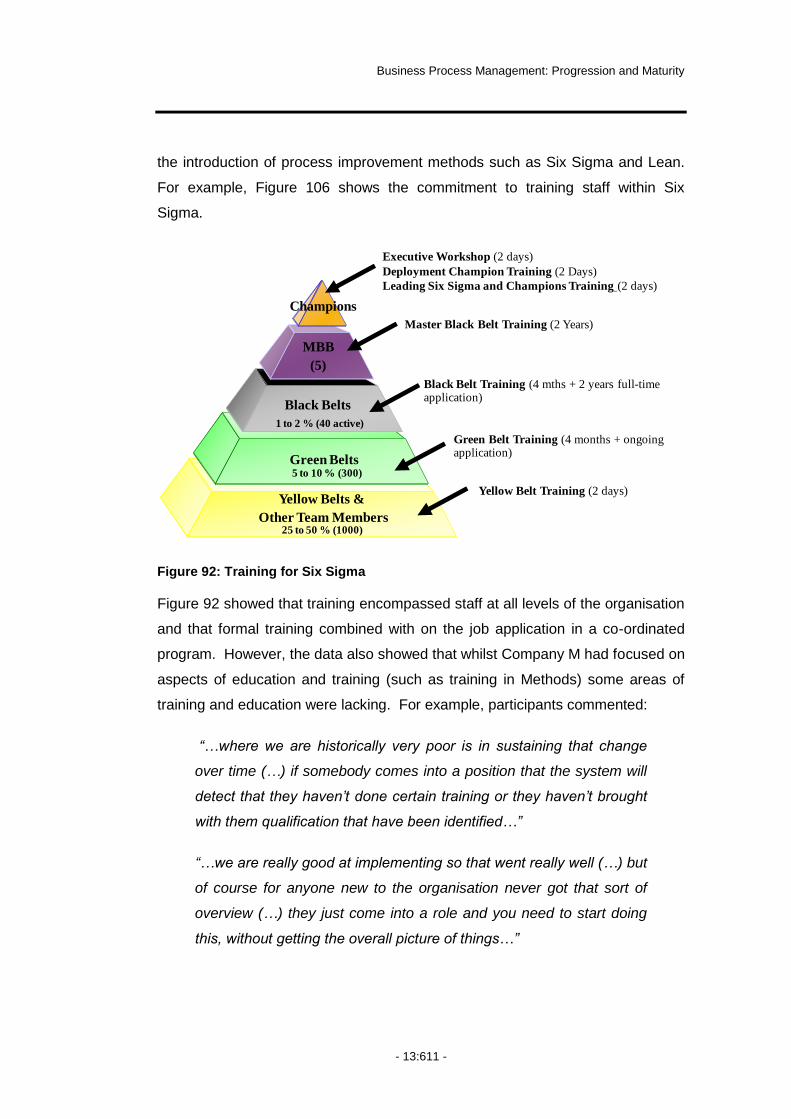
Business Process Management: Progression and Maturity
- 13:611 -
the introduction of process improvement methods such as Six Sigma and Lean.
For example, Figure 106 shows the commitment to training staff within Six
Sigma.
Figure 92: Training for Six Sigma
Figure 92 showed that training encompassed staff at all levels of the organisation
and that formal training combined with on the job application in a co-ordinated
program. However, the data also showed that whilst Company M had focused on
aspects of education and training (such as training in Methods) some areas of
training and education were lacking. For example, participants commented:
“…where we are historically very poor is in sustaining that change
over time (…) if somebody comes into a position that the system will
detect that they haven‟t done certain training or they haven‟t brought
with them qualification that have been identified…”
“…we are really good at implementing so that went really well (…) but
of course for anyone new to the organisation never got that sort of
overview (…) they just come into a role and you need to start doing
this, without getting the overall picture of things…”
Master Black Belt Training (2 Years)
Black Belt Training (4 mths + 2 years full-time application)
Yellow Belt Training (2 days)
MBB
(5)
Black Belts
Champions
Green Belts
Yellow Belts &
Other Team Members
Executive Workshop (2 days)
Deployment Champion Training (2 Days)
Leading Six Sigma and Champions Training (2 days)
1 to 2 % (40 active)
5 to 10 % (300)
25 to 50 % (1000)
Green Belt Training (4 months + ongoing application)

Appendices
- 13:612 -
These comments highlighted the importance of ensuring an on-going
commitment and attention to training as people enter the organisation or move
around the organisation. Furthermore, some comments reflected the need to
ensure people were educated about the entire process. For example,
participants indicated:
“…soon we are going to be One-Company P (…) that is going to be
the real challenge and then understanding what their part is in that
overall process and how they play an important part in that areas has
a know on effect, upstream and downstream of where they are…”
“…not just system training, but the way an end-to-end process is
rolled out across the business in a common way...”
“...leadership must understand end-to-end process to provide
appropriate guidance...”
Thus, for Company M educating about the use of tools or methods are only a part
of what is necessary for their BPM Initiative. These comments highlighted the
importance of educating people about the bigger picture so that they could
understand how their role contributed to the entire process. Furthermore, they
showed the necessity to educate at both the operational and the leadership level.
Process Collaboration and Communication (4.06)
In the area of Process Collaboration and Communication, the Researcher
considered how people collaborate within and across processes. This includes
the ability to access information about other key processes or other components
of a key process and the way people worked together to resolve issues that
affect processes.
The importance of collaboration to the BPM Initiative was evident in the
introduction and progression of the One-Company M concept and comments
including:
“...collaboration to see the „One-Company M‟ benefits...”
Business Process Management: Progression and Maturity
- 13:613 -
This showed that collaboration played a key role in overcoming regional
segregation and in increasing consistency across the sites.
The continuing importance of collaboration was evident when discussing the
increasing role of Company P in the BPM Initiative. Here participants indicated:
“…Company P will be driving (…) collaborative forums to be much
more knowledge sharing amongst like groups…”
This highlighted the continuing role of collaboration in the extension of BPM
concepts within Company P, and consequently, within Company M.
Process Leaders (3.58)
In exploring Process Management Leaders, the Researcher considered the
approach taken to recognising and advancing process management leaders. In
discussing how Company M identified process leaders participants indicated that:
“…there‟s no formal process in the system to identify process leaders
(…) there are no triggers…”
Participants indicated there was an informal approach to letting process leaders
evolve in line with further definition occurring around processes. For example
one participant indicated:
“…business process leaders will start to evolve within that speciality
(…) I don‟t know of a particular strategic move to do that…”
The consequence of not formalising what is required in process leaders was
evident when discussing the expectations of individuals seen to be process
leaders. For example, one participant indicated:
“…in some areas we don‟t clearly define it for people but we
expect it of them (…) they tend to work it out (…) sometimes quite
quickly, sometimes quite painfully…”
During the workshop, participants recognised a range of skills and attributes
considered desirable in Process Leaders. The Researcher has grouped these

Appendices
- 13:614 -
into People skills that include the ability to encourage collaboration and manage
change, process skills encompass technical ability and understanding of end-to-
end process consequences, problem-solving skills capture the ability to think
creatively and innovatively whilst personal attributes, reflect elements such as
being thick-skinned and having high energy levels as detailed in Table 150.
Attributes Supporting Statements
People skills …they‟ve got to have a good understanding (…) that it‟s not a silo, it‟s across stream where you can‟t be in your own silo and that‟s something that‟s been hard for Company M to get over
…good change agents
…leadership skills, communication skills (…) people skills side of it is probably more important than the purely technical side of whatever the process is
…dynamic, willing to change, willing to drive changes (…) probably people focused, not driven so much by status
…leadership skills
…good negotiation/influencing skills
…communication skills, interpersonal skills, negotiation skills
…good interpersonal skills and the ability to lead process improvement teams
Process skills …a pretty good understanding of end-to-end impacts, upstream and downstream of their process
…some technical knowledge of the processes they‟re involved in, some levels of commercial acumen
…good process knowledge
…process experience
…technical knowledge of the process
Problem-solving skills …they need to be able to think outside the box so that they look at opportunities, not the way we‟ve been doing it for the last thirty years
…logic
…good analytic skills
Personal Attributes …thick skinned
…someone who makes sure the controls work and work properly
…tenacity and energy to drive the goal
Table 150: Desirable Attributes of Process Leaders

Business Process Management: Progression and Maturity
- 13:615 -
Culture
The maturity score for Culture, calculated from the Maturity Survey data, was
3.15. Next to People, this was the highest maturity scores for Company M.
Similarly, as with People the standard deviation within responses contributing to
the Culture maturity score was 0.6 showing a low level of variance between
responses. However, this represented the highest standard deviations of all
factors within Company M. Table 151 shows individual capability area scores
that combine to give the overall factor score.
Capability Area Maturity Score
Responsiveness to Process Change 3.38
Process Values and Beliefs 3.42
Process Attitudes and Behaviours 2.88
Leadership Attention to Process 3.79
Process Management Social Networks 2.29
Table 151: Maturity Scores for People Capability Areas
This table reflects capability maturity scores ranging from 2.29 to 3.79,
suggesting a marked difference between the capability areas.
Responsiveness to Process Change (3.38)
For the area Responsiveness to Process Change, the Researcher considered
how individuals respond to process change and how individuals contribute to the
identification and instigation of process change. In this regard, participants felt
that, through the adoption of improvement methodologies, Company M supported
individuals in showing initiative, stating that:
“…if you come up with a reasonable idea, and it‟s well thought
through, it potentially will get up (…) Six Sigma‟s driven that and Lean
will probably make us a little bit tighter but Lean is only new and it‟s
certainly not something that‟s embedded right across the organisation
(…) I don‟t think we‟ve got a Lean view just yet…”

Appendices
- 13:616 -
Comments such as this highlight the long-term nature of achieving benefits and
embedding practices, in this case embedding the use of methods in the mindsets
of individuals.
With regard to how people respond to process change, participants indicated
that, providing individuals could see the benefit of the change, they would
generally be positive. For example, participants stated:
“…they‟re used to the process of change and people are very
accepting of it as long as it seems to be improving their life…”
“…people seem to be very used to change and happy with
change…”
The constant state of flux created by continual process change was something
participants saw as becoming a potential issue, stating:
“…the challenge is in how quickly you change because (…) when
you‟re in a constant state of change you are not embedding the
value…”
“…they just don‟t know which way is up at the present time (…) and
obviously that‟s going to have major impact on business…”
In discussing the increasing role of Company P with respect to instigating
process change within Company M, participants provided mixed feedback. On
the one hand, one participant indicated resistance was likely stating:
“…there‟ll be some resistance to that, there already has been but (…)
the decision‟s been made and we‟ve got to work through that with the
best mechanism, but there‟s a lot of change management in that…”
On the other hand, another participant indicated that a positive response was
more likely to be forthcoming, stating:
Business Process Management: Progression and Maturity
- 13:617 -
“…if there‟s less change people will be fairly happy, because there
has been a lot of change over the last few years but I think even if the
change is coming from Company P, as long as they‟re kept informed
and brought along from the very start of the process I think it will go
quite smoothly…”
These statements show that individuals are more likely to be positive about
change if they understand and can see benefit in the consequence of change.
Furthermore, the comments highlight the importance of communicating the
rational for change and for engaging individuals in the acceptance and promotion
of process change. However, the comments from participants also indicate a
need to monitor the pace of change and to allow time for embedding benefits and
the potential for conflict and negative reaction when too much change happens
within a relatively short period.
Process Values and Beliefs (3.42)
Within the area Process Values and Beliefs, the Researcher considered the
commitment, integration and articulation of BPM values within Company M. This
included consideration of corporate communications such as vision and mission
statements, annual reports, internal presentations and articles in the press
In discussing the organisations values and beliefs with regard to BPM, there was
a strong sense that the senior executives within Company M actively promoted
the values through the organisation. For example, participants stated:
“…well it started with the then CEO (…) he had a relatively new
executive committee and so there was work done around vision and
core purpose with the EXCO and then that got cascaded to the
general managers…”
According to participants, this commitment reflected in the external corporate
identity, through changes in the logo, and in the awareness of individuals of
EXCO and their role. One participant stated:

Appendices
- 13:618 -
“…number one is that everyone was aware of the EXCO so from a
top down perspective that was huge, hey we are One-Company M
(…) we‟ve even changed the logo to read One-Company M …”
The role of BPM was also clearly visible in the diagram depicting the vision, an
extract of which is in Figure 93.
Figure 93: Linking Company M Vision with Key BPM Concepts
Participants indicated that the role of this depiction, and its use in Company M
was to show how the different concepts tied together. For example, participants
indicated:
“…what we‟re doing is we look at the (…) vision and all the rest of it
and how we all try to work within that, and quite often the vision part,
people don‟t necessarily believe them or whatever but what we‟re
trying to do here in the organisation is actually tie what we do to that
and keep tying it back all the time…”

Business Process Management: Progression and Maturity
- 13:619 -
“…it‟s not all that much new here but (…) what this did was actually
put it into a structure and a framework that people could all of a
sudden, oh shit that‟s our things, all the different things that we‟re
doing, that‟s how it fits together to help us reach the vision and core
purpose...”
Despite this articulation of the BPM concept in the vision, some participants
indicated that there was potentially a lack of clarity in the detail around this. For
example, participants stated:
“…there isn‟t this blueprint that‟s been printed (…) thou shalt do such
and such…”
“…I don‟t think we have that, like you probably gathered from our
questions about what BPM is, I haven‟t seen Company M formalise a
concept of it…”
These comments indicate that a visible connection between the BPM Initiative
and the vision of the organisation is important to promoting the role of the
Initiative within the organisation. The comments show the value in doing so lies
in the ability to relate progress back to the vision and to show how the big picture
comes together.
Process Attitudes and Behaviours (2.88)
In the area of Process Attitudes and Behaviours, the Researcher considered the
role of attitudes and behaviours of individuals in supporting the BPM Initiative. In
discussing issues that were critical to progressing BPM, participants indicated the
need to focus on individual attitudes and behaviours, stating:
“...managing change in people‟s attitudes and perceptions...”
“...cultural aspects and transition support is essential...”
Participants highlighted the role of communication in influencing BPM attitudes
and behaviours and achieving buy-in from individuals stating:
Appendices
- 13:620 -
“…people are still in that state of flux they don‟t know what‟s going
on and it comes down to just how much communication they‟ve had
in each of those areas too…”
“…it probably comes down to the communication and the buy-in up
front. I think if they feel part of the processes it will go very well and
very smoothly. If it‟s done leaving them in isolation then like most
places it will get a fairly bumpy ride…”
The potential for attitudes and behaviours to affect the BPM Initiative moving
forward was evident when discussing the increasing role of Company P.
Participants stated:
“…each site can control what they do, and that‟s kind of going down
to that level, the individual is, you‟ve got the tools well go and use
them and go and improve (…) at the lower level people still get the
ability to look at how can they improve their non SAP processes (…)
as long as they don‟t lose that it will get enough support that the
philosophy of openness and giving people the freedom…”
“…it‟ll be about enablers, down to behaviour, down to what‟s actually
driving it, have we delivered those enablers or how have we had that
behaviour, we‟ve actually identified behavioural changes that need to
happen (…) so has that behavioural change happened, are people
aligned with where we want them to be aligned…”
“…the minute they can‟t find it they‟re going to go off and buy it
somewhere else and they‟ll buy it direct charge and it won‟t be
through our inventory (…) because the minute they hit the issue
they‟ll go off and do it externally, or they‟ll put it on their credit card or
they‟ll do something else and all of a sudden we‟re in chaos…”
Furthermore, some participants recognised the likelihood of a detrimental effect
on attitudes and behaviours in the immediate time after a major process change.
For example, one participant indicated:

Business Process Management: Progression and Maturity
- 13:621 -
“…my earlier comments on the valley of despair (…) it‟s about
keeping us in the top of that and not letting us get down to the bottom
because otherwise it‟s long haul out of it again…”
These comments show that communication plays an important role in changing
the attitudes and behaviours of individuals. They also show that attitudes and
behaviours are likely to ebb and flow with the impact of major change in the
organisation so regular attention to these is important.
Leadership Attention to Process (2.88)
Within the area Leadership Attention to Process, the Researcher explored the
role of senior management and executives in the promotion and support of the
BPM Initiative.
Participants within Company M highlighted the importance of leadership attention
to the progression and sustainability of BPM, stating that:
“...must be lead from the top and have buy-in across the whole
organisation...”
“...senior management support and visible involvement is essential...”
“...senior leadership engagement/alignment is needed to drive
change...”
“…if there wasn‟t a very visible engagement by the operating GM‟s
and management, executive levels of the organisation, the long term
viability of the initiative would be in jeopardy…”
Challenging the perception that lower levels of an organisation can instigate BPM
within organisation, participants within Company M indicated:
“…the bottom up can create a bit of noise about it but unless you get
that high level engagement then it just stays there as noise…”
Furthermore, participants indicated that the level of commitment from executive
leadership affected the success of the Initiative even when there was

Appendices
- 13:622 -
engagement of lower levels, stating:
“…it would be more difficult to do a bottom up approach without clear
indication of the importance at the top end. We have a number of
initiatives that we have seen not do well because it was evident that
the top layers weren‟t engaged…”
Participants indicated that this was primarily due to the inability of lower levels of
the organisation to affect change in necessary areas. For example, participants
indicated that:
“…because there are so many things that are across a business unit
and across product groups and potential across Company P, until
you‟ve got that high level stakeholder engagement, who can say yes
okay we‟re going to take it across those units, then it will only go so
far…”
“…resourcing, whether it be time or, a new org structure that needs to
be put in place (…) if that commitment‟s not there at the top level then
those things won‟t happen…”
These comments indicate that whilst lower levels of the organisation can
generate interest in BPM, it is the leadership attention and support that most
affects the success of the initiative. To enable the organisational transition that
goes hand in hand with implementing BPM Initiatives, people with authority and
the ability to affect fundamental changes in the organisation are required to lead
the initiative.
Process Social Networks (2.29)
For the area of Process Management Social Networks, the Researcher explored
the extent to which Company M facilitated the use of process-related forums and
networks.
Participants highlighted the role of process networks in comments including:

Business Process Management: Progression and Maturity
- 13:623 -
“…we‟ve got a fair way to go yet (…) we‟re definitely getting better
(…) over the last few years a lot more initiatives have brought groups
together (…) people start thinking about how will we do it one way…”
Furthermore, the need to maintain a focus on these and their importance to
overall collaboration across disparate areas reflected in comments such as:
“...people have tended to go off into their silos a little bit more purely
because those forums fell away a little and a few people changed
positions and those sorts of things that go on and that sustainability
model just wasn‟t quite there...”
This indicated that the role of process networks was important, acting to
overcome barriers and contribute to a standardised approach to conducting
business. However, without consistent attention during the formative period,
there was no assurance of sustainability.

Business Process Management: Progression and Maturity
- 13:625 -
13.3.2 Information Sheet and Informed Consent
Information Sheet
Chief Investigators: Tonia de Bruin Michael Rosemann
PHD Candidate, QUT Professor, QUT
Email: [email protected] Email: [email protected]
Phone: 3864 9476 Phone: 3864 9473
Project Description
QUT researchers have recognised that business process management (BPM) is
emerging as an important management practice, providing organisations with a
means of increasing competitiveness and sustainability in times of market
uncertainty, increasing globalisation and constantly changing business
conditions.
Investigation undertaken by QUT researchers from July 2003 until now has
confirmed that, despite the potential benefits to be gained, there are relatively few
organisations that have been able to successfully implement comprehensive
BPM practices. A number of studies have highlighted anomalies in the meaning
and application of BPM. These studies have also identified factors critical to the
success of BPM practices together with barriers to successful implementation of
such practices. These studies however provide little context for BPM application
or assistance to organisations in understanding how to progress with BPM
implementation and improvement.
QUT researchers are working to develop a generic BPM Maturity (BPMM) model
that can be used as a tool within a comprehensive BPM toolkit. The BPMM
model will enable the diagnosis of current BPM maturity stages and the
development and targeting of BPM strategies based on the relative strengths and
Appendices
- 13:626 -
weaknesses identified. This will enable organisations to improve their BPM
activities and their ability to attain BPM benefits.
About this phase of the study:
QUT has approached Company M with a view to advancing research on the
BPMM model that has been developed. In particular, the researchers see working
with an industry partner as an opportunity to:
Assess the BPMM model with regard to its significance and usefulness
to organisations that are practicing BPM;
Conduct in-depth interviews with industry practitioners in order to gain a
deeper understanding of the Factors selected for use within the model
(i.e. Strategic Alignment, Governance, Methods, Information
Technology, People and Culture);
Conduct workshops and survey assessments to assess the validity of
questions contained within the BPMM model‟s assessment surveys for
assessing BPM capability areas; and
Ensure that the model has a strong practical basis that will provide
benefit to industry practitioners and improve BPM practices both within
Australia and internationally.
The structure of this partnership will include 7 distinct phases including:
Initial meeting and planning session
One-on-one interviews with nominated Executives
Workshops and BPM Operational Planning survey with nominated key
BPM personnel
On-line BPM Operational Practice survey with nominated employees
Final presentation
Written report
Feedback survey on the assessment process

Business Process Management: Progression and Maturity
- 13:627 -
In the initial stages of this case study, Company M will nominate a specific „unit of
analysis‟ for which the BPMM model assessment will be undertaken. Participants
for the various stages of the assessment will be nominated by Company M
management at the commencement of the study. Participants will be contacted
regarding their participation in the manner agreed between the Chief Investigators
and Company M at the initial planning session. The study will be undertaken on
Company M‟s premises where facilities will be made available in a manner agreed
between the Chief Investigators and Company M at the initial planning session.
The one-on-one interviews will be conducted with Company M executives to gain
an understanding of the strategic intent with respect to BPM practices. These
sessions will focus on the 6 factors included in the model and are expected to take
approximately 1.5 hours each. Each interview will involve a Chief Investigator and
a nominated Company M executive. The number of interviews conducted will be
dependent upon the number of executives nominated by Company M. The aim of
the interviews is to gain an in-depth understanding of what Company M is doing (or
planning to do) in each of the 6 factor areas. Participants will be provided with a
Case Study Worksheet approximately one week prior to each session to enable
preparation for the session. All interviews will be recorded and later transcribed for
analysis purposes. Transcriptions will be provided to Company M for confirmation
of accuracy prior to finalising analysis. Following analysis, tapes will either be
returned to Company M or destroyed (as preferred by Company M).
Transcriptions will be retained by the Chief Investigators until such time as they are
no longer required for the research being conducted at which time they will either
be returned to Company M or destroyed (as preferred by Company M). The major
outcomes from these interviews will be a comprehensive understanding of the
intended BPM principles and desired BPM practices as perceived at a strategic
level.
The workshop sessions will be conducted with selected groups of Company M‟s
key BPM personnel. Each workshop will focus on a specific factor and the 5
capability areas identified within this factor. Each workshop will include a small
number of „expert‟ participants nominated by Company M together with a Chief
Investigator who will facilitate the workshop sessions. Each workshop will be
approximately 3 hours in duration and will be conducted in two sessions. The first

Appendices
- 13:628 -
session will run for approximately two hours and will utilise the same questions
asked during the executive interviews. The second session will run for
approximately 1 hour and will include the completion of a BPM Operational
Planning survey. A second representative from QUT who has been involved in the
development of the BPMM maturity assessment instrument and database is also
likely to be present at the second session within each workshop. All workshops will
be recorded and later transcribed for analysis purposes. Transcriptions will be
provided to Company M for confirmation of accuracy prior to finalising analysis.
Following analysis, tapes will either be returned to Company M or destroyed (as
preferred by Company M). Transcriptions will be retained by the Chief
Investigators until such time as they are no longer required for the research being
conducted at which time they will either be returned to Company M or destroyed
(as preferred by Company M). Results from the survey will be stored in a database
created by QUT for the purpose of undertaking the BPMM assessments. Results
will retained within this database until such time as they are no longer required for
the research being conducted, or until such other time as agreed between the
Chief Investigators and Company M. The major outcomes from the workshops will
be a comprehensive understanding of BPM principles and practices from an
operational planning perspective including a deeper understanding of the
operational planning for the capability areas identified for each of the factors.
The on-line surveys will be undertaken by staff within the „unit of analysis‟ for
which the BPMM assessment is to be conducted. Participants will be provided
with access to a survey contained within a secure environment. They will gain
access using a user-name and password provided by the Chief Investigators. The
aim of this survey is to assess the actual BPM practices and perceptions within the
unit of analysis. Results from the survey will be stored in a database created by
QUT for the purpose of undertaking the BPMM assessments. Results will retained
within this database until such time as they are no longer required for the research
being conducted, or until such other time as agreed between the Chief
Investigators and Company M. The major outcomes from these surveys will be a
comprehensive understanding of BPM principles and practices as perceived by
staff at an operational level including a deeper understanding of the operational
application of the capability areas identified for each of the factors.
Business Process Management: Progression and Maturity
- 13:629 -
The final feedback survey will be undertaken by the Chief Investigators in
conjunction with the Company M representative/s that are sponsoring the case
study. The aim of this survey is for the Chief Investigators to receive feedback on
the conduct of the assessment in order to improve this process. This assessment
will not be undertaken until all presentations and reports are completed and
provided to Company M.
Expected Benefits and Risks
Participation in this study is expected to provide Company M with an in-depth
assessment of their current BPM maturity and the Chief Investigators with a rich
source of data for use in further developing the BPMM Model. Company M will
receive first hand results of the study whilst their representatives will receive
exposure to current BPM research and information. The outcomes from all
sessions will be analysed and presented to Company M in a final presentation at a
date agreed between the Chief Investigators and Company M. This presentation
will include providing Company M with a maturity assessment for each of the
factors and capability areas within the BPMM model based on the data gathered
throughout the various assessment sessions. Following this presentation,
Company M will receive a written report that provides further details of the
assessment undertaken. There are no foreseen risks associated with Company
M‟s representative‟s involvement in this study.
Audio Recording of Interviews
With Company M‟s permission, the Chief Investigators would like to audio record
all interviews and workshops for improved data capture, transcription and
analysis. Company M may not wish to grant permission to have the interviews
and workshops with their representatives recorded. This will not impact on
Company M‟s continuing participation in the project. If permission is granted for
the use of audio recording, all audio files will be either destroyed or returned to
Company M once they have been transcribed.

Appendices
- 13:630 -
Confidentiality
All recordings, transcripts, documentation and other information and data
gathered during the assessment will be kept strictly confidential. Documentation
will be assigned a code for use in information management by the Chief
Investigators. The identity of participants will be kept confidential and will be
known only to the Chief Investigators. Furthermore, no-one outside the QUT
research team will have access to the information provided by Company M
representatives. In general, aggregated results will be reported. While, some
individual responses may be reported, no individual will be identified with any of
these responses unless explicitly agreed between the Chief Investigators and
Company M. All publications arising from the case study will be approved by
Company M prior to publication.
Voluntary Participation
Participation in this study is purely voluntary. Company M may wish to withdraw
participation of their representatives at any time, without penalty or judgement.
Questions / further information
If a Company M representative would like to obtain additional information or has
any queries they would like addressed, they can contact the research team:
Ms Tonia de Bruin
(Chief Investigator / Researcher) Business Process Management Group Faculty of Information Technology QUT Level 5, 126 Margaret St Brisbane 4000,
Australia Tel: (07) 3864 9476 Fax: (07) 3864 9390
Mobile: 0402 794 866 Email: [email protected]
Prof. Michael Rosemann
(Chief Investigator / Professor)
Business Process Management Group Faculty of Information Technology QUT Level 5, 126 Margaret St Brisbane 4000,
Australia Tel: (07) 3864 9473 Fax: (07) 3864 9390
Email: [email protected]

Business Process Management: Progression and Maturity
- 13:631 -
Concerns / complaints
If you have any concerns or complaints about the ethical conduct of the project you
could contact the Research Ethics Officer on 3864 2340 or
Feedback
Feedback to Company M will be in the form of results of the study provided in a
presentation and report. Feedback to the Chief Investigators will be in the form of
a Feedback assessment conducted with the Company M sponsors following the
conduct of the final presentation and provision of the written report.
Thank-you Company M for your interest and support of this project.

Appendices
- 13:632 -
Informed Consent Form
Chief Investigator: Tonia de Bruin (PHD Candidate, QUT)
Email: [email protected]
Chief Investigator: Michael Rosemann (Professor, QUT)
Email: [email protected]
Statement of consent
By signing below, you are indicating that you (on-behalf of Company M):
have read and understood the information sheet about this project;
have had any questions satisfactorily answered;
understand that any additional questions can be raised with research team at any point;
understand that Company M is free to withdraw participation of its representatives at any time, without comment or penalty;
(Please tick only one)
agree for Company M representatives to participate in the project.
And grant permission to audio record interviews
But, do not grant permission to audio record any interviews
Name
Signature
Position
Date / /

Business Process Management: Progression and Maturity
- 13:633 -
13.3.3 Interview Guide
Business Process Management Maturity
Assessment Strategic Intent Interviews
Company M has commenced a project to assess Business Process Management
within the organisation. The outcomes from this assessment will provide
guidance to Company M for developing future Business Process Management
strategies. This assessment is being conducted by researchers from the
Business Process Management Group at Queensland University of Technology
(QUT). The overall assessment is conducted from three discrete perspectives
being: strategic intent, operational planning and operational practice. You have
been nominated by Company M to participate in the strategic intent component of
the overall assessment.
The strategic intent component is designed to evaluate the maturity of Company
M‟s Business Process Management initiative based on the perceptions of senior
management and executive level staff. The focus is on understanding why the
Business Process Management practices have been developed in the manner in
which they have. The assessment takes the form of one-on-one interviews which
are expected to take approximately 2 hours. In total six interviews will be
conducted with senior managers of Company M.
The interview itself is structured in three parts. First, there are a number of
demographic questions. These questions are to assist us (the QUT researchers)
in the analysis of data gathered during the survey. Second, there are a number
of general explorative questions relating to the Business Process Management
initiative within Company M. Finally, the remaining questions are separated into
Company M Logo
Removed

Appendices
- 13:634 -
six distinct sections each relating to a specific aspect considered critical to the
success of business process management initiatives. The six aspects are
considered specifically in the context of business process management and
include: Strategic Alignment, Governance, Methods, Information Technology,
People and Culture.
The assessment is undertaken in accordance with QUT‟s ethics requirements.
Your confidentiality is assured at all times. At no time will responses be
attributed to specific individuals without the explicit permission of the person
involved. If you would like further information regarding the ethics arrangements
that are in place for this assessment please contact Tonia de Bruin at
The following questions relate to the Strategic Alignment of Business Process
Management. In this context, Strategic Alignment ensures the continual tight
linkage of organisational priorities and processes critical to achieving business
goals.
Question 1
From a strategic perspective, how and why are process improvement initiatives
identified and prioritised within Company M? How is this expected to change as
the Business Process Management initiative matures?
Question 2
Describe the existing relationship between process capabilities and strategy.
How does Company M‟s strategy guide process-related objectives, and to what
extent do process-related capabilities enable or constrain this strategy? What
plans are in place for affecting this relationship and why?
Question 3
To what level have processes been defined within Company M? How are
relationships and interfaces between processes and with other entities (e.g.

Business Process Management: Progression and Maturity
- 13:635 -
subsidiaries, parent company, suppliers, customers) incorporated? What has
been the driver of defining processes within Company M? Are there any plans to
extend the process-view of Company M and why?
Question 4
How is process-related performance captured, used and reported? How and why
is this expected to change as the Business Process Management initiative
matures?
Question 5
Who are the major Business Process Management stakeholders? What role
does each of these stakeholder groups have? Are there other major
stakeholders internal or external to Company M that are not included in this list?
Why or why not?
Question 6
Do you think the present relationship between critical processes and strategy is
an enabler or a constraint for the Business Process Management initiative and
why?
The following questions relate to Business Process Management Governance.
In this context, BPM Governance provides relevant and transparent
accountability and decision-making processes together with reward and
remuneration programs to guide actions.
Question 1
Within the broader Company M governance framework how is Business Process
Management Governance positioned and what role does it play? How has BPM
governance been structured and why was it done this way? What plans are in
place for the further development of BPM Governance and why?
Appendices
- 13:636 -
Question 2
Who is responsible for introducing and developing process-related roles within
Company M? How are process-related roles and responsibilities assigned?
What is their actual impact? How are these roles reflected in the organisational
structure and individual career paths? What plans are in place for further
development of process-related roles and responsibilities and why?
Question 3
How is process-related performance linked to organisational performance and
strategic goals? Who is responsible for establishing and monitoring process-
related metrics? How and why does process-related performance impact reward
and remuneration programs? What plans are in place to further develop the
linkage between process-related performance and strategy and why?
Question 4
What process-related standards are used? How are these standards selected?
What plans are in place to change these and why?
Question 5
How is compliance with process-related standards governed? What are the
drivers of compliance and why is this? What plans are in place to change this
and why?
Question 6
Do you think the present governance framework is an enabler or a constraint for
the Business Process Management initiative and why?

Business Process Management: Progression and Maturity
- 13:637 -
The following questions relate to the methods employed to manage processes
throughout their lifecycle of: define, execute, monitor and improve; as well as to
other methods used within the Business Process Management initiative, e.g.
BPM training methods or methods used to deploy strategic objectives.
Furthermore, in this context BPM methods are the approaches and techniques
that support and enable consistent process-related actions and outcomes.
Question 1
What approach is taken to select process-related methods? Who has been the
driver of past selection? How and why has this changed over time?
Question 2
What methods are currently used within the Business Process Management
initiative? What plans are in place to change these and why?
Question 3
What facets of these methods are most important to the Business Process
Management initiative and why? How and why has this changed over time?
Question 4
What facets of these methods are least important to the Business Process
Management initiative and why? How and why has this changed over time?
Question 5
Do you think the current methods are an enabler or a constraint for the Business
Process Management initiative and why? What is the overall level of satisfaction
with the existing methods?

Appendices
- 13:638 -
The following questions relate to the information technology (IT) employed to
manage processes throughout their lifecycle of: define, execute, monitor and
improve; as well as to other IT used within the Business Process Management
initiative e.g. project management software or a process-management dash-
board. Furthermore, in this context Information Technology is the software,
hardware and information management systems that enable and support process
activities.
Question 1
What approach is taken to select process-related IT? Who has been the driver of
past selection? How and why has this changed over time?
Question 2
What IT is currently used within the Business Process Management initiative?
What plans are in place to change this and why?
Question 3
What facets of this IT are most important to the Business Process Management
initiative and why? How and why has this changed over time?
Question 4
What facets of this IT are least important to the Business Process Management
initiative and why? How and why has this changed over time?
Question 5
Do you think the current IT is an enabler or a constraint for the Business Process
Management initiative and why? What is the overall level of satisfaction with the
existing process-related IT?

Business Process Management: Progression and Maturity
- 13:639 -
The following questions relate to the human resource element of Business
Process Management. In this context, People are the individuals and groups
who continually enhance and apply their process-related expertise and
knowledge.
Question 1
Describe the current level of process skills and expertise that exist within
Company M. What opportunities and challenges are presented by existing levels
and why is this? What plans are in place to change these levels and why?
Question 2
Describe the current level of Business Process Management knowledge that
exists within Company M. What opportunities and challenges are presented by
existing levels and why? What plans are in place to change these levels and
why?
Question 3
How are individuals supported in extending and updating their process-related
skills, expertise and knowledge? Why has this approach been adopted? What
plans are in place to change this and why?
Question 4
How do individuals collaborate on processes that cross functional boundaries?
How is this supported by the communication of process management activities?
What plans are in place to change this and why?
Question 5
What attributes are considered to be important in „process leaders‟ and why?
Within Company M do „process leaders‟ equate to „process owners‟ (or the
equivalent)? If not, why not? What plans are in place to change this and why?

Appendices
- 13:640 -
Question 6
Do you think existing process-related skills and knowledge is an enabler or a
constraint for the Business Process Management initiative? Is this consistent
with the „official‟ view?
Question 7
Do you think communication and collaboration on process-related activities is an
enabler or a constraint for the Business Process Management initiative?
The following questions relate to Company M‟s organisational culture and how
this culture impacts and influences the Business Process Management initiative.
In this context, Culture is the collective values and beliefs that shape process-
related attitudes and behaviours.
Question 1
How would you describe the culture within Company M? How and why did
Company M‟s culture influence the way in which the Business Process
Management initiative was approached and implemented? How and why has the
culture changed as the initiative has progressed?
Question 2
How and why does the existing culture impact on the Business Process
Management initiative? What plans are in place for changing the existing culture
and why?
Question 3
How is support for the Business Process Management initiative reflected in the
overall corporate philosophy? How and why is this reflected in Company M‟s
vision and mission? What plans are in place for changing this and why?
Business Process Management: Progression and Maturity
- 13:641 -
Question 4
What is the role of executive leadership within the Business Process
Management initiative? What opportunities and challenges do you think the
current executive leadership presents to the initiative? What plans are in place to
address these and why?
Question 5
What social networks (formal or informal) influence the Business Process
Management initiative? What plans are in place to change this and why?
Question 6
Do you think the present culture is an enabler or a constraint for the Business
Process Management initiative and why?


Business Process Management: Progression and Maturity
- 13:643 -
13.3.4 Workshop Guide: Strategic Alignment
Business Process Management Maturity
Assessment Operational Planning Workshops
Company M has commenced a project to assess Business Process Management
within the organisation. The outcomes from this assessment will provide
guidance to Company M when developing strategies, providing support and
allocating resources to process-related activities. This assessment is being
conducted by researchers from Business Process Management Research Group
at Queensland University of Technology (QUT). The overall assessment is
conducted from three discrete perspectives being: strategic intent, operational
planning and operational practice. You have been nominated by Company M to
participate in the operational planning component of the overall assessment.
The operational planning component of this assessment is designed to evaluate
Company M‟s Business Process Management capabilities as perceived by staff
with a high level of knowledge about the business process management activities
that take place within Company M. The focus is on understanding how current
and planned activities are conducted. The assessment takes the form of a
workshop. These workshops complement the interviews conducted in the
strategic intent component and provide a basis for further assessing the
operational practice of Business Process Management within Company M. Each
workshop will be supplemented by the completion with a Business Process
Management – Operational Planning survey by all participants.
In total six workshops will be conducted with each workshop relating to one
aspect considered critical to the success of Business Process Management
Company M Logo
Removed

Appendices
- 13:644 -
initiatives (i.e. Strategic Alignment, BPM Governance, Methods, IT, People and
Culture). Separate workshops have been established to ensure that the best
people are included for each area. Each workshop will take approximately 3-4
hours and will include up to five people.
Each workshop is structured in three parts. First, there are a number of
demographic questions. These questions are to assist us (the QUT researchers)
in the analysis of data gathered during the survey. Second, there are a number
of general explorative questions relating to the Business Process Management
initiative within Company M. Finally, the remaining questions relate to the
activities that occur within the specific aspect of Business Process Management
being assessed i.e. Strategic Alignment, Governance, Methods, Information
Technology, People or Culture.
The assessment is undertaken in accordance with QUT‟s ethics requirements.
Your confidentiality is assured at all times. At no time will responses be
attributed to specific individuals without the explicit permission of the person
involved. If you would like further information regarding the ethics arrangements
that are in place for this assessment please contact Tonia de Bruin at
Agenda
9.30 – 9.40 Introductions
9.40 – 10.00 Completion of General Questions Worksheet
10.00 – 10.25 Process Customers and Other Stakeholders
10.25 – 10.50 Strategy and Process Capability Linkage
Business Process Management: Progression and Maturity
- 13:645 -
10.50 – 11.15 Process Improvement Initiatives
11.15 – 11.40 Process Output Measurement
11.40 – 12.00 Process Architecture
12.00 – 12.15 BPM Maturity Survey
12.15 – 12.25 Consolidation of General Questions
Worksheets
12.25 – 12.30 Wrap-up
The following questions relate to the Strategic Alignment of Business Process
Management. In this context, Strategic Alignment ensures the continual tight
linkage of organisational priorities and processes critical to achieving business
goals.
Question 1
How are process improvement initiatives identified? How are these initiatives
linked to the strategic goals of Company M? How are initiatives prioritised and
co-ordinated?
Question 2
How do existing process capabilities influence Company M‟s strategies?
Similarly, how do strategies influence processes? How are existing process
Appendices
- 13:646 -
capabilities determined? How are required process capabilities determined?
What happens when there is a difference between existing and required
capabilities?
Question 3
What is the structure of Company M‟s current process architecture? How has
this architecture been derived? To what level have processes been devolved?
Is the identification of processes considered to be complete? Are relationships to
processes of subsidiary or parent companies, supplier or partnering/outsourcing
organisations known? How are processes and their relationships and interfaces
documented?
Question 4
How are the data and information required for measuring process-related
performance captured? What happens when actual performance does not meet
expected performance? Does this vary dependent on the situation? What
happens with the results of process-related performance?
Question 5
Who are the major Business Process Management stakeholders? Do these
stakeholders vary between processes? How are the needs of various
stakeholders identified and incorporated into processes? How is the stakeholder
satisfaction with process-related performance measured?
Question 6
Are there any other important aspects of aligning strategy and processes that
have not been discussed?

Business Process Management: Progression and Maturity
- 13:647 -
13.3.5 Background Survey
Demographics
Name:
Age: Sex: M F
How long have been employed by Company M?
Which town/city do you work in?
Which business unit do you work for?
What is your current position?
How long have you been in this position?
What position did you hold prior to this?
What level of business process management experience do you have?
Limited Moderate Extensive
What level of education/training have you attained?
(tick all applicable)
Yr 12
TAFE
University
Apprenticeship
Professional
Other
BPM Initiative
Question 1
What does Business Process Management mean within Company M? Is this
meaning consistent with your views of Business Process Management? If not,
how does your view differ?

Appendices
- 13:648 -
Question 2
What are the major drivers of Business Process Management within Company
M?
Question 3
Who is the sponsor of Business Process Management within Company M? Does
this sponsor also have operational responsibility for Business Process
Management?
Question 4
Describe the history and development of Business Process Management within
Company M?
Question 5
Describe the current state-of-play of Business Process Management within
Company M?
Question 6
What has been the most significant impact made by the Business Process
Management initiative so far?
Question 7
What have been the major “lessons learned” on the Business Process
Management journey thus far?
Question 8
If you could do things differently with respect to Business Process Management
initiatives undertaken to date, what would you change?

Business Process Management: Progression and Maturity
- 13:649 -
Question 9
What are your expectations with respect to future Business Process
Management initiatives within Company M?
Question 10
What are your expectations with respect to undertaking this Business Process
Management Maturity assessment?
13.3.6 Background Survey: Governance Participants
Question 1
What does Business Process Management mean within Company M?
Participant 1: Governance of the overall business process including design,
improvement and application of processes within systems
Participant 2: The management of core process within the business or RT
service providers including process design, management and
improvement.
Participant 3: Notification of what the Business Processes are: How do they
„operate‟? Are they any good? What can we do to improve? The
distinction for me RE: „physical‟ VS business process
Question 2
What are the major drivers of Business Process Management within
Company M?
Participant 1: Common way of doing work, “Learning organization”
Value add through efficiencies and cost reductions
Appendices
- 13:650 -
Physical processes „in control then capable‟ Compliance and
legislation
Participant 2: Cost and safety performance driving a lean and effective
business
Participant 3: Current frustrations
Implementation of new tools – Forces to look at underlying
business processes
Question 3
Who is the sponsor of Business Process Management within Company M?
Participant 1: CEO, through business process custodians identified with
accountabilities and resources for executing BP through the
business. GM business improvement has the overall view and
ownership of the business solution.
Participant 2: CEO via MD‟s and GM‟s
Participant 3: Chief Information Officer
Question 4
Does this sponsor also have operational responsibility for Business
Process Management?
Participant 1: No, this varies. The Manage People, Purchase to Pay, Contact
to Cash. Plan and Manage custodians have operational
responsibility. The Manage Physical Assets, Health Safety and
Environment and Manage Production aims are in support roles
and need to work through the sites to operationalise BPM

Business Process Management: Progression and Maturity
- 13:651 -
Participant 2: Yes, the performance of the organisation is monitored via its
processes
Participant 3: No HSE – M. Swyiepa
PTP – I. Lataa
HR – New Fella
Question 5
When did Company M commence adopting Business Process
Management?
Participant 1: Early 90‟s
Participant 2: Unsure – stronger focus in last 4-5 years
Participant 3: 1997 – Smelting. PEP Driver
Question 6
What have been the major Business Process Management initiatives
undertaken since that time?
Participant 1: First driven by SAP R/2 project then a number of business
process mapping and improving initiatives through the nineties
including: “PEP”, Continuous Improvement, “In Control then
Capable” in 2000 then Six Sigma, Lean 2004 – Company M
Business Solution, including defined framework and visions
articulated right across the business
Participant 2: Company M SAP program, Six Sigma and Lean programme are
the tools and methodology used

Appendices
- 13:652 -
Participant 3: Detailing B.P‟s. as part of MYSAP rollout – new tool was
catalyst for the work. More holistically - PEP – APP – ICTC –
60 – LEAN
Question 7.
What has been the most significant impact Business Process Management
has made so far?
Participant 1: Improvement in Safety Performance
Cost Reductions
Stability of physical processes
Culture of „one Company M‟ and collaboration beginning to be embedded
Participant 2: Making some of the Company M personnel aware of the right
processes and inter-relationships between process
Identify improvement points and risks and then providing action
plans/improvement plans
Participant 3: Standardisation of process - common platform from which to
improve across the business
Question 8.
What have been the major challenges faced on the Business Process
Management journey thus far?
Participant 1: Tension between strategy and operational focus and cultural
differences between operating sites, resourcing BPM Initiatives
Participant 2: Bringing a common understanding of process and practices and
change management
Participant 3: Standardising and understanding importance at all levels in
organization.

Business Process Management: Progression and Maturity
- 13:653 -
Question 9
What have been the major “lessons learned” on the Business Process
Management journey thus far?
Participant 1: Cultural aspects and transition support essential – not just
system training, but the way an end-to-end processes are rolled
out across the business in a common way
Participant 2: Company M has a way to go as not all personnel are working
from a common base
Participant 3: We execute B.P. differently (between smelters and between
M&R smelting)
Question 10
What are your expectations with respect to future Business Process
Management within Company M?
Participant 1: Clearly defined processes embedded, culturally that we move
to a more collaborative model and velocity of change is
increased.
Improved safety and business performance
Clarity around roles and that effectiveness of processes is measured
Participant 2: A common tool kit to apply across the business
Participant 3: Build on current documented processes:
More visible
Integrated with „Other – Process – Management”
Standardisation across Company P (where possible / appropriate)


Business Process Management: Progression and Maturity
- 13:655 -
13.3.7 Changes to Maturity Survey Scales
Individual - Groups
Individual - Scale
None or Hardly Any
Some About Half Quite a Lot Most or All Unknown
Process – Groups and Scale
Process with inputs and outputs contained within the same work
unit.
Processes with inputs coming from:
another internal work unit
a related external source
an unrelated external source
Processes with outputs going to:
another internal work unit
a related external source
an unrelated external source
Executives
Managers
Other Employees
Customers
Suppliers
Other Stakeholders


Business Process Management: Progression and Maturity
- 13:657 -
13.3.8 Maturity Survey: Sample Screen Shots
Figure 94, Figure 95 and Figure 96 provide sample screen-shots from the BPMM
on-line survey instruments.
Figure 94: Entry screen from BPMM On-line Assessment
Figure 95: Example from BPMM Operational Planning Survey

Appendices
- 13:658 -
Figure 96: Example from BPMM Operational Practice Survey

Business Process Management: Progression and Maturity
- 13:659 -
13.3.9 Instructions for Maturity Survey
Additional Information for Maturity Survey Access and Completion
Survey is located at: http://fitdwgp01.fit.qut.edu.au/bpm
When first logging-in, you will be asked to change your password. Passwords
need to be at between 8 and 15 alpha-numeric characters.
Following this you will be taken to the entry page of the survey. On this page you
need to select the yellow Operational Planning button to commence questions.
The number of questions you are required to answer will vary dependent on the
area that you have been nominated for. Expected completion time is 15-20
minutes.

Appendices
- 13:660 -
You can leave the survey at any time and your answers will be retained providing
you click the Save Your Answers button at the bottom of the page. This button
does not need to be clicked on each page only at the point of exiting the survey.
You can re-enter the survey again at any time prior to submitting your completed
survey. However, once you have submitted your completed survey you will not
be able to re-enter the survey again.
When you have completed all survey questions you need to click the Save Your
Answers button and then select the HOME tab from the top left-hand corner.
When you are returned to the HOME page you need to click the grey Submit
Your Answers button. Once you have clicked this button you will not be able to
re-enter the survey.
You will not be able to Submit Your Answers unless you have provided a
response to all questions.
If you have any questions or comments regarding the survey please contact me
on:
[email protected] 0402 794 866 (m)

Business Process Management: Progression and Maturity
- 13:661 -
13.3.10 Final Report: Executive Summary & Contents
( (Company M Logo Removed)
Company M
Business Process Management Maturity
Assessment
Tonia de Bruin
March 2007, Brisbane

Appendices
- 13:662 -
Executive Summary
Company M has a strong history of recognising process management as a
means of improving operational profitability and gaining competitive superiority.
The strong and continual support for process management at a strategic level is
well evidenced in programmes such as the leadership programs of the 90‟s,
Sam‟s One-Company M and more recently, Six Sigma and Lean. The success of
Company M‟s BPM Initiatives has not gone unrecognised with parent company,
Company P using Company M as a pilot site for their Aligning Business Systems
(ABS) project and as a source of valuable resources for initiatives such as the
Improving Performance Together (IPT). With such a rich history of process
management, Company M were keen to assess the level of maturity of their
existing practices.
This report presents the findings of a business process management maturity
(BPMM) assessment undertaken as a joint initiative between Company M and
QUT. This assessment was initiated by the CIO of Company M, with the support
of Willie Streeter from Company P. The assessment was undertaken by QUT
researchers using the BPMM model, developed as a diagnostic tool for
evaluating the maturity of BPM practices. The purpose of a BPMM assessment
is to enable existing practices to be benchmarked and to provide comprehensive
insights into current practices that can be used in the development, prioritisation
and implementation of future BPM strategies. The BPMM model is structured
around 6 factors identified as critical to the success of a holistic approach to BPM
being: Strategic Alignment, Governance, Methods, Information Technology,
People and Culture. Each factor is further defined by 5 so-called capability areas
that act to cluster BPM practices into manageable units.
Assessment data was gathered during 2006 using a range of techniques
including: interviews, workshops, surveys and documentation review. In total
more than 30 individuals across Company M participated in this assessment
providing the first comprehensive review of BPM practices within Company M.
Following a comprehensive analysis of assessment data, results were reported to
Company M in the first quarter of 2007.

Business Process Management: Progression and Maturity
- 13:663 -
Key Findings
The overall maturity of BPM practices within Company M confirms the long-term
commitment and support given to embedding a strong process management
philosophy at all levels of the organisation.
Higher maturity scores in People and Culture reflect past initiatives focused on
developing and promoting staff internally and supporting process management
principles through initiatives such as One-Company M and In Control Then
Capable. These scores also reflect the open and collaborative culture, evident in
Company M through its non-unionised workforce. Similarly, the Strategic
Alignment results reflect the work that has been done with key processes and
strategic planning. This includes the identification of the seven key processes
within the Strategy Map, the introduction of the strategy on a page concept
(SOAP), the widespread use of Balanced Scorecards and the structured
approach to the identification and progression of process improvement initiatives
as a part of the strategic planning process. Recent initiatives such as the ABS
project have focused attention on defining processes that are consistent across
the wider Company P community.
Lower than average Governance scores reflect the largely informal approach to
BPM governance that exists in Company M. Whilst EXCO is responsible for
process decisions relating to the approval and instigation of new projects there is
little governance applied consistently across and within process projects.
Furthermore, the EXCO process is heavily reliant on informal negotiation and
whilst such an approach can improve the buy-in and commitment to process
improvement projects it can also create issues with no clear procedures for
issues resolution. Clear direction and authority for the overall BPM Initiative
within Company M is also lacking. The results for Methods reflect an imbalance
in process-based methods used to manage process actions through all stages of
the process lifecycle. Despite significant efforts in adopting and embedding
process improvement and process controlling methods such as Six Sigma and
Lean little attention has been paid to methods for process modelling, process
execution and broader process management activities. Results for Information
Technology (IT) reflect a similar imbalance. Little attention has been focused on

Appendices
- 13:664 -
process modelling and process improvement whilst more significant progress has
been made in the areas of process execution and process control.
Recommendations
The increasing involvement of Company P is creating a state of flux in Company
M‟s process management practices. Whilst the increased participation of
Company P provides the impetus for the on-going sustainability of BPM
within Company M it also presents many new challenges which will need to be
addressed to ensure opportunities are realised. The increasing dominance of
strategy over process capability and the resultant strain on process specialists
has the potential to become increasingly problematic for Company M. Potential
consequences include: staff disillusionment, increased staff turn-over,
fatigue and burn-out, increased frustration and increased non-compliance.
The risk of these consequences occurring will be heightened where the optimal
BPM approach for Company P at a global level is seen to be increasingly
divergent from an optimal Company M position.
The increasing integration of Company M‟s BPM with that of Company P
provides vast opportunities for streamlining processes and supporting
methods and technologies. Benefits to be achieved include: increased
comparability of data, reduction in duplication, greater ability to optimise
the allocation of resources, more consistent decision making within
Recommendation 1
Implement strategies to manage, enhance and support specialist
process resources.
For example: strategies focused on (1) increasing process skills and
knowledge; (2) appropriately recognising and rewarding desirable process
behaviour; (3) assisting process specialists to maintain a good work/life
balance; (4) communicating how Company M fits and contributes to
Company P‟s BPM program; and (5) developing process roles and
responsibilities and career paths for process specialists.

Business Process Management: Progression and Maturity
- 13:665 -
processes and greater portability of staff. The ability to achieve these
benefits will be seriously jeopardised if standardised methods and technologies
are not available or not used consistently.
The application of process management practices is inconsistent and in
many cases narrowly applied to various groups of individuals and processes.
Not only does this increase the pressure on process specialists it also acts
to restrict the benefits to be achieved from broader application of practices.
Limited inclusion of individuals such as customers can result in process
improvement initiatives that do not add value to the customer whilst at the same
time limits the benefits, insights and synergies that could be gained from this
group. Similarly, practices that are inconsistently applied to processes can lead
to confusion amongst process-workers and limit the effectiveness of having
greater portability of managers and employees.
Recommendation 2
Focus on adopting process-based methods and process-aware
technologies across all stages of the process lifecycle.
For example, adopting standardised methods for modelling processes will
result in models that can be shared across a number of entities, meet the
needs of different audiences, may automatically generate code for process
execution and enable comparison between different models. Similarly,
utilising process-aware tools for modelling processes will result in greater
ability to manage local variants of standard global process e.g. to cater for
difference legislation in different regions, will create an ability to store,
manage and access process models across different entities and enable the
use of reference models.
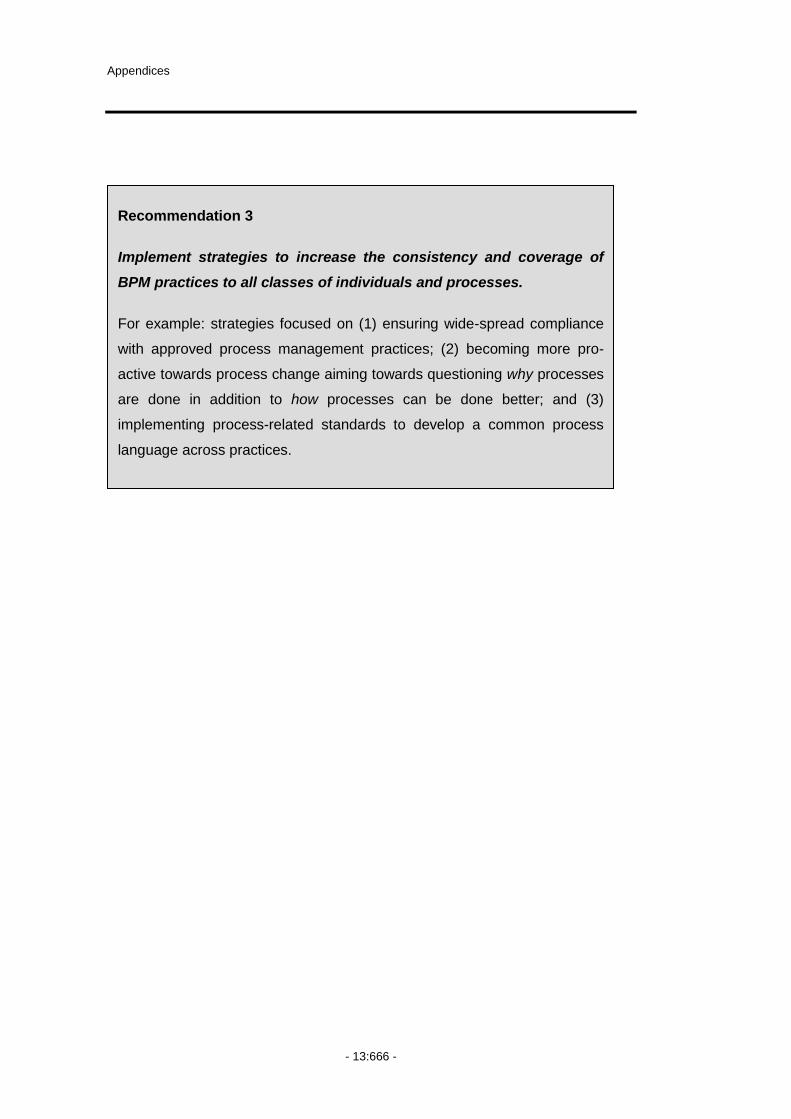
Appendices
- 13:666 -
Recommendation 3
Implement strategies to increase the consistency and coverage of
BPM practices to all classes of individuals and processes.
For example: strategies focused on (1) ensuring wide-spread compliance
with approved process management practices; (2) becoming more pro-
active towards process change aiming towards questioning why processes
are done in addition to how processes can be done better; and (3)
implementing process-related standards to develop a common process
language across practices.

Business Process Management: Progression and Maturity
- 13:667 -
Table of Contents
Executive Summary .............................................................................................. 2
1.0 Introduction .............................................................................................. 12
1.1 The value proposition of a BPMM assessment ................................... 13
1.2 The structure of this report .................................................................. 14
1.3 How the results are presented ............................................................ 14
2.0 The BPMM Model and Assessment Process ........................................... 16
2.1 The BPMM model in brief ................................................................... 16
2.2 How maturity is calculated using the BPMM ....................................... 18
2.3 How data was gathered during the BPMM assessment ..................... 19
2.4 Who participated in the BPMM assessment ....................................... 20
3.0 BPM within Company M .......................................................................... 21
3.1 What BPM mean within Company M ................................................. 21
3.2 Company M‟s BPM sponsor ............................................................... 22
3.3 How BPM has evolved within Company M ........................................ 23
3.4 Company M‟s BPM initiatives and their drivers ................................... 24
3.5 The impact BPM has had within Company M .................................... 25
3.6 What Company M has learnt from it‟s BPM journey ........................... 27
3.7 The challenges for BPM within Company M ...................................... 28
3.8 Overall Maturity of BPM within Company M ...................................... 29
4.0 Strategic Alignment .................................................................................. 41
4.1 Factor Overview ................................................................................. 41
4.2 Process Improvement Plan ................................................................. 48
4.3 Strategy and Process Capability Linkage ........................................... 51
4.4 Enterprise Process Architecture ......................................................... 54
4.5 Process Measures .............................................................................. 57
4.6 Process Customers and Stakeholders................................................ 60
5.0 Governance ............................................................................................. 65
5.1 Factor Overview ................................................................................. 65
5.2 Process Management Decision Making.............................................. 72
5.3 Process Roles and Responsibilities .................................................... 78
5.4 Process Metrics and Performance Linkage ........................................ 83
5.5 Process Related Standards ................................................................ 86
5.6 Process Management Compliance ..................................................... 88
6.0 Methods ................................................................................................... 93
6.1 Factor Overview ................................................................................. 93
6.2 Process Modelling ............................................................................ 102
6.3 Process Execution ............................................................................ 106
6.4 Process Controlling........................................................................... 108
6.5 Process Improvement ....................................................................... 111
6.6 Process Management ....................................................................... 114
7.0 Information Technology ......................................................................... 117
7.1 Factor Overview ............................................................................... 117
7.2 Process Modelling ............................................................................ 124

Appendices
- 13:668 -
7.3 Process Execution ........................................................................ 126
7.4 Process Controlling ....................................................................... 130
7.5 Process Improvement ................................................................... 133
7.6 Process Management ................................................................... 135
8.0 People ................................................................................................ 138
8.1 Factor Overview ............................................................................ 138
8.2 Process Skills and Expertise ......................................................... 145
8.3 Process Management Knowledge ................................................. 149
8.4 Process Education ........................................................................ 152
8.5 Process Collaboration ................................................................... 157
8.6 Process Management Leaders ..................................................... 160
9.0 Culture ................................................................................................ 165
9.1 Factor Overview ............................................................................ 165
9.2 Responsiveness to Process Change ............................................ 172
9.3 Process Values and Beliefs .......................................................... 176
9.4 Process Attitudes and Behaviours ................................................ 179
9.5 Leadership Attention to Process ................................................... 182
9.6 Process Forums ............................................................................ 185
10.0 Summary ............................................................................................ 190
10.1 Potential Limitations ...................................................................... 190
10.2 Key Results .................................................................................. 192
10.3 Recommendations ........................................................................ 192
Appendix A – Participants .............................................................................. 195
Appendix B – Participants Demographics ...................................................... 197
Appendix C – Lessons Learned ..................................................................... 199
Appendix D – Major Challenges (Past) ........................................................... 202
Appendix E – Major Challenges (On-Going)................................................... 204
Appendix F – Capability Areas Ranked by Maturity ........................................ 207
Appendix G – Capability Areas Ranked by Proficiency .................................. 208
Appendix H – Capability Areas Ranked by Coverage ..................................... 209
Appendix I – Capability Areas Ranked by Importance .................................... 210
Appendix J – Capability Areas Ranked by Satisfaction .................................. 211
Appendix K – Existing Methods ...................................................................... 212
Appendix L – Opportunities and Challenges Presented by Existing Methods . 213
Appendix M – Existing Information Technology .............................................. 214
Appendix N – Opportunities and Challenges Existing Information Technology216
Appendix O – Groups of Individuals and Processes 217

Business Process Management: Progression and Maturity
- 13:669 -
Table of Figures
Figure 1: Conceptual BPMM Model ............................................................... 17
Figure 2: Operational Planning Scores per Factor ......................................... 29
Figure 3: Proficiency and Coverage of Existing BPM Practices ..................... 34
Figure 4: Maturity, Importance & Satisfaction with Existing BPM Practices ... 35
Figure 5: Overall Assessment Results ........................................................... 37
Figure 6: Strategic Alignment Scores against Average .................................. 43
Figure 7: Strategic Alignment Capability Areas by Proficiency & Coverage .. 44
Figure 8: Strategic Alignment Areas by Maturity, Importance & Satisfaction . 46
Figure 9: Process Improvement Plan Scores against Average ...................... 49
Figure 10: Strategy and Process Capability Scores against Average ............ 52
Figure 11: Enterprise Process Architecture Scores against Average ............ 54
Figure 12: Process Measures – Scores against Average .............................. 57
Figure 13: Process Customer and Stakeholder Scores against Average ...... 61
Figure 14: Governance Scores against Average ........................................... 67
Figure 15: Governance Capability Areas by Proficiency & Coverage ............ 68
Figure 16: Governance Areas by Maturity, Importance & Satisfaction .......... 70
Figure 17: Process Management Decision Making Scores against Average . 73
Figure 18: Process Roles and Responsibilities Scores against Average ....... 78
Figure 19: Process Metrics & Performance Linkage Scores against Average84
Figure 20: Process Related Standards Scores against Average ................... 86
Figure 21: Process Management Compliance Scores against Average ........ 89
Figure 22: Methods Scores against Average ................................................. 95
Figure 23: Methods Capability Areas by Proficiency & Coverage .................. 96
Figure 24: Methods Capability Areas by Maturity, Importance & Satisfaction 98
Figure 25: Process Modelling Scores against Average ............................... 103
Figure 26: Process Execution Scores against Average ............................... 107
Figure 27: Process Controlling Scores against Average .............................. 109
Figure 28: Process Improvement Scores against Average .......................... 112
Figure 29: Process Management Scores against Average .......................... 115
Figure 30: Information Technology Scores against Average ....................... 119
Figure 31: IT Capability Areas by Proficiency and Coverage ....................... 120
Figure 32: IT Capability Areas by Maturity Importance & Satisfaction ......... 121
Figure 33: Process Modelling (IT) Scores against Average ......................... 125
Figure 34: Process Execution (IT) Scores against Average ........................ 127
Figure 35: Process Controlling (IT) Scores against Average ....................... 131
Figure 36: Process Improvement (IT) Scores against Average ................... 134
Figure 37: Process Management (IT) Scores against Average ................... 136
Figure 38: People Scores against Average ................................................. 140
Figure 39: People Capability Areas by Proficiency & Coverage .................. 141
Figure 40: Distribution of People Coverage to Scale Values ....................... 142
Figure 41: People Capability Areas by Maturity, Importance & Satisfaction 143
Figure 42: Process Skills and Expertise Scores against Average ............... 146
Figure 43: Process Management Knowledge Scores against Average ....... 150
Figure 44: Process Education Scores against Average ............................... 153
Figure 45: Process Collaboration Scores against Average .......................... 157
Figure 46: Process Management Leaders Scores against Average ............ 161
Figure 47: Culture Scores against Average ................................................. 167
Figure 48: Culture Capability Areas by Proficiency & Coverage .................. 168
Figure 49: Culture Capability Areas by Maturity, Importance & Satisfaction 170
Figure 50: Responsiveness to Process Change Scores against Average ... 173
Figure 51: Process Values and Beliefs Scores against Average ................. 176
Figure 52: Process Attitudes and Behaviour Scores against Average ......... 180

Appendices
- 13:670 -
Table of Tables
Figure 46: Process Management Leaders Scores against Average ............ 161
Figure 47: Culture Scores against Average ................................................. 167
Figure 48: Culture Capability Areas by Proficiency & Coverage .................. 168
Figure 49: Culture Capability Areas by Maturity, Importance & Satisfaction 170
Figure 50: Responsiveness to Process Change Scores against Average ... 173
Figure 51: Process Values and Beliefs Scores against Average ................. 176
Figure 52: Process Attitudes and Behaviour Scores against Average ......... 180
Figure 53: Leadership Attention to Process Scores against Average .......... 183
Figure 54: Process Forums Scores against Average................................... 186
Table 1: Codes used when reporting results ................................................. 15
Table 2: Data Collection Methods .................................................................. 20
Table 3: Perceived Sponsors ......................................................................... 22
Table 4: Major Initiatives ................................................................................ 25
Table 5: Major Impacts .................................................................................. 26
Table 6: Factors by Ranking .......................................................................... 29
Table 7: Summary of Key Outcomes for Strategic Alignment ........................ 42
Table 8: Capability Area Rankings – Strategic Alignment .............................. 47
Table 9: Summary of Key Outcomes for Governance ................................... 66
Table 10: Capability Area Rankings – Governance ....................................... 71
Table 11: Summary of Key Outcomes for Methods ....................................... 94
Table 12: Capability Area Rankings – Methods ........................................... 101
Table 13: Summary of Key Outcomes for Information Technology ............. 118
Table 14: Capability Area Rankings – Information Technology ................... 123
Table 15: Summary of Key Outcomes for People ........................................ 139
Table 16: Capability Area Rankings – People ............................................. 144
Table 17: Most Valued Process Leader Skills and Attributes ...................... 164
Table 18: Summary of Key Outcomes for Culture ....................................... 166
Table 19: Capability Area Rankings – Culture ............................................. 171
Table 20: Strategic Level – Interview Participants ....................................... 195
Table 21: Operational Planning Level – Workshop and Survey Participants 196
Table 22: Demographics of Participants ...................................................... 198
Table 23: Lessons Learned by BPMM Capability Area ................................ 201
Table 24: Major Historical Challenges ......................................................... 203
Table 25: Major On-going Challenges ......................................................... 206
Table 26: Capability Areas Ranked by Maturity ........................................... 207
Table 27: Capability Areas Ranked by Proficiency ...................................... 208
Table 28: Capability Areas Ranked by Coverage ........................................ 209
Table 29: Capability Areas Ranked by Importance ...................................... 210
Table 30: Capability Areas Ranked by Satisfaction ..................................... 211
Table 31: Existing Methods ......................................................................... 212
Table 32: Opportunities and Challenges Presented by Existing Methods ... 213
Table 33: Existing Information Technology .................................................. 215
Table 34: Opportunities and Challenges Presented By Existing IT ............. 216

Business Process Management: Progression and Maturity
- 13:671 -
Table of Acronyms
ABEF Australian Business Excellence Framework
ABS Aligning Business Systems
AIM Australian Institute of Management
B2B Business-to-Business
BLDP Business Leader Development Program
BPE Business Process Engineering
BPI Business Process Innovation
BPM Business Process Management
BPMM Business Process Management Maturity
BPR Business Process Re-engineering
CEO Chief Executive Officer
CRTS Company M Research and Technical Support
EMS Environment Manager System
EXCO Executive Committee
GM General Manager
ITIL Information Technology Infrastructure Library
ITSMF Information Technology Service Management Forum
IPT Improving Performance Together
ISO International Organization for Standardization
OEE Overall Equipment Effectiveness
OLDP Organisational Leader Development Program
NATA National Accreditation Technical Association
NOSA National Organisation of South Africa
PMBOK Process Management Body of Knowledge
QUT Queensland University of Technology
SOAP Strategy on a Page
SOx Sarbanes Oxley
TQM Total Quality Management
WPR Work Performance Reviews


Business Process Management: Progression and Maturity
- 13:673 -
13.3.11 Categorisation of Past Challenges
Major Challenges Past
Supporting Statements Capability Area Factor
Engagement & Commitment
...Tension between strategy and operational focus... Process Improvement Plan Strategic Alignment
...Cultures are diverse between the business units so adoption of global approaches can face natural challenges/opposition...
...Aversion to change...
Responsiveness to Process Change
Culture
...Cultural differences between operation sites...
...Building commitment and overcoming resistance at the operational level...
Process Values and Beliefs
...Waiting for people to accept the change and learn how to use the tools...
...Engagement of staff...
Attitudes and Behaviours
...Engagement of leaders... Leadership Attention to Process
Common View & Understanding
...Knowing what initiatives are underway and how they fit together (losing view of the woods for all the trees)...
Process Improvement Plan Strategic Alignment
...Divergent site drivers, including culture... Strategy and Process Capability
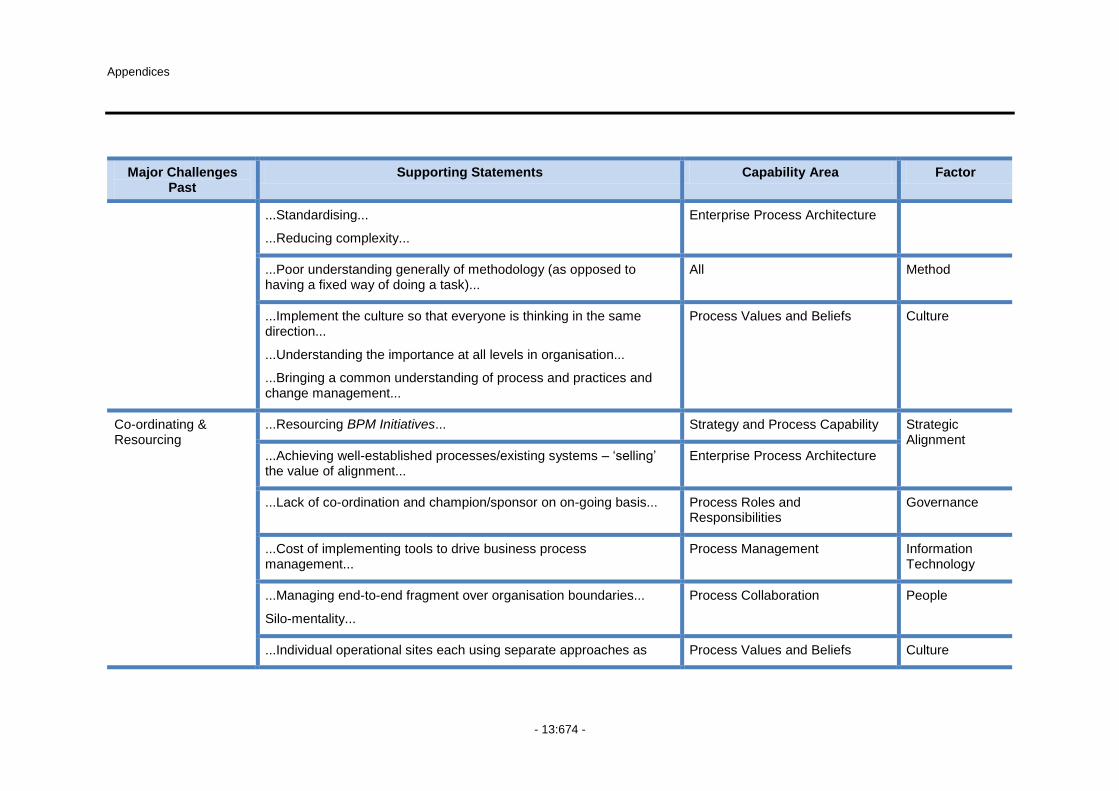
Appendices
- 13:674 -
Major Challenges Past
Supporting Statements Capability Area Factor
...Standardising...
...Reducing complexity...
Enterprise Process Architecture
...Poor understanding generally of methodology (as opposed to having a fixed way of doing a task)...
All Method
...Implement the culture so that everyone is thinking in the same direction...
...Understanding the importance at all levels in organisation...
...Bringing a common understanding of process and practices and change management...
Process Values and Beliefs Culture
Co-ordinating & Resourcing
...Resourcing BPM Initiatives... Strategy and Process Capability Strategic Alignment
...Achieving well-established processes/existing systems – „selling‟ the value of alignment...
Enterprise Process Architecture
...Lack of co-ordination and champion/sponsor on on-going basis... Process Roles and Responsibilities
Governance
...Cost of implementing tools to drive business process management...
Process Management Information Technology
...Managing end-to-end fragment over organisation boundaries...
Silo-mentality...
Process Collaboration People
...Individual operational sites each using separate approaches as Process Values and Beliefs Culture

Business Process Management: Progression and Maturity
- 13:675 -
Major Challenges Past
Supporting Statements Capability Area Factor
„managed sites‟ rather than units of a single business approach...
Consolidation & Sustainability
...Consolidation of approach, implementation and institutionalisation of processes like six sigma and change management - including training of suitably qualified practitioners and stakeholders...
Process Improvement Methods
...Retaining learnings... Process Education People
...Maintain momentum... Process Values & Beliefs Culture
...Engaging and sustaining with line management... Attitudes and Behaviours
Table 152: Major Historical Challenges

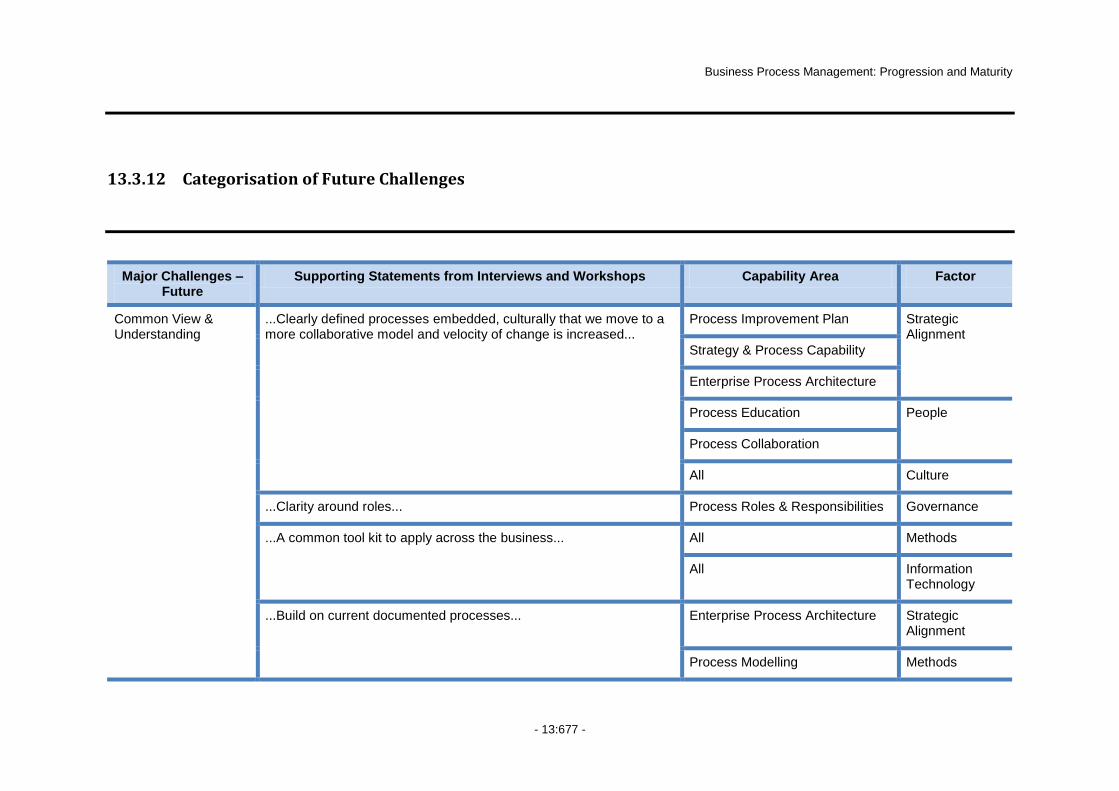
Business Process Management: Progression and Maturity
- 13:677 -
13.3.12 Categorisation of Future Challenges
Major Challenges – Future
Supporting Statements from Interviews and Workshops Capability Area Factor
Common View & Understanding
...Clearly defined processes embedded, culturally that we move to a more collaborative model and velocity of change is increased...
Process Improvement Plan Strategic Alignment
Strategy & Process Capability
Enterprise Process Architecture
Process Education People
Process Collaboration
All Culture
...Clarity around roles... Process Roles & Responsibilities Governance
...A common tool kit to apply across the business... All Methods
All Information Technology
...Build on current documented processes... Enterprise Process Architecture Strategic Alignment
Process Modelling Methods

Appendices
- 13:678 -
Major Challenges – Future
Supporting Statements from Interviews and Workshops Capability Area Factor
Process Modelling Information Technology
...Expect an increase in understanding and acceptance of BPM as integral management tool...
Process Management Knowledge People
Process Education
Values & Beliefs Culture
Attitudes & Behaviours
...there will be a continued focus on making all people in organisation think in the same ways regarding BPM...
Process Management Knowledge People
Process Education
Process Values & Beliefs Culture
Co-ordination & Resourcing
...increasingly focus on the integration of BPM to all roles so as to increase ownership and use i.e. at site levels...
Process Roles & Responsibilities Governance
Consolidation & Sustainability
...we can simplify and streamline further, reduce the corporate overhead, reduce wastes and deliver more value...
Enterprise Process Architecture Strategic Alignment
Process Customers & Stakeholders
...BPM that is more adaptive to changing market pressures... Strategy and Process Capability
Customers & Other Stakeholders
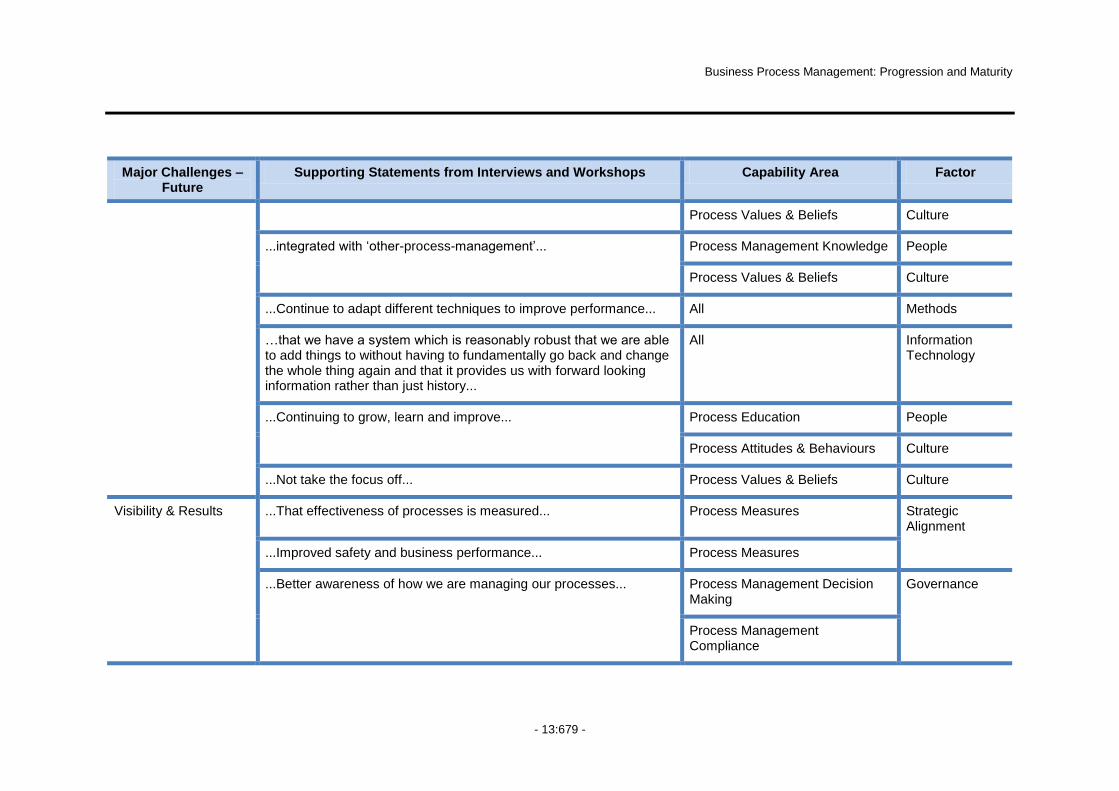
Business Process Management: Progression and Maturity
- 13:679 -
Major Challenges – Future
Supporting Statements from Interviews and Workshops Capability Area Factor
Process Values & Beliefs Culture
...integrated with „other-process-management‟... Process Management Knowledge People
Process Values & Beliefs Culture
...Continue to adapt different techniques to improve performance... All Methods
…that we have a system which is reasonably robust that we are able to add things to without having to fundamentally go back and change the whole thing again and that it provides us with forward looking information rather than just history...
All Information Technology
...Continuing to grow, learn and improve... Process Education People
Process Attitudes & Behaviours Culture
...Not take the focus off... Process Values & Beliefs Culture
Visibility & Results ...That effectiveness of processes is measured... Process Measures Strategic Alignment
...Improved safety and business performance... Process Measures
...Better awareness of how we are managing our processes... Process Management Decision Making
Governance
Process Management Compliance

Appendices
- 13:680 -
Major Challenges – Future
Supporting Statements from Interviews and Workshops Capability Area Factor
...More visible... Process Values & Beliefs Culture
Standardisation & Globalisation
...Although there‟s meant to be continuous improvement it‟s going to be big continuous improvement rather than little continuous improvements...
All All
...Move from more commercial processes to more production and value stream oriented activities...
Process Improvement Plan Strategic Alignment
Process Customers & Stakeholders
Table 153: Major On-going Challenges

Business Process Management: Progression and Maturity
- 13:681 -
13.4 Longitudinal Case Study Supporting Documentation
13.4.1 Expression of Interest in BPM Evolution Case Studies
This research study is aimed at investigating the way in which business process
management (BPM) evolves within organisations. The research is motivated by
the desire to assist organisations understand and adopt BPM as a sustainable
management practice. The BPM Maturity model is used as a basis for this
research to provide a stable and consistent base from which to gather data and
compare results across organisations.
The study starts with a series of one-on-one interviews with key BPM personnel
in the organisation. The purpose of the interviews is to build a comprehensive
and chronological view of the organisation‟s BPM journey. In particular we
explore the major initiatives, drivers, challenges and lessons learned along the
way. Each interview is approximately 1-1.5 hours in duration and we aim for a
minimum of 4 interviews per organisation. Following the interviews, participants
are asked to complete a survey (approximately 20 minutes) that assesses the
level of emphasis the organisation has placed on each of the BPMM capability
areas. The data gathered during the interviews and surveys is consolidated into
a comprehensive picture of the organisation‟s BPM position. This picture is then
used as a basis for the workshop. The aims of the workshops are (1) to review
the consolidated results and discuss any anomalies or oversights; and (2) to
identify the practices currently undertaken in each of the BPMM capability areas.
The value gained by organisation‟s participating in this research includes:
A comprehensive account of the organisation‟s BPM journey in the
format of a final report; and
A deeper understanding of the BPM capabilities essential to developing
sustainable BPM practices.
Appendices
- 13:682 -
The commitment required from organisations participating in this research
would include 4 – 6 individuals knowledgeable about the organisation‟s BPM
journey participating in the following way.
Each individual would be interviewed separately about the
organisation‟s BPM journey (approximately 1-1.5 hours each) and
would be required to complete a short survey (20 minutes);
As a group, all individuals would attend a 6 hour workshop (conducted
over 1 day) during which we would:
Review the consolidated BPM journey to confirm completeness;
Discuss the influencing variables and lessons learned;
Provide a brief introduction to the BPMM capability areas; and
Identify the major practices and activities undertaken in each of the BPMM capability areas.
The events would be scheduled at times and locations convenient to the
participants and ideally would be conducted by the end of 2007. Ideally all
interviews would be conducted on the same (or consecutive) days. The
workshop can be conducted on the day following interview completion or at a
later date (as required).
If your organisation is able to participate in this research please contact:
Tonia de Bruin on 0402 794 866 or at [email protected]

Business Process Management: Progression and Maturity
- 13:683 -
13.4.2 Information Sheet and Informed Consent
– Case Study with Company X –
Information Sheet
Chief Investigators: Tonia de Bruin Michael Rosemann
PHD Candidate, QUT Professor, QUT
Email: [email protected] Email: [email protected]
Phone: 3864 9476 Phone: 3864 9473
Project Description and Background
Business process management (BPM) is emerging as an important management
practice, providing organisations with a means of increasing competitiveness and
sustainability in times of market uncertainty, increasing globalisation and
constantly changing business conditions. Existing studies have investigated
BPM practices within organisations primarily using exploratory research such as
case studies. These studies have identified that many organisations are keen to
progress BPM to higher levels of maturity but that few organisations have been
able to do so. Evidence from earlier research indicates that there is both a lack
of understanding of how organisations progress BPM practices as well as a lack
of validated instruments available for measuring progress in a consistent and
comparable manner. Furthermore, a number of studies have highlighted
anomalies in the definition and use of BPM terminology making it difficult to
compare, contrast and build upon past research in a meaningful way. From a
practical perspective there is also the added concern from some practitioners that
BPM is just another fad. This research project therefore aims to ultimately
address the question:

Appendices
- 13:684 -
How can organisations progress and sustain BPM practices?
Based on the findings from earlier research, the QUT researchers determined
that it was prudent to address the issues of terminology and measurement within
the BPM domain and to first develop a consistent platform from which to advance
their BPM research. Therefore a two phased approach was planned with Phase
1 focused on consistent definition and measurement of BPM practices in
organisations, and Phase 2 focused on the identification and progression of BPM
practices within organisations. Therefore in Phase 1 of the project the
researchers addressed the question:
How can BPM progress be consistently measured and compared across
organisations?
In response to this question, QUT researchers worked to develop a generic BPM
Maturity (BPMM) model that could be used to measure the progress of BPM
practices within an organisation. The high-level BPMM consists of 6 factors that
were identified from prior research and 30 so-called capability areas which were
subsequently derived through an international series of Delphi studies (one study
for each of the six BPMM factors). The BPMM model with its factors and
capability areas is reflected in Figure 97. The BPMM model is designed to
investigate the maturity of existing BPM practices within an organisation on the
basis of how well they are done (as compared to best practice) and how
extensively they are applied (to defined classes of individuals and processes).
Results from a BPMM assessment provide an organisation with deeper insights
into existing practices that can be used to inform the development and
prioritisation of BPM strategies based on the relative strengths and weaknesses
identified. Through the first stage of this project, the BPMM model has been
applied in a number of case studies and has been found to provide a
comprehensive understanding of existing BPM practices within organisations.
The factors and capability areas contained within the BPMM model have now
been sufficiently developed and tested through a number of case studies to
provide a consistent and stable platform from which the researchers can begin to
address the ultimate aim of the research, how do organisations progress BPM
practices.

Business Process Management: Progression and Maturity
- 13:685 -
Figure 97: Conceptual BPM Maturity Model
In Phase 2 the researchers plan to address the question:
How do organisations progress and sustain BPM practices?
QUT has approached Company X with a view to using the BPMM model as a
basis for investigating how BPM has evolved within the organisation. Of interest to
the researchers is the relative emphasis placed on each of the BPMM factors
during the BPM journey and the identification of variables which may have
influenced the BPM journey. The researchers see working with industry partners
as an opportunity to:
Utilise the BPMM model as a consistent basis for conducting exploratory
research into how an organisation progresses BPM practices;
Gain deeper insights into whether BPM evolves differently from
organisation to organisation, and if so, why this might be;
Gain an understanding of how and why the relative emphasis placed on the
BPMM factors might change over time as BPM progresses within an
Business Process Management
Governance MethodsStrategic
Alignment
Information
Technology
People Culture
Process Related
Standards
Process Metrics &
Performance
Linkage
Process Roles and
Responsibilities
Process
Management
Decision Making
Process Measures
Enterprise Process
Architecture
Strategy & Process
Capability Linkage
Process Planning
Process Customers
& Stakeholders
Process Control
Process Execution
Process Modeling
Process Control
Process Execution
Process Modeling
Process Education
Process
Management
Knowledge
Process Skills &
Expertise
Process Attitudes &
Behaviors
Process Values &
Beliefs
Responsiveness to
Process Change
Process Program
and Project Mgmt
Process
Improvement
Process Program
and Project Mgmt
Process
Improvement
Process
Management
Leaders
Process
Collaboration
Leadership
Attention to
Process
Process ForumsProcess
Management
Compliance

Appendices
- 13:686 -
organisation (if at all);
Identify the major determinants of BPM progression within an organisation;
and
Identify any discernible patterns of BPM evolution that may exist and how
these might be used to progress and sustain BPM practices.
Phase 2 – Expected Benefits and Risks to Company X
Participation in Phase 2 is expected to provide Company X with a number of
benefits including:
A documented, overview of the BPM journey together with a summary of
the lessons learned.
A comprehensive overview of the relative emphasis that has been placed
on the various BPMM factors.
Insights and a deeper understanding into other variables that have
influenced the BPM journey.
An understanding of the BPMM model and its capability areas to assist
informal application of the model concepts e.g. using the structure of the
model to guide strategy development without having a formal BPMM
assessment conducted.
Insights into BPM progression in other organisations by way of a final
summary report provided to all participating organisations at the completion
of all studies.
There are no foreseen risks associated with participation in this study. All costs
associated with this research will be the responsibility of the researchers unless
agreed otherwise.

Business Process Management: Progression and Maturity
- 13:687 -
Phase 2 – Structure
The structure of the research undertaken in Phase 2 will include a number of
distinct sessions including:
Initial Planning Session
Interviews
Workshop
Written report
In the initial stages of the case study, Company X will nominate a 4 – 6 individuals
to participate in the study. Participants will be required to participate in a one-on-
one interview, survey and workshop about the BPM journey at Company X.
Therefore participants will need to have an in-depth knowledge and understanding
of the progression of BPM over time. Participants will be contacted in the manner
agreed between the Chief Investigators and Company X at the initial planning
session. The study will be undertaken on Company X premises where facilities will
be made available in a manner agreed between the Chief Investigators and
Company X at the initial planning session.
The one-on-one interviews and BPM Evolution survey will be conducted first. The
purpose of the interviews is to obtain a comprehensive and chronological view of
the BPM journey. Each interview will take approximately 1-1.5 hours with the
survey taking no more than 20 minutes to complete. Ideally interviews will be
scheduled to occur over a one or two day period and can be conducted via
telephone if required.
The workshop will include all participants and will be conducted following the
consolidation of interview and survey data. This can be the following day or a later
date if required. The workshop will take approximately 6 hours over the course of
1 day. The workshop will be facilitated by the Chief Investigator and potentially one
other researcher from QUT.

Appendices
- 13:688 -
Phase 2 – Schedule
The scheduling for sessions is to be agreed between the Chief Investigators and
Company X dependent upon the availability of participants. Sessions could be
scheduled to occur over consecutive days with all interviews and surveys being
completed first with the workshop being conducted on the following day allowing
time for analysis of the interview and survey data. Schedules are structured to suit
the availability of participants.
Phase 2 – Outcomes
The major outcomes from the study will be a comprehensive view of the BPM
journey, a deeper understanding of the BPM journey and insights into the
variables that have had a major influence over the course of the journey.
Following the completion of this phase of the research, Company X will receive a
written report that details the findings of this phase.
Audio Recording of Interviews
With the permission of Company X, the Chief Investigators would like to audio
record all interviews and workshops for improved data capture, transcription and
analysis. Company X may not wish to grant permission to have the interviews
and workshops with their representatives recorded. This will not impact on
Company X participation in the project. If permission is granted for the use of
audio recording, all audio files will be either destroyed or returned to Company X
once they have been transcribed.
Confidentiality
All recordings, transcripts, documentation and other information and data
gathered during the assessment will be kept strictly confidential. The identity of
participants will be kept confidential and will be known only to the Chief
Investigators. Furthermore, no-one outside the QUT research team will have
access to the information provided by Company X representatives. Only
aggregated results of the study will be reported. While, some individual
responses may be reported, no individual or company will be identified with any

Business Process Management: Progression and Maturity
- 13:689 -
of these responses unless explicitly agreed between the Chief Investigators and
Company X.
Voluntary Participation
Participation in this study is purely voluntary. Company X may wish to withdraw
participation of their representatives at any time, without penalty or judgement.
Questions / further information
If a Company X representative would like to obtain additional information or has
any queries they would like addressed, they can contact the research team
members below:
Concerns / complaints
If you have any concerns or complaints about the ethical conduct of the project you
could contact the Research Ethics Officer on 3138 2340 or
Feedback
Feedback to Company X will be in the form of results of the study provided in a
presentation and report.
Thank-you for your interest and support of this project
Ms Tonia de Bruin
(Chief Investigator / Researcher) Business Process Management Group Faculty of Information Technology QUT Level 5, 126 Margaret St Brisbane 4000,
Australia Tel: (07) 3864 9476 Fax: (07) 3864 9390
Mobile: 0402 794 866 Email: [email protected]
Prof. Michael Rosemann
(Chief Investigator / Professor)
Business Process Management Group Faculty of Information Technology QUT Level 5, 126 Margaret St Brisbane 4000,
Australia Tel: (07) 3864 9473 Fax: (07) 3864 9390
Email: [email protected]
Appendices
- 13:690 -
– Case Study with Company X –
Informed Consent Form Chief Investigator: Tonia de Bruin (PHD Candidate, QUT)
Email: [email protected]
Chief Investigator: Michael Rosemann (Professor, QUT)
Email: [email protected]
Statement of consent
By signing below, you are indicating that you (on-behalf of Company M):
have read and understood the information sheet about this project;
have had any questions satisfactorily answered;
understand that any additional questions can be raised with research team at any point;
understand that Company M is free to withdraw participation of its representatives at any time, without comment or penalty;
(Please tick only one)
agree for Company M representatives to participate in the project.
And grant permission to audio record interviews
But, do not grant permission to audio record any interviews
Name
Signature
Position
Date / /
Business Process Management: Progression and Maturity
- 13:691 -
13.4.3 Interview Guide
Following a brief introduction to the research, this interview will focus on your
views of the BPM journey within Company X. The interview is loosely structured
to allow you to talk about the journey in your own fashion. However during the
discussion we will aim to cover the following points.
Triggers for BPM within Company X (i.e. the event/s that started
interest in BPM)
Drivers of BPM within Company X (i.e. the business goals and
objectives of the BPM Initiative)
Enablers of BPM within Company X (i.e. the „things‟ that have to be in
place or take place for BPM to progress)
Challenges for BPM within Company X (i.e. issues that had to be
overcome during the BPM journey)
Learnings from Company X‟ BPM journey (i.e. the „take-aways‟ from
the BPM journey thus far)
Critical/contextual variables that have influenced the BPM journey
(i.e. the major things that have affected the way in which BPM has
unfolded)
Other Comments – about BPM at Company X or about BPM in general


Business Process Management: Progression and Maturity
- 13:693 -
13.4.4 BPM Evolution Survey
Exploring the Evolution of Business Process Management
Within Organisations
- Contact Survey -
Background
In the past many organisations have expressed a desire to achieve the well
publicised benefits from a co-ordinated organisational approach to process
management and improvement. The problem is that little is known about how
best to progress BPM. Thus this research is motivated by the desire to assist
progress and sustain BPM within organisations. By investigating how BPM
Initiatives evolve in a range of organisations we endeavour to understand what
variables are found to impact on the success, maturity and structure of BPM
Initiatives. In doing so, we seek to gain deeper insights into potential
patterns/trends evident in the BPM evolution within organisations.
Benefits
In addition to a detailed report containing insights specific to BPM in your
organisation, at a later date, your organisation will receive a copy of the final
consolidated report that details the broader findings arising from this research.
Company Logo
Removed

Appendices
- 13:694 -
Voluntary Participation
Participation in this survey is purely voluntary. If you do not wish to continue with
the survey at any point you are free to exit without penalty or judgement.
Incomplete survey responses will be discarded.
Confidentiality
All data, comments and responses gathered during the survey will be treated
strictly confidential and anonymous. The provision of personal information is not
mandatory at any point during the survey. Where sensitive information is
required, the identity of participants will be kept confidential and will be known
only to the Chief Investigators. Only aggregated results of the survey will be
reported. There are no risks associated with your participation in this research.
Questions / further information
If you would like to obtain additional information or have any queries you would
like addressed, you can contact the research team members below:
Concerns / complaints
QUT is committed to researcher integrity and the ethical conduct of research
projects. However, if you do have any concerns or complaints about the ethical
conduct of the project you may contact the QUT Research Ethics Officer at +61 7
3138 2340 or email: [email protected]. The Research Ethics Officer is not
connected with this research project and can facilitate a resolution to your concern
in an impartial manner.
Ms Tonia de Bruin
(Chief Investigator / Researcher) Business Process Management Group Faculty of Information Technology, QUT Level 5, 126 Margaret St, Brisbane 4000,
Australia Tel: +61 7 3138 9476 Fax:+61 7 3138 9390
Email: [email protected]
Prof. Michael Rosemann
(Chief Investigator / Professor) Business Process Management Group Faculty of Information Technology, QUT Level 5, 126 Margaret St, Brisbane 4000,
Australia Tel:+61 7 3138 9473
Email: [email protected]
Business Process Management: Progression and Maturity
- 13:695 -
Definitions
This section defines the terms BPM, BPM Initiative and end-to-end process as
they are used in this survey. It is important to read these definitions to ensure
questions are interpreted as intended.
The term „BPM‟ is used to refer to a holistic management practice aimed at
adopting a process-orientation as a way of doing business. It is recognised that
an organisation may not refer directly to BPM however in the context of this
research this term is taken to encompass a management approach that includes
a focus on:
Having a strategic focus on process management;
Defining the end-to-end processes of the organisation;
Standardising and streamlining processes;
Creating a customer perspective and generating value-add;
Collaborating on processes;
Connecting with customer and supplier processes;
Eroding cross-functional boundaries; and
Simplifying process work.
The term „BPM Initiative‟ or „BPMI‟ is used as a proxy for your organisation‟s
process-based initiative. Such an initiative might be in the form of:
an ad hoc approach to process improvement and management;
a project-based approach to process improvement and management;
pockets of BPM excellence e.g. a centre of excellence, contained within
discrete business units or perhaps a specialist team; and
an enterprise wide BPM Initiative.
Company Logo
Removed

Appendices
- 13:696 -
Again, it is recognised that the initiative may not be called „BPM‟ within each
organisation but may be called something like Business Transformation,
Business Improvement or Change Project. In essence, such an initiative would
display (to a greater or lesser extent) similar attributes as those detailed above in
the definition of BPM.
The term „end-to-end process‟ is used as a proxy for other terms such as key,
core, and critical business processes, used to indicate the high-level processes
that define an organisation‟s business.
Section 1: Participant Details
a) Does your organisation have a current BPM Initiative (BPMI)?
Yes
No, but had one in the past
No, and it has never had one
b) Please indicate your level of involvement with your organisation‟s BPMI:
I am currently involved with the BPMI:
and have been since it began or I was involved with the BPMI for its
entirety (where the BPMI has finished).
but became involved after it started and have a strong understanding of
its history.
but became involved after it started and have only a limited
understanding of its history.
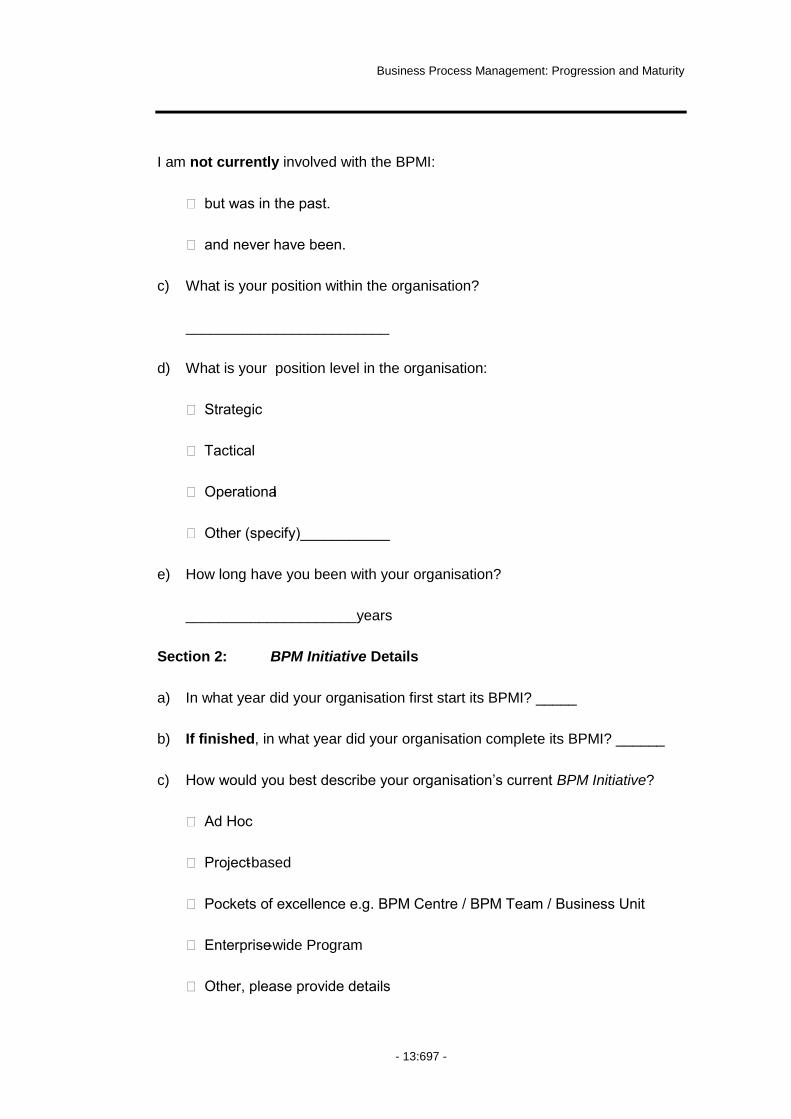
Business Process Management: Progression and Maturity
- 13:697 -
I am not currently involved with the BPMI:
but was in the past.
and never have been.
c) What is your position within the organisation?
_________________________
d) What is your position level in the organisation:
Strategic
Tactical
Operational
Other (specify)___________
e) How long have you been with your organisation?
_____________________years
Section 2: BPM Initiative Details
a) In what year did your organisation first start its BPMI? _____
b) If finished, in what year did your organisation complete its BPMI? ______
c) How would you best describe your organisation‟s current BPM Initiative?
Ad Hoc
Project-based
Pockets of excellence e.g. BPM Centre / BPM Team / Business Unit
Enterprise-wide Program
Other, please provide details

Appendices
- 13:698 -
d) Please indicate the three main drivers (i.e. the reasons for undertaking the
initiative) of your organisation‟s BPM Initiative when it started.
i)
ii)
iii)
e) Have the main drivers changed over time? Yes No Don‟t know
f) If Yes, please indicate what the main drivers are now and the major reasons
why they changed:
_________________________________________
g) Please indicate the three main objectives (i.e. what the organisation wanted
to achieve) of your organisation‟s BPM Initiative when it started.
i)
ii)
iii)
h) Have the main objective/s changed over time? Yes No Don‟t know
i) If Yes, please indicate what the main objectives are now and the major
reasons why they changed:
_________________________________________
j) Please indicate the three main success measures of your organisation‟s
BPM Initiative when it started.
i)
ii)
iii)
k) Have the main success measures changed over time? Yes No Don‟t know
l) If Yes, please indicate what the main success measures are now and the
major reasons why they changed:
_________________________________________
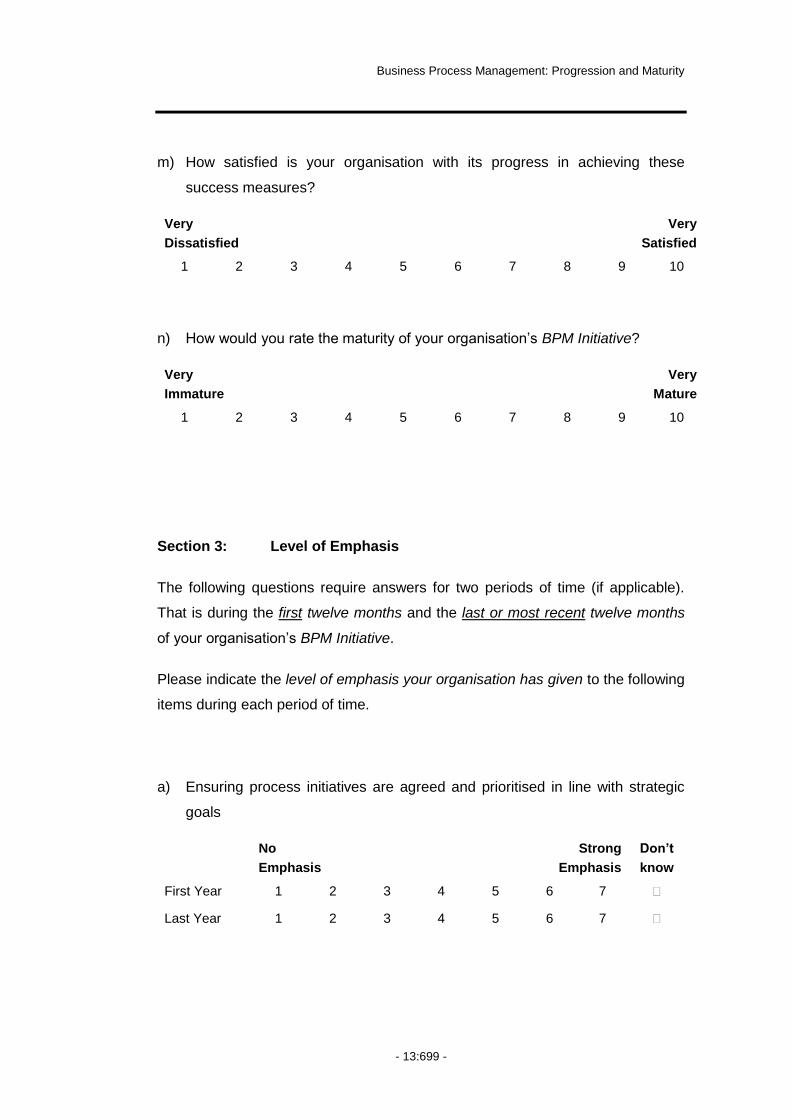
Business Process Management: Progression and Maturity
- 13:699 -
m) How satisfied is your organisation with its progress in achieving these
success measures?
Very
Dissatisfied
Very
Satisfied
1 2 3 4 5 6 7 8 9 10
n) How would you rate the maturity of your organisation‟s BPM Initiative?
Very
Immature
Very
Mature
1 2 3 4 5 6 7 8 9 10
Section 3: Level of Emphasis
The following questions require answers for two periods of time (if applicable).
That is during the first twelve months and the last or most recent twelve months
of your organisation‟s BPM Initiative.
Please indicate the level of emphasis your organisation has given to the following
items during each period of time.
a) Ensuring process initiatives are agreed and prioritised in line with strategic
goals
No
Emphasis
Strong
Emphasis
Don‟t
know
First Year 1 2 3 4 5 6 7
Last Year 1 2 3 4 5 6 7
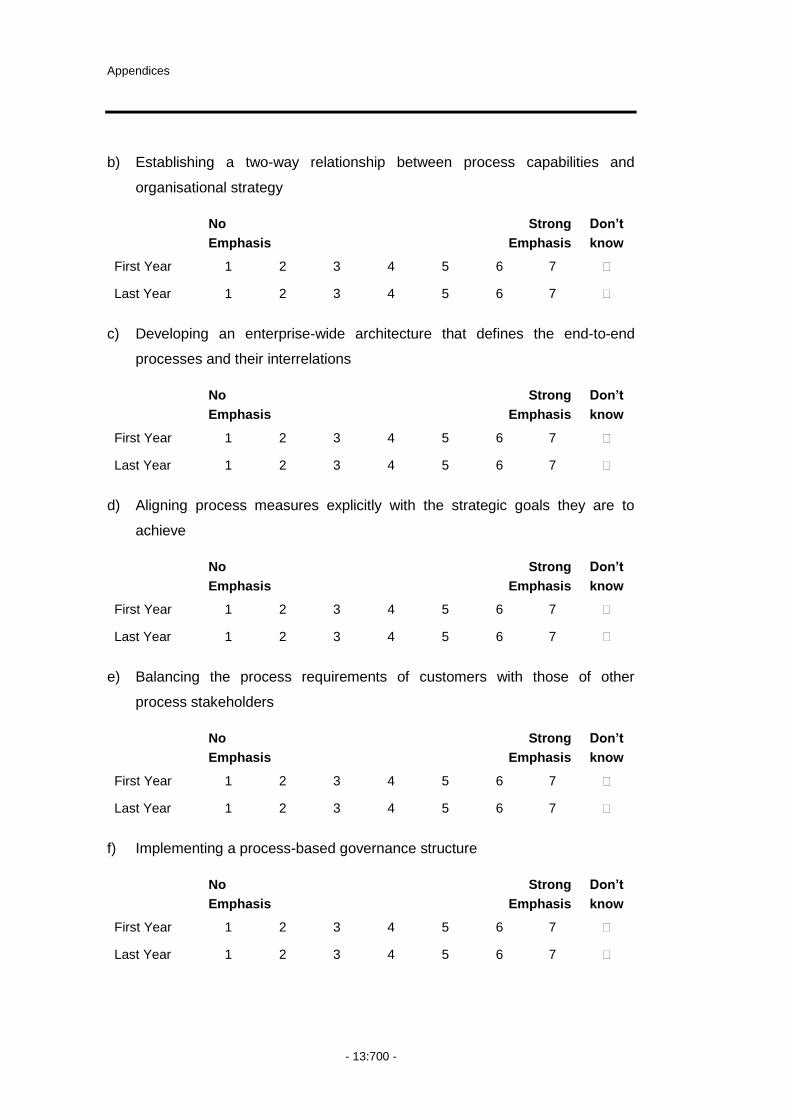
Appendices
- 13:700 -
b) Establishing a two-way relationship between process capabilities and
organisational strategy
No
Emphasis
Strong
Emphasis
Don‟t
know
First Year 1 2 3 4 5 6 7
Last Year 1 2 3 4 5 6 7
c) Developing an enterprise-wide architecture that defines the end-to-end
processes and their interrelations
No
Emphasis
Strong
Emphasis
Don‟t
know
First Year 1 2 3 4 5 6 7
Last Year 1 2 3 4 5 6 7
d) Aligning process measures explicitly with the strategic goals they are to
achieve
No
Emphasis
Strong
Emphasis
Don‟t
know
First Year 1 2 3 4 5 6 7
Last Year 1 2 3 4 5 6 7
e) Balancing the process requirements of customers with those of other
process stakeholders
No
Emphasis
Strong
Emphasis
Don‟t
know
First Year 1 2 3 4 5 6 7
Last Year 1 2 3 4 5 6 7
f) Implementing a process-based governance structure
No
Emphasis
Strong
Emphasis
Don‟t
know
First Year 1 2 3 4 5 6 7
Last Year 1 2 3 4 5 6 7

Business Process Management: Progression and Maturity
- 13:701 -
g) Assigning process related roles and responsibilities
No
Emphasis
Strong
Emphasis
Don‟t
know
First Year 1 2 3 4 5 6 7
Last Year 1 2 3 4 5 6 7
h) Linking reward and remuneration to the optimisation of end-to-end process
performance
No
Emphasis
Strong
Emphasis
Don‟t
know
First Year 1 2 3 4 5 6 7
Last Year 1 2 3 4 5 6 7
i) Adopting process-related standards
No
Emphasis
Strong
Emphasis
Don‟t
know
First Year 1 2 3 4 5 6 7
Last Year 1 2 3 4 5 6 7
j) Ensuring compliance with process-related standards
No
Emphasis
Strong
Emphasis
Don‟t
know
First Year 1 2 3 4 5 6 7
Last Year 1 2 3 4 5 6 7
k) Utilising agreed methods for representing processes e.g. BPMN, IDEF0,
Value Chain, Strategy Maps or similar
No
Emphasis
Strong
Emphasis
Don‟t
know
First Year 1 2 3 4 5 6 7
Last Year 1 2 3 4 5 6 7

Appendices
- 13:702 -
l) Utilising agreed methods for monitoring processes e.g. process audits,
service level agreements, quality checks or similar
No
Emphasis
Strong
Emphasis
Don‟t
know
First Year 1 2 3 4 5 6 7
Last Year 1 2 3 4 5 6 7
m) Utilising agreed methods for evaluating processes e.g. ABC analysis,
benchmarking, value chain analysis or similar
No
Emphasis
Strong
Emphasis
Don‟t
know
First Year 1 2 3 4 5 6 7
Last Year 1 2 3 4 5 6 7
n) Utilising agreed methods for improving processes e.g. Lean, Six Sigma,
blue-sky thinking or similar
No
Emphasis
Strong
Emphasis
Don‟t
know
First Year 1 2 3 4 5 6 7
Last Year 1 2 3 4 5 6 7
o) Utilising agreed methods for managing the overall BPM program and
projects, e.g. process portfolio management, a process for process lifecycle
management or similar
No
Emphasis
Strong
Emphasis
Don‟t
know
First Year 1 2 3 4 5 6 7
Last Year 1 2 3 4 5 6 7
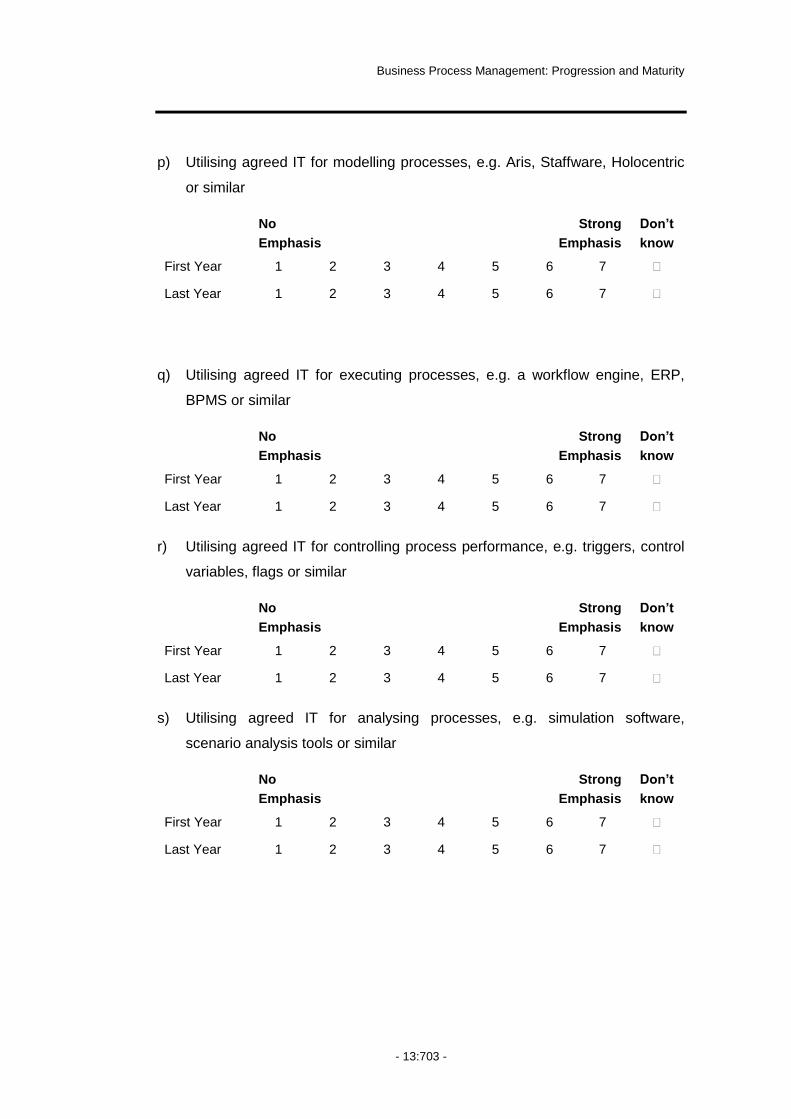
Business Process Management: Progression and Maturity
- 13:703 -
p) Utilising agreed IT for modelling processes, e.g. Aris, Staffware, Holocentric
or similar
No
Emphasis
Strong
Emphasis
Don‟t
know
First Year 1 2 3 4 5 6 7
Last Year 1 2 3 4 5 6 7
q) Utilising agreed IT for executing processes, e.g. a workflow engine, ERP,
BPMS or similar
No
Emphasis
Strong
Emphasis
Don‟t
know
First Year 1 2 3 4 5 6 7
Last Year 1 2 3 4 5 6 7
r) Utilising agreed IT for controlling process performance, e.g. triggers, control
variables, flags or similar
No
Emphasis
Strong
Emphasis
Don‟t
know
First Year 1 2 3 4 5 6 7
Last Year 1 2 3 4 5 6 7
s) Utilising agreed IT for analysing processes, e.g. simulation software,
scenario analysis tools or similar
No
Emphasis
Strong
Emphasis
Don‟t
know
First Year 1 2 3 4 5 6 7
Last Year 1 2 3 4 5 6 7

Appendices
- 13:704 -
t) Utilising agreed IT for managing process information, e.g. process dash-
boards, intranet, portals, on-line forums or similar
No
Emphasis
Strong
Emphasis
Don‟t
know
First Year 1 2 3 4 5 6 7
Last Year 1 2 3 4 5 6 7
u) Ensuring the availability of appropriate process skills and expertise
No
Emphasis
Strong
Emphasis
Don‟t
know
First Year 1 2 3 4 5 6 7
Last Year 1 2 3 4 5 6 7
v) Establishing a comprehensive body of BPM knowledge
No
Emphasis
Strong
Emphasis
Don‟t
know
First Year 1 2 3 4 5 6 7
Last Year 1 2 3 4 5 6 7
w) Providing a range of process-based education programs e.g. covering both
process-specific and broader BPM aspects
No
Emphasis
Strong
Emphasis
Don‟t
know
First Year 1 2 3 4 5 6 7
Last Year 1 2 3 4 5 6 7
x) Increasing collaboration on process-related work
No
Emphasis
Strong
Emphasis
Don‟t
know
First Year 1 2 3 4 5 6 7
Last Year 1 2 3 4 5 6 7
Business Process Management: Progression and Maturity
- 13:705 -
y) Developing the attributes required in process management leaders
No
Emphasis
Strong
Emphasis
Don‟t
know
First Year 1 2 3 4 5 6 7
Last Year 1 2 3 4 5 6 7
z) Creating an environment that is proactive towards process change
No
Emphasis
Strong
Emphasis
Don‟t
know
First Year 1 2 3 4 5 6 7
Last Year 1 2 3 4 5 6 7
aa) Communicating the organisation‟s values and beliefs regarding BPM
No
Emphasis
Strong
Emphasis
Don‟t
know
First Year 1 2 3 4 5 6 7
Last Year 1 2 3 4 5 6 7
bb) Encouraging attitudes and behaviours that support BPM
No
Emphasis
Strong
Emphasis
Don‟t
know
First Year 1 2 3 4 5 6 7
Last Year 1 2 3 4 5 6 7
cc) Promoting BPM through executive and senior management leadership
No
Emphasis
Strong
Emphasis
Don‟t
know
First Year 1 2 3 4 5 6 7
Last Year 1 2 3 4 5 6 7
dd) Facilitating the active sharing of process-related knowledge and experiences
No
Emphasis
Strong
Emphasis
Don‟t
know
First Year 1 2 3 4 5 6 7
Last Year 1 2 3 4 5 6 7

Appendices
- 13:706 -
Section 4: Level of Agreement
In this final section, questions require answers for two points in time being (1) at
the start of the BPM Initiative and (2) now. Please indicate your level of
agreement with the statements for each point in time. Please note, any change
in your level of agreement over time DOES NOT HAVE TO BE AS A RESULT
OF THE BPM INITIATIVE.
a) Employees within the organisation are highly motivated.
Strongly
Disagree
Strongly
Agree
Don‟t
know
Start of BPMI 1 2 3 4 5 6 7
Now 1 2 3 4 5 6 7
b) Employees have confidence in the abilities and skills of other employees.
Strongly
Disagree
Strongly
Agree
Don‟t
know
Start of BPMI 1 2 3 4 5 6 7
Now 1 2 3 4 5 6 7
c) Employees have confidence in decisions made by other employees.
Strongly
Disagree
Strongly
Agree
Don‟t
know
Start of BPMI 1 2 3 4 5 6 7
Now 1 2 3 4 5 6 7
d) Employees have confidence that other employees act in the company‟s best
interest.
Strongly
Disagree
Strongly
Agree
Don‟t
know
Start of BPMI 1 2 3 4 5 6 7
Now 1 2 3 4 5 6 7

Business Process Management: Progression and Maturity
- 13:707 -
e) Employees from within the same department communicate on a regular
basis.
Strongly
Disagree
Strongly
Agree
Don‟t
know
Start of BPMI 1 2 3 4 5 6 7
Now 1 2 3 4 5 6 7
f) Employees from different departments communicate on a regular basis.
Strongly
Disagree
Strongly
Agree
Don‟t
know
Start of BPMI 1 2 3 4 5 6 7
Now 1 2 3 4 5 6 7
g) Employees are willing to commit time and energy to improving processes.
Strongly
Disagree
Strongly
Agree
Don‟t
know
Start of BPMI 1 2 3 4 5 6 7
Now 1 2 3 4 5 6 7
h) Employees view BPM as being critical to the future of the organisation.
Strongly
Disagree
Strongly
Agree
Don‟t
know
Start of BPMI 1 2 3 4 5 6 7
Now 1 2 3 4 5 6 7

Appendices
- 13:708 -
i) Executives create an environment that encourages learning through
experience.
Strongly
Disagree
Strongly
Agree
Don‟t
know
Start of BPMI 1 2 3 4 5 6 7
Now 1 2 3 4 5 6 7
j) Executives stimulate employees to be creative and innovative.
Strongly
Disagree
Strongly
Agree
Don‟t
know
Start of BPMI 1 2 3 4 5 6 7
Now 1 2 3 4 5 6 7
k) Executives focus on the long-term viability of the organisation.
Strongly
Disagree
Strongly
Agree
Don‟t
know
Start of BPMI 1 2 3 4 5 6 7
Now 1 2 3 4 5 6 7
l) Executives ensure employees are provided with the tools they need to do
their work as best they can.
Strongly
Disagree
Strongly
Agree
Don‟t
know
Start of BPMI 1 2 3 4 5 6 7
Now 1 2 3 4 5 6 7
Business Process Management: Progression and Maturity
- 13:709 -
m) Executives create an environment that promotes BPM.
Strongly
Disagree
Strongly
Agree
Don‟t
know
Start of BPMI 1 2 3 4 5 6 7
Now 1 2 3 4 5 6 7
n) Executives support BPM through their words and actions.
Strongly
Disagree
Strongly
Agree
Don‟t
know
Start of BPMI 1 2 3 4 5 6 7
Now 1 2 3 4 5 6 7
o) Executives are convinced of the business value of BPM.
Strongly
Disagree
Strongly
Agree
Don‟t
know
Start of BPMI 1 2 3 4 5 6 7
Now 1 2 3 4 5 6 7
p) Executives view BPM as being critical to the future of the organisation.
Strongly
Disagree
Strongly
Agree
Don‟t
know
Start of BPMI 1 2 3 4 5 6 7
Now 1 2 3 4 5 6 7

Appendices
- 13:710 -
Section 5: Organisation Demographics (completed by Contact only)
Organisation‟s name: ____________________________________________
Headquarters located in: _________________________________________
Industry type:
Agriculture
Building and Construction
Banking and Financial services
Education
Health
Innovation, Science and Technology
Manufacturing
Mining
Professional Services
Retail
Telecommunications
Tourism
Transport
Utilities
Other, namely _____________
Annual turn-over: _______________
Approximate number of employees:____________________
Approximately what percentage of employees is full-time? _______ %
Approximately what percentage of employees is in a work-related union?
______%
Sector:
Private Public Not For Profit (NFP) Other, (please specify)
Organisation‟s ownership structure:
Stand alone company
Wholly owned or controlled subsidiary
Parent company
Other (please specify)_________________________________________
Business Process Management: Progression and Maturity
- 13:711 -
If your organisation is a wholly owned or controlled subsidiary, please indicate
your parent company:
Name: _______________________________________
Headquarters location: _________________________________
The following questions relate to your organisation‟s BPM Initiative.
Which area instigated your organisation‟s BPM Initiative?
Parent company
Board of directors
Executives
BPM Centre
Line of Business
IT Department
Finance Department
Sales & Marketing Department
Human Resources Department
Other (please specify) ______________
How would you best describe the structure of your organisation‟s BPM Initiative
when it started?
Ad Hoc
Project-based
Pockets of excellence e.g. BPM Centre / BPM Team
Enterprise-wide Program
Which area was responsible for the structure of your organisation‟s BPM Initiative
when it started? (select one)
Parent company
Board of directors
Executives
BPM Centre
Line of Business
IT Department
Finance Department
Sales & Marketing Department
Human Resources Department
Other (please specify) ______________
Which area is responsible for the structure of your organisation‟s BPM Initiative at
this point in time? (select one)
Parent company
Board of directors
Executives
IT Department
Finance Department
Sales & Marketing Department

Appendices
- 13:712 -
BPM Centre
Line of Business
Human Resources Department
Other (please specify) ______________
Who was accountable for the conduct of your organisation‟s BPM Initiative when
it started?
CEO CIO CFO COO COO Other, namely ______
Who is accountable for the conduct of your organisation‟s BPM Initiative at this
point in time?
CEO CIO CFO COO COO Other, namely ______
How long is your organisation planning to continue with its BPM Initiative (in
some form)?
At most 2 years
2 to 5 years
6 to 10 years
Ongoing
Other, namely ____________________________________________
If there are plans to continue the BPM Initiative for more than 2 years, briefly explain what these plans involve?

Business Process Management: Progression and Maturity
- 13:713 -
13.4.5 Workshop Agenda
8.45 – 9.00 Welcome and Introduction
9.00 – 10.00 Overview of the BPMM Model
10.00 – 11.00 The role of Contextual Variables
11.00 – 11.15 Morning Tea
11.15 – 12.15 Results from interviews and surveys
12.15 – 12.45 Strategic Alignment Capability Areas and Practices
12.45 – 1.15 Governance Capability Areas and Practices
1.15– 1.45 Lunch
1.45 – 2.15 People Capability Areas and Practices
2.15 – 2.45 Culture Capability Areas and Practices
2.45 – 3.15 IT Capability Areas and Practices
3.15 - 3.30 Afternoon Tea
3.30 – 4.00 Methods Capability Areas and Practices
4.00 – 4.15 Next Steps & Close

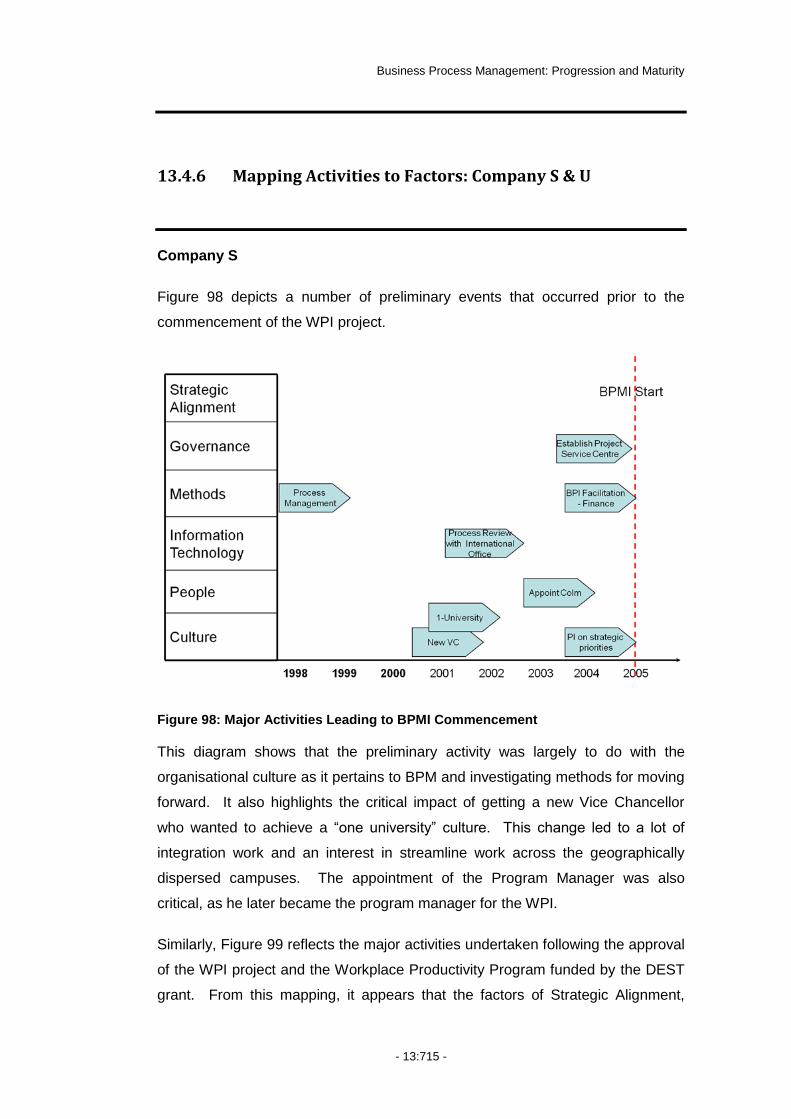
Business Process Management: Progression and Maturity
- 13:715 -
13.4.6 Mapping Activities to Factors: Company S & U
Company S
Figure 98 depicts a number of preliminary events that occurred prior to the
commencement of the WPI project.
Figure 98: Major Activities Leading to BPMI Commencement
This diagram shows that the preliminary activity was largely to do with the
organisational culture as it pertains to BPM and investigating methods for moving
forward. It also highlights the critical impact of getting a new Vice Chancellor
who wanted to achieve a “one university” culture. This change led to a lot of
integration work and an interest in streamline work across the geographically
dispersed campuses. The appointment of the Program Manager was also
critical, as he later became the program manager for the WPI.
Similarly, Figure 99 reflects the major activities undertaken following the approval
of the WPI project and the Workplace Productivity Program funded by the DEST
grant. From this mapping, it appears that the factors of Strategic Alignment,

Appendices
- 13:716 -
Methods and Culture received the bulk of the emphasis during early stages of the
WPI. The factors of Governance, IT and People appear to have received little or
no attention during the early stages of the BPM journey.
Figure 99: Company S – Major Activities during BPM Initiative
In comparing this map to the above figures, it appears that they are consistent for
the emphasis on Strategic Alignment, Culture and Methods and the lower level of
emphasis on Governance and Information Technology. There appears to be an
anomaly however, with the People factor that has seemingly rated higher in the
surveys than this depiction suggests. On revisiting the interview transcripts, it
became apparent that the significant involvement and education of people
reflects in the larger purpose of the activity or event taking place, not necessarily
as a separate aspect. Thus, the survey reflects the active involvement and
increased collaboration of people in projects to develop the process architecture
but this only appears as one activity in Figure 99 (i.e. Identification and
Documentation of Processes). Similarly, the informal education and learning
undertaken with individuals through the various communication mediums aimed
at progressing the BPM Initiative and the increase in BPM knowledge.
Participant statements that support this include:
Strategic
Alignment
Governance
Methods
Information
Technology
People
Culture
2005 2006 2007
WPI
Phase 2
WPI
Phase 1
Key processes
– gap analysis
SEC
Endorsement
BPI - WPI
Established
Forums
Briefings with
Deans
WPP Application
Common
Language
Change from
compliance
to performance
BPI Facilitation
-Fac Mgmt
BPI Strategic
Imperative
VC widens
Scope – S&PCL
2005 2006 2007
WPI
Phase 2
WPI
Phase 1
Key processes
– gap analysis
SEC
Endorsement
BPI - WPI
Established
Forums
Briefings with
Deans
WPP Application
Common
Language
Change from
compliance
to performance
BPI Facilitation
-Fac Mgmt
BPI Strategic
Imperative
VC widens
Scope – S&PCLIdentification &
Documentation of Processes

Business Process Management: Progression and Maturity
- 13:717 -
“...you‟ve got to develop people who have a kind of deep knowledge, not only of
your organisation but I think of universities...”
“...you can have perfectly rational consultations and discussions and working
parties and shared this and that and communicate to people and yet, even
people engaged with those processes don‟t necessarily get it...”
“...we would need to involve and include reference groups, a variety of reference
groups in the effort. So we worked through the organisation we could speak to
the course coordinators, we could talk to the organisation, we could talk to the
professoriate (...) however recently we put together a forum (...) we also had later
in the piece a middle manager forum...”
“...we brought that forward to our briefings of the forum to explain what we were
doing...”
“...we then conducted a series of briefings with the Deans. We had been talking
to Executive Directors and we had been dealing with senior management around
about April 2006 we briefed the Deans...”
“...we opted to do a review at a high level (...) we wanted the Deans themselves
to be involved (...) typical representation was from Deans and Heads of School,
school Admin Officers, Faculty Executive Officers and others as nominated...”
Company U
The history of the BPM Initiative reflects in the major activities that have occurred
over time. Figure 100 shows these activities over the course of the initiative. It is
clear from the diagram that significant activity occurred following the creation of
COG and the subsequent appointment of an external GM. Similarly, the close
integration between COG and the IT department reflects in the emphasis on the
IT factor.

Appendices
- 13:718 -
Figure 100: Major Initiatives in BPM Initiative – Company U
During the workshops, participants validated this map an in comparing this map
to the figures above, it appears they are consistent with the level of emphasis on
all factors except Methods. This factor appears to have a higher emphasis in the
survey data than in the initial depiction. Revisiting the interview transcripts
enabled the exploratory of this anomaly. What became apparent from this review
was that the single item of “Manuals” showing on the validated diagram, was
actually a significant body of work, including changes to the technology available
and the training and induction of new staff.
“...all our manuals are now online and I thought it was unreasonable for me to
expect that an operator can be reading the online manual and undertaking
transaction work in the host system on the same screen, because you can‟t flick
between the instruction and the screen and have it make any sense, so we
installed dual monitors on everybody‟s desk tops so now they can read their
online instructions on one screen and use the transaction system on the other...it
makes it so much easier for them...”
“...it‟s been really help with new staff because...you can point them to the screen
and they‟ve got the right manual (...) you don‟t have to wonder if it‟s that manual
over there with the red cover or that manual with the green cover that‟s the
Strategic
Alignment
Governance
Methods
Information
Technology
People
Culture Communities
of Practice
Tool Training
1998 1999 2000 2001 2002 2003 2004 2005 2006 2007
Creation
of some
BPM roles
Process
Improvement
Recognition
of Corporate
BPM value
Manuals
Standards
e.g. ISO
BPMI Start
Restructure to
COG
BPMG
Training
COG Matrix
TM
2000
TM
EDRMS
ARIS Holo-
Centric
Patent
System
Service
Request
GatewayIntegrated
Channel MgmtAlignment
Study
Some
Convention
Setting
B-2-B
Capability
Interfaces &
Data Uploads
COG Rotation
Concept
B-2-B
Capability

Business Process Management: Progression and Maturity
- 13:719 -
current one, am I training them the wrong way...”
Additionally, an activity coded to the Governance factor (i.e. Standards – ISO)
resulted in a significant focus on the adoption and use of methods for improving
the quality of processes within the COG. This reflects in statements:
“...we went from something like 2,000 uncontrolled documents down to 24. We
now have in my group, all but three people operating under a certified QMF 9001
process. The only reason those three people aren‟t certified is they only joined
us 6 months ago and we haven‟t got them into the certification rounds...”
This shows that it is not the number of activities but rather the magnitude of the
activities that best reflect emphasis.

Business Process Management: Progression and Maturity
- 13:721 -
13.4.7 BPM Capability Area Overview
BPM Capability Area Overview
Tonia de Bruin
May 2008

Appendices
- 13:722 -
This document provides a brief overview of the Capability Areas included in the
Business Process Management Maturity Model.
It is supplementary material provided to everybody participating in the BPMM
Identification Workshops.
The aim is to give participants a high-level understanding of the capability areas
to aid in the identification of key practices or instruments used within the various
capability areas.
It is helpful if participants can familiarise themselves with the factors/capability
areas for which they are participating in, prior to the Identification Workshops.
Figure 1: The BPM Maturity Model
Governance MethodsStrategic
Alignment
Information
Technology
People Culture
Process-Related
Standards
Process Metrics &
Performance
Linkage
Process Roles and
Responsibilities
Process
Management
Decision Making
Process Measures
Enterprise Process
Architecture
Strategy & Process
Capability Linkage
Process
Improvement Plan
Process Customers
& Stakeholders
Process Control &
Measurement (M)
Process
Implementation &
Execution (M)
Process Design &
Modeling (M)
Process Control &
Measurement (I)
Process
Implementation &
Execution (I)
Process Design &
Modeling (I)
Process Education
& Learning
Process
Management
Knowledge
Process Skills &
Expertise
Process Attitudes &
Behaviors
Process Values &
Beliefs
Responsiveness to
Process Change
Process Project &
Program Mgmt (M)
Process
Improvement &
Innovation (M)
Process Project &
Program Mgmt (I)
Process
Improvement &
Innovation (I)
Process
Management
Leaders
Process
Collaboration &
Communication
Leadership
Attention to Process
Process
Management Social
Networks
Process
Management
Controls
Fa
cto
rsC
ap
ab
ility A
rea
s

Business Process Management: Progression and Maturity
- 13:723 -
Strategic Alignment
Within the context of the BPMM, Strategic Alignment refers to the continual tight
linkage of organisational priorities and key processes enabling the achievement
of business goals.
This factor encompasses the extent to which an integrated and co-ordinated plan
exits for all process improvement projects, including how these are prioritised in
line with strategic goals and objectives. It also considers the relationship
between strategy and process capability and how these two areas are linked in
order to optimise the delivery of strategic goals and objectives through process
outcomes. Consideration is given to the existence of an enterprise-wide process
architecture that defines the end-to-end processes of the organisation and
describes the levels of detail required for distinct levels that support the key
processes. Included is the assessment of process measures and how they are
aligned with process goals and objectives. Finally, this area includes balancing
the often competing requirements of process customers and stakeholders such
as suppliers and the community.
Process Improvement Plan
Within the capability area Process Improvement Plan consideration is given to
how process strategies are developed, prioritised and implemented in line with
strategic goals and objectives. This includes scheduling process management
initiatives such as process reviews to assess the extent to which a particular
process contributes to the achievement of strategic goals and objectives as well
as identifying, aligning and managing process improvement initiatives as a
collective group (i.e. as a portfolio).
Strategy and Process Capability Linkage
Within the capability area Strategy and Process Capability Linkage consideration
is given to the bi-directional relationship between strategy and process capability.
This area considers whether existing process capability is sufficient to deliver
strategic requirements and how imbalances between capability and requirements
are managed and addressed. Consideration is also given to whether one party
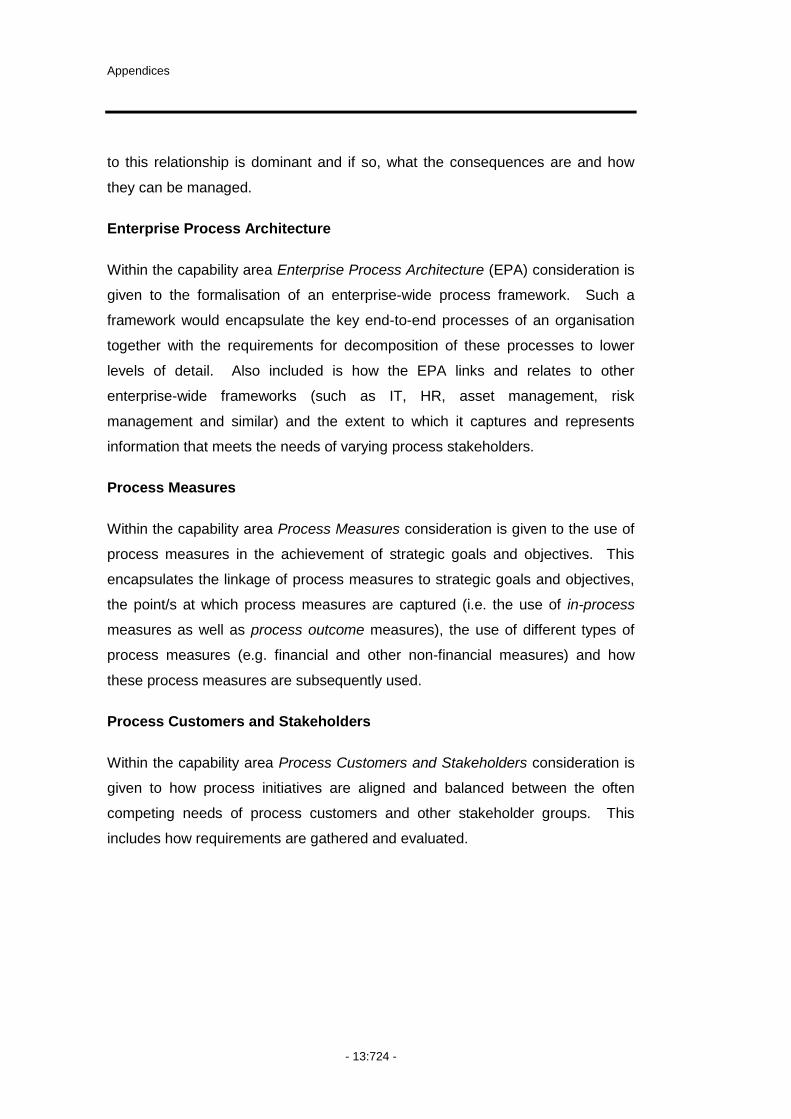
Appendices
- 13:724 -
to this relationship is dominant and if so, what the consequences are and how
they can be managed.
Enterprise Process Architecture
Within the capability area Enterprise Process Architecture (EPA) consideration is
given to the formalisation of an enterprise-wide process framework. Such a
framework would encapsulate the key end-to-end processes of an organisation
together with the requirements for decomposition of these processes to lower
levels of detail. Also included is how the EPA links and relates to other
enterprise-wide frameworks (such as IT, HR, asset management, risk
management and similar) and the extent to which it captures and represents
information that meets the needs of varying process stakeholders.
Process Measures
Within the capability area Process Measures consideration is given to the use of
process measures in the achievement of strategic goals and objectives. This
encapsulates the linkage of process measures to strategic goals and objectives,
the point/s at which process measures are captured (i.e. the use of in-process
measures as well as process outcome measures), the use of different types of
process measures (e.g. financial and other non-financial measures) and how
these process measures are subsequently used.
Process Customers and Stakeholders
Within the capability area Process Customers and Stakeholders consideration is
given to how process initiatives are aligned and balanced between the often
competing needs of process customers and other stakeholder groups. This
includes how requirements are gathered and evaluated.
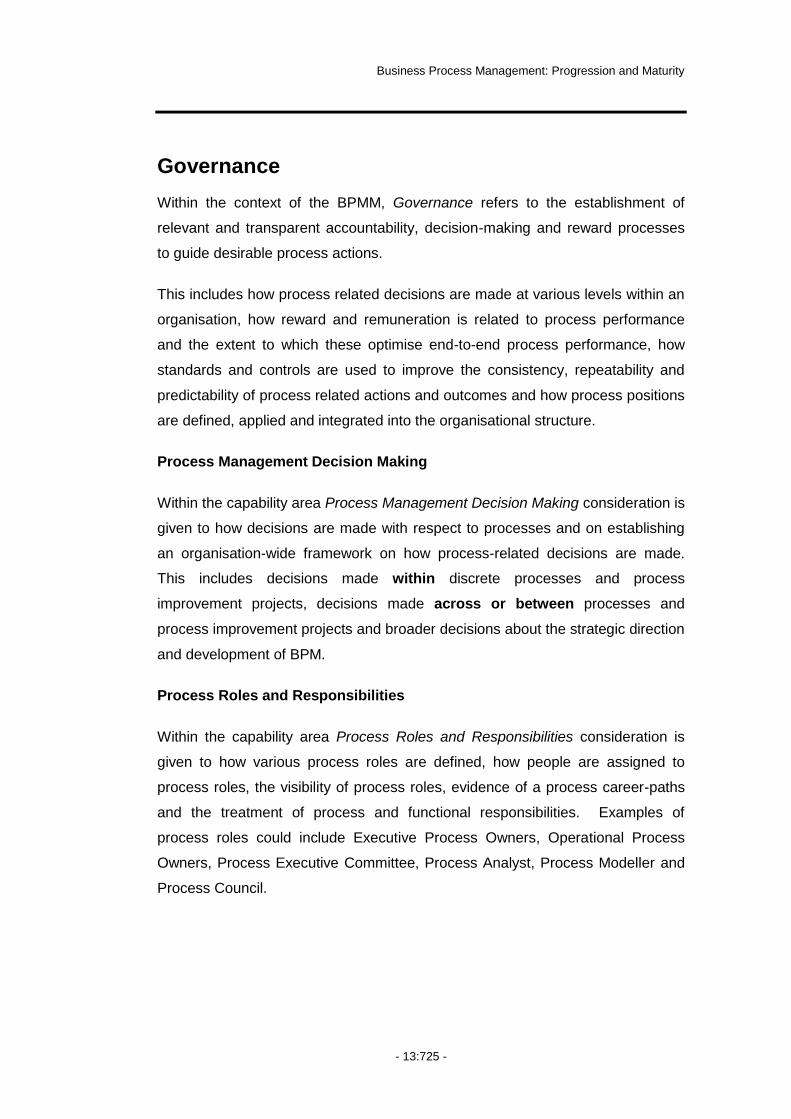
Business Process Management: Progression and Maturity
- 13:725 -
Governance
Within the context of the BPMM, Governance refers to the establishment of
relevant and transparent accountability, decision-making and reward processes
to guide desirable process actions.
This includes how process related decisions are made at various levels within an
organisation, how reward and remuneration is related to process performance
and the extent to which these optimise end-to-end process performance, how
standards and controls are used to improve the consistency, repeatability and
predictability of process related actions and outcomes and how process positions
are defined, applied and integrated into the organisational structure.
Process Management Decision Making
Within the capability area Process Management Decision Making consideration is
given to how decisions are made with respect to processes and on establishing
an organisation-wide framework on how process-related decisions are made.
This includes decisions made within discrete processes and process
improvement projects, decisions made across or between processes and
process improvement projects and broader decisions about the strategic direction
and development of BPM.
Process Roles and Responsibilities
Within the capability area Process Roles and Responsibilities consideration is
given to how various process roles are defined, how people are assigned to
process roles, the visibility of process roles, evidence of a process career-paths
and the treatment of process and functional responsibilities. Examples of
process roles could include Executive Process Owners, Operational Process
Owners, Process Executive Committee, Process Analyst, Process Modeller and
Process Council.

Appendices
- 13:726 -
Process Metrics and Performance Linkage
Within the capability area Process Metrics and Performance Linkage
consideration is given to how the performance of individuals and/or teams is
linked to the achievement of process metrics and the relationship of these
measures to the remuneration of individuals and teams. Having specific
performance measures that contribute to an end-to-end process at both an
operational and a strategic level also contributes to this area.
Process Related Standards
Within the capability area Process Related Standards consideration is given to
the adoption of standards to process and process management activities.
Process-related standards encompasses those of a general nature such as
health and safety standards which go to set a minimum level of process
performance as well as more process-specific standards such as the decision to
use of BPMN for creating Level 4 process models in order to enable the
comparison of all models at this level.
Process Management Compliance
Within the capability area Process Management Compliance consideration is
given to how the organisation ensures performance, behaviours and actions are
in accordance with agreed BPM standards and governance structures. This area
also includes how results and reported and communicated and how the results of
compliance assessments are utilised in the continual improvement process.

Business Process Management: Progression and Maturity
- 13:727 -
Methods
Within the context of the BPMM, Methods refer to the approaches and
techniques that support and enable consistent process actions throughout the
process lifecycle.
Process Design and Modelling (aka Process Representation)
Within the capability area Process Design and Modelling consideration is given to
the availability and use of a range of methods to document and depict processes.
This includes formal process modelling methods used when creating executable
process models e.g. BPMN, IDEF0, Petri Nets or similar as well as less formal
methods such as value-chain mapping and strategy maps for the representation
of process models requiring less detail.
Process Implementation and Execution (aka Process Monitoring)
Within the capability area Process Implementation and Execution consideration is
given to the availability and use of methods in monitoring the execution of
processes. This includes ensuring processes are executed in accordance with
underlying models and that process inputs and outputs are in line with
expectations using methods such as service-level agreements, quality checks
and similar.
Process Control and Measurement (aka Process Evaluation)
Within the capability area Process Control and Measurement consideration is
given to the methods employed in the evaluation of processes (as opposed to the
evaluation and analysis of potential process improvement solutions). This
includes assessing a process or process performance against competitors and
industry standards using methods such as value-chain analysis, activity-based
costing, benchmarking or similar.

Appendices
- 13:728 -
Process Improvement
Within the capability area Process Improvement consideration is given to the
methods used through all aspects of process improvement. This includes the
identification and selection of a process for improvement as well as the
generation, analysis and implementation of a proposed solution. As such, this
includes the use of on-going process improvement methods such as Six Sigma,
Lean, TQM and similar whilst it also includes methods aimed at questioning the
actual existence of processes such as BPR, green-field thinking, process
elimination and similar.
Process Project and Program Management
Within the capability area Process Project and Program Management
consideration is given to the methods that are used in managing the entire the
development, implementation and ongoing conduct of process management
projects and programs. This includes the „process of process management‟ as
well as the more general project management methods such as PMBOK or
Prince2.
Information Technology
Within the context of the BPMM, Information Technology is the software,
hardware and information management systems that enable and support
process-related activities through the various stages of a process lifecycle.
Process Design and Modelling
Within the capability area Process Design and Modelling consideration is given to
the IT used in the generation, storage, access and management of process
models e.g. ARIS, IDEF0, BPEL and similar.

Business Process Management: Progression and Maturity
- 13:729 -
Process Implementation and Execution
Within the capability area Process Implementation and Execution consideration is
given to the use of technology in the automation and execution of processes e.g.
workflow systems, ERP‟s and similar.
Process Control and Measuring
Within the capability area Process Control and Measuring consideration is given
to how technology and information systems are used in the control of processes
e.g. the use of system control variables and triggers, audit trails and similar. This
area also captures the use of technology for capturing process performance data
at the point of execution.
Process Improvement and Innovation (aka Process Optimisation)
Within the capability area Process Improvement and Innovation consideration is
given to how the organisation uses technology such as simulation software in the
identification, generation, comparison and evaluation of different process
scenarios or solutions.
Process Project and Program Management
Within the capability area Process Project and Program Management
consideration is given to the tools that facilitate the management of process
information. They are essential, but typically less BPM-specific e.g. portals,
intranet, MS-Project, knowledge management systems and similar.
People
Within the context of the BPMM, People encompass the individuals and groups
that continually extend and apply their process-related knowledge.
This factor focuses on the people resources and how they work together to
optimise their process and process management skills, expertise and knowledge.
Consideration is given to what process and process management skills and
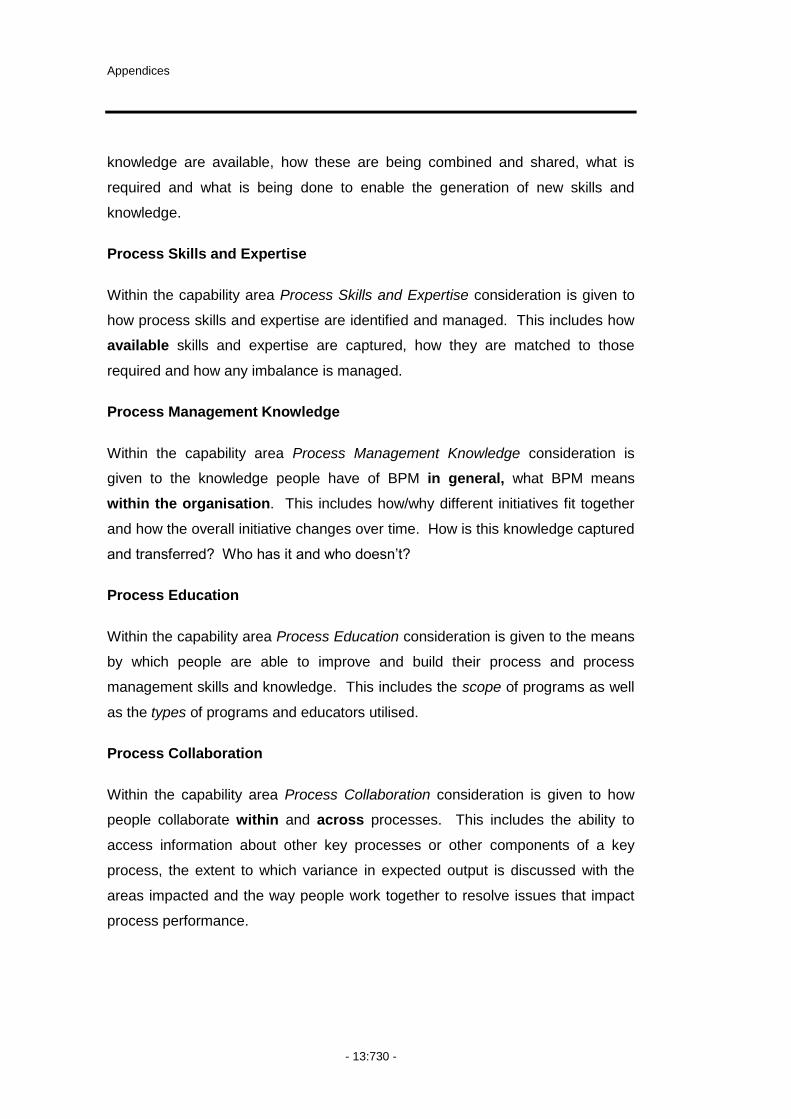
Appendices
- 13:730 -
knowledge are available, how these are being combined and shared, what is
required and what is being done to enable the generation of new skills and
knowledge.
Process Skills and Expertise
Within the capability area Process Skills and Expertise consideration is given to
how process skills and expertise are identified and managed. This includes how
available skills and expertise are captured, how they are matched to those
required and how any imbalance is managed.
Process Management Knowledge
Within the capability area Process Management Knowledge consideration is
given to the knowledge people have of BPM in general, what BPM means
within the organisation. This includes how/why different initiatives fit together
and how the overall initiative changes over time. How is this knowledge captured
and transferred? Who has it and who doesn‟t?
Process Education
Within the capability area Process Education consideration is given to the means
by which people are able to improve and build their process and process
management skills and knowledge. This includes the scope of programs as well
as the types of programs and educators utilised.
Process Collaboration
Within the capability area Process Collaboration consideration is given to how
people collaborate within and across processes. This includes the ability to
access information about other key processes or other components of a key
process, the extent to which variance in expected output is discussed with the
areas impacted and the way people work together to resolve issues that impact
process performance.

Business Process Management: Progression and Maturity
- 13:731 -
Process Management Leaders
Within the capability area Process Management Leaders consideration is given
to the approach taken to recognising process management leaders. This
includes the role of process management leaders have, the skill-sets and
attributes that are most highly valued and how process leaders are developed.
Culture
Within the context of the BPMM, Culture refers to the collective values and
beliefs that shape desired process and process management attitudes and
behaviours.
At a strategic level consideration is given to how the organisation depicts and
promotes its BPM philosophy within key medium such as its vision and mission
statements or publications such as its annual report or press statements.
Consideration is also given to the influence of leadership and the level of
attention executive and senior management leadership gives to process
initiatives throughout the organisation and how these are reflected in the attitudes
and behaviours of individuals and groups connected with the organisation. On
another level Culture integrates how the organisation responds to process
change, does it actively seek change, are people generally receptive towards
change with the development of process forums which enable and encourage the
sharing of process knowledge and skills.
Responsiveness to Process Change
Within the capability area Responsiveness to Process Change consideration is
given to how individuals respond to process change and how individuals
contribute to the identification and instigation of process change. This includes
whether process change arises as a consequence of solving existing problems
as well as arising from actively questioning why a process actually occurs.

Appendices
- 13:732 -
Process Values and Beliefs
Within the capability area Process Values and Beliefs consideration is given to
the commitment, integration and articulation of BPM values. This includes
corporate communications such as vision and mission statements, annual
reports, internal presentations and articles in the press.
Process Attitudes and Behaviours
Within the capability area Process Attitudes and Behaviours consideration is
given to how the attitudes and behaviours of individuals support, reflect and
promote process thinking and actions.
Leadership Attention to Process
Within the capability area Leadership Attention to Process consideration is given
to how senior management and executives promote and support process and
process management activities though their actions and words.
Process Management Social Networks
Within the capability area Process Management Social Networks consideration is
given to the extent to which the organisation facilitates the use of process-related
forums and networks as a means of communicating and sharing process
knowledge and experiences.

Business Process Management: Progression and Maturity
- 13:733 -
13.4.8 BPM Capability Areas: Key Practices (Sample)
This appendix provides a sample of the key practices from select companies
across the Strategic Alignment and Information Technology capability areas. In
all cases, participants identified these practices during the workshop with access
to the definitions of the capability areas. The purpose of the appendix is to
support the findings of the study and provide further insights into the complexities
of measuring the capability areas. The diverse range of practices and levels of
capability development within each area provides strong support for the use of
formative rather than reflective measures for assessing BPM capabilities.
Strategic Alignment
Process Improvement Planning
Company S
No formal mechanism at this point
Stakeholder reviews / IT projects
Informed Infrastructure Enabling plans
Know why, pretty good sense of what, floundering with how – no institutionalised method of doing so at this time
WPI Stage 1 report outcomes – asked ED‟s and Deans to implement things they could within the own unit
Challenges around systems ownership, process ownership etc
Looked at initiatives, link to strategy, but don‟t look at processes in their own right – go line of sight down
Identified at exec level the need of understanding and identifying and prioritising appropriately – and resourcing accordingly
People are more comfortable with asking why resourcing being placed where it is
Company U
There is no structured method of looking at end-to-end processes
BIMS has a system development process focus
Wide reaching process improvement has been undertaken
There is little co-ordination, consensus or communication of process work
Initial planning is ad hoc and starts with business units through the use of improvement logs and defects
Appendices
- 13:734 -
Prioritisation is ad hoc although there is some feeling that this is starting to be grouped together and become more co-ordinated
The work done with ISO 9001 was focused more on compliance and adherence with the approved „as-is‟ and not on improvement
There is some proactive work being done in with environmental issues (e.g. Patent Strategy) although this is not integrated
COG has improved its planning in line with strategy and environmental issues using a system of high level issues being logged to a Process Board
The linking of issues by the Process Board is limited
There is little balance between strategic and operational focus with an emphasis being on operational issues such as resourcing
There is no clear interpretation of some initiatives e.g. Integrated Channel Management
Rather than prioritising against strategic goals it is more a case of first-in-first-served
There is a feeling that things are better this year with the realisation of the importance of taking time out and thinking about things and the recognition that process planning forms a part of strategic planning and that hand-overs between strategic planning and the operationalisation of that planning is not good
BIMS are trying to pick things up along the way and through communications with the Product Managers
There is no co-ordinated framework to guide the way people think and work with process and process management
Company W
after training A05s identify processes in their area that need attention, talking to FC to see what has happened, Julie to co-ordinate with FC on how to make that work, look at capacity and resource allocation, delivery of service/resourcing/records management / move to new building
Have done high level value chain to look at top down and working towards vanilla process patterns, variations of types of work
Strategy and Process Capability Linkage
Company S
Making changes that are in conflict and asking the same people to simultaneously make changes that pull them in different directions
Unified Session Model
Filling gaps and playing catch-up, don‟t think about what the process capability is, very much in catch up mode, ambitious nature of current strategy and little consideration of capability

Business Process Management: Progression and Maturity
- 13:735 -
4 enabling plans, no idea or understanding of import of the plans
Not aware of current process capability – need to identify what the capability is
University level and then at organisational unit levels – cascading approach to be adopted at all levels
Company U
There is a push to look at process as radical innovation and talk about this being a way of gaining international recognition although this is uneven across the organisation. The idea of the “ideal patent process” was started
As a part of ISO 9001 there is recognition of a difference in using process capability but it has not been overtly discussed to date
When considering process capability the focus is on looking at the status-quo and not on improving the process
There has been some consideration of changing process capability by streamlining with other regions however once again this is looking mostly at the logistics of managing workload and not on changing the underlying processes
The short-term solution for a shortfall in process capability is to adopt a resource strategy of recruiting more examiners. However, there is also the recognition that this is not necessarily a viable business solution and there is a need to look at more than just resourcing. At the moment this has resulted in talk but no action and thus a view that little is being done to develop process capability in line with strategy
There is an issue in that there is internal and external (customer) resistance to increasing the use of policy and legislation to change process. For example, it is known that a lot of trademarks don‟t last 10 years but rather they last 3 years however this is process is limited by an existing international treaty. It is perceived that there is irony in the fact that the IP industry does not suit innovation
Company W
Still sorting out, strategy map and BSC, not done business plan approach, must connect business plan to other plans within the government strategic plan – Financial Audit Act
Process capability helps prioritise – what do we have to deliver on and what else can we do
No real feeds between the where do we want to go and being part of the government

Appendices
- 13:736 -
Enterprise Process Architecture
Company S
Process Model – basic conceptual model, some detail underneath (2 or 3%)
Considering making this available (your Company S booklet)
Gathered data – working out strategy for how to deploy and leverage this, work out who needs what, what to give to who
Varying levels of understanding – traditionally people didn‟t think about processes but rather the people that do things
The invisibility of enterprise architecture made it difficult to get engagement
Linkages to other frameworks, legislation, people, data identified but understanding and articulation may need to be progressed
Company U
Nothing currently exists but there are plans to start working on this
There are bits and pieces and pockets of process models but these are not related or are linked to discrete systems
Existing process models are not used
The top level processes have been identified and are felt to be okay however, these have not been devolved to lower levels
A lot of high-level process modelling was done in ARIS for ISO manuals but these are not used
Process models are not used for identifying improvement possibilities
There has been no organisational decision about what an enterprise process architecture might look like including what levels would be reflected, what details would reside at each level, how such an architecture would be used and link to other enterprise architectures or frameworks or what forms of representation might be used for various levels
Company W
Different levels, what the department is doing and what FC is doing
Don‟t have a picture of EPA, but have break down of case management within Company W
Enterprise Architecture for department struggling in terms of commitment from staff and department, lack of mgmt support, and how things link together, knowledge loss, committee starting in the next few weeks, process architecture/information/technology/group
Business Process Management: Progression and Maturity
- 13:737 -
Process Measures
Company S
Understanding the issues with core processes and enabling processes through WPI Stage 1 and re-testing these as part of the DEST127 funded Workplace Productivity Program, i.e. have they gone away yet?
Measuring the condition of processes
Still lots of work to be done on looking at in-process measures
Measurement structures exist as part of operational and strategic management linking measures to strategy but the link to processes may not be there (or is very tenuous)
Company U
A gap-analysis conducted for ISO 9001 found that a lot of measures already existed but:
Existing process measures are largely ad hoc
Most are output and outcomes based with little focus on in-process, enabling measures
Cycle times, response times and back-log monitoring are prominent
There is some use of Customer Service Charters and Service Level Agreements but there is only a tenuous link with strategy, a focus on meeting the measures and not using these to drive process improvement
Some volumes and forecast figures are captured but these are not high level and are not process based
Benchmarking with international peers is beginning to be used with examinations in patents but is in its infancy
There is a need to relate process measures to strategic outcomes
Situational measures are related to IT performance and work-arounds that have been developed
Company W
Working out existing stats and performance and looking to measure what we want to measure
Looking at measuring at the end not throughout the process
Expecting that as understanding of process improves will be able to address critical points along the way
In CPIP were looking at BSC but has fallen away – difficulty in reconciling with departmental – no data quality on even basic stuff
127
Now DEEWR
Appendices
- 13:738 -
Process Customers and Stakeholders
Company S
WPI Stage 1 included identification of customers and stakeholders, through describing the stakeholder context of functional areas. In addition, we developed process profiles that included identification of process stakeholders
Facilitated the organisation in identifying stakeholders but whether anything shifted because of the identification is another step
Unevenness of recognition of requirements for various stakeholders thus difficult to balance at this point – Service Alignment Project
Challenges around internal and external environment
A lot of education needed
Company U
Existing stakeholders are thought to inhibit process development
It is felt that the first step will take a long time and then people will behave like sheep
Small-medium enterprise attorneys are driving change by pushing for new ways of interacting as they don‟t have the capacity of traditional larger firms. It is thought that this group presents a new generation that are more internet savvy and entrepreneurial
Company W
Try to understand the different court sites throughout QLD and look at organisational structure to find person to talk to
Judicial focus group happening for endorsement and support
Litigants in Person
Lots of things happening to engage stakeholders along the way
Staff important stakeholders and have been a focus
Including key external people in some areas and will have to keep doing this (P&E thing)
Previously anecdotal as stakeholders not really known
Still in formative stage, but increasing to include Law Society
Method to identify who they are before going out to involve them (method was to discuss with people who are regularly involved in the process)

Business Process Management: Progression and Maturity
- 13:739 -
Information Technology
Process Design and Modelling
Company S
Visio, informal lower level drawing tools
Company U
ARIS (in the past – no longer)
Holo-centric
Oracle Designer
I-Graphix
Visio
Company W
ARIS
System Architect (in the past) and will be migrated across, doing information models as well as process models
Some use of VISIO, excel and power-point for Value Chain during early stages
Identify IT involved in each task within the model, and use of other variables to support process activities
Central repository, product support (local), ability to do information side without too much customisation, reporting without great deal of knowledge, linking of the different views
Process Implementation and Execution
Company S
Aware of – have some capability – not used much
Touchpaper – implementation
eBox, myCompany S
Alesco (HR)
Banner Student Finance
CASIMS
Company U
Electronic Data Records Management System
Borland for Software Development Life Cycle

Appendices
- 13:740 -
Bulk Upload/s (future)
Interface/s (future)
B2B technologies (future)
Company W
No workflow but looking at going there
CIMS (Civil Information Management System)
QWIC (QLD Wide Interlinked Courts)
CLAIMS (Civil Listing and Information Management System)
CAMS (Court of Appeal Mgmt System)
QJAS (QLD Jury Administration System)
IJIS (Integrated Justice Information Strategy) – will have a number of interfaces to talk to other criminal agencies
Spreadsheets
SAP
TRAILS (used for Agency work by regional courts)
Process Control and Monitoring
Company S
Not a lot of performance data being captured
Hard-coded control – limited capacity to change
CASIMS most sophisticated
Don‟t have closed processes
Some components are integrated but ad hoc from a corporate perspective
BEIMS – job management system
Very poor in research – some reliance on access databases
Company U
Use of in-system events and triggers
Batch processing
Spreadsheets
Administration system for workflow event checking – the focus is on measuring where they area and measure discrete steps not the process as a whole
Company W
JK
Caseflow – uses triggers to remind to issue a notice – doesn‟t work well

Business Process Management: Progression and Maturity
- 13:741 -
but the concept is there – related to CIMS (S&D only)
Similar in CLAIMS – in Magistrates Court only – the trigger is you put a response in a diary and this will generate printing and then reports at various times for things that are still open
Crystal reporting for Mag Court
Monthly reporting looking at performance data
A lot of things are kept in people‟s heads about what to do in certain circumstances and not in systems
Information Technology – Process Improvement and Innovation
Company S
None at all, although key on the horizon
Some thought of how to use IT with the Enterprise model
Company U
Lotus notes (for improvement logs)
On-line feedback forms (e.g. Customer Feedback forms)
Touch- paper (for defect tracking)
Company W
ARIS is intended for this in the future
Couldn‟t get System Architect to do planning so used excel to do matrices – simulator was separate and quite expensive so didn‟t use but didn‟t have resources and information to use either
Process Program and Project Management
Company S
PM environment, web page and management of process information to support that
Web version of yourCompany S (coming)
CASIMS
Register of initiatives – part of initiative management that has been developed
Company U
MS-Project
MS-Excel
Plan by Feature (future)

Appendices
- 13:742 -
Company W
JAG Net – Intranet
Courts Website
Email is over used
Lot of MS-Powerpoint
eDocs for administrative document management (small scale currently) but will be used as a repository – still need training and deployment
Telephone and written (MS-office in general)
ARIS
MS-Project
EVOLVE – training tool for what you need to know to work in the courts, source of information about processes
Databases behind the Case Management systems for reporting

Business Process Management: Progression and Maturity
- 13:743 -
13.4.9 BPM Case Study Report
Company S
Business Process Management
- Case Study Report -
Tonia de Bruin
February 2008, Brisbane

Appendices
- 13:744 -
Executive Summary
An increasing need to be competitive within the university sector resulting from
changes in federal government funding, the need to attract new students and a
desire to establish a one-university philosophy led COMPANY S to consider a
new way of conducting business. The subsequent Work Process Improvement
project (2005-2007) and the DEST funded Workplace Productivity Program
(commencing in 2007) are evidence of undertaking a business process
management (BPM) approach to business. Strong executive support stemming
from the appointment of a new Vice Chancellor in 2001 has resulted in a
centralised and strategically driven approach to BPM built upon enablers of
Executive Buy-In, organisational commitment and a planned and inclusive
approach to BPM.
The principle drivers of the BPM Initiatives can be classified as strategic,
operational, organisational and process based. Strategic drivers stemmed from
the 2006 strategic imperative and the desire to sustain COMPANY S‟s position
as a leader in the tertiary sector. Operational drivers arose from changes in
government funding and increased pressures to meet compliance requirements.
Organisational drivers came from a desire to overcome natural and structural
barriers to create a one-university culture whilst process drivers stemmed from
individual recognition that COMPANY S needed to more readily identify,
understand and improve existing process performance.
By exploring COMPANY S‟s BPM journey, we identified a number of risks and
opportunities arising from the current BPM Initiative. The risks were primarily in
the sustainability and growth of BPM within COMPANY S incorporating an over-
reliance on key staff, securing funding for future initiatives and maintaining
consistency and desirable behaviours as COMPANY S pushes BPM throughout
the wider University. The strategically driven focus on BPM and the high levels
of executive support provide COMPANY S with a number of opportunities for
progressing. On the one hand, this enables COMPANY S to develop BPM
capability in foundation setting areas such as those found in the Strategic
Alignment, Culture and Governance factors. On the other hand, being able to
establish this foundation provides a strong position from which to progress BPM

Business Process Management: Progression and Maturity
- 13:745 -
to the wider University community and to optimise the selection of appropriate
methods and IT. The future benefits from the use of such methods and IT will
potentially improve COMPANY S‟s (human) resourcing of BPM.
Table of Contents
Executive Summary .............................................................................................. 2
1.0 Introduction ................................................................................................ 5
1.1 Aims and Benefits ................................................................................. 6
1.2 The structure of this report .................................................................... 6
2.0 The BPMM Model ...................................................................................... 7
2.1 The BPMM model in brief ..................................................................... 7
3.0 Research Methods ..................................................................................... 9
3.1 Research Limitations .......................................................................... 10
4.0 COMPANY S‟s BPM Journey .................................................................. 11
4.1 Who participated in the BPMM assessment ....................................... 11
4.2 What BPM looks like at COMPANY S ................................................ 12
4.3 Drivers of BPM at COMPANY S ......................................................... 13
4.4 Enablers of BPM at COMPANY S ...................................................... 14
4.5 Mapping COMPANY S‟s Journey to the BPMM Model ....................... 14
5.0 BPM Practices ......................................................................................... 18
5.1 Strategic Alignment............................................................................. 20
5.2 Governance ........................................................................................ 25
5.3 Methods .............................................................................................. 29
5.4 Information Technology ...................................................................... 33 5.5 People ................................................................................................ 36
5.6 Culture ................................................................................................ 39
6.0 Key Results .............................................................................................. 44
6.1 Challenges for BPM within COMPANY S ........................................... 44
6.2 What COMPANY S has learnt from it‟s BPM Journey ........................ 45
6.3 Risks and Opportunities ...................................................................... 45
Appendices
- 13:746 -
Table of Figures
Figure 1: Conceptual BPMM Model ................................................................. 8
Figure 2: Mode of BPM within COMPANY S ................................................. 12
Figure 3: Summary of Events Leading to BPMI Commencement .................. 15
Figure 4: Summary of major activities during BPMI ....................................... 16
Figure 5: Emphasis placed on Factors during First and Last Year ................ 17 Figure 6: Emphasis during First Year ............................................................ 18
Figure 7: Emphasis during Last Year............................................................. 19 Figure 8: Change in emphasis placed on Capability Areas ........................... 20
Table of Tables
Table 1: Data Collection Methods and Participants ....................................... 11
