business results - nipponham.co.jp
TRANSCRIPT

Copyright © NH Foods Ltd. All Rights Reserved. (Unauthorized reproduction prohibited)
August 2, 2021
NH Foods Ltd.
Business Resultsfor the First Quarter of FY2022/3

Copyright © NH Foods Ltd. All Rights Reserved. (Unauthorized reproduction prohibited)
* The Company has adopted International Financial Reporting Standards (“IFRS”).
* Business profit is calculated by deducting cost of goods sold and selling, general and
administrative expenses from net sales, and accounting for foreign exchange gains and losses
determined by the Group, while deducting adjustments in accordance with IFRS and non-
recurring items.
* The Company discloses the baseball club business and new businesses in the “Others” category
from the first quarter of the fiscal year under review for the purpose of enhancing new business
areas. In addition, from the first quarter of the fiscal year under review, the Company has
changed the calculation method of net sales in order to appropriately reflect the business results
of the reportable segments.
For the above changes, figures prior to the previous fiscal year have been retroactively
adjusted. However, figures before the fiscal year ended March 31, 2020 have not been audited.
* Due to rounding, numbers may not match totals.
2
Contents
1. Consolidated Business Results for 1Q (Apr.-Jun.)
2. Segment Data: Processed Foods Business Division
3. Segment Data: Fresh Meats Business Division
4. Segment Data: Overseas Business Division
5. External Customer Net Sales Results in Major Overseas Geographical
Areas
6. Retrospective Adjustment on Medium-Term Management Plan 2020
I: Consolidated Business Results for
FY2022/3 1QP.4
1. FY2022/3 Business Profit Forecasts
2. Processed Foods Business Division: Outlook
3. Fresh Meats Business Division: Outlook
4. Overseas Business Division: Outlook
II: Outlook for FY2022/3 P.15
III: Consolidated Financial Results for
FY2022/3 1Q P.21
1. FY2021/3 Business Results at a Glance and FY2022/3 Forecasts
2. Balance Sheets / Capital Expenditures / Depreciation and
Amortization
3. Cash Flows

Copyright © NH Foods Ltd. All Rights Reserved. (Unauthorized reproduction prohibited) 3
I: Consolidated Business Results for
FY2021/3
II: Outlook for FY2022/3
III: Consolidated Financial Results for
FY2021/3
P. 20
I: Consolidated Business Results for
FY2022/3 1QP.4
1. FY2022/3 Business Profit Forecasts
2. Processed Foods Business Division: Outlook
3. Fresh Meats Business Division: Outlook
4. Overseas Business Division: Outlook
II: Outlook for FY2022/3 P.15
III: Consolidated Financial Results for
FY2022/3 1QP.21
1. FY2021/3 Business Results at a Glance and FY2022/3 Forecasts
2. Balance Sheets / Capital Expenditures / Depreciation and
Amortization
3. Cash Flows
1. Consolidated Business Results for 1Q (Apr.-Jun.)
2. Segment Data: Processed Foods Business Division
3. Segment Data: Fresh Meats Business Division
4. Segment Data: Overseas Business Division
5. External Customer Net Sales Results in Major Overseas Geographical
Areas
6. Retrospective Adjustment on Medium-Term Management Plan 2020

Copyright © NH Foods Ltd. All Rights Reserved. (Unauthorized reproduction prohibited)
12.4
9.2
1.0
0.8
(0.1)
1.0
0.6
FY2022/3 1Q
Eliminations,adjustments and
others
Others
OverseasBusiness Division
Fresh MeatsBusiness Division
Processed FoodsBusiness Division
FY2021/3 1Q
Changes in business profit (1Q)
Results Summary
Increased sales and profit in 1Q (¥ billion)1Q Results (Apr.-Jun.)
(¥ billion)
4
1. Consolidated Business Results for 1Q (Apr.-Jun.) (1)
Factor Analysis: Changes in business profit
[Processed Foods Business Division]
- Profits were secured especially in primary
processing and marine/dairy products thanks
to recovery in commercial-use products.
[Fresh Meats Business Division]
- Profits were increased by passing on costs to
sales price particularly in imported fresh meat
despite demand for commercial use and
restaurants yet to fully recover.
[Overseas Business Division]
- Decrease in profits due mainly to rising costs
of raw materials in Americas.
[Baseball club / Others]
- A recovery in profits from the previous year
thanks to the conditional opening of the
season and matches with spectators.
Reason for increased sales: Rising sales price of beef in Australia and recovery in marine/dairy
products and extract/primary processing.
Reason for increased profit: Profits were secured despite DX costs incurred in Fresh Meats
Business and Processed Foods Business.
FY2020/3 FY2021/3 FY2022/3 Variance
1Q 1Q 1Q (%)
Net sales 119.0 114.4 118.3 3.9 3.4
Business
profit2.4 2.8 3.3 0.6 20.7
Business
profit ratio2.0% 2.4% 2.8% 0.4 ー
Net sales 172.3 160.5 162.6 2.1 1.3
Business
profit7.5 8.5 9.5 1.0 11.7
Business
profit ratio4.4% 5.3% 5.9% 0.6 ー
Net sales 64.7 55.8 60.4 4.7 8.4
Business
profit0.8 (0.1) (0.2) (0.1) ー
Business
profit ratio1.2% ー 0 ー ー
Net sales 6.1 2.2 4.4 2.2 98.6
Business
profit1.4 (0.4) 0.4 0.8 ー
Business
profit ratio23.1% ー 8.6% ー ー
Net sales (57.3) (53.5) (50.8) 2.8 ー
Business
profit(1.1) (1.5) (0.6) 1.0 ー
Net sales 304.8 279.3 294.9 15.6 5.6Business
profit11.1 9.2 12.4 3.2 34.6
Business
profit ratio3.6% 3.3% 4.2% 0.9 ー
Consolidated
Variance
Processed Foods
Business Division
Eliminations,
adjustments and
others
Fresh Meats
Business Division
Overseas
Business Division
Others
304.8
279.3
294.9
11.1
9.2
12.4
FY2020/3 1Q FY2021/3 1Q FY2022/3 1Q
Net sales Business profit

Copyright © NH Foods Ltd. All Rights Reserved. (Unauthorized reproduction prohibited)
Gross profit: Improvement thanks to improved product mix of deli and processed foods
Expenses: Increase in one-time expenses such as TV commercials for new products aiming for
brand development
Gross profit: Improvement thanks to growth in primary processing and high profit marine products
Expenses: Increase in logistics costs from increased sales
Consumer: Growth in deli and processed foods especially with the new products; Decline in hams
and sausages
Commercial-use: Growth in the products for restaurants and convenience stores channels
Consumer: Growth in Vanilla Yogurt; Decline in canned foods
Commercial-use: Growth in products for volume retailers and sushi-shops and other restaurant channels
Hams and sausages, deli and processed foods
Marine/dairy products and extract/primary processing
(¥ billion)
Net Sales in FY2022/3 1Q Business Profit in FY2022/3 1Q
FY2020/3 FY2021/3 FY2022/3
Hams and sausages, deli and processed foods
Marine/dairy products and extract/primary processing
2. Segment Data: Processed Foods Business Division (1)
5
1Q
FY2020/3 FY2021/3 FY2022/3 Variance Variance (%)
Net sales 119.0 114.4 118.3 3.9 3.4
Business profit 2.4 2.8 3.3 0.6 20.7
of which marine/dairy product, extract/primary processing
0.2 (0.3) 0.5 0.8 -
Business profit ratio 2.0% 2.4% 2.8% 0.4
Sales increased with growth in marine/dairy products and primary processing thanks to recovery in commercial-use
products. Profits increased with improved product mix despite increased advertising expenses and DX costs.(¥ billion)
119.0 125.8141.6
112.3 114.4 122.1
140.6
112.2 118.3
2.4 2.97.6
0.5 2.83.7
9.6
2.0
3.3
△ 30
0
30
60
90
△ 500
0
500
1,000
1,500
1Q 2Q 3Q 4Q 1Q 2Q 3Q 4Q 1Q
Net sales Business profit

Copyright © NH Foods Ltd. All Rights Reserved. (Unauthorized reproduction prohibited)
1) Products for consumer channels: Demand for home meals remained high; stock demand for bulk purchasing also continued.
- Hams and sausages: Sales declined due partly to the lack of the effect from COVID-19 which helped boost sales in the
previous year, despite our efforts to expand sales of our core brand, SCHAU ESSEN, through
TV commercials aimed at expanding the consumer base, and packaging products in large-bags
to meet stock demand.
- Deli and processed foods: High performance thanks to strong sales of our core brand Ishigama Kobo, the introduction of TV
commercials aiming at developing a new brand for shelf-stable products, and the development of
new sales channels.
2) Products for commercial-use products:
Rebounded from the impact of COVID-19 in last year and strong demand for takeout continued.Strong sales of products for fast-food restaurants and convenience stores.
2. Segment Data: Processed Foods Business Division (2)
Hams and sausages, deli and processed foods sales results
Marine/dairy products and extract/primary processing sales results
Implemented marketing to meet changes in lifestyle
Year-on-year growth in sales by channel
Ham
s a
nd
sau
sag
es
Consumer
products Deli a
nd
pro
cessed
foo
ds
Consumer products
Wieners 97% Chilled bakery 110%
Loin hams 96% Chilled dish 93%
Bacons 88% Fried chicken 103%
Yakibutas 97% Hamburg and meatball 101%
Total 96% Total 102%
Year-on-year sales comparison of consumer products
Proposed products with focus on preservability
and stock demandProposed high-value-added products to
meet increasing demand for home meals
Vanilla Yogurt with Pineapple
from Okinawa
Volume Amount
Ham
s a
nd
sau
sag
es
Consumer 96% 96%
Commercial-
use109% 109%
Total 98% 98%D
eli a
nd
pro
cessed
foo
ds
Consumer 100% 102%
Commercial-
use105% 106%
Total 102% 104%
Bifidus Nomu Yogurt - Banana Flavor
1) Marine: Sales remained strong for sushi-toppings for volume retailers and restaurants and
high profit products manufactured in in-house factories.
2) Dairy products: Sales of cheese to restaurants and food manufacturers remained strong.
Sales of yogurt were at the same level as the previous year due to weak sales to
convenience stores despite the addition of a new flavor to our core brand Vanilla
Yogurt and the acquisition of new sales channels for food services.
3) Extract/primary processing: Sales to restaurants, including yakiniku restaurants, and to convenience stores
were strong.
6

Copyright © NH Foods Ltd. All Rights Reserved. (Unauthorized reproduction prohibited)
3.3
2.8
(0.3)
(0.5)
0.0
0.2
0.2
0.9
FY2022/3 full year results
DX costs
Improvement activities
Other materials/fuels
Principal raw material price
Vendor and logistics
Marine/dairy products and extract, etc.
FY2021/3 full year results
Positive
factors
1.3
(¥ billion)
(¥ billion)
Factor Analysis: Changes in business profit
Factor Analysis Graph: Changes in business profit results (full year)
Variation Factor Analysis (1Q)
Negative
factors
(0.8)
[External factors] ¥0.2 billion
Principal raw materials: Lower prices than last year, mainly for
wiener products
[Internal factors] ¥(0.5) billion
Improvement activities: Increased expenses for TV commercials for
developing core brands
[Vendor and logistics] ¥0.2 billion
Vendor: Improvement thanks to increased sales of
core products and reduction in labor cost
ratio with the leveling of production
[Marine/dairy products and extract/primary processing] ¥0.9
billion
Marine: Increase in sales and improvement in gross
profit rate
Dairy products: Increase in sales of cheese and
improvement in gross profit rate
Extract/primary processing: Improvement thanks to growth in sales
to yakiniku and other restaurants as well as
to convenience stores
7
2. Segment Data: Processed Foods Business Division (3)
* Due to rounding, numbers may not match totals.
FY2022/3
1Q
results
Hams and sausages, deli and
processed foods(0.2)
External factors 0.2
Principal raw material
price0.2
Other materials/fuels 0.0
Internal factors (0.5)
Volume expansion 0.0
Improvement activities (0.5)
Vendor and logistics 0.2
Marine/dairy products and
extract/primary processing0.9
DX costs (0.3)
Total 0.6

Copyright © NH Foods Ltd. All Rights Reserved. (Unauthorized reproduction prohibited)
172.3 172.7 183.8156.9 160.5 163.7
180.2152.2 162.4
7.5 6.810.0
7.7 8.5 9.7
14.1
8.9 9.5
0
100
200
0
1,000
2,000
1Q 2Q 3Q 4Q 1Q 2Q 3Q 4Q 1Q
Net sales Business profit
Net Sales in FY2022/3 1Q Business Profit in FY2022/3 1Q
(¥ billion)
Production: Profits decreased year-on-year due to declined production
volume of domestic pork, weak market prices, and high feed costs
Sales: Profits were secured thanks to strong demand for imported
chicken and other raw materials due to a recovery in
market prices of imported fresh meat and continued demand for takeout caused by COVID-19
FY2020/3 FY2021/3 FY2022/3
8
3. Segment Data: Fresh Meats Business Division (1)
Sales: Net sales exceeded that of the previous year thanks to
higher sales prices contributed by high market prices,
despite sales volume remained at the same level as the
previous year by reflected retailer channels which saw
increased sales last year
1Q
FY2020/3 FY2021/3 FY2022/3 Variance Variance (%)
Net sales 172.3 160.5 162.6 2.1 1.3%
Business profit 7.5 8.5 9.5 1.0 11.7%
Business profit ratio 4.4% 5.3% 5.8% 0.5 -
Sales increased with rising sales prices thanks to high market prices. Profits increased due to strong demand for
takeout of imported chickens, etc.

Copyright © NH Foods Ltd. All Rights Reserved. (Unauthorized reproduction prohibited)
(¥ billion)
Factor Analysis: Changes in business profit
Factor Analysis Graph: Changes in business profit results (full year)
Variation Factor Analysis (1Q)
(¥ billion)
[Imported fresh meat market] ¥1.9 billion
Beef/Pork: Rising procurement prices due to increased global demand have been
passed on to sales prices, and therefore profits were secured
Chicken: Profits increased significantly thanks to improved inventory positions
and passing on to sales prices in recovery in market prices
[Domestic fresh meat market] ¥0.3 billion
Pork: Sales environment improved with lower market prices compared to last
year
Profits were secured with efforts to maintain sales prices
Chicken: Profits were at the same level as last year with demand, sales prices,
and market prices all remaining high
[Farming operation in Japan] ¥(0.5) billion
Pork: Profits decreased year-on-year due to low market prices and high feed
costs as well as declined production volume
Chicken: Despite the impact from high feed costs, the business was strong
thanks to efforts to improve productivity and high market prices
[Nippon Food Group and logistics operation] ¥(0.6) billion
Sales: Sales prices for volume retailers were sluggish due to a stabilization in
demand for home meals
Maintained volume by strengthening sales to other channels, but profits
fell short of last year
9
3. Segment Data: Fresh Meats Business Division (2)
* Due to rounding, numbers may not match totals.
FY2022/3
1Q results
Imported fresh meat market 1.9
Domestic fresh meat market 0.3
Farming operation in Japan (0.5)
Nippon Food Group and logistics
operation(0.6)
DX costs (0.2)
Total 1.0
Positive
factors
2.2
9.5
8.5
(0.2)
(0.5)
(0.6)
0.3
1.9
FY2022/3 1Q results
DX costs
Farming operation in Japan
Nippon Food Group andlogistics operation
Dometstic fresh meatmarket
Imported fresh meat market
FY2021/3 1Q results
Negative
factors
(1.3)
Copyright © NH Foods Ltd. All Rights Reserved. (Unauthorized reproduction prohibited)
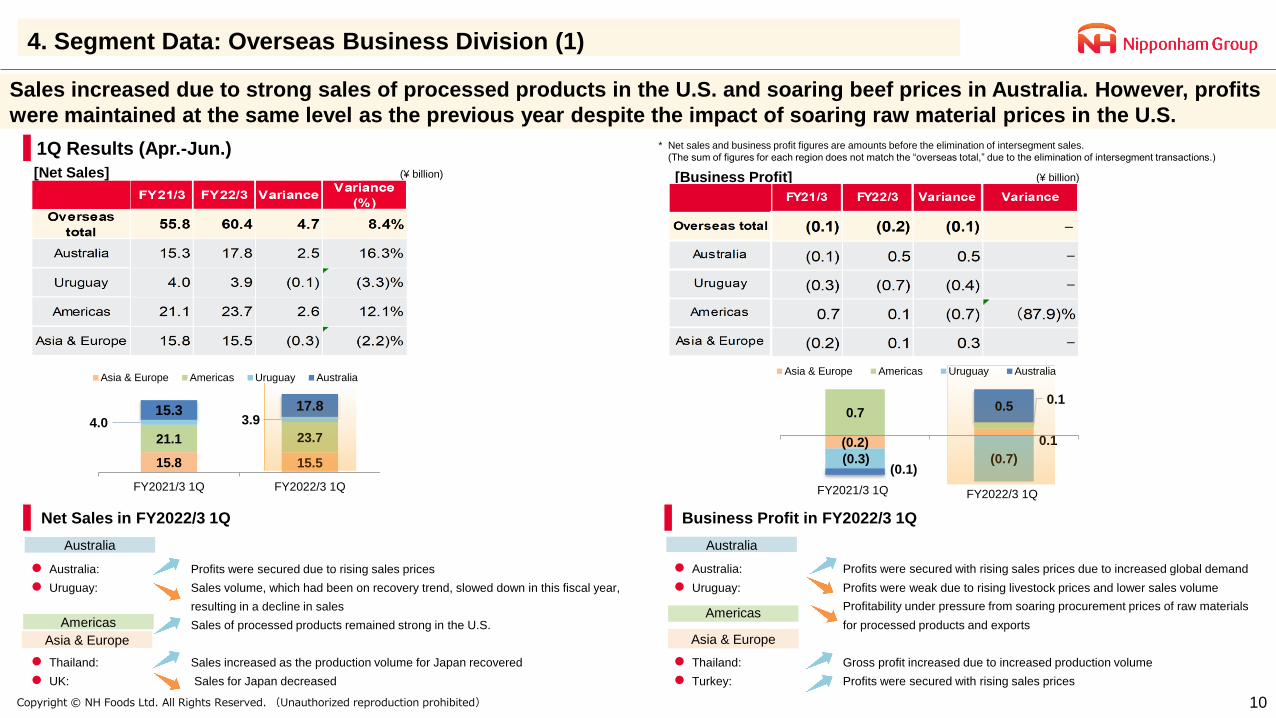
(0.2) 0.1
0.70.1
(0.3) (0.7)(0.1)
0.5
Asia & Europe Americas Uruguay Australia
15.8 15.5
21.1 23.74.0 3.9
15.3 17.8
FY2021/3 1Q FY2022/3 1Q
Asia & Europe Americas Uruguay Australia
Australia: Profits were secured with rising sales prices due to increased global demand
Uruguay: Profits were weak due to rising livestock prices and lower sales volume
Profitability under pressure from soaring procurement prices of raw materials
for processed products and exports
Thailand: Gross profit increased due to increased production volume
Turkey: Profits were secured with rising sales prices
Australia: Profits were secured due to rising sales prices
Uruguay: Sales volume, which had been on recovery trend, slowed down in this fiscal year,
resulting in a decline in sales
Sales of processed products remained strong in the U.S.
Thailand: Sales increased as the production volume for Japan recovered
UK: Sales for Japan decreased
Asia & Europe
Americas
Australia
Net Sales in FY2022/3 1Q Business Profit in FY2022/3 1Q
Australia
Americas
1Q Results (Apr.-Jun.)
(¥ billion) (¥ billion)[Net Sales]
* Net sales and business profit figures are amounts before the elimination of intersegment sales.
(The sum of figures for each region does not match the “overseas total,” due to the elimination of intersegment transactions.)
[Business Profit]
10
4. Segment Data: Overseas Business Division (1)
Asia & Europe
Sales increased due to strong sales of processed products in the U.S. and soaring beef prices in Australia. However, profits
were maintained at the same level as the previous year despite the impact of soaring raw material prices in the U.S.
FY2021/3 1Q FY2022/3 1Q

Copyright © NH Foods Ltd. All Rights Reserved. (Unauthorized reproduction prohibited)
(0.2)
(0.4)
(0.7)
0.3
0.5
(0.1)
[Australia] ¥0.5 billion
Procurement: Livestock costs were further raised
Sales: Sales prices soared due to short supply
⇨ Profits were secured thanks to rising sales prices
[Uruguay] ¥(0.4) billion
Procurement: Argentina's suspension of beef exports to overseas
raised Uruguay's cattle price
Sales: Sales volume declined due to the embargo on China
⇨ Lower than last year due to raised procurement costs and
declined gross profit
(* Export to China resumed in July.)
[Americas] ¥(0.7) billion
Fresh meat prices soared in the U.S. due to rising feed prices
⇨ Profitability under pressure due to rising procurement prices of
pork for Japan and high production costs of processed chicken in
the U.S.
[Asia & Europe] ¥0.3 billion
Thailand: Exports of processed products to Japan recovered along
with a modest upswing in demand in Japan
⇨ Gross profit was secured, leading to improved profitability
Turkey: Increase in unit sales prices offset higher feed prices,
which secured profits
* Due to rounding, numbers may not match totals.
(¥ billion)
Factor Analysis: Changes in business profit
Factor Analysis Graph: Changes in business profit results (full year)
Variation Factor Analysis (1Q)
(¥ billion)
Positive
factors
0.7
Negative
factors
(1.1)
11
4. Segment Data: Overseas Business Division (2)
FY2022/3
1Q
results
Australia 0.5
Uruguay (0.4)
Americas (0.7)
Asia & Europe 0.3
Others 0.0
Total (0.1)
FY2021/3 full year results
Australia
Asia & Europe
Americas
Uruguay
FY2022/3 full year results

Copyright © NH Foods Ltd. All Rights Reserved. (Unauthorized reproduction prohibited)
(¥ billion)
* Net sales figures represent net sales to external customers. (¥ billion)
12
5. External Customer Net Sales Results in Major Overseas Geographical Areas
FY2021/3 FY2022/3
1Q 2Q 3Q 4Q Full year 1Q
Australia 11.9 12.8 13.4 11.1 49.2 15.1
Uruguay 3.9 4.9 5.6 5.0 19.4 3.3
Americas 4.8 5.4 5.0 5.1 20.3 6.0
Asia & Europe 5.6 5.5 5.8 6.4 23.3 6.5
Overseas total 26.2 28.6 29.8 27.5 122.2 30.9
Overseas sales ratio 9.37% 9.72% 9.06% 10.07% 9.54% 10.47%
11.912.8 13.4
11.1
15.1
3.94.9
5.6 5.0
3.34.8 5.4 5.0 5.1
6.05.6 5.5 5.8 6.4 6.5
9.37% 9.72%9.06%
10.07%10.47%
0%
2%
4%
6%
8%
10%
12%
0.0
5.0
10.0
15.0
20.0
1Q 2Q 3Q 4Q 1Q
FY2021/3 FY2022/3
Australia Uruguay Americas Asia & Europe Overseas sales ratio

Copyright © NH Foods Ltd. All Rights Reserved. (Unauthorized reproduction prohibited)
FY2019/3 FY2020/3 FY2021/3
Before
retrospective
adjustment
After retrospective
adjustmentVariance
Before
retrospective
adjustment
After
retrospective
adjustment
Variance
Before
retrospective
adjustment
After retrospective
adjustmentVariance
Processed Foods
Business Division
Net sales
(¥ billion) 545.4 512.3 (33.1) 532.3 498.8 (33.5) 523.9 489.4 (34.5)
Business profit
(¥ billion) 9.5 9.6 0.1 13.3 13.4 0.1 17.9 18.0 0.1
Business profit
ratio 1.7% 1.9% 0.2 2.5% 2.7% 0 3.4% 3.7% 0.3
Fresh Meats
Business Division
Net sales
(¥ billion) 741.5 673.0 (68.5) 755.5 685.6 (69.9) 728.7 656.7 (72.0)
Business profit
(¥ billion) 34.5 34.6 0.1 31.9 32.0 0.1 41.1 41.2 0.1
Business profit
ratio 4.7% 5.1% 0.4 4.2% 4.7% 0.4 5.6% 6.3% 0.7
Overseas
Business Division
Net sales
(¥ billion) 255.2 254.8 (0.4) 255.0 254.6 (0.4) 223.9 223.6 (0.3)
Business profit
(¥ billion) (3.8) (3.8) 0 1.8 1.9 0.1 (0.1) (0.1) 0.0
Business profit
ratio - - - 0.7% 0.7% 0 ‐ ‐ -
Others
Net sales
(¥ billion) 17.4 17.2 (0.2) 16.8 16.6 (0.2) 11.8 11.8 0
Business profit
(¥ billion) 1.0 1.0 0 0.6 0.6 0.0 (1.8) (1.8) 0
Business profit
ratio 5.7% 5.7% 0 3.3% 3.4% 0.1 ‐ ‐ -
Eliminations and
adjustments
Net sales
(¥ billion) (325.3) (223.1) 102.2 (329.7) (225.8) 103.9 (312.2) (205.3) 106.9
Business profit
(¥ billion) (2.9) (3.1) (0.2) (3.8) (4.0) (0.2) (4.7) (4.9) (0.2)
Company total
Net sales
(¥ billion) 1,234.2 1,234.2 0 1,229.8 1,229.8 0.0 1,176.1 1,176.1 0
Business profit
(¥ billion) 38.3 38.3 0 43.8 43.8 0.0 52.4 52.4 0
Business profit
ratio 3.1% 3.1% 0 3.60% 3.60% 0.0 4.5% 4.50% 0
13
6. Retrospective Adjustment on Medium-Term Management Plan 2020

Copyright © NH Foods Ltd. All Rights Reserved. (Unauthorized reproduction prohibited)
P.15
14
I: Consolidated Business Results for
FY2021/3
II: Outlook for FY2022/3
III: Consolidated Financial Results for
FY2021/3
P. 20
I: Consolidated Business Results for
FY2022/3 1QP.4
1. FY2022/3 Business Profit Forecasts
2. Processed Foods Business Division: Outlook
3. Fresh Meats Business Division: Outlook
4. Overseas Business Division: Outlook
II: Outlook for FY2022/3 P.15
III: Consolidated Financial Results for
FY2022/3 1QP.21
1. FY2021/3 Business Results at a Glance and FY2022/3 Forecasts
2. Balance Sheets / Capital Expenditures / Depreciation and
Amortization
3. Cash Flows
1. Consolidated Business Results for 1Q (Apr.-Jun.)
2. Segment Data: Processed Foods Business Division
3. Segment Data: Fresh Meats Business Division
4. Segment Data: Overseas Business Division
5. External Customer Net Sales Results in Major Overseas
Geographical Areas
6. Retrospective Adjustment on Medium-Term Management Plan 2020

Copyright © NH Foods Ltd. All Rights Reserved. (Unauthorized reproduction prohibited)
24.0
281
30.5
0.3
(0.5)
0.3
(4.0)
(2.5)
FY2022/3 2nd halfforecasts
Eliminations, adjustmentsand others
Others
Overseas BusinessDivision
Fresh Meats BusinessDivision
Processed FoodsBusiness Division
FY2021/3 2nd half results
(¥ billion)
24.0
214
21.9
1.3
1.1
0.4
(0.2)
(0.5)
FY2022/3 1st halfforecasts
Eliminations, adjustmentsand others
Others
Overseas BusinessDivision
Fresh Meats BusinessDivision
Processed FoodsBusiness Division
FY2021/3 1st half results
48.0
494
52.4
1.6
0.6
0.6
(4.2)
(3.0)
FY2022/3 Full yearforecasts
Eliminations,adjustments and others
Others
Overseas BusinessDivision
Fresh Meats BusinessDivision
Processed FoodsBusiness Division
FY2021/3 Full yearresults
Changes in 1st half forecasts Changes in 2nd half forecasts Changes in full year forecasts
(¥ billion)
15
1. FY2022/3 Business Profit Forecasts
(¥ billion) (¥ billion)
6.5 6.0 (0.5) 11.5 9.1 (2.5) 18.0 15.0 (3.0)
18.3 18.1 (0.2) 23.0 18.9 (4.0) 41.2 37.0 (4.2)
0.5 0.9 0.4 (0.6) (0.4) 0.3 (0.1) 0.5 0.6
(0.4) 0.8 1.1 (1.4) (2.0) (0.5) (1.8) (1.2) 0.6
(2.9) (1.6) 1.3 (2.0) (1.7) 0.3 (4.9) (3.3) 1.6
21.9 24.0 2.1 30.5 24.0 (6.5) 52.4 48.0 (4.4)Total
Processed Foods Business Division
Fresh Meats Business Division
Overseas Business Division
Eliminations, adjustments and others
Others
FY2022/3 1st half FY2022/3 2nd half FY2022/3 Full year
Forecasts Variance Forecasts Variance Forecasts VarianceFY2021/3 1st
half results
FY2021/3
2nd half
results
FY2021/3
Full year
results
(Note) Profit for FY2022/3 Full year includes ¥5.0 billion of DX-related costs.

Copyright © NH Foods Ltd. All Rights Reserved. (Unauthorized reproduction prohibited)
(¥ billion)
16
1. FY2022/3 Business Profit Forecasts (2)
(Note) Profit for FY2022/3 Full year includes ¥5.0 billion of DX-related costs.
Changes from initial business profit forecasts
FY2022/3
1Q
FY2022/3
2QFY2022/3 1st half FY2022/3 2nd half FY2022/3 Full year
Results ForecastsInitial
forecastsForecasts Variance
Initial
forecastsForecasts Variance
Initial
forecastsForecasts Variance
Processed Foods Business Division 3.3 2.6 6.0 6.0 0.0 9.1 9.1 0.0 15.0 15.0 0.0
Fresh Meats Business Division 9.5 8.5 18.1 18.1 0.0 18.9 18.9 0.0 37.0 37.0 0.0
Overseas Business Division (0.2) 1.1 0.9 0.9 0.0 (0.4) (0.4) 0.0 0.5 0.5 0.0
Others 0.4 0.4 1.5 0.8 (0.7) (2.0) (2.0) 0.0 (0.5) (1.2) (0.7)
Eliminations, adjustments and
others(0.6) (1.1) (2.3) (1.6) 0.7 (1.7) (1.7) 0.0 (4.0) (3.3) 0.7
Total 12.4 11.6 24.0 24.0 0.0 24.0 24.0 0.0 48.0 48.0 0

Copyright © NH Foods Ltd. All Rights Reserved. (Unauthorized reproduction prohibited)
Efforts in marine/dairy products and extract/primary processing
- Marine products
- Further strengthen sales of high profit products such as sushi-toppings for volume retailers and
restaurant channels
- Dairy products
- Expand sales of Vanilla Yogurt and establish a market for Ísey SKYR
- Strengthen the development and proposal of raclette cheese and other high-value-added products
- Extract/primary processing
- Expand the market through the launch of new shelf-stable extract products and generate synergies by
introducing menus through the Group’s sales channels.
Business profit forecast for FY2022/3: ¥15.0 billion
17
Channel Full year forecast
Hams and sausages
Consumer 99%
Commercial-use 104%
Total 100%
Deli and processed
foods
Consumer 100%
Commercial-use 106%
Total 102%
Net sales forecasts by channel (year-on-year comparison)
Ham
s a
nd
sau
sag
es
CategoryFull year
forecast
Deli a
nd
pro
cessed
foo
ds
CategoryFull year
forecast
Wieners 99% Chilled bakery 103%
Loin hams 100% Chilled dish 98%
Bacons 94% Fried chicken 102%
Yakibutas 99% Hamburg and meatball 101%
Total 99% Total 100%
Net sales forecasts of consumer products (year-on-year comparison)
Efforts in hams and sausages and deli and processed foods businesses
- Products for consumer channels
- Expand sales of core brands and strengthen new product development to meet new demand
- Develop shelf-stable products to reduce food loss as well as to develop new sales channels, and soy
meat and the likes to offer a new option for protein
- Products for commercial-use channels
- Strengthen proposals for growth channels and create synergies in sales channels and materials by
leveraging the Group’s network
- Differentiate our brand by developing high-value-added products
2. Processed Foods Business Division: Outlook
2Q 1st half Full year
ForecastsInitial
forecastsForecasts Variance
Initial
forecastsForecasts Variance
Hams and sausages, deli and
processed foods(0.4) (0.7) (0.7) 0 (2.2) (2.2) 0
External factors (0.3) 0 0 0 (2.0) (2.0) 0
Principal raw
material price0.2 0.4 0.4 0 (0.9) (0.9) 0
Other materials/
fuels(0.4) (0.4) (0.4) 0 (1.1) (1.1) 0
Internal factors (0.2) (0.7) (0.7) 0 (0.1) (0.1) 0
Volume expansion 0 0 0 0 0.1 0.1 0
Improvement
activities(0.2) (0.7) (0.7) 0 (0.2) (0.2) 0
Vendor and logistics 0.5 0.8 0.8 0 1 (1.0) 0
Marine/dairy products and
extract/primary processing(0.2) 0.7 0.7 0 0.8 0.8 0
DX Costs (1.0) (1.3) (1.3) 0 (2.7) (2.7) 0
Total (1.1) (0.5) (0.5) 0 (3.0) (3.0) 0
Factor Analysis: Changes in profit forecasts

Copyright © NH Foods Ltd. All Rights Reserved. (Unauthorized reproduction prohibited)
380
430
480
530
Apr. May Jun. Jul. Aug. Sep. Oct. Nov. Dec. Jan. Feb. Mar.
FY2020/3 FY2021/3 FY2022/3
Market:
Domestic production of fresh meat is expected to be significantly affected by feed prices
The market is expected to be slightly weaker than last year, which saw higher prices, though pork production is expected to
be slightly lower compared to last year
Market prices for chicken are expected to remain unchanged from last year due to on-going high demand for home meals
(The Company’s efforts)
Chicken and pork productions: Improve production indicators at farms and processing plants to expand production volume
Sales: Secure profits by expanding sales, especially of our own brands
The Company’s forecasts
[Pork market price]“Excellent” pork average of three markets (Tokyo, Saitama, Yokohama)
18
Market: Procurement prices are expected to rise due to rising global demand and commodity prices
(The Company’s efforts)
Beef: Further strengthen procurement from Uruguay and EU, our new suppliers
Pork: Enhance cooperation with existing suppliers amid the unstable supply situation due to increased global demand
Chicken: Ensure stable procurement while keeping a close eye on the external environment amid a sense of future high prices due
to rising grain prices
[Chicken market price]Based on weighted average for chicken market: Simple average unit price taken
from Shokuhin Sangyo Shimbunsha’s Daily meat & livestock.
3. Fresh Meats Business Division: Outlook
Business profit forecast for FY2022/3: ¥37.0 billion
The Company’s forecasts
Fresh meats sales (Nippon Food Group)
Domestic fresh meat market
Imported fresh meat market
FY2022/3 1Q Sales results of four Nippon
Food Group companies
Overall volume growth of 101%
96%
112%103% 102%
119%
50%
70%
90%
110%
Volumeretailers
Fresh meatdistributors
Manufacturing Fresh meatretail
Restaurants
2Q 1st half Full year
ForecastsInitial
forecastsForecasts Variance
Initial
forecastsForecasts Variance
Imported fresh meat
market0.6 0.8 2.5 1.7 0.2 1.8 1.7
Domestic fresh
meat market0.1 0.7 0.4 (0.2) (0.2) (0.5) (0.2)
Farming operation
in Japan(0.9) (0.8) (1.4) (0.5) (2.1) (2.6) (0.5)
Nippon Food Group
and logistics
operation
0.0 0.4 (0.6) (0.9) 0.4 (0.5) (0.9)
DX Costs (1.0) (1.3) (1.3) 0.0 (2.5) (2.5) 0.0
Total (1.2) (0.2) (0.2) 0.0 (4.2) (4.2) 0.0
Factor Analysis: Changes in profit forecasts
530
480
430
380
Reinforce the efforts on key channels, such as co-operatives and drugstores.
Develop and propose value-added products to restaurant channels in preparation for
their recovery.
Enhance the effort to make our brand meat standard and regular items in existing stores.
400
500
600
Apr. May Jun. Jul. Aug. Sep. Oct. Nov. Dec. Jan. Feb. Mar.
FY20202/3 FY2021/3 FY2022/3

Copyright © NH Foods Ltd. All Rights Reserved. (Unauthorized reproduction prohibited) 19
4. Overseas Business Division: Outlook
[Asia & Europe Business]
Turkey) Sales prices are expected to remain high➡ Continue efforts to improve productivity and enhance domestic sales
ASEAN) Impact of the spread of COVID-19 is expected to continue➡ Stabilize production volume as recovery in sales volume is not yet expected
[Americas Business]
Processing) Strong sales of processed products are expected with robust domestic consumption. Raw
material costs are expected to remain high.➡ Strive improving productivity and expanding sales of core brands
Export) Procurement prices are expected to continue to rise amid a recovery in global demand➡ Ensure a stable supply to Japan
[Australia Business]
Australia) Rising livestock prices and difficulty in collection will continue➡ Stabilize profits through internal improvement and enhancement of added value with brand meat
Uruguay) Livestock prices are expected to remain high➡ Pursue a recovery of profits by improving operations integrating procurement and sales
➡ Promote an early recovery in exports to China and the expansion of sales channels to other export
destinations, including Japan
Factor Analysis: Changes in business profit forecasts
2Q 1st half Full year
ForecastsInitial
forecastsForecasts Variance
Initial
forecastsForecasts Variance
Australia 0.6 0.2 0.8 0.7 0.4 1.0 0.7
Australia 0.7 (0.2) 1.3 1.5 0.0 1.5 1.5
Uruguay (0.1) 0.4 (0.5) (0.8) 0.3 (0.5) (0.8)
Americas (0.4) (0.5) (1.1) (0.6) (0.8) (1.3) (0.6)
Asia & Europe 0.3 0.7 0.6 (0.1) 1.0 0.9 (0.1)
Others 0.0 0.0 0.0 0 0.0 0.0 0
Total 0.5 0.4 0.4 0.0 0.6 0.6 0.0
(Business profit forecasts)
2Q 1st half Full year
ForecastsInitial
forecastsForecasts Variance
Initial
forecastsForecasts Variance
Australia (0.3) (0.4) 0.2 (0.7) (0.7) 0 0.7
Australia (0.1) (0.2) 1.3 1.5 (0.6) 0.9 1.5
Uruguay (0.2) (0.3) (1.1) (0.8) (0.2) (1.0) (0.8)
Americas 0.7 1.4 0.8 (0.6) 2.0 1.4 (0.6)
Asia & Europe 0.2 0.4 0.3 (0.1) 0.2 0.1 (0.1)
Others (0.2) (0.5) (0.5) 0.0 (1.0) (1.0) 0.0
Total 0.4 0.9 0.9 0.0 0.5 0.5 0.0
[Australia : Eastern Young Cattle Indicator (EYCI) & Trimming 90CL export price for the U.S. ]
600.0
700.0
800.0
900.0
1,000.0EYCI
90CL Export price
for the U.S.
(A¢/kg) 出典:MLA
※Trimming 90CL : Lean 90% beef mainly used for beef patty
※Trimming 90CL for the U.S. :Common indicator of export price for the U.S.

Copyright © NH Foods Ltd. All Rights Reserved. (Unauthorized reproduction prohibited) 20
I: Consolidated Business Results for
FY2021/3
II: Outlook for FY2022/3
III: Consolidated Financial Results for
FY2021/3
P. 20
I: Consolidated Business Results for
FY2022/3 1QP.4
1. FY2022/3 Business Profit Forecasts
2. Processed Foods Business Division: Outlook
3. Fresh Meats Business Division: Outlook
4. Overseas Business Division: Outlook
II: Outlook for FY2022/3 P.15
III: Consolidated Financial Results for
FY2022/3 1QP.21
1. FY2021/3 Business Results at a Glance and FY2022/3 Forecasts
2. Balance Sheets / Capital Expenditures / Depreciation and
Amortization
3. Cash Flows
1. Consolidated Business Results for 1Q (Apr.-Jun.)
2. Segment Data: Processed Foods Business Division
3. Segment Data: Fresh Meats Business Division
4. Segment Data: Overseas Business Division
5. External Customer Net Sales Results in Major Overseas Geographical
Areas
6. Retrospective Adjustment on Medium-Term Management Plan 2020

Copyright © NH Foods Ltd. All Rights Reserved. (Unauthorized reproduction prohibited) 21
(¥ million, %)
1. FY2021/3 Business Results at a Glance and FY2022/3 Forecasts
(1) 279,305 573,484 1,176,101 294,947 5.6 - 580,000 1.1 - 1,180,000 0.3 -
31,704 64,643 132,425 30,791 (2.9) 0.2 64,400 (0.4) (0.4) 132,500 0.1 (0.0)
53,045 108,111 223,585 57,426 8.3 3.6 109,400 1.2 1.0 223,600 0.0 (0.0)
162,267 330,147 672,880 169,224 4.3 (1.1) 333,500 1.0 (1.8) 674,300 0.2 (1.4)
Beef 61,464 127,096 256,999 65,424 6.4 (12.6) 130,200 2.4 (11.5) 260,400 1.3 (6.6)
Pork 56,547 114,515 229,450 54,992 (2.7) 0.4 108,800 (5.0) 0.1 223,600 (2.5) 0.0
Chicken 39,750 78,386 166,222 43,876 10.4 3.8 84,000 7.2 2.3 169,600 2.0 0.2
Other fresh meats 4,506 10,150 20,209 4,932 9.5 20.0 10,500 3.4 2.1 20,700 2.4 1.9
15,842 35,239 76,853 17,497 10.4 5.2 35,600 1.0 0.3 77,300 0.6 0.4
8,000 16,232 31,967 8,631 7.9 0.2 16,300 0.4 0.1 32,100 0.4 0.4
8,447 19,112 38,391 11,378 34.7 - 20,800 8.8 - 40,200 4.7 -
(2) 229,069 469,396 964,367 239,800 4.7 -
50,236 104,088 211,734 55,147 9.8 -
18.0% 18.2% 18.0% 18.7% - -
(3) 38,797 78,191 161,215 40,385 4.1 -
1,069 657 (3,459) (497) - - (1,200) - - (3,250) - -
411 (132) 408 (267) - - (1,300) - - (1,750) - -
116 2,308 1,406 741 538.8 - 500 (78.3) - 1,000 (28.9) -
13,035 28,730 48,874 14,739 13.1 - 24,000 (16.5) - 43,000 (12.0) -
3,972 9,916 17,816 4,743 19.4 - 7,500 (24.4) - 13,500 (24.2) -
30.5% 34.5% 39.2% 32.2% - - 31.3% - - 31.4% - -
9,384 19,476 32,616 9,906 5.6 - 17,000 (12.7) - 30,000 (8.0) -
(4) 11,439 25,897 50,519 14,762 29.0 - 26,000 0.4 - 47,000 (7.0) -
(5) (516) (1,063) (2,581) 607 - - - - - - - -
(6) 2,725 5,037 674 (2,944) - - - - - - - -
9,230 21,923 52,426 12,425 34.6 - 24,000 9.5 - 48,000 (8.4) -
Volume
growth
rate
Variance
(%)
FY2021/3 results FY2022/3 results and forecasts
1Q results1st half
results
Full year
results1Q results
Variance
(%)
1st half
forecasts
Variance
(%)
Full year
forecasts
Volume
growth
rate
Volume
growth
rate
Foreign exchange gains (losses)
Adjustments in accordance with IFRS
and others
Business profit (4)-(5)-(6)
Share of profit (loss) in investments
accounted for using the equity method
Profit before tax
Income tax expense
Tax rate
Profit attributable to owners of parent
Operating income (1)-(2)-(3)
Finance income and costs
Net sales
Hams and sausages
Processed foods
Fresh meats
Gross profit
Gross profit ratio
SG&A expenses
Other income and expenses
Marine products
Dairy products
Others
Cost of goods sold

Copyright © NH Foods Ltd. All Rights Reserved. (Unauthorized reproduction prohibited)
(¥ million, %) Consolidated balance sheets
(¥ million, %) Capital expenditures, depreciation and amortization
Major reasons for increase/decreaseFY2021/3 FY2022/3
Year-end 1Q
825,405 824,388 (0.1) (1,017)
Cash and cash equivalents 83,831 73,901 (11.8) (9,930)
Trade and other receivables 127,067 125,843 (1.0) (1,224)
Inventories 107,906 122,767 13.8 14,861
(1) Property, plant and equipment 325,629 323,384 (0.7) (2,245)
Right-of-use assets 38,362 37,360 (2.6) (1,002)
Other financial assets - non-current 35,796 33,960 (5.1) (1,836)
Deferred tax assets 26,056 25,653 (1.5) (403)
381,096 381,216 0.0 120
Trade and other payables 98,983 106,960 8.1 7,977
(2) Interest-bearing liabilities 193,750 196,459 1.4 2,709
433,595 432,429 (0.3) (1,166)
10,714 10,743 0.3 29
Variance
(%)Variance
Non-controlling interests
Total assets
Total liabilities
Total equity attributable to owners of
parent
(1) Inventories
Increased ¥14.9 billion in fresh meats, mainly
pork and chicken
(2) Interest-bearing liabilities
Increased ¥2.7 billion due to an increase in
short-term bank loan, etc.
22
FY2021/3 FY2022/3
1Q 1Q Variance (%) Variance Full year forecasts
10,547 8,276 (21.5) (2,271) 81,700
Processed Foods
Business Division4,388 3,102 (29.3) (1,286) 17,200
Fresh Meats
Business Division1,663 1,420 (14.6) (243) 26,000
Overseas Business
Division1,186 1,039 (12.4) (147) 7,000
Others 3,290 2,715 (17.5) (575) 31,500
8,388 8,925 6.4 537 34,600Depreciation and
amortization
Capital expenditures
FY2022/3
2. Balance Sheets / Capital Expenditures / Depreciation and Amortization

Copyright © NH Foods Ltd. All Rights Reserved. (Unauthorized reproduction prohibited)
Consolidated statements of cash flows(¥ million)
Major reasons for increase/decrease
FY2021/3 FY2022/3
1Q results 1Q results VarianceFull year
forecasts
(1)Cash flows from operating
activities18,053 12,554 (5,499) 76,100
(2)Cash flows from investing
activities(13,712) (14,771) (1,059) (65,200)
(3)Cash flows from financing
activities(14,628) (7,649) 6,979 (26,300)
FY2022/3
(1) Cash flow from operating activities
With regard to operating activities, the increase in inventories amounted to ¥14,981 million, and income tax paid amounted to ¥9,960
million, while profit before tax amounted to ¥14,739 million, depreciation and amortization expense amounted to ¥8,949 million, and
the increase in trade and other payables amounted to ¥8,105 million. As a result, net cash provided by operating activities amounted
to ¥12,554 million.
(2) Cash flows from investing activities
With regard to investing activities, acquisition of fixed assets amounted to ¥14,747 million. As a result, net cash used in investing
activities amounted to ¥14,771 million.
(3) Cash flows from financing activities
With regard to financing activities, increase in short-term bank loans amounted to ¥5,069 million, and proceeds from debt amounted
to ¥8,843 million, while cash dividends amounted to ¥9,610 million, and repayments of debt amounted to ¥11,976 million. As a result,
net cash used in financing activities amounted to ¥7,649 million.
23
3. Cash Flows

Copyright © NH Foods Ltd. All Rights Reserved. (Unauthorized reproduction prohibited)
Contact
Public & Investor Relations Department
NH Foods Ltd.
ThinkParkTower
2-1-1 Osaki, Shinagawa-ku, Tokyo 141-6013
Tel: +81-3-4555-8024
Forward-looking statementsThis presentation includes forecasts regarding targets, strategies and earnings. These
forecasts are based on information available at the current time and contain certain
assumptions about the future. They are subject to numerous external uncertainties in
areas such as economic environment, market trends and exchange rates. Actual
performance may differ significantly from the targets in this presentation, and
investment decisions should not be based exclusively on them.
24