business review-q3-fy-13
TRANSCRIPT

1
Q3 FY 13 BUSINESS REVIEW
Contact: [email protected] Mr. Vijay B Somaiya Ms. Namrata Divekar Mr. Prakash Pandey Head (Treasury & IR) AGM (Treasury & IR) Sr. Manager (Treasury & IR) Phone: 91-22-6665 7258 Phone: 91-22-6665 7817 Phone: 91-22-6665 7908 Mr. Bikash Dugar Ms. Ashwini Menon Manager (Treasury & IR) Manager (Treasury & IR) Phone: 91-22-6665 7241 Phone: 91-22-6665 7322

2
Index I] Snapshot of Financials 3
II] Indian Economic Scenario
5
III] TML Standalone
A] Financials (Rs. Crores & USD Million)
11
B] Commercial Vehicles Business
13
C] Passenger Vehicles Business
14
D] Exports
15
E] Way Forward
16
F] Other Significant Events during the Quarter
17
G] TML Corporate Credit Rating
17
IV] TML Consolidated Financials (Unaudited) (Rs. Crores & USD Million)
18
V] Jaguar Land Rover PLC
A] Financials (i) Under IFRS - Unaudited (ii) Under IGAAP - Unaudited
20 21
B] Products, Regional Performance & Highlights
� Jaguar and Land Rover Wholesale & Retails volumes by Car-line and Region-wise 21
� Regional Performance
25
� JLR Highlights
26
C] Way Forward
27
D] JLR Corporate Credit Rating
27 VI] Highlights of Key Subsidiaries
A] Tata Motors Finance
28
B] Tata Technologies
28
C] Tata Daewoo
29
D]TML Drivelines Ltd
29
VII] Shareholding Pattern
30

3
I] SNAPSHOT OF FINANCIALS
Particulars NET REVENUE * PAT
Q3 FY13 Q3 FY12 Y-o-Y change Q3 FY13 Q3 FY12 Y-o-Y
change TML Consolidated (Rs Crores)# 46,089.5 45,260.3 1.8% 1,627.5 3,405.6 -52.2%
TML Standalone (Rs Crores) 10,630.1 13,337.9 -20.3% (458.5) 173.7 NM
Jaguar LandRover PLC (IFRS) (GBP Million) 3,803.6 3,749.1 1.5% 296.1 393.2 -24.7%
Tata Motors Finance Ltd. (TMFL) (Rs Crores) 784.1 545.7 43.7% 84.3 70.6 19.4%
Tata Technologies Ltd. Consolidated (TTL) (Rs Crores)
535.6 440.2 21.7% 75.2 58.2 29.2%
Tata Daewoo, Korea (TDCV) (KRW Billion) 175.2 158.7 10.4% 0.6 (0.2) NM
TML Drivelines Ltd. (Rs Crores) 89.2 174.3 -48.8% 11.9 60.8 -80.4%
Particulars NET REVENUE * PAT
9M FY13 9M FY12 Y-o-Y change 9M FY13 9M FY12 Y-o-Y
change TML Consolidated (Rs Crores)# 132,816.0 114,746.6 15.7% 5,947.1 7,282.5 -18.3%
TML Standalone (Rs Crores) 33,697.9 37,915.8 -11.1% 614.0 677.0 -9.3%
Jaguar LandRover PLC (IFRS) (GBP Million) 10,730.1 9,367.5 14.5% 837.2 785.2 6.6%
Tata Motors Finance Ltd. (TMFL) (Rs Crores) 2,111.3 1,474.8 43.2% 225.8 171.5 31.7%
Tata Technologies Ltd. Consolidated (TTL) (Rs Crores) 1,462.5 1,154.5 26.7% 218.5 146.2 49.5%
Tata Daewoo, Korea (TDCV) (KRW Billion) 597.5 585.1 2.1% 4.9 4.2 16.2%
TML Drivelines Ltd. (Rs Crores) 311.9 508.3 -38.6% 68.3 173.0 -60.5%
* Net Revenue excludes other income except for Tata Motors Finance Ltd.;
# PAT is after Minority Interest and share of Profit/(loss) in respect of associate companies
Back to Index

4
SNAPSHOT OF FINANCIALS contd.
USD Million@
Particulars NET REVENUE * PAT
Q3 FY13 Q3 FY12 Y-o-Y change Q3 FY13 Q3 FY12 Y-o-Y
change
TML Consolidated# 8,380.7 8,229.9 1.8% 295.9 619.2 -52.2%
TML Standalone 1,932.9 2,425.3 -20.3% (83.4) 31.6 NM
Jaguar LandRover PLC 6,177.8 6,089.3 1.5% 480.9 638.6 -24.7%
Tata Motors Finance Ltd. (TMFL) 142.6 99.2 43.7% 15.3 12.8 19.4%
Tata Technologies Ltd. Consolidated (TTL) 97.4 80.0 21.7% 13.7 10.6 29.2%
Tata Daewoo, Korea (TDCV) 164.6 149.1 10.4% 0.6 (0.2) NM
TML Drivelines Ltd. 16.2 31.7 -48.8% 2.2 11.1 -80.4%
USD Million@
Particulars
NET REVENUE * PAT
9M FY13 9M FY12 Y-o-Y change 9M FY13 9M FY12 Y-o-Y
change
TML Consolidated# 24,150.6 20,864.9 15.7% 1,081.4 1,324.2 -18.3%
TML Standalone 6,127.5 6,894.4 -11.1% 111.6 123.1 -9.3%
Jaguar LandRover PLC 17,427.8 15,214.7 14.5% 1,359.8 1,275.3 6.6%
Tata Motors Finance Ltd. (TMFL) 383.9 268.2 43.2% 41.1 31.2 31.7%
Tata Technologies Ltd. Consolidated (TTL) 265.9 209.9 26.7% 39.7 26.6 49.5%
Tata Daewoo, Korea (TDCV) 561.3 549.7 2.1% 4.6 3.9 16.2%
TML Drivelines Ltd. 56.7 92.4 -38.6% 12.4 31.5 -60.5%
*Net Revenue excludes other income except for Tata Motors Finance Ltd.; # PAT is after Minority Interest and share of Profit/(loss) in respect of associate companies;
@ At conversion rate of 1 USD = 54.995 INR; 1 GBP = 1.6242 USD; 1 USD = 1064.4 KRW for reference only
Back to Index

5
II] INDIAN ECONOMIC SCENARIO: KEY HIGHLIGHTS OF Q3FY13 Source: Tata Department of Economics and Statistics (Tata DES) 1. GDP Growth
India’s real GDP has grown by 5.4% in the fiscal year so far (H1 2012-13). Growth for FY 2011-12 stood at 6.5% as compared to 8.4% in the previous two financial years and lower than 6.8% during the crisis year FY 2008-09. Quarter-wise it grew by 5.3% in Q2 2012-13 (Jul-Sep’12), as compared to 5.5% in Q1 2012-13 and 6.7% in Q2 2011-12. GDP growth in 2012-13 is expected to be around 5.5 to 5.7%, compared to 6.5% in 2011-12.
Investment activity remained subdued in Q2 2012-13, as Gross Fixed Capital Formation grew by 2.3%, as compared to 9.7% growth in Q2 2011-12. Gross Fixed Capital Formation accounted for 30.3% of GDP at current market prices in H1 2012-13, as compared to 31.0% in H1 2011-12 and (it was 45.7% in China during 2011). Despite the weakness in investment activity, especially in the industrial sector, growth has not weakened severely because of relatively low share of fixed investment in total GDP: consumption spending (public + private) remained the largest component of India’s GDP at 68.8% in H1 2012-13, as compared to 67.8% in H1 2011-12. 2. Industrial Growth
During 2012-13 (April-December), IIP growth stood at 0.76% as compared to 3.72% growth in Apr-Dec’12. The latest growth figures so far indicate that there is no evidence of an industrial sector and overall economic recovery. A look at the growth of the 12-monthly moving average of the IIP highlights the continuous and sustained decline in industrial momentum. Industrial production unexpectedly shrank for a second straight month in December 2012, weighed down by weak investment and consumer demand.
Chart 1: Sectoral Growth Rates of GDP (%, y-o-y, 2004-05 prices)
Source: MoSPI
Back to Index

6
Back to Index
In terms of sectoral classification of industries, output of manufacturing grew 0.68% in Apr-Dec’12, while mining output declined 1.87% and electricity generation showed growth of 4.54%. In terms of use-based classification of industries, consumer goods production grew sluggish by 2.61% in Apr-Dec’12, as compared to 5.66% growth in the corresponding period of previous year indicating
that consumer demand remains tepid. Growth of consumer durables production stood much lower at 3.70% (5.16% in Apr-Dec’11) because of a y/y 8.2% drop in Dec’12. Decline in consumer durables production indicates that consumption demand is not picking up as high inflation has affected the purchasing power. Consequently, industrial growth is also slowing down. Production of capital goods declined by 10.06%, along with a decline of 5.41% in the import of capital goods (project goods + machinery) in Apr-Dec’12 as a result of the downturn in the investment cycle. Import of project goods alone declined by 15.38% in Apr-Dec’12 period. Policy measures by the government to boost economic activity (especially encouraging and facilitating new investments in infrastructure), combined with monetary easing by the RBI in Jan’13 could build the base for an industrial sector recovery in FY 2013-14. 3. Infrastructure Index
The Eight core
infrastructure industries1
with base as 2004-05
registered an output growth of 2.63% in Dec’12, lower than 4.92%
growth witnessed in Dec’11. For the Apr-Dec 2012-13 period, the
eight core industries recorded 3.34% growth against 4.79% during the corresponding period in 2011. The slow growth was on account of decline in the output of natural gas (-13.32%; -8.78% in Apr-Dec 2011-12), fertilizers (-3.39%; -0.53% in Apr-Dec 2011-12) and crude oil (-0.36%; 1.88% in Apr-Dec 2011-12). Growth
1 Coal, Crude Oil, Natural Gas, Petroleum Refinery Products, Fertilizers, Steel, Cement, and Electricity
Performance of Core industries Sector-wise Growth Rate (%) in Production
Sector Weight (%) Dec’12 Dec’11 Apr-Dec 2012-13
Apr-Dec 2011-12
Overall Index 37.903 2.63 4.92 3.34 4.79
Coal 4.379 -0.17 5.50 5.67 -2.69 Crude Oil 5.216 1.04 -5.63 -0.36 1.88 Natural Gas 1.708 -14.86 -10.80 -13.32 -8.78 Refinery Products 5.939 4.96 0.66 6.94 3.96
Fertilizers 1.254 -3.84 0.79 -3.39 -0.53 Steel 6.684 5.21 10.18 3.61 9.07 Cement 2.406 3.92 13.60 6.08 5.78 Electricity 10.316 4.40 8.88 4.55 9.31 (Source: GOI- MINISTRY OF COMMERCE INDUSTRY)
IIP and its categories
Categories Apr-Dec’12 Apr-Dec’11 Growth (%)
IIP General 168.24 166.98 0.76
Sectoral Mining 122.00 124.32 -1.87 Mfg. 178.69 177.49 0.68 Electricity 155.27 148.52 4.54 Use-based Basic 151.43 147.38 2.75 Capital 238.00 264.63 -10.06 Intermediate 145.06 142.84 1.55 Consumer 185.53 180.81 2.61
-Consumer Durables 303.00 292.19 3.70
-Consumer Non-Durables 138.98 136.68 1.68
Source: CSO
7
of coal production improved to 5.67% during 2012-13 (Apr-Dec) as compared to de-growth of -2.69% witnessed in the same period of previous year. Growth in electricity generation posted a lower growth of 4.55% during Apr-Dec 2012-13 as compared to 9.31% growth during Apr-Dec 2011-12. Growth in electricity production has been on a declining trajectory since 2011 due to problems in securing coal supply for domestic producers, combined with the financial problems of State Electricity Boards (SEBs) which are presently the largest purchasers of power. The subdued growth of the core industries has remained a hindrance on industrial production. Policy uncertainties in areas such as iron ore and coal mining have adversely affected the output of steel and power industries.
4. Inflation
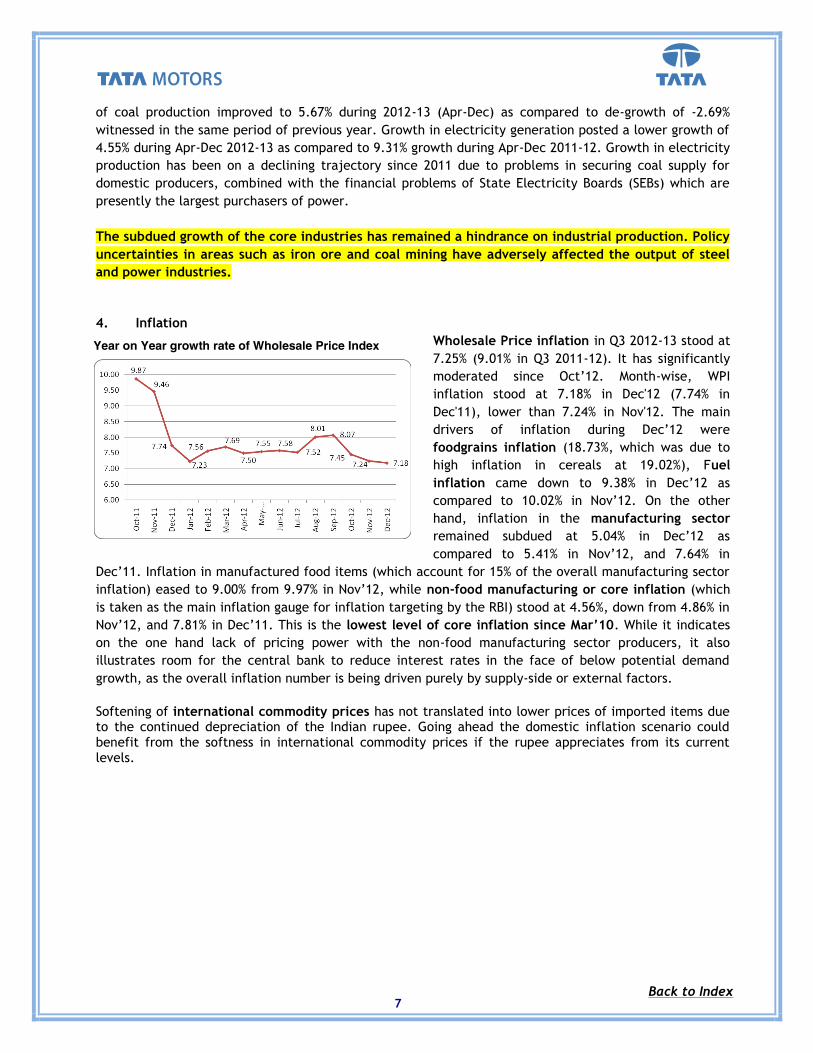
Wholesale Price inflation in Q3 2012-13 stood at 7.25% (9.01% in Q3 2011-12). It has significantly moderated since Oct’12. Month-wise, WPI inflation stood at 7.18% in Dec'12 (7.74% in Dec'11), lower than 7.24% in Nov'12. The main drivers of inflation during Dec’12 were foodgrains inflation (18.73%, which was due to high inflation in cereals at 19.02%), Fuel inflation came down to 9.38% in Dec’12 as compared to 10.02% in Nov’12. On the other hand, inflation in the manufacturing sector remained subdued at 5.04% in Dec’12 as compared to 5.41% in Nov’12, and 7.64% in
Dec’11. Inflation in manufactured food items (which account for 15% of the overall manufacturing sector inflation) eased to 9.00% from 9.97% in Nov’12, while non-food manufacturing or core inflation (which is taken as the main inflation gauge for inflation targeting by the RBI) stood at 4.56%, down from 4.86% in Nov’12, and 7.81% in Dec’11. This is the lowest level of core inflation since Mar’10. While it indicates on the one hand lack of pricing power with the non-food manufacturing sector producers, it also illustrates room for the central bank to reduce interest rates in the face of below potential demand growth, as the overall inflation number is being driven purely by supply-side or external factors. Softening of international commodity prices has not translated into lower prices of imported items due to the continued depreciation of the Indian rupee. Going ahead the domestic inflation scenario could benefit from the softness in international commodity prices if the rupee appreciates from its current levels.
Year on Year growth rate of Wholesale Price Index
Back to Index

8
Back to Index
5. Interest rates
RBI again maintained its status quo on repo rate in its mid-quarter review of the monetary policy announced on 18th Dec’12. This firm stance taken by RBI was a bit disappointing in a situation when the economic growth still struggling to pick up while headline inflation moderating. However, with inflation showing signs of easing and some fiscal correction measures already taken, it was now pertinent for RBI to revive the business confidence by announcing suitable policy actions which is in line with fiscal policy.
RBI in the third quarter review of the monetary policy announced on 29th Jan’13 decided to bring down the policy repo rate by 25 basis points from 8.00% to 7.75%. Consequently, the reverse repo rate would now stand at 6.75% from 7.00% earlier. To inject liquidity into the system, RBI further reduced the CRR by 25 basis points from 4.25% to 4.00%. Thus, the third quarter review of the monetary policy is driven by three main considerations as follows:
� first, to provide an appropriate interest rate environment to support growth as inflation risks moderate;
� second, to contain inflation and anchor inflation expectations; and � third, to continue to manage liquidity to ensure adequate flow of credit to the productive
sectors of the economy.
6. Freight Rates
Movement in Key Policy Rates (%) Reverse Repo Rate Repo Rate Cash Reserve Ratio
19-Mar-10 3.50 (+0.25) 5.00 (+0.25) 5.75 2010-11 5.75(+2.25) 6.75(+1.75) 6(+0.25)
03-May-11 6.25(+0.5) 7.25(+0.5) 6 16-Jun-11 6.50(+0.25) 7.50(+0.25) 6 26-July-11 7.00(+0.50) 8.00(+0.50) 6 16-Sept-11 7.25(+0.25) 8.25(+0.25) 6.00
25-Oct-2011 7.50(+0.25) 8.50(+0.25) 6.00 16-Dec-2011 7.50(0.00) 8.50(0.00) 6.00 24-Jan-2012 7.50(0.00) 8.50(0.00) 5.50(-0.50) 10-Mar-2012 7.50(0.00) 8.50 (0.00) 4.75 (-0.75) 17-04-2012 7.00 (-0.50) 8.00 (-0.50) 4.75 18-06-2012 7.00 (0.00) 8.00 (0.00) 4.75 (0.00) 31-07-2012 7.00 (0.00) 8.00 (0.00) 4.75 (0.00) 17-09-2012 7.00 (0.00) 8.00 (0.00) 4.50 (-0.25) 30-10-2012 7.00 (0.00) 8.00 (0.00) 4.25 (-0.25) 18-12-2012 7.00 (0.00) 8.00 (0.00) 4.25 (0.00) 29-01-2013 6.75 (-0.25) 7.75 (-0.25) 4.00 (-0.25) Cumulative +350 bps +300 bps -125 bps
Note: 1. Reverse Repo indicates absorption of liquidity and repo indicates injection of liquidity. 2. Figures in parantheses indicate change in policy rates in per cent.
Back to Index

9
Average road freight rate index for Q3 (Oct-Dec) 2012-13 grew by 1.28% on a y/y basis, higher than 0.70% growth in Q3 of 2011-12. Freight movement has a direct link to the sales of medium and heavy commercial vehicles (M&HCVs). The three major road corridors in the country witnessed a 3% average fall in freight rates in the calendar year 2012, pointing to sluggish demand in goods transport that led to an over 20% dip in truck sales for the period. The freight rates (per 9 tonnes) in the Delhi-Mumbai sector dipped 8%; Delhi-Kolkata was down by 2% and Delhi-Chennai by 3% in 2012. Muted industrial activity and delay in agricultural output are seen as the reasons behind the fall in rates. Truckers were unable to raise freight rates in tandem with the increase in the price of diesel in the year as industrial activity remained muted. However, the partial deregulation of diesel prices by the government is expected would lead to a moderate upward movement in freight rates in the short term. Profitability of truck operators would depend on the performance of sectors like cement, steel and agricultural products. Overall, the current fiscal year has not been good for the transportation industry with truck rentals falling as economic activity has been sluggish.
7. National Highway Development Project (NHDP)
As elucidated in the table below, 57.27% of the national highway development and other road projects under NHAI were completed as on 31st Dec’12. Substantial amount of work (84.75%) was completed on NS-EW corridor. Status of NHDP (As on 31st December 2012) The NHDP projects are divided into seven phases. However the ones being implemented are in four phases, i.e. I, II, III and V. There is no progress on the other phases.
Status of NHDP Total length (kms) Completed Under
Implementation Balance to be awarded
GQ 5846 100.00% 0.00% 0% NS – EW Ph I & II 7142 84.75% 10.11% 5.14% NHDP Phase III 12109 34.00% 47.35% 14.64% NHDP Phase V 6500 19.63% 43.14% 37.23% Port Connectivity & Others 1770 75.25% 23.62% 1.13% Total 33367 57.27% 29.00% 13.73%
Source – National Highway Authority of India
As of Q3 2012-13, the progress on the work completed as well as the projects under implementation under NHDP phase III and phase V is very slow as compared to Q2 2012-13. The factors responsible for slow progress of National Highway (NH) projects include delay in land acquisition, shifting of utilities, obtaining environment, forest clearances and railway approvals, poor performance of contractors and law & order problems in some States, etc.
Back to Index

10
Back to Index
8. Update on Pradhan Mantri Gram Sadak Yojana (PMGSY), as on 28th January, 2013
PMGSY for New Connectivity Nos. Length (Kms) Road Works Sanctioned 80960 292208 Completed Works 58542 202490 % of sanctioned works completed 72.31 69.30 Ongoing Works 22418 12386 PMGSY for Upgraded Connectivity Nos. Length (Kms) Road Works Sanctioned 35477 164317 Completed Works 30947 136199 % of sanctioned works completed 87.23 82.89 Ongoing Works 4530 2617 PMGSY - Cost Estimated (Rs. Cr.)
Sanctioned Amount 103631 Value of work done 93433 % of sanctioned amount utilized 90.16
Outlook by Tata DES (Tata Department of Economics and Statistics), 2012-13 � GDP growth at 5.5-5.7%
� Interest rate likely to soften gradually during next quarter. Currently, 10-yr G-Sec is 7.87%. 7.75% for
March 2013 end is a plausible estimate.
� Currently, Inflation is 7.18%. It could remain around 7% level till the end of next quarter. Core inflation has started moderating. It stood at 4.56% in Dec’12. Core inflation is the non-food manufacturing inflation.
� Money supply growth, non-food credit growth and deposit growth are projected at 15%, 16-17% and
15% respectively in FY 2012-13.
� In Q2 2012-13, CAD worsened to 5.2% of GDP due to a sharp decline in merchandise exports. CAD is expected to come down as crude prices are likely to decline in late winter and gold imports are expensive. Exports continue to remain difficult. It is expected that average CAD for 2012-13 will be 3.8-4.0% of GDP.
� As the capital market gains, inflows will increase leading to marginal firming up of Rupee.

11
III] TML STANDALONE
A] FINANCIALS
Rs. Crores Q3 FY13 Q3 FY12 Y-o-Y change 9M FY13 9M FY12 Y-o-Y
change
Total Volumes: CV+PC+Exports (Units) 205,291 231,328 -11.3% 619,439 640,334 -3.3%
CV (Units) 138,963 131,220 5.9% 390,026 374,532 4.1%
PC (Units) 54,675 85,963 -36.4% 189,897 220,574 -13.9%
Exports (Units) 11,653 14,145 -17.6% 39,516 45,228 -12.6%
Net Revenue# 10,630.1 13,337.9 -20.3% 33,697.9 37,915.8 -11.1%
EBITDA# 233.8 897.2 -73.9% 1,741.6 2,850.5 -38.9%
EBITDA Margin 2.2% 6.7% (450 bps) 5.2% 7.5% (230 bps)
Other Income 111.8 132.6 -15.7% 1,998.2 439.8 NM
Profit before exceptional items and tax (593.1) 269.5 NM 1,084.1 1,064.0 1.9%
Exceptional Item (8.2) (83.3) NM (424.0) (375.0) NM
Profit before Tax (601.3) 186.2 NM 660.2 689.0 4.2%
Net Profit (PAT) (458.5) 173.7 NM 614.0 677.0 9.3%
Basic EPS – Ordinary Shares (1.44) 0.53 1.91 2.12 Basic EPS- ‘A’ Ordinary shares (1.44) 0.63 2.01 2.22
Gross Debt 18,992.8 18,991.0 18,992.8 18,991.0
Net Debt 18,162.2 15,667.4 18,162.2 15,667.4
Net Debt / Equity 0.89 0.76 0.89 0.76
Inventory Days 45 36 42 37
Receivable Days 21 18 20 19
#Excludes Other Income;
EPS reported in the table above is not annualized;
Inventory and Receivable Days are based on the Average Sales for the respective periods
Back to Index

12
A] TML STANDALONE FINANCIALS IN USD MILLION
USD Million@ Q3 FY13 Q3 FY12 Y-o-Y
change 9M FY13 9M FY12 Y-o-Y change
Total Volumes: CV+PC+Exports (Units) 205,291 231,328 -11.3% 619,439 640,334 -3.3%
CV (Units) 138,963 131,220 5.9% 390,026 374,532 4.1%
PC (Units) 54,675 85,963 -36.4% 189,897 220,574 -13.9%
Exports (Units) 11,653 14,145 -17.6% 39,516 45,228 -12.6%
Net Revenue# 1,932.9 2,425.3 -20.3% 6,127.5 6,894.4 -11.1%
EBITDA# 42.5 163.1 -73.9% 316.7 518.3 -38.9%
EBITDA Margin 2.2% 6.7% (450 bps) 5.2% 7.5% (230 bps)
Other Income 20.3 24.1 -15.7% 363.3 80.0 NM
Profit before exceptional items and tax (107.9) 49.0 NM 197.1 193.5 1.9%
Exceptional Item (1.5) (15.1) NM (77.1) (68.2) NM
Profit before Tax (109.3) 33.9 NM 120.0 125.3 4.2%
Net Profit (PAT) (83.4) 31.6 NM 111.6 123.1 9.3%
Basic EPS – Ordinary Shares (0.03) 0.01 0.03 0.04 Basic EPS-‘A’ Ordinary shares (0.03) 0.01 0.04 0.04
Gross Debt 3,453.5 3,453.2 3,453.5 3,453.2
Net Debt 3,302.5 2,848.9 3,302.5 2,848.9
Net Debt / Equity 0.89 0.76 0.89 0.76
Inventory Days 45 36 42 37
Receivable Days 21 18 20 19
#Excludes Other Income;
EPS reported in the tables above is not annualized;
@ At conversion rate of USD 1 = 54.995 INR for reference only
Inventory and Receivable Days are based on the Average Sales for the respective periods
FINANCIAL HIGHLIGHTS
� Weak operating environment and competitive pressures on pricing continued to impact
operations
� 9m FY 13 EBITDA margin stood at 5.2%
� 9m FY 13 PAT stood at Rs 614 crs
� YTD Capex and Product Development Spend Rs 2,072 crores
� Net Debt / Equity stood at 0.89 Back to Index

13
B] COMMERCIAL VEHICLES BUSINESS
VOLUMES
Period/ Segments
Q3 FY13 Volumes
Q3 FY12 Volumes
Y-o-Y change
9M FY13 Volumes
9M FY12 Volumes
Y-o-Y change
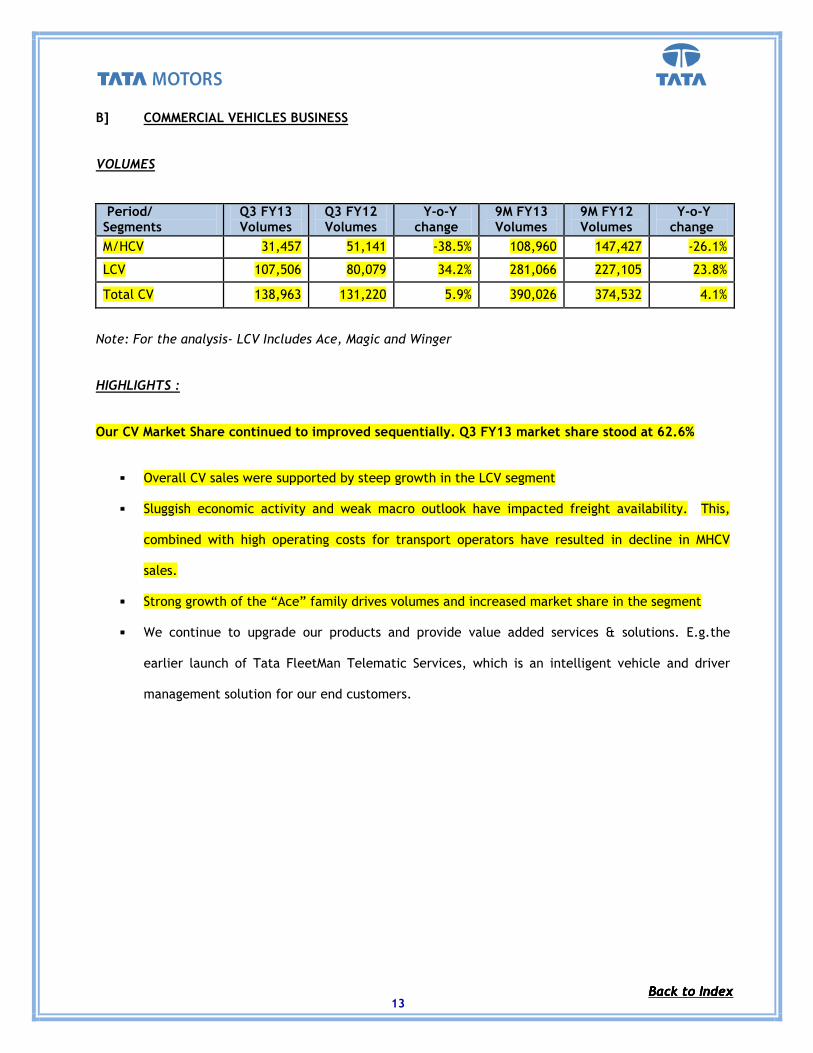
M/HCV 31,457 51,141 -38.5% 108,960 147,427 -26.1%
LCV 107,506 80,079 34.2% 281,066 227,105 23.8%
Total CV 138,963 131,220 5.9% 390,026 374,532 4.1%
Note: For the analysis- LCV Includes Ace, Magic and Winger
HIGHLIGHTS :
Our CV Market Share continued to improved sequentially. Q3 FY13 market share stood at 62.6%
� Overall CV sales were supported by steep growth in the LCV segment
� Sluggish economic activity and weak macro outlook have impacted freight availability. This,
combined with high operating costs for transport operators have resulted in decline in MHCV
sales.
� Strong growth of the “Ace” family drives volumes and increased market share in the segment
� We continue to upgrade our products and provide value added services & solutions. E.g.the
earlier launch of Tata FleetMan Telematic Services, which is an intelligent vehicle and driver
management solution for our end customers.
Back to Index Back to Index Back to Index

14
C] PASSENGER VEHICLES BUSINESS
VOLUMES
Period/ Segments
Q3 FY13 Volumes
Q3 FY12 Volumes
Y-o-Y change
9M FY13 Volumes
9M FY12 Volumes
Y-o-Y change
Micro 9,709 17,735 -45.3% 49,330 47,116 4.7%
Compact 29,092 48,810 -40.4% 93,752 119,464 -21.5%
Midsize 3,132 3,969 -21.1% 7,322 12,906 -43.3%
Executive 228 1,191 -80.9% 970 3,423 -71.7% Premium/ Luxury 209 324 -35.5% 516 644 -19.9%
Utility Vehicles 11,861 12,377 -4.2% 35,569 31,936 11.4%
Vans 444 1,557 -71.5% 2,438 5,085 -52.1%
Total PC 54,675 85,963 -36.4% 189,897 220,574 -13.9% Source: SIAM Industry Data and Company analysis
Note: For the analysis - ‘Micro’ comprises of Nano; ‘Compact’ comprises of Indica, Vista, Indigo CS, Fiat Grande Punto ‘Midsize’ comprises of Indigo XL, Manza and Marina; ‘Executive‘ comprises of Fiat Linea; ‘Premium/Luxury’ includes Jaguar vehicles sold in India; ‘Utility Vehicles’ comprises of Safari, Sumo, Xenon, Aria and Land Rover Vehicles sold in India; ‘Vans’ comprises of Tata Venture
HIGHLIGHTS
Recent product introductions and refreshes are well received
� Inventory in the pipeline has reduced during the quarter
� Market share stood at 10.1% for the period till Dec 2012
� Our recent product introductions like Safari Storme are well received and we expect our new
introductions like Vista D-90 to receive good response
� Initiated actions at dealerships to enhance consumer experience at point of sales
� We also continue to focus on new and refreshed products, enhanced sales & service experience
and network actions
LAUNCHES IN Q3 FY 13
i] In October 2012, Tata Motors launched its next generation car, the Tata Manza, a Club Class sedan. It
is entirely a new class of car where unmatched luxury meets unrivalled performance.
ii] In October 2012, Tata Motors launched the new Tata Safari Storme, combining luxury and comfort
with raw power and supreme off-roading performance, which this 'Real SUV' has been known for.
iii] In December 2012, Tata Motors launched the new Tata Aria Pure LX, a new variant with a bouquet
of features, at a stunning price. The Tata Aria Pure LX has been priced at Rs. 9.95 lakhs (ex-showroom
Bangalore). Back to Index

15
D] EXPORTS
VOLUMES
Period/ Segments Q3 FY13 Volumes
Q3 FY12 Volumes
Y-o-Y change
9M FY13 Volumes
9M FY12 Volumes
Y-o-Y change
Commercial Vehicles 10,535 12,422 -15.2% 34,443 39,593 -13.0%
Passenger Vehicles 1,118 1,723 -35.1% 5,073 5,635 -10.0%
Total Exports 11,653 14,145 -17.6% 39,516 45,228 -12.6%
HIGHLIGHTS
During the period, sales were supported by markets like Nepal, Thailand, South Africa and MENA
countries, while our larger export markets, Sri Lanka & Bangladesh continued to decline.
LAUNCHES IN Q3 FY 13
i] Tata Motors in October 2012, launched its 1-tonne diesel mini-truck, the Tata Super ACE, an ideal
vehicle for intra-city and last-mile distribution applications, in South Africa. The Tata Super ACE is a
combination of new-age design, superior performance, space, comfort, safety and operating economy,
delivering exactly what a transportation business requires.
With the launch of this vehicle, Tata Motors now has a commercial vehicle for every need in South Africa,
ranging from the 1tonne mini-truck to 56 tonne gross combination mass prime movers. The distribution of
Tata pick-ups in South Africa started in 2004 through Accordian Investments (Pty) Ltd., a subsidiary of
Associated Motors Holdings (AMH), which currently operates through a network of about 60 sales and
service dealers. Tata Motors' portfolio in South Africa comprises 20 commercial vehicle models and 3
passenger car models, with over 65,000 Tata vehicles plying on South African roads today.
ii] In November 2012, Tata Motors today made its maiden entry in the Bangladesh new car market,
introducing two sedans and a hatchback. They are the Tata Indigo eCS, India's most fuel-efficient
compact sedan, the Tata Indigo Manza, a luxury sedan, and the Tata Indica Vista hatchback, with class
defining space. The Manza and the Vista are born out of Tata Motors' new car platform.
To begin with, they will be available in Dhaka with one showroom. By 2013, three other cities will be
covered, with a showroom each. Tata Motors has a 40-year heritage in Bangladesh, having introduced its
buses in 1972. There are about 53,000 Tata commercial vehicles on Bangladesh roads. The company is
today the market leader with a 70% market share.
Back to Index

16
Back to Index
E] WAY FORWARD
� External environment and overall economic activities remain stressed, resulting in the overall
demand continuing to remain under pressure, mainly for the MHCV segment
� Demand in the SCV segment remains strong
� Competitive intensity resulting in higher marketing costs.
� Continue to leverage on our strengths, which cover:
¾ Strong understanding of the domestic market
¾ Wide and compelling product portfolio
¾ Strong Brand and Customer support
¾ Wide spread distribution network,
¾ Economies of scale
� We continue to upgrade our products, value added services & solutions for our end customers.
� Several initiatives under aggressive implementation in the passenger car business to achieve
performance improvement
¾ Regular product refresh plans in pipeline
¾ Customer experience and engagement
¾ Distribution expansion and improving effectiveness
¾ Cost effectiveness and quality enhancement initiatives
� Future Products in pipeline during FY13 - Variants from Prima range, Ultra range of LCV, ACE
variants, Nano, refreshed car models across the portfolio
� Extend export potential for our products
� For overall industry, RM and component prices are expected to be under control. For the
Company, cost and expense optimization focus will continue

17
F] OTHER SIGNIFICANT EVENTS DURING THE QUARTER
i] Tata Ace races through the one-million mark in just 2,680 days
Tata Ace, the one-in-a-million idea from Tata Motors, now has a one million strong presence. Introduced
in May 2005, the Tata Ace, India's first mini-truck, and the Tata Magic, its sister vehicle for passenger
transportation introduced in June 2007, together crossed the prestigious one-million sales mark in August
2012 -- just 2,680 days. Total sales, at the end of October 2012, are at 10,59,135 - 997,133 in India and
62,002 abroad.
Every 4th commercial vehicle sold in India today (2011-12 industry sales: 892,349) is a Tata Ace/ Tata
Magic (2011-12 sales: 214,483). In the process, it became India's first one-lakh-per-year goods
commercial vehicle in 2010. The same very year, the family's fifth in the market, it crossed the half-a-
million mark. The remaining half-a-million has come in the last two years. Indeed, the Tata Ace/ Tata
Magic family today has created a whole new segment of four-wheel small commercial vehicles.
ii] Cyrus P. Mistry appointed Chairman of Tata Motors
The Board of Directors of Tata Motors ON 13, Dec 2012, announced the appointment of Mr. Cyrus P.
Mistry as the Chairman of the Board with effect from December 28, 2012, on the retirement of Mr. Ratan
N. Tata. The Board conferred on Mr. Tata the honorary title of Chairman Emeritus.
G] TML CORPORATE CREDIT RATING
Credit Rating Agency Long Term Rating as on 31st Dec 2012
Moody’s Ba3 / Stable
S&P BB / Positive
CRISIL AA- / Positive
ICRA AA- / Positive
CARE AA / Stable
Back to Index Back to Index

18
IV] TML CONSOLIDATED FINANCIALS (UNAUDITED) IN RS. CRORES
Rs. Crores Q3 FY13 Q3 FY12 Y-o-Y change 9M FY13 9M FY12 Y-o-Y
change
Net Revenue# 46,089.5 45,260.3 1.8% 132,816.0 114,746.6 15.7%
EBITDA# 6,143.8 7,222.7 -14.9% 18,239.5 16,521.4 10.4%
EBITDA Margin 13.3% 16.0% (270 bps) 13.7% 14.4% (70 bps)
Other Income 188.6 167.5 12.6% 634.1 503.2 26.0%
Profit before exceptional items and tax
2,841.4 4,658.1 -39.0% 9,563.3 9,769.8 -2.1%
Exceptional Items (173.5) (164.3) NM
(624.2) (660.3) NM
Profit before Tax 2,667.9 4,493.8 -40.6% 8,939.1 9,109.6 -1.9%
Net Profit (PAT) ^ 1,627.5 3,405.6 -52.2% 5,947.1 7,282.5 -18.3%
Basic EPS – Ordinary Shares 5.09 10.72 18.64 22.93
Basic EPS - ‘A’ Ordinary shares 5.19 10.82 18.74 23.03
Gross Debt 54,334.2 45,187.0 54,334.2 45,187.0
Net Automotive Debt 15,772.8 14,907.3 15,772.8 14,907.3
Net Automotive Debt / Equity 0.37 0.56 0.37 0.56
Inventory Days 48 38 49 45
Receivable Days 19 16 19 19 # Excludes Other Income;
^ PAT is after Minority Interest and share of Profit/(Loss) in respect of associate companies
EPS reported in the tables above is not annualized;
Inventory and Receivable Days are based on the Average Sales for the respective periods
Back to Index

19
TML CONSOLIDATED FINANCIALS (UNAUDITED) IN USD MILLION
USD Million@ Q3 FY13 Q3 FY12 Y-o-Y change 9M FY13 9M FY12 Y-o-Y
change
Net Revenue# 8,380.7 8,229.9 1.8% 24,150.6 20,864.9 15.7%
EBITDA# 1,117.2 1,313.3 -14.9% 3,316.6 3,004.2 10.4%
EBITDA Margin 13.3% 16.0% (270 bps) 13.7% 14.4% (70 bps)
Other Income 34.3 30.5 12.6% 115.3 91.5 26.0% Profit before exceptional items and tax
516.7 847.0 -39.0% 1,738.9 1,776.5 -2.1%
Exceptional Items (31.6) (29.9) NM (113.5) (120.1) NM
Profit before Tax 485.1 817.1 -40.6% 1,625.4 1,656.4 -1.9%
Net Profit (PAT) ^ 295.9 619.2 -52.2% 1,081.4 1,324.2 -18.3%
Basic EPS – Ordinary Shares 0.09 0.19 0.34 0.42
Basic EPS - ‘A’ Ordinary shares 0.09 0.20 0.34 0.42
Gross Debt 9,879.8 8,216.6 9,879.8 8,216.6
Net Automotive Debt 2,868.0 2,710.7 2,868.0 2,710.7
Net Automotive Debt / Equity 0.37 0.56 0.37 0.56
Inventory Days 48 38 49 45
Receivable Days 19 16 19 19 # Excludes Other Income;
^ PAT is after Minority Interest and share of Profit/(Loss) in respect of associate companies
EPS reported in the tables above is not annualized;
@ At conversion rate of USD 1 = 54.995 INR for reference only
Inventory and Receivable Days are based on the Average Sales for the respective periods
FINANCIAL HIGHLIGHTS
� 9m FY 13 Net revenue Rs 132,816 crores
� 9m FY 13 EBITDA margin stood at 13.7%
� 9m FY13 PAT stood at Rs 5,947 crores
� YTD Capex & product development spend Rs 13,773 Crores
� Net Automotive Debt / Equity Ratio stood at 0.37
Back to Index

20
V] JAGUAR LAND ROVER PLC
A] FINANCIALS
(i) IFRS AS APPROVED IN THE EU (UNAUDITED)
IFRS
GBP Million Q3 FY13 Q3 FY12 Y-o-Y change 9M FY13 9M FY12 Y-o-Y
change
JLR Wholesales 94,828 86,322 9.9% 255,722 216,412 18.2% Jaguar Wholesales 15,043 15,272 -1.5% 36,649 39,921 -8.2%
Land Rover Wholesales 79,785 71,050 12.3% 219,073 176,491 24.1%
Net Revenue 3,803.6 3,749.1 1.5% 10,730.1 9,367.5 14.5%
EBITDA# 533.4 639.4 -16.6% 1,545.9 1,420.0 8.9%
EBITDA Margin 14.0% 17.1% (310 bps) 14.4% 15.2% (80 bps)
Profit before Tax 403.8 509.0 -20.7% 1,167.1 976.3 19.5%
Net Profit (PAT) 296.1 393.2 -24.7% 837.2 785.2 6.6%
Gross Debt 1,886.3 1,562.8 1,886.3 1,562.8
Net Debt (255.0) (124.3) (255.0) (124.3) Net Debt / Equity (0.07) (0.06) (0.07) (0.06)
Inventory Days 44 36 47 43
Receivable Days 17 15 18 19
PBT Includes £39m MTM gain of bond call options
Inventory and Receivable Days are based on the Average Sales for the respective periods
FINANCIAL HIGHLIGHTS
� 9m FY 13 - Net revenue £ 10,731 m
� 9m FY 13 EBITDA margin at 14.4%
� 9m FY 13 PAT at £ 837 m
� Cash and financial deposits £ 2,141 m Undrawn committed lines stood at £ 991 m
� YTD Capex & product development £ 1,461 m and Positive free cash flow £ 90 m post spend
Back to Index Back to Index

21
Back to Index
(ii) JLR FINANCIALS UNDER IGAAP (UNAUDITED)
IGAAP
GBP Million Q3 FY13 Q3 FY12 Y-o-Y change 9M FY13 9M FY12 Y-o-Y
change JLR Wholesales 94,828 86,322 9.9% 255,722 216,412 18.2%
Jaguar Wholesales 15,043 15,272 -1.5% 36,649 39,921 -8.2% Land Rover Wholesales 79,785 71,050 12.3% 219,073 176,491 24.1%
Net Revenue 3,803.6 3,750.4 1.4% 10,730.1 9,367.5 14.5%
EBITDA 580.1 739.2 -21.5% 1,591.7 1,563.7 1.8%
EBITDA Margin 15.3% 19.7% (440 bps) 14.8% 16.7% (190 bps)
Profit before Tax 371.7 559.7 -33.6% 1,105.6 1,095.1 1.0%
Net Profit (PAT) 246.0 440.4 -44.1% 805.3 896.8 -10.2%
Gross Debt 1,909.6 1,447.9 1,909.6 1,447.9
Net Debt (391.5) (239.8) (391.5) (239.8)
Net Debt / Equity (0.1) (0.1) (0.1) (0.1)
Inventory Days 44 36 47 43
Receivable Days 17 15 18 18 Inventory and Receivable Days are based on the Average Sales for the respective periods
B] PRODUCTS, REGIONAL PERFORMANCE & HIGHLIGHTS
JAGUAR WHOLESALE VOLUMES BY CAR-LINE
Jaguar Wholesales
Q3 FY13 Volumes
Q3 FY12 Volumes
Y-o-Y change
9M FY13 Volumes
9M FY12 Volumes
Y-o-Y change
XF 9,425 9,454 -0.3% 23,484 24,470 -4.0%
XJ 4,378 4,541 -3.6% 10,053 11,708 -14.1%
XK 1,240 1,272 -2.5% 3,111 3,727 -16.5%
Others - 5 NM 1 16 NA Total Jaguar
15,043 15,272 -1.5% 36,649
39,921 -8.2%
JAGUAR RETAILVOLUMES BY CAR-LINE
Jaguar Retails Q3 FY13 Volumes
Q3 FY12 Volumes
Y-o-Y change
9M FY13 Volumes
9M FY12 Volumes
Y-o-Y change
XF 8,118 8,397 -3.3% 24,706 23,479 5.2%
XJ 2,965 3,606 -17.8% 10,809 11,609 -6.9%
XK 897 1,003 -10.6% 2,901 3,704 -21.7%
Others - - - - 4 NM
Total Jaguar 11,980 13,006 -7.9% 38,416 38,796 -1.0%

22
Back to Index
LAND ROVER WHOLESALE VOLUMES BY CAR-LINE
Land Rover Wholesales
Q3 FY13 Volumes
Q3 FY12 Volumes
Y-o-Y change
9M FY13 Volumes
9M FY12 Volumes
Y-o-Y change
Defender 4,099 4,667 -12.2% 11,089 14,466 -23.3%
Freelander 15,006 9,314 61.1% 36,650 33,930 8.0%
Discovery 10,663 11,122 -4.1% 31,579 33,241 -5.0% Range Rover Sport 13,608 14,087 -3.4% 40,985 40,727 0.6%
Range Rover 1,856 7,583 -75.5% 13,656 22,076 -38.1%
Range Rover Evoque 31,388 24,277 29.3% 81,935 32,051 155.6%
New Range Rover 3,165 - NM 3,179 - NM
Total Land Rover
79,785 71,050 12.3%
219,073
176,491 24.1%
LAND ROVER RETAIL VOLUMES BY CAR-LINE
Land Rover Retails
Q3 FY13 Volumes
Q3 FY12 Volumes
Y-o-Y change
9M FY13 Volumes
9M FY12 Volumes
Y-o-Y change
Defender 4,047 4,683 -13.6% 11,289 14,609 -22.7%
Freelander 12,245 8,888 37.8% 36,354 34,911 4.1%
Discovery 11,456 10,554 8.5% 32,986 33,050 -0.2%
Range Rover Sport 14,958 14,090 6.2% 41,642 41,154 1.2%
Range Rover 4,268 7,458 -42.8% 17,273 22,021 -21.6%
Range Rover Evoque 28,039 19,614 43.0% 79,427 22,710 NM
New Range Rover 1,665 - NM 1,778 - NM
Total Land Rover 76,678 65,287 17.4% 220,749 168,455 31.0%
JAGUAR WHOLESALE VOLUMES REGION- WISE
Jaguar Wholesales
Q3 FY13 Volumes
Q3 FY12 Volumes
Y-o-Y change
9M FY13 Volumes
9M FY12 Volumes
Y-o-Y change
UK 3,020 3,053 -1.1% 9,014 10,666 -15.5%
North America 4,716 4,371 7.9% 9,391 10,072 -6.8%
Europe 2,468 2,939 -16.0% 6,104 7,537 -19.0%
China 2,358 2,420 -2.6% 5,248 5,473 -4.1%
Asia Pacific 901 1,048 -14.0% 2,617 2,481 5.5%
All Other Markets 1,580 1,441 9.6% 4,275 3,692 15.8%
Total Jaguar 15,043
15,272 -1.5%
36,649
39,921 -8.2%
Back to Index

23
JAGUAR RETAIL VOLUMES REGION- WISE
Jaguar Retails Q3 FY13 Volumes
Q3 FY12 Volumes
Y-o-Y change
9M FY13 Volumes
9M FY12 Volumes
Y-o-Y change
UK 2,989 2,463 21.4% 10,095 9,762 3.4%
North America 2,591 3,146 -17.6% 9,173 10,385 -11.7%
Europe 2,280 2,671 -14.6% 6,979 7,233 -3.5%
China 1,810 2,198 -17.7% 5,353 5,312 0.8%
Asia Pacific 808 923 -12.5% 2,571 2,402 7.0%
All Other Markets 1,502 1,605 -6.4% 4,245 3,702 14.7%
Total Jaguar 11,980 13,006 -7.9% 38,416 38,796 -1.0%
LAND ROVER WHOLESALE VOLUMES REGION- WISE
Land Rover Wholesales Q3 FY13 Volumes
Q3 FY12 Volumes
Y-o-Y change
9M FY13 Volumes
9M FY12 Volumes
Y-o-Y change
UK 11,207 11,176 0.3% 33,514 30,709 9.1%
North America 13,234 12,830 3.1% 36,526 31,903 14.5%
Europe 19,830 17,621 12.5% 48,943 41,222 18.7%
China 17,623 12,690 38.9% 49,671 30,482 63.0%
Asia Pacific 3,762 2,223 69.2% 9,714 7,062 37.6%
All Other Markets 14,129 14,510 -2.6% 40,705 35,113 15.9%
Total Land Rover 79,785
71,050 12.3%
219,073
176,491 24.1%
LAND ROVER RETAIL VOLUMES REGION- WISE
Land Rover Retails Q3 FY13 Volumes
Q3 FY12 Volumes
Y-o-Y change
9M FY13 Volumes
9M FY12 Volumes
Y-o-Y change
UK 10,980 10,130 8.4% 36,472 28,494 28.0%
North America 13,146 13,592 -3.3% 36,173 32,377 11.7%
Europe 17,705 16,024 10.5% 48,409 37,733 28.3%
China 17,921 10,599 69.1% 49,995 28,721 74.1%
Asia Pacific 3,511 2,248 56.2% 9,759 6,902 41.4%
All Other Markets 13,415 12,694 5.7% 39,941 34,228 16.7%
Total Land Rover 76,678 65,287 17.4% 220,749 168,455 31.0%
Back to Index

24
Back to Index
JAGUAR LAND ROVER MARKET-MIX FOR WHOLESALES
JAGUAR LAND ROVER MARKET-MIX FOR RETAILS

25
Back to Index
REGIONAL PERFORMANCE
Performance in key geographical markets on retail basis
United States
The US economic situation continues to show signs of recovery in the current quarter, but uncertainty
remains due to negotiations on spending and deficit levels needing to be completed over the next few
months. Jaguar retail volumes for the quarter fell by 555 units compared to Q3 FY12, mainly due to lower
XK sales. The US premium car segment volumes increased by 11% in the last 12 months, with Jaguar’s
share broadly flat whilst the market environment continues to be competitive with a trend towards
smaller engines.
The 13 model year line-up of Jaguar products includes new small engine and AWD derivatives, with retail
sales fully starting in Q4 FY13. Land Rover retail volumes for the quarter fell by 3% compared to Q3 FY12,
mainly driven by run-out of the old Range Rover, with sales of the new Range Rover beginning in
December 2012. The US premium SUV segment volumes were up 17% in the last 12 months, with Land
Rover participating in this growth, whilst maintaining market share. US combined total retail volumes for
the quarter were 15,737 units, down 6% compared to Q3 FY12.
UK
The UK economy has continued to be challenging with GDP remaining flat over the past 12 months. The
outlook for the UK is uncertain, although the financial markets of the UK’s largest trading partners in
Europe have stabilised in the last 6 months. The UK premium car segment volumes increased by 3% in the
last 12 months, although started to fall away from September. Jaguar shares are up in all models,
reflecting the improvement in the 13 model year CO2 emission and despite significant financial support
offered by competitors. The 2.2l diesel has now been available in the XF for 12 months and the new
Sportbrake XF is starting to be sold. The UK premium SUV segment volumes increased by 21% in the last
12 months, with the Land Rover market share up, primarily reflecting the Range Rover Evoque but also
supported by all other models, except the old Range Rover, which is running-out. Jaguar and Land Rover
combined retails were 13,969 units in the quarter, up 11% compared to Q3 FY12. Jaguar retail volumes
for the quarter increased by 21%. Land Rover retail volumes for the quarter were up by 8% compared to
Q3 FY12.
Europe (excl. Russia and UK)
European financial markets have stabilised in the past six months, although macro-economic pressures
continue, with recession in a number of countries and a slowdown in Germany and France. Credit rating
agencies continue to be negative about Euro area prospects, and the European car industry is expected
Back to Index

26
Back to Index
to have reduced volumes in the current year in all European markets. Combined total retail volumes in
the quarter for the Europe region were 19,985, an increase of 7% compared to Q3 FY12. The increase
reflects growth in the Range Rover Evoque with other models being marginally down. Jaguar retail
volumes in the Europe region for the quarter fell by 391 units reflecting softer industry volumes. Land
Rover retail volumes within the Europe region for the quarter increased by 10% to 17,705. In Germany,
Land Rover market share increased by 0.4%, whilst Jaguar grew by 0.7%.
China
The Chinese economy continues to grow strongly, although at a slower rate. China's premium car segment
volumes increased by 20% in the last 12 months. Jaguar volumes were down 388 units, primarily
reflecting 12 model year run-out on XF and XJ and prior to the introduction of the 2.0l XF and XJ. The
premium SUV segment increased by 21% in the last 12 months, with Land Rover’s share increasing 3% to
over 10% due to the introduction of the Range Rover Evoque, alongside growth in other models.
Combined total retail volumes were 17,921 units in the quarter. China was the 2nd largest retail market
and wholesale market for the company in the period, and the largest market for the 9 months to
December 2012.
Asia Pacific
The Asia pacific region has continued to show economic growth. Total Asia Pacific retail volumes for the
quarter were 4,319 units, up 36% with volumes in Australia up 29%. Jaguar retail volumes for the quarter
fell by 115 units compared to Q3 FY12, mainly due to XJ demand. Land Rover retail volumes for the
quarter increased to 3,145 (56%) compared to Q3 FY12.
JLR HIGHLIGHTS
� Range Rover Evoque and Freelander drove volume growth
� China Region continues to grow strongly and achieved over 50% YTD growth
� Our 2013 MY products includes XF Sportbrake, AWD and smaller engine derivatives of XF and XJ.
The recently launched new Range Rover has received wide acclaim.
� Q3 FY13 Revenue at £ 3.8 bn is reflective of strong demand for our products and continuing
growth in China and other markets.
� EBITDA margin at 14% in line with recent quarters, lower than a strong quarter a year ago,
reflecting: product mix, the ongoing effect of higher marketing costs compared to the low levels
experienced in Q3 of the prior year, launch costs of the all-new Range Rover, run out of the
earlier Range Rover, and continued growth in product investments and related costs to support
future business growth.

27
Back to Index
� Cash, bank balances, mutual funds - £2.1 bn; Undrawn committed facilities of £ 1 bn as on
December 31, 2012
� Successful new 10 year bond issue in January, raising $500m at 5.625% p.a.
� Continued building the new engine plant in Wolverhampton in UK
� Laid the foundation stones for the joint venture with Chery in China
C] WAY FORWARD
� Focus on continuing the launch of new Range Rover, full launch of the new Jaguar engine and
AWD options, XF Sportbrake, and F-TYPE.
� Continuing focus on both refreshed and new Jaguar and Land Rover products
� Continue to focus on profitable volume growth and improving efficiencies to sustain the
growth momentum
� Planned investments in future new products and technologies to meet customer aspirations
and regulatory environmental standards
� Given the significant growth in sales and profitability with strong liquidity, capex and product
development spending expected to accelerate and increase in FY14 to in the region of £ 2.75 bn
to develop new products and technologies and grow our manufacturing foot print to realize
increased market opportunities.
� Continue to monitor economic and sales trends closely to balance sales and production
D] JLR CORPORATE CREDIT RATING
Credit Rating Agency Long Term Rating as on 31st Dec 2012
Moody’s Ba3 / Stable
S&P BB- / Positive
Fitch BB- / Stable
28
VI] HIGHLIGHTS OF OTHER KEY SUBSIDIARIES
A] TATA MOTORS FINANCE
Rs. Crores
Particulars Q3 FY13 Q3 FY12 Y-o-Y change 9M FY13 9M FY12 Y-o-Y
change
Net Revenue * 784.1 545.7 43.7% 2,111.3 1,474.8 43.2%
Operating Income (post Net interest charges) *
128.1 106.5 20.3% 343.3 259.2 32.4%
Operating Margin 16.3% 19.5% (320 bps) 16.3% 17.6% (130 bps)
PAT 84.3 70.6 19.4% 225.8 171.5 31.7%
* Includes ‘Other Income’
HIGHLIGHTS
� Finance disbursed during Q3 FY 13 stood at Rs. 3,281 Cr.
� The book size as on December 31, 2012 for TMFL stood at Rs 18,911 Cr.
� Q3 FY 13 market share stood at 41.1%.
� NIM of vehicle financing business for Q3 FY13 was 7.2%
B] TATA TECHNOLOGIES
Rs. Crores
Particulars Q3 FY13 Q3 FY12 Y-o-Y change 9M FY13 9M FY12 Y-o-Y
change
Net Revenue * 535.6 440.2 21.7% 1,462.5 1,154.5 26.7%
EBITDA * 102.5 79.7 28.6% 270.5 195.3 38.5%
% of Revenue 19.1% 18.1% 100 bps 18.5% 16.9% 160 bps
PAT 75.2 58.2 29.2% 218.5 146.2 49.5%
* Excludes ‘Other Income’
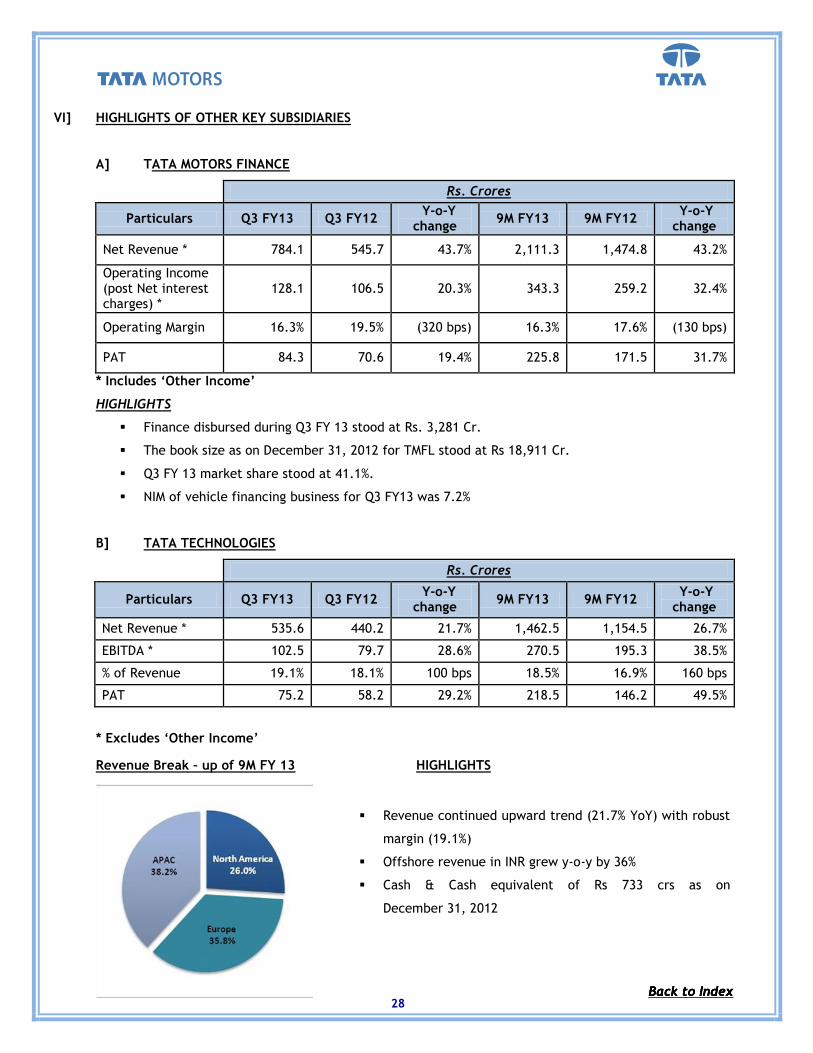
Revenue Break – up of 9M FY 13 HIGHLIGHTS
� Revenue continued upward trend (21.7% YoY) with robust
margin (19.1%)
� Offshore revenue in INR grew y-o-y by 36%
� Cash & Cash equivalent of Rs 733 crs as on
December 31, 2012
Back to Index Back to Index Back to Index

29
C] TATA DAEWOO
KRW Billion
Particulars Q3 FY13 Q3 FY12 Y-o-Y change 9M FY13 9M FY12 Y-o-Y
change
Sales (Units) 2,073 1,844 12.4% 7,382 7,392 -0.1%
Net Revenue * 175.2 158.7 10.4% 597.5 585.1 2.1%
EBITDA * 9.0 7.2 24.2% 31.3 26.6 17.7%
% of Revenue 5.1% 4.6% 50 bps 5.2% 4.5% 70 bps
PAT 0.6 (0.2) NM 4.9 4.2 16.2% * Excludes ‘Other Income’
HIGHLIGHTS
� Demand in the domestic markets continued to be weak.
� During Q3 FY 13, our exports growth supported revenues and margins
� Continue with cost control efforts
� Net Profit includes impact of reversal of pension related provisions
D] TML DRIVELINES LTD
Rs. Crores
Particulars Q3 FY13 Q3 FY12 Y-o-Y change 9M FY13 9M FY12 Y-o-Y
change
Net Revenue * 89.2 174.3 -48.8% 311.9 508.3 -38.6%
EBITDA * 30.3 106.2 -71.5% 129.3 308.4 -58.1%
% of Revenue 34.0% 60.9% (2690 bps) 41.5% 60.7% (1920 bps)
PAT 11.9 60.8 -80.4% 68.3 173.0 -60.5%
* Excludes ‘Other Income’
HIGHLIGHTS
� Domestic MHCV market declined impacting revenue and profitability
� Cost control initiatives continue to be pursued to support pressures on costs owing to lower
volumes
Back to Index

30
VII] SHAREHOLDING PATTERN
Shareholding Pattern as on December 31st, 2012
Ordinary Shares %
Tata Companies 34.71
Indian Financial Institutions / MFs / Banks 11.36
ADR/GDR Holders / Foreign holders–DR status 16.68
Foreign Institutional Investors 29.01
Others 8.24
Total 100%
‘A’ Ordinary Shares %
Tata Companies 0.88
Indian Financial Institutions / MFs / Banks 41.31
Foreign Institutional Investors 45.36
Others 12.45
Total 100%
Disclaimers & statements
Statements in this presentation describing the objectives, projections, estimates and expectations of the Company i.e. Tata Motors Ltd and its direct and indirect subsidiaries and its associates may be “forward looking statements” within the meaning of applicable securities laws and regulations. Actual results could differ materially from those expressed or implied. Important factors that could make a difference to the Company’s operations include, among others, economic conditions affecting demand / supply and price conditions in the domestic and overseas markets in which the Company operates, changes in Government regulations, tax laws and other statutes and incidental factors. Q3 FY13 represents the period from 1st September 2012 to 31st December 2012. Q3 FY12 represents the period from 1st September 2011 to 31st December 2011. 9m FY 13 represents the period from 1st April 2012 to 31st December 2012. 9m FY 12 represents the period from 1st April 2011 to 31st December 2011. JLR Financials contained in the review are as per IFRS as approved in the EU as well as in IGAAP, Unaudited. All other subsidiaries’ financials are in IGAAP.
Back to Index
