business school entrepreneurship & innovation mgmt8608 › sites › all › publications ›...
TRANSCRIPT

© Mazzarol 2012 all rights reserved
Entrepreneurship & Innovation MGMT8608
TOPIC 9: TECHNOLOGY, TECHNOPRENEURS & DISRUPTIVE INNOVATION
BUSINESS SCHOOL
The University of Western Australia © Mazzarol 2012 all rights reserved
Learning Outcomes
Understand how to identify emergent,
disruptive technologies
Understand whether ventures need to
spin out new ventures or can capture
their value
Appreciate the pivotal role of customers
Understand how new ventures can
‘create new market space’
Appreciate how Innovation Management
frameworks intersect with and contradict
with Strategy and Marketing frameworks
Understand how innovation occurs in
products and services as well as
technology – at all stages and sizes of
ventures

The University of Western Australia © Mazzarol 2012 all rights reserved
Introduction
Sometimes you just have to believe in the impossible…and you’ve got to
have faith to breakthrough.
• - Peter, CEO software development company.

The University of Western Australia © Mazzarol 2012 all rights reserved
Your Elevator Pitch
Two mins
Pain Statement – What problem?
Value Proposition – What solution?
Key elements:
• Succinct
• Easy to understand
• Greed inducing
• Irrefutable

The University of Western Australia © Mazzarol 2012 all rights reserved
The Lean Start-Up Process

IDEAS
DATA PRODUCT
LEARN BUILD
MEASURE
Lean Start-Up Process
Assumptions • Customer Value hypothesis • Growth hypothesis
Innovation Accounting • Use minimum viable product • Fine-tune towards ideal goal • Persevere or pivot
Focus on Metrics • Actionable – cause & effect • Accessible – simple to understand • Auditable – systematic & transparent
Business Plan Pivot • Be ready to change direction • Multiple options • Flexibility is the key
Adapt Innovate
Small batches Experiment
Sticky Viral Paid
Review problems Make mistakes once
Portfolio Thinking Resources; autonomy,
ownership
Batch Grow
Source: Ries 2011
The University of Western Australia © Mazzarol 2012 all rights reserved
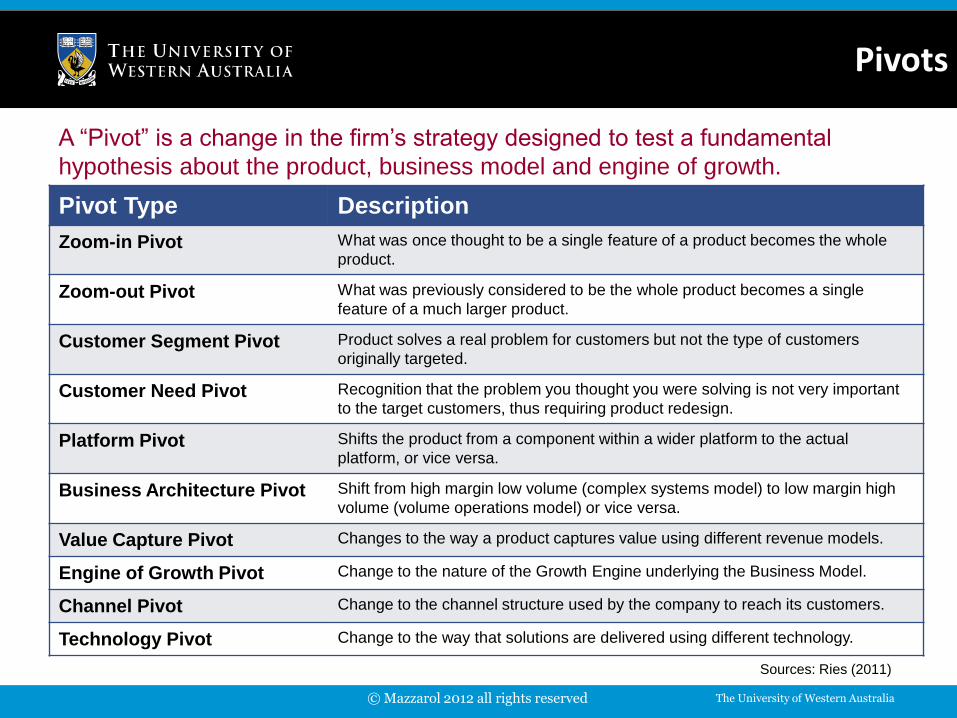
Pivots
Sources: Ries (2011)
Pivot Type Description
Zoom-in Pivot What was once thought to be a single feature of a product becomes the whole
product.
Zoom-out Pivot What was previously considered to be the whole product becomes a single
feature of a much larger product.
Customer Segment Pivot Product solves a real problem for customers but not the type of customers
originally targeted.
Customer Need Pivot Recognition that the problem you thought you were solving is not very important
to the target customers, thus requiring product redesign.
Platform Pivot Shifts the product from a component within a wider platform to the actual
platform, or vice versa.
Business Architecture Pivot Shift from high margin low volume (complex systems model) to low margin high
volume (volume operations model) or vice versa.
Value Capture Pivot Changes to the way a product captures value using different revenue models.
Engine of Growth Pivot Change to the nature of the Growth Engine underlying the Business Model.
Channel Pivot Change to the channel structure used by the company to reach its customers.
Technology Pivot Change to the way that solutions are delivered using different technology.
A “Pivot” is a change in the firm’s strategy designed to test a fundamental
hypothesis about the product, business model and engine of growth.

The University of Western Australia © Mazzarol 2012 all rights reserved
Engines of Growth: The Sticky Engine of Growth
Sources: Ries (2011)
Sticky Growth Engine
Description: This growth engine is focused on the capture and retention of customers. Typically it uses database
technology as the foundation where a customer has their own products or services hosted . This is
most common in the case of websites and point of sales systems (e.g. iTunes). Once a product or
service is built on top of a database technology it becomes difficult for the customer to switch.
Customers in IT sector become “locked into” the vendor they choose. This type of engine requires
that it offer the customers compelling new capability to get them to risk being locked into a single
vendor.
Key issues: • Relies on having a high customer retention rate.
• Requires tracking of customer retention and attrition rates (Churn rate).
• Churn rate = % of customers in period who cease to engage with the product.
Rules: • If the rate of new customer acquisition exceeds the churn rate the product will grow.
• The speed of growth is determined by the rate of compounding or the natural rate minus the churn
rate.
• Key focus should be on improving customer retention rates.
Engines of growth are a way to focus the new business model around a few key
metrics to help concentrate their limited resources.

The University of Western Australia © Mazzarol 2012 all rights reserved
Engines of Growth: The Viral Engine of Growth
Sources: Ries (2011)
Viral Growth Engine
Description: This growth engine is focused on the ability to get existing customers to bring in new customers. This
can take the form of referrals via word of mouth, using online connections (e.g. Hotmail), or peer to
peer marketing and sales (e.g. Tupperware). The Viral Engine is powered by a measurable feedback
loop known as the “Viral Loop”. This can be measured using the “Viral Coefficient”. The higher the
“Viral Coefficient” the faster the product will spread.
Key issues: • Relies on having a high rate of customer referrals to bring in new customers.
• Requires tracking of the “Viral Loop” and “Viral Coefficient”.
• Viral Coefficient = how many new customers will use a product as a result of each new customer
that signs up (e.g. number of referrals per new customer).
• Viral Coefficients > 1 will grow.
Rules: • Focus on increasing the Viral Coefficient more than anything else.
• Many viral products do not charge customers directly but rely on indirect revenue (e.g. Facebook
advertising).
• The value of a customer may not be measured purely in monetary terms but in their willingness to
bring in new customers.
Engines of growth are a way to focus the new business model around a few key
metrics to help concentrate their limited resources.

The University of Western Australia © Mazzarol 2012 all rights reserved
Engines of Growth: The Paid Engine of Growth
Sources: Ries (2011)
Paid Growth Engine
Description: This growth engine is focused on two things: increasing the revenue from each customer, or lowering
the cost of acquiring a new customer. It is powered by a feedback loop, which is the amount of
money that a customer spends with the product/firm over their “life time”. This produces the concept
of the “life time value” (LTV) of each customer. Profits generated from this value are invested back
into promotion, marketing and sales to generate growth. What must be monitored is the “cost per
acquisition” (CPA). The margin between the LTV and the CPA determines the rate of growth.
Key issues: • Relies on customer life time value (LTV).
• Requires tracking of customer LTV against cost per acquisition (CPA)
• Margin between LTV and CPA determines the rate of growth.
Rules: • The margin between the LTV and CPA is the “marginal profit”.
• If the LTV is greater than the CPA the company will grow.
• If the LTV is lower than the CPA the company’s growth will slow.
Engines of growth are a way to focus the new business model around a few key
metrics to help concentrate their limited resources.

The University of Western Australia © Mazzarol 2012 all rights reserved
Discussion Why did Eric Ries say that we must “stop
wasting people’s time”?
What is the role of “extreme uncertainty”
in his definition of a start-up?
Do you agree with his view that
“entrepreneurship is management”?
What is “Entrepreneurial Management”
What is a “Pivot” and why are they
important?
What is “validated learning”?
What is the build-measure-learn feedback
loop?

The University of Western Australia © Mazzarol 2012 all rights reserved
Patents & Trademarks per capita
2005-2007
Source: OECD 2010
It has been found that, as
patenting activity rises with the
Australian economy, so to does
the level of labour productivity
and overall economic growth
(Crosby 2000).

The University of Western Australia © Mazzarol 2012 all rights reserved
Scientific articles and co-authorship
Source: OECD 2010
The size of the ‘bubbles’ is an indication of the number of scientific publications and the thickness of
the links is an indicator of the intensity of the collaboration or co-authorship.

The University of Western Australia © Mazzarol 2012 all rights reserved
The Evolution of Strategic Technology Management
Source: Ansoff (1987)
Complexity
Production Orientation
Production Driven
Market Driven
Technology Driven
Entrepreneurial Process focused
1900
Time
1910 1920 1930 1940 1950 1960 1970 1980 1990 2000
Entrepreneurial Strategic focused

The University of Western Australia © Mazzarol 2012 all rights reserved
Key Elements of Innovation Management
Inputs
• People
• Physical & financial resources
• Tools
Knowledge Management
• Idea generation
• Knowledge repository
• leadership
Innovation Strategy
• Strategic orientation
• Leadership
Organisation & Culture
• Culture
• Structure
Portfolio Management
• Risk/return balance
• Optimisation tool use
Project Management
• Project efficiency tools
• Communications
• Collaboration
Commercialisation
• Market research
• Market testing
• Marketing & Sales
Source: Adams, Bessant & Phelps (2006)

The University of Western Australia © Mazzarol 2012 all rights reserved
Innovator types for new
technology-based firms
Source: Autio & Lumme, 1998

The University of Western Australia © Mazzarol 2012 all rights reserved
Technological Innovations
Technological Product Innovation
• The implementation / commercialisation of a product with improved performance characteristics such as to deliver objectively new or improved services to the consumer
Technological Process Innovation
• The implementation / adoption of new or significantly improved production or deliver methods. It may involve changes in equipment, human resources, working methods or a combination of these.
Source: OECD (2000)

The University of Western Australia © Mazzarol 2012 all rights reserved
How to Spot Disruptive Innovations

The University of Western Australia © Mazzarol 2012 all rights reserved
Discussion
What is disruptive innovation?
What is the role of technology in
disruptive innovation?
Who is responsible for disruptive
innovations and how might you spot
them?

The University of Western Australia © Mazzarol 2012 all rights reserved
Commercialisation of Disruptive Technologies – Key considerations
Consider the readiness of the market.
Consider the end user.
Beware existing market players.
Look for market gaps.

The University of Western Australia © Mazzarol 2012 all rights reserved
Case Study – How Red Bull built
a brand
Launched in Europe 1987 by Austrian businessman
Dietrich Mateschitz.
Initial target markets
• sports people
• Fire fighters
• Construction workers
Breakthrough was trendy night club scene
• 80 mgs caffeine per can
• No heat less gas than Coke & Pepsi
Image ‘cool’ & different
Launched in USA 1997
• Sophisticated brand positioning
• Entry point San Francisco Bay Area
• ‘Viral’ marketing strategy – Trendy night clubs & gyms
• 70% US Energy drinks market by 2001
• Annual sales of US$140 million
Source: Noonan (2001)

The University of Western Australia © Mazzarol 2012 all rights reserved
Strategies for Disruptive Technologies
Three critical tests:
1. Does the innovation target
customers who in the past
haven’t been able to ‘do it
themselves’ for lack of money
or skills?
2. Is the innovation aimed at
customers who will welcome a
simple product?
3. Will the innovation help
customers do more easily and
effectively what they are
already trying to do?
Source: Christensen, Johnston & Rigby (2002)
The University of Western Australia © Mazzarol 2012 all rights reserved
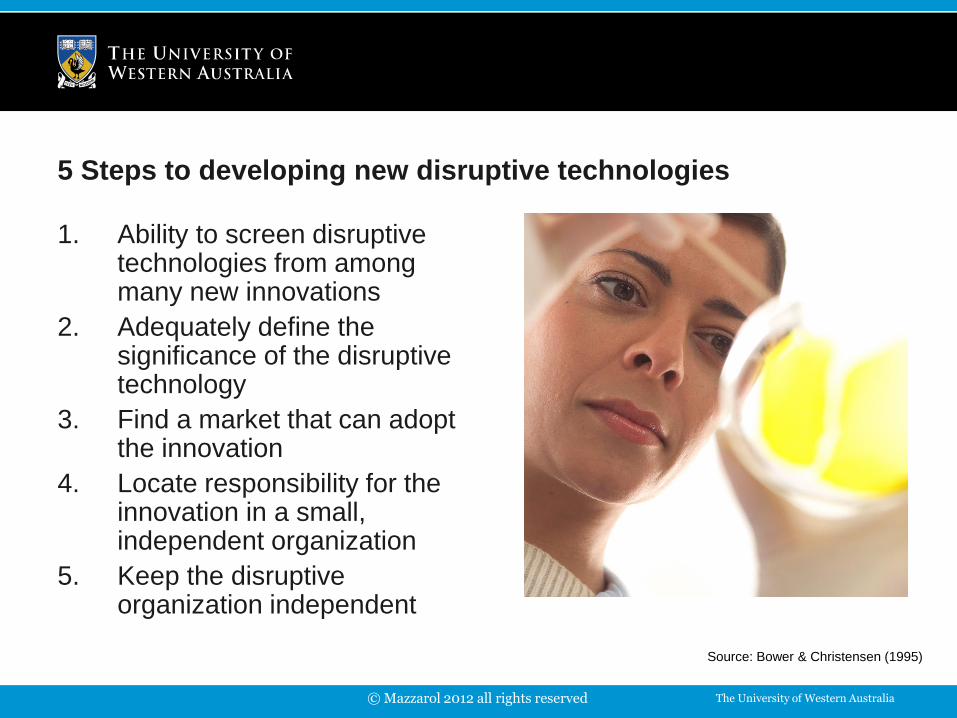
5 Steps to developing new disruptive technologies
1. Ability to screen disruptive technologies from among many new innovations
2. Adequately define the significance of the disruptive technology
3. Find a market that can adopt the innovation
4. Locate responsibility for the innovation in a small, independent organization
5. Keep the disruptive organization independent
Source: Bower & Christensen (1995)
The University of Western Australia © Mazzarol 2012 all rights reserved
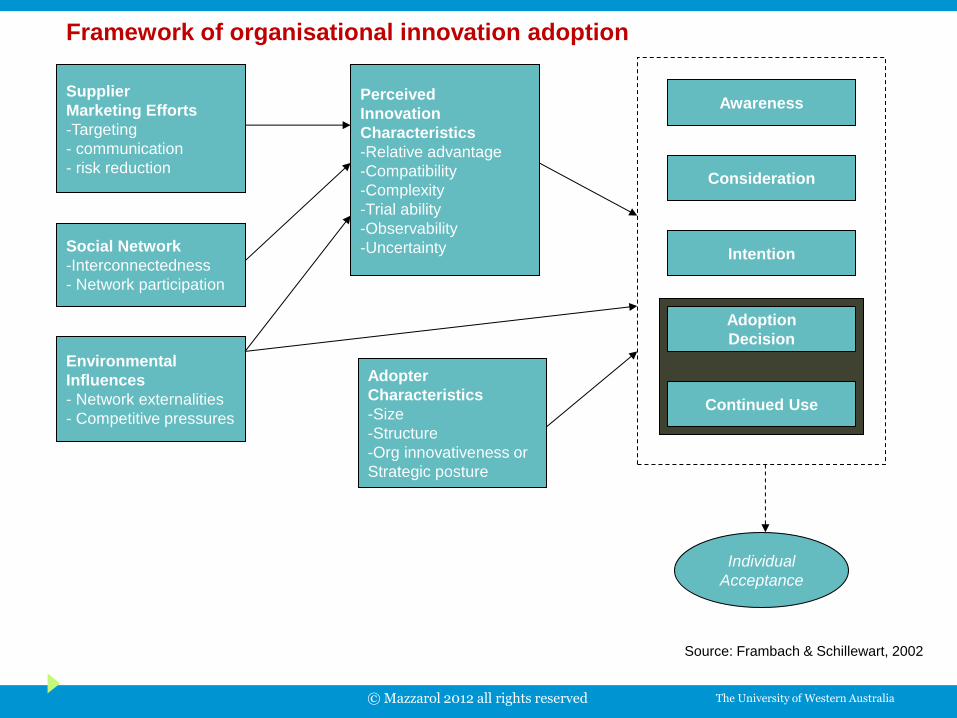
Supplier
Marketing Efforts
-Targeting
- communication
- risk reduction
Social Network
-Interconnectedness
- Network participation
Environmental
Influences
- Network externalities
- Competitive pressures
Perceived
Innovation
Characteristics
-Relative advantage
-Compatibility
-Complexity
-Trial ability
-Observability
-Uncertainty
Adopter
Characteristics
-Size
-Structure
-Org innovativeness or
Strategic posture
Awareness
Consideration
Intention
Adoption
Decision
Continued Use
Individual
Acceptance
Source: Frambach & Schillewart, 2002
Framework of organisational innovation adoption
The University of Western Australia © Mazzarol 2012 all rights reserved
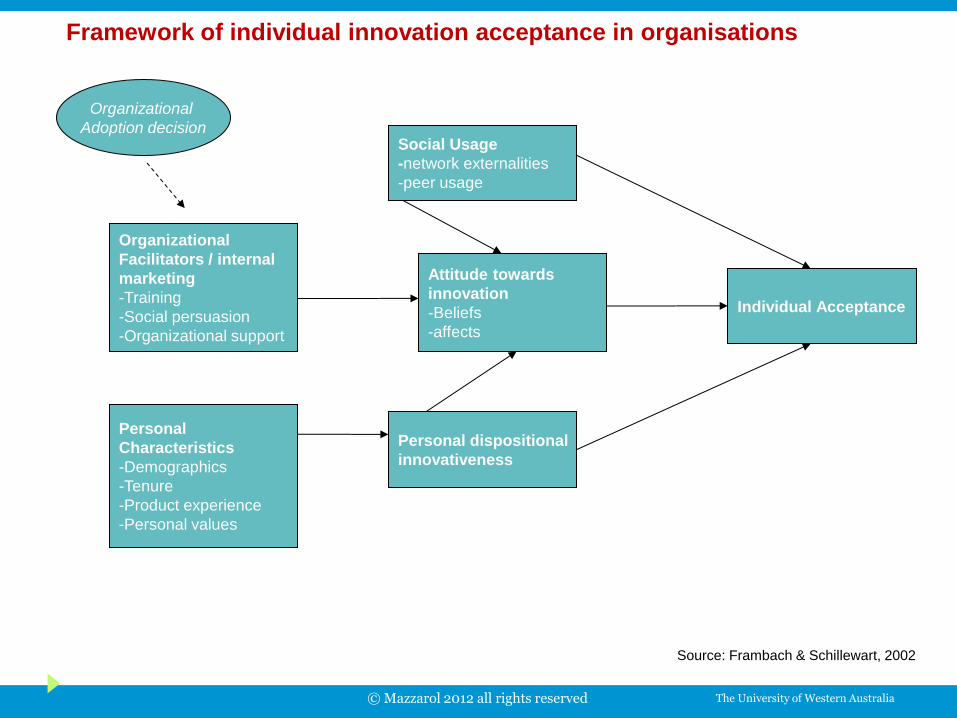
Organizational
Facilitators / internal
marketing
-Training
-Social persuasion
-Organizational support
Personal
Characteristics
-Demographics
-Tenure
-Product experience
-Personal values
Attitude towards
innovation
-Beliefs
-affects
Organizational
Adoption decision
Source: Frambach & Schillewart, 2002
Personal dispositional
innovativeness
Social Usage
-network externalities
-peer usage
Individual Acceptance
Framework of individual innovation acceptance in organisations

The University of Western Australia © Mazzarol 2012 all rights reserved
New Value
Curve
What factors should be reduced well below the industry standard?
Reduce
What factors should be raised well beyond the industry standard?
Raise
What factors should
be created that the
industry has never
offered?
What factors should
be eliminated that the
industry has taken
for granted?
Eliminate Create
Source: Chan Kim & Mauborgne, 1996

The University of Western Australia © Mazzarol 2012 all rights reserved
Shifting the Focus of Strategy
The conventional
boundaries of
competition
Industry
Strategic group
Buyer group
Scope of product
& service offerings
Functional emotional
orientation of an
industry
Time
HEAD TO HEAD COMPETITION
Focuses on rivalry within its
industry
Focuses on competitive position
within strategic group
Focuses on better serving the
buyer group
Focuses on maximizing the
value of product and service
offerings within the bounds of
its industry
Focuses on improving price –
performance in line with the
functional – emotional
orientation of its industry
Focuses on adapting to external
trends as they occur.
CREATING NEW MARKET SPACE
Looks across substitute industries
Looks across strategic groups
within its industry
Redefines the buyer group of the
industry
Looks across to complimentary
product and service offerings that go
beyond the bounds of its industry
Rethinks the functional – emotional
orientation of its industry
Participates in shaping external
trends over time.
Source: Chan Kim & Mauborgne, 1996

The University of Western Australia © Mazzarol 2012 all rights reserved
3D Printing as a Disruptive Technology

The University of Western Australia © Mazzarol 2012 all rights reserved
3D Printing Machines
AirWolf 3D Printer Z Corp Spectrum Z510 3D Printer
Reprap 2.0 “Mendel” 3D Printer
3D printed titanium aircraft engine parts

The University of Western Australia © Mazzarol 2012 all rights reserved
Discussion
What is the likely impact of 3D printing
(additive manufacturing) on traditional
manufacturing?
What are the key innovations in the
business models of Quirky and
Shapeways?
What do these cases suggest about the
future of global production systems?

The University of Western Australia © Mazzarol 2012 all rights reserved
Case Study – NTT DoCoMo
NTT DoCoMo, Japan’s
largest telco created the
G3 network “I-Mode”.
Source: Kodama (2002)

The University of Western Australia © Mazzarol 2012 all rights reserved
GBD
(Staff of 70)
Traditional
Organization
(10,625 people)
Promote
Firm-Wide
Knowledge
Management
President Top Management
Team
Mr. Enoki
Formulate
Strategy
Implement
Strategy
Formulate
Strategy
Implement
Strategy
Stimulate
i-mode market
Expand
i-mode market
Incremental Change
Loop
Continuous Change
Loop
Expansion of market by integration of strategies
GBD
•Entrepreneurial strategy
• Time-pacing
• Strategic community management
• Tight-Loose coupling structure
• Challenging culture (autonomy & Flexible)
•Creation of new core competencies
Traditional Organization
• Deliberate strategy
• Event-based pacing
• Incremental reform & change
• Tight-coupling structure
• Strict culture with tradition, discipline
• Enhances existing core competencies
Strategy
Organizational Structure
& Culture
Core competencies

The University of Western Australia © Mazzarol 2012 all rights reserved
Other Companies
• Terminal manufacturers
• Sony Corporation
• Sun Microsystems
Customers (IPs)
Traditional
Organization
GBD
Community B
(Portal Community)
Community A
(In-House
Community)
Community C
(Technical
Community)
Community D
(Platform Community)
The Company
(DoMoCo)

The University of Western Australia © Mazzarol 2012 all rights reserved
Perf
orm
ance
Time
Current performance of potentially
disruptive technology
Expected trajectory of
performance improvement
Performance improvement
required by mainstream market
HOW TO ASSESS DISRUPTIVE TECHNOLOGIES
Source: Bower & Christensen, 1995

The University of Western Australia © Mazzarol 2012 all rights reserved ©Mazzarol & Sneddon 2005
Preliminary
Market
Analysis
Preliminary
Technical
Analysis
Preliminary
Production
Analysis
Market
Feasibility
Study
Product
Development
In-house
Product testing
Of prototype
Consumer
Product Testing
(Field Trials)
Independent
Technical
Review
Ongoing product
Review from
customers
Production
Technical/Engineering
Marketing/Business Development
Initial Concept
Generation &
screening
Phase 3 - Production Phase 2 - Development Phase 1 - Ideation
New Product Development Process

The University of Western Australia © Mazzarol 2012 all rights reserved
0
Sales and profits ($)
Growth Maturity Decline Introduction
Sales
Time
Product development stage
Profits
Losses/ investment ($)
PRODUCT LIFECYCLE

The University of Western Australia © Mazzarol 2012 all rights reserved
The Innovation Process is about reducing Risk
An information assembly line
Acceptable level of risk to launch product
Information
Risk

The University of Western Australia © Mazzarol 2012 all rights reserved
The components of the RENT
Length : duration of the exploitation
of innovation
Rate of margin : profit
thanks to the innovation
Volume : sales over a year
Amount of Rent = Volume x Rate x Length
Source: Santi et. al, 2003
The University of Western Australia © Mazzarol 2012 all rights reserved
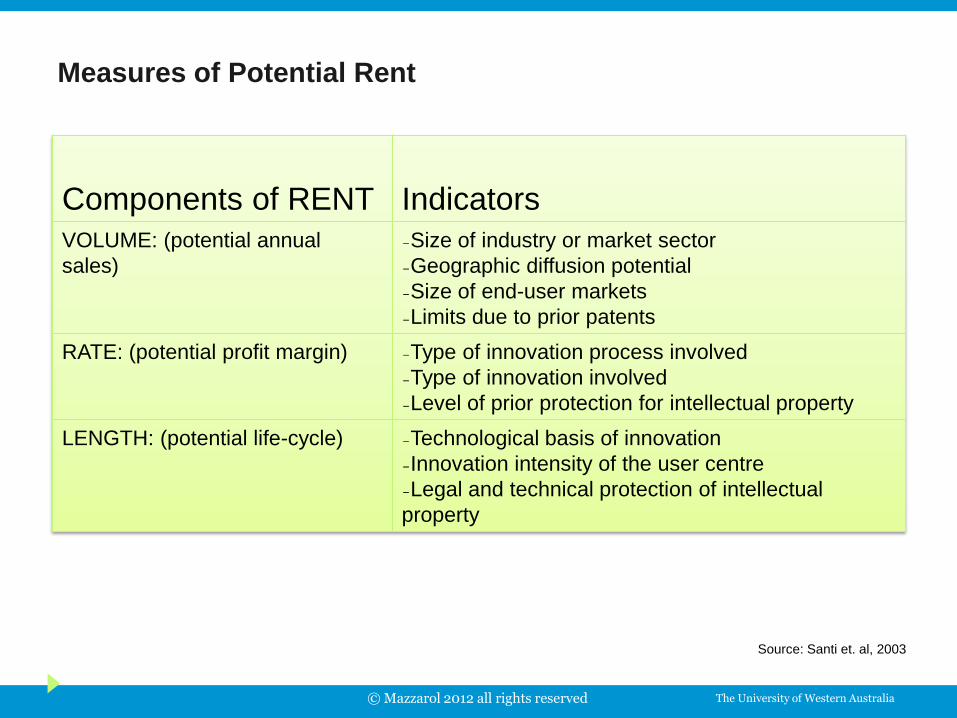
Measures of Potential Rent
Components of RENT
Indicators
VOLUME: (potential annual
sales)
–Size of industry or market sector
–Geographic diffusion potential
–Size of end-user markets
–Limits due to prior patents
RATE: (potential profit margin) –Type of innovation process involved
–Type of innovation involved
–Level of prior protection for intellectual property
LENGTH: (potential life-cycle) –Technological basis of innovation
–Innovation intensity of the user centre
–Legal and technical protection of intellectual
property
Source: Santi et. al, 2003

The University of Western Australia © Mazzarol 2012 all rights reserved
length
rate
volume
++ – –
length
rate
volume
++ – –
– – ++
volume
rate
length
length
rate
volume
++ – –
length
rate
volume
++ – –
length
rate
volume
++ – –
1. Shrimp
3. Gadget
5. Flash in the
pan A
2. Champion
4. Joker
6. Oasis A
length
rate
volume
++ – –
length
rate
volume
++ – –
7. Flash in the
pan B 8. Oasis B

The University of Western Australia © Mazzarol 2012 all rights reserved
Formal
Informal
Operational Strategic
Org
an
isa
tio
na
l C
on
fig
ura
tio
n
[Le
ve
l o
f co
mp
lex
ity,
sca
le &
sco
pe
]
Primary Focus Internal
Primary Focus External
Task Environment
[Level of uncertainty & risk]
Structured Operational Planning
simple
complex
certain uncertain
“The Shopkeeper”
JOKER
“The Salesman”
“The Administrator” “The CEO”
SHRIMP/OASIS FLASH N PAN/GADGET
CHAMPION
Structured Strategic Planning
Ad hoc intuitive Operational Planning
Intuitive Strategic Planning
RENT configurations & Planning
Source: Mazzarol & Reboud 2008
length
rate
volume
++ – –
length
rate
volume
++ – –
length
rate
volume
++ – –
length
rate
volume
++ – –
length
rate
volume
++ – –
length
rate
volume
++ – –

The University of Western Australia © Mazzarol 2012 all rights reserved
New Established
Established
New
Market
Product/ Technology
certain uncertain
simple
complex
“The CEO”
Structured Strategic
Planning Response
“The Administrator”
Structured Operational
Planning Response
“The Shopkeeper”
Unstructured Planning
Response
“The Salesman”
Intuitive Planning
Response
Lowest Risk
Highest Risk
Static Traditional &
Dominated Innovation
Imitative Innovation
Technology-Based
Innovation
New Technology-Based
Innovation
Strategic Innovation Management
Source: Mazzarol & Reboud (2009)

The University of Western Australia © Mazzarol 2012 all rights reserved
Case Study: Davies-Craig EWP
Davies-Craig Pty Ltd
Australian automotive
engineering firm
Pioneer of electric radiator
fans (1970s)
$1.2 million invested in new
Electric Water Pump
More power, lower fuel
consumption, longer engine
life
Can be retrofitted to existing
vehicles for around $280.
Source: Davies-Craig, 2003

The University of Western Australia © Mazzarol 2012 all rights reserved
Davies-Craig EWP Problem
Conventional water pumps slaved to engine
Draw excessive power
Don’t work well at idle or in high ambient temperatures
Coolant flow rates fall to around 20 litres per min at idle and rise to 180 litres per min at speed
Inefficient due to poor flow control rates leading to higher engine wear and low power output
Source: Davies-Craig, 2003

The University of Western Australia © Mazzarol 2012 all rights reserved
Low cost, highly reliable,
De-facto automotive standard
but: high torque loss at high
rpm, low flow rate at low rpm
Electric Water
Pump
Belt-driven Water Pump P
erf
orm
ance
Time
Low torque loss,
Cools as and when needed,
High cost,
Good, but not excellent reliability
Only to -20degC?
Cope with debris in coolant?
Improved reliability,
Reduced cost Niche markets:
Racing cars
Vintage cars
HOW TO ASSESS DISRUPTIVE TECHNOLOGIES – Davies-Craig EWP
• Initial target markets racing & vintage car owners
• These segments are early adopters
• Racing cars value power over price
• Vintage car owners value engine life over price
Source: Davies-Craig, 2003