business strategy, economic growth, and earnings … strategy, economic growth, and earnings quality...
TRANSCRIPT
1525 1/16/15
Business strategy, economic growth, and earnings quality
Muhammad Nurul Houqe*
School of Accounting & Commercial Law Victoria Business School
Victoria University of Wellington Email:[email protected]
Ryan Kerr
School of Accounting & Commercial Law Victoria Business School
Victoria University of Wellington Email: [email protected]
Reza Monem
Griffith Business School Department of Accounting, Finance and Economics
Griffith University, Nathan Campus Brisbane, QLD 4111, Australia
Email: [email protected]
* Contact author
We are very grateful for the valuable comments from participants at the 4th Conference on Financial Markets and Corporate Governance, 2013; two anonymous reviewers for and participants at the 37th Annual Congress of European Accounting Association (EAA), and participants at the 2014 conference of the Accounting and Finance Association of Australia and New Zealand.
1

1524 1/16/15
Business strategy, economic growth, and earnings quality
Abstract Using the Miles and Snow strategy typology (Miles, R., & Snow, C. (1978).
Organizational strategy, structure, and process. New York: McGraw-Hill), we investigate whether
business strategy is associated with the quality of reported earnings. In two samples of U.S. listed
firms, we predict and find that defender-strategy firms exhibit higher levels of earnings
management and prospector-strategy firms exhibit higher levels of accounting conservatism.
However, this relation between business strategy and earnings quality is reversed during periods
of high economic growth. In high-growth periods, while prospector-strategy firms exhibit lesser
accounting conservatism, defender-strategy firms exhibit lesser earning management. Our findings
provide direct evidence of the link between business strategy, economic growth, and earnings
quality.
Keywords Business strategy; Earnings quality; Economic growth; Accounting conservatism; Earnings management JEL Classification M41, M42, M48
2

1524 1/16/15
Business strategy, economic growth, and earnings quality
1 Introduction
Over the last two decades or so, a burgeoning literature has emerged which examines the measures,
determinants, and consequences of earnings quality (see Dechow et al. 2010). However, Dechow
et al. (2010, p. 345) posit that we know very little of how fundamental firm performance affects
earnings quality. In particular, studies measuring earnings quality from reported earnings often fail
to distinguish between the impact of fundamental earnings on earnings quality from the impact of
the measurement system (Dechow et al. 2010). Thus, any study of earnings quality without
considering the fundamental earnings process is incomplete or misleading as best. In this paper,
we investigate the role of business strategy in determining earnings quality.
We argue that the business strategy1 adopted by a firm affects its fundamental performance
which in turn affects the quality of reported earnings. To the extent that investment decisions and
accounting choices are jointly made (Watts and Zimmerman 1990), earnings quality potentially is
a function of business strategy because investing and operating decisions flow from business
strategy.
Using the Miles and Snow (1978) strategy typology and an objective strategy-proxy based on
Snow and Hrebiniak (1980), we document that defender-strategy firms exhibit higher levels of
earnings management and prospector-strategy firms exhibit higher levels of accounting
conservatism. We also examine the role of wider economic environments on the relation between
business strategy and earnings quality. Financial reporting behaviors of prospector-strategy firms
and defender-strategy are reversed during high economic growth periods. We find that, during
high economic growth periods, prospector firms exhibit lesser accounting conservatism whereas
defender firms exhibit lesser earnings management.
1 In this paper, we focus on business-level strategy (i.e., “How do we compete in this business?”) as opposed to corporate-level strategy (i.e., “What businesses should we engage in?”) (Hofer and Schendel 1978; Snow and Hambrick 1980). In other words, corporate-level (business-level) strategy refers to inter-industry (intra-industry) variations in firms’ strategies (Beard and Dess 1981).
3
1524 1/16/15
We analyzed two samples of U.S. listed companies over the period 1999-2009. In particular,
we analyzed 23,390 firm-years for testing the association between earnings management and
business strategy, and 14,729 firm-years for testing the relation between accounting conservatism
and business strategy. Our primary measure of accounting conservatism is Givoly and Hayn’s
(2000) measure of non-operating negative accruals. Our primary measure of earnings management
is the absolute discretionary accruals based on the Modified Jones model (Dechow et al. 1995).
The results on these two samples are consistent with our predictions. The main results are robust
to several sensitivity tests, including alternative proxies for accounting conservatism and earnings
management, alternative coding of business strategy, and alternative samples.
This study contributes to both the earnings quality literature and the business strategy literature.
To date, we are aware of only one accounting study that links business strategy with some measure
of earnings quality. Bentley et al. 2013 document that business strategy is related with financial
reporting irregularities and audit fees. Thus, our study contributes to a very thin literature linking
business strategy with earnings quality. We also show that the relation between business strategy
and earnings quality is altered during high-growth periods of the economy. Our results have
implications for investors, security analysts, and auditors.
The paper proceeds as follows. In Section 2, we discuss business strategy in general and
develop hypotheses by exploring the link between business strategy and earnings quality. Section
3 proposes the research methodology. Section 4 discusses the sample selection procedure and
provides descriptive statistics. In Section 5, we discuss our test rests. Section 6 reports various
sensitivity tests. In Section 7, we offer some conclusions.
2 Business strategy and financial reporting
2.1 Business strategy
Researchers at the Harvard Business School introduced the concept of strategy in organizational
literature and advanced the concept profoundly during the 1950s (Snow and Hambrick, 1980).
Chandler defines strategy as “the determination of the basic long-term goals and objectives of the
enterprise and the adoption of resources necessary for carrying out these goals” (1962, p. 13).
Mintzberg (1987) argues that an organizational strategy alludes to a firm’s plans, patterns,
4

1524 1/16/15
positions, and perspectives. We view business strategy as a consistent set of decisions that defines
how a firm competes within a given product market.
Although there are diverse views on what exactly constitutes a strategy, researchers agree on
distinguishing between strategy formulation and strategy implementation as two distinct phases of
a strategy (Snow and Hambrick, 1980). This distinction is important because it allows researchers
to observe and measure strategy based on firm-level quantitative data. As such, we measure
realized strategy at the firm level (in hindsight) irrespective of the strategy formulation process.
We concentrate on strategy implementation and measure business-level strategy via
objective indicators as proposed by Snow and Hambrick (1980). Snow and Hrebiniak (1980) note,
“the typology of Miles and Snow (1978) is the only one that characterizes an organization as a
complete system, especially its strategic orientation” (p. 318). The Miles and Snow (1978)
typology classifies firms into prospectors, defenders, analyzers, and reactors, depending on the
firm’s market orientation. Miles and Snow (1978) and Simons (1987) note that prospector and
defender strategies are the most dominant types. Snow and Hambrick (1980) examine the different
methods for the categorization of firm strategy within this typology and propose (amongst other
categorization options) the examination of strategy using ‘objective indicators’ based on the
collection of financial data of sample firms.
Employing ‘objective indicators’ for measuring business-level strategy has other merits.
First, unlike other approaches, this approach controls for perceptual, and to a lesser extent,
interpretive bias (Snow and Hambrick, 1980). Second, this approach is relatively well-suited for
identifying implemented or realized strategies (Snow and Hambrick, 1980). Third, this approach
is commonly used by strategy researchers (e.g., Miller and Friesen, 1978; Venkatraman and Grant,
1986).
We build on Snow and Hambrick’s (1980) proposal by using objective data to classify
firms based on how well they fit with the two strategy orientations: prospectors and defenders.
Miles and Snow (1978) and Hambrick (1983) note that prospector firms have a stronger
commitment to product development and innovation, and frequently alter their products and
markets. These firms thrive in business environments that are somewhat unpredictable and succeed
by exploring the market continuously for new opportunities. Further, these firms often encourage
5

1524 1/16/15
innovation over efficiency. In contrast, defender firms stress efficiency of operations and low
levels of product development or focus on a strong defense of their existing marketplaces (Miles
and Snow 1978). Hambrick (1983) describes defenders as firms which tend to compete mainly on
price, delivery, or quality; defenders make large investments in process engineering; they have
mechanistic structures, and they are run primarily under the influence of production and
accounting executives. Defender firms promote efficiency over innovation, and they often build
cost efficiency through vertical integration. These firms thrive in environments that change slowly.
Readers are referred to Miles, Snow, Meyer, and Coleman (1978) for a fuller treatment on all the
four strategy types.
2.2 Business strategy and firm performance
Because business strategies are about how a business competes in a product or service market,
they directly influence the revenue generation process and the expenses incurred in generating the
revenues. The relation between business strategy and fundamental firm performance is well
documented in the management literature (e.g., Beard and Dess 1981; Stimpert and Duhaime 1997;
Richard 2000; Williams et al. 1995; Woolridge and Snow 1990; Zahra and Covin 1993). Because
a lengthy review of this literature is beyond the scope of this study, we discuss a few studies as
examples.
For example, analyzing 767 strategic investment decisions in the U.S., Woolridge and Snow
(1990) provide evidence that investors react positively to public announcements of strategic
investment decisions. Similarly, Beard and Dess (1981) document that business-level strategy can
significantly explain variations in firm profitability. Also, there is evidence that business-level
strategy affects the strength of the relationship between firm performance and technology policies
(Zahra and Covin 1993). Moreover, using a sample of 85 firms in a fabric industry, Williams et
al. (1995) document that business strategies are related with manufacturing strategy which is
related to firm performance.
Stimpert and Duhaime (1997) propose a model that firm performance is directly influenced by
the level and intensity of R & D expenditures and capital investments. In particular, investments
that result in new products or improvements in production methods allow businesses to charge
higher prices or enjoy lower costs than their rivals (Stimpert and Duhamime 1997). On the other
6
1524 1/16/15
hand, process R & D and investments and improvements in production processes lead to lower
unit cost. Thus, business-level strategy contributes to fundamental firm performance through both
cost leadership and product differentiation.
In sum, there is robust evidence in the management literature that business-level strategy
directly influences the fundamental earnings performance of a firm.
2.3 Business strategy and earnings quality
As discussed in Section 2.1, prospector firms make a stronger commitment to product development
and innovation (Hambrick 1983; Miles and Snow 1978). These firms thrive in innovative
industries and growing markets. Prospector firms always experiment with developing new
products, improving existing products, and entering into new markets. These activities require
continuous and substantial commitment to R & D expenditures, and marketing-related
expenditures. Ability to deliver innovative and superior products allows prospector firms to charge
premium price on their products. Thus, their fundamental earnings model can absorb large amounts
of discretionary expenditures such as R & D and marketing. Besides, their continuous commitment
to R & D and marketing suggests that, from efficiency perspectives, these expenditures be
recognized as expenses or losses in a timely manner. Recognizing R & D and marketing expenses
in a timely manner is efficient for prospector firms because capitalizing them for a while and
expensing them later may create more volatility in their reported earnings numbers damaging their
credibility as prospectors (i.e., ability to design and deliver superior products and services). Thus,
prospector firms are likely to book all discretionary expenses associated with product and market
development in a timely manner inducing some conservatism in their reported earnings.
On the other hand, defender firms thrive in industries and markets which are stable. Stability
and predictive nature of the industry and the market create a pressure for defender firms to produce
a stream of earnings that is relatively smooth and predictable. Thus, owners of firms that adopt
defender strategies would prefer smoother earnings because defender firms are likely to be seen
by investors as inherently more stable and less risky investments to hold. These investor
expectations will create incentives for the management of defender firms to make accounting
choices that help in meeting investors’ expectation of firm performance. Moreover, in stable and
predictable economic environments, volatility of earnings would be punished by investors
7

1524 1/16/15
ultimately damaging the career prospects of managers in defender firms. Thus, in defender firms,
there are strong incentives for earnings management to produce smooth earnings numbers.
The above discussion leads us to the following hypotheses:
H1: Ceteris paribus, prospector firms are more likely to adopt accounting conservatism than
defender firms.
H2: Ceteris paribus, defender firms are more likely to engage in earnings management than
prospector firms.
2.4 Economic growth and earnings quality
In forming strategies, a firm always needs to consider the wider market, industry, economic, and
regulatory environments. Specifically, changes in the external environments of the firm are likely
to change the supply and demand forces in the product market in which the firm is competing.
Hence, realized strategy of firms will be, in part, dependent on the ongoing and changing emerging
strategy where firms seek to respond to changes in the firm’s external environment (Mintzberg
1987). This point is supported by the resource dependency theory which holds that environmental
and external influences shape a firm and firms will alter strategy in response to economic (and
regulatory) events (Pfeffer and Salancik 1978).
Further, changes in a firm’s external environment influence existing relations between firm
characteristics and accounting decision making (Ball et al. 2000; Leuz et al. 2003). Changes in the
wider economic environment such as economic growth or decline are likely to affect the
fundamental earnings process of the firms in the economy. A growing economy may create
incentives for prospector firms to report earnings that meet investors’ expectations. On the other
hand, in a growing economy, defender firms may feel less pressure to manage earnings due to
natural sales growth. Thus, macro-economic conditions may alter the relationship between
business strategy and earnings quality. Thus, we hypothesize that:
H3: The wider economic environment alters the relation between business-level strategy and
earnings quality.
8
1524 1/16/15
3 Research methodology
First, we examine the level of accounting conservatism present within the annual financial
statements. Consistent with prior research (e.g., Artiach and Clarkson 2011, 2014), we interpret
conservatism as a function of the firm’s cumulative accounting policies which arise from both
discretionary and mandatory policy decisions. Our proxy for accounting conservatism is based on
Givoly and Hayn’s (2000) measure of negative non-operating accruals. They argue that
conservative accounting results in persistently negative accruals and more negative accruals reflect
more conservative accounting. Without management intervention, accruals are expected to reverse
over time. Hence, persistent cumulative negative accruals represent a conservatism bias within the
firm’s accounting system rather than the transitory nature of accruals (Artiach and Clarkson 2014).
We focus on non-operating accruals because operating accruals likely reflect firms’ economic
characteristics unrelated to conservatism (Givoly and Hayn 2000). To capture the persistence in
accumulated accruals over a sufficiently long period, we use a six-year window, consistent with
Ahmed et al. (2002), Artiach and Clarkson (2014), and Francis et al. (2004). Thus, our accounting
conservatism measure is:
𝐶𝐶𝐶𝐶𝐶𝐶𝑖𝑖𝑡𝑡 = −1𝑋𝑋 �16∑ 𝑁𝑁𝑁𝑁𝑁𝑁𝑁𝑁𝑁𝑁𝑖𝑖𝑖𝑖
𝑇𝑇𝑁𝑁𝑖𝑖𝑖𝑖6𝑡𝑡=1 � (1)
where NOPACit is non-operating accruals and TAit is total assets, both for firm i at fiscal year-end
t. Similar to Artiach and Clarkson (2014), we multiply the average accruals by -1 to produce a
measure that is increasing in conservatism. We use this proxy to investigate any possible relation
between strategy and accounting conservatism as stated in H1. Specifically, we employ the
following econometric model:
CONit = β0 + β1STRTit + β2LN_ASSETSit
+ β3F_LEVit + β4G_SALESit + β5M_RISKit + Industry and Year controls + εit (2)
where:
STRTit = business strategy of firm i in year t; adopting the Snow and Hambrick (1980) typology, we create a composite strategy score for each firm. The composite score is constructed using the ratio of research and development to sales, the ratio of research and development expense per employee (Hill and Snell 1988), the ratio of employees to sales, and the Market to Book
9

1524 1/16/15
ratio. Composite scores range from 4 to 16 with firms under 10 considered to be defenders and firms scoring 10 or over considered to be prospectors;2
LN_ASSETS = natural logarithm of total assets of firm i in year t; F_LEV = the year-end total liabilities scaled by year-end total assets of firm i in year
t; G_SALES = sales growth rate, defined as the sales in current year minus sales in
previous year and divided by sales in prior year for firm i in year t; G_PPE = the growth rate of gross property plant and equipment (PPE), defined as
the gross PPE in current year minus the gross PPE in prior year and divided by the gross PPE in prior year for firm i in year t;
M_RISK = is a measure of systematic risk which shows the relationship between the volatility of the stock and the volatility of the market. This coefficient is based on percentage changes in month-end stock price between 23 and 35 consecutive months and their relativity to a local market index;
Industry controls
= dummy variables to capture industry differences in accounting conservatism; and
Year controls
= dummy variables to capture year-to-year differences in accounting conservatism.
Then we examine the level of earnings management present in annual financial statements using
the proxy ׀DACCRit׀ which is the absolute value of discretionary accruals of firm i in year t in the
Modified Jones model (Dechow et al. 1995). We use this proxy to investigate any possible relation
between business strategy and earnings management as stated in H2. We employ the following
econometric model:
ά0 + ά1STRTit + ά2LN_ASSETSit + ά3F_LEVit + ά4G_SALESit = ׀DACCRit׀+ ά5G_PPEit + ά6CFOit + ά7LOSSit + Industry and Year controls + εit (3)
where:
2 The coding procedure to classify the firms into the two strategy categories was as follows. First, we computed an eight-year average for each of the four strategy proxies listed in Section II. Second, we divided each strategy-proxy into four quartiles and assigned a score of 1 (the lowest quartile, representing traits of a defender) to 4 (the highest quartile, representing traits of a prospector). Finally, a composite strategy score was computed by adding the scores of a firm across the four proxies. Thus, to get a score of 10, a firm has to score a 3 in at least two proxies with the weakest individual proxy score of 2 (i.e., 3 + 3 + 2 +2 = 10) or a 4 in at least one proxy if the weakest individual score is 1 (i.e., 4+3+2+1=10).
10
1524 1/16/15
G_PPE = the growth rate of gross PPE, defined as gross PPE in current year minus gross PPE in previous year and divided by the gross PPE in prior year for firm i in year t;
CFO = operating cash flows for firm i in year t scaled by total assets; LOSS = loss takes the value of 1 if firm i in year t reports negative income before
extraordinary items and 0 otherwise.
All other variables are as defined earlier.
Our choice of control variables in models (2) and (3) is guided by prior research. We control
for company size (LN_ASSETS) following evidence in Francis and Wang (2008) and Khan and
Watts (2009) that larger firms tend to have lower levels of accruals than smaller firms and that
larger firms tend to have greater conservatism. Leverage (F_LEV) controls for the likelihood of
bankruptcy and the possibility of a debt covenant violation which incentivizes firms to engage in
accruals-based earnings management (Francis & Wang 2008). Prior research also suggests that
more leveraged firms are subject to a higher contracting demand for accounting conservatism
(Watts 1993; Watts 2003). We control for firm growth through the variables G_SALES and
G_PPE. Higher growth could increase firms’ demand for accounting conservatism as well as
influence yearly accruals use (Francis & Wang 2008; Khan and Watts 2009). Risk (M_RISK)
isolates any relationship present between systematic risk, yearly accruals, and accounting
conservatism. Increased stock volatility is considered to be related to both accounting conservatism
and firm’s accruals use (Khan and Watts 2009; Yaowen et al. 2013).
To test H3, we need a proxy for wider macro-economic environments. We argue that the real
Gross Domestic Production (GDP) growth rates of a country capture the essence of the macro-
economic environments of that country. Business firms regularly monitor and forecast industry
and economic outlooks and accordingly make strategic and operating decisions suitable to a
particular economic environment. For example, in periods of high (low) economic growth,
business firms on average are expected to expand (contract) their operations. We collected the U.S.
real GDP growth rates over the period 1999-2009 from the CIA World Factbook. Through visual
inspection, we categorize the years 1999 (4.1%), 2000 (5%), and 2004 (4.4%) as high-growth
period and the years 2001 (0.3%), 2007 (2%), 2008 (1.1%), and 2009 (-2.6%) as low-growth
period. We consider other years to be moderate-growth period. We are interested to test whether
11
1524 1/16/15
the relation between business strategy and earnings quality changes across high- and low-growth
periods. Hence, we estimate the following models:
CONit = α0 + α1STRTit + α2GDP_Dummy + α3STRT*GDP_Dummy
+ α4LN_ASSETSit +α5F_LEVit + α6G_SALESit + Industry_Dummy + εit (4)
|DACCR|it = ά0 + ά1STRTit + ά2GDP_Dummy + ά3STRT*GDP_Dummy
+ ά4LN_ASSETSit + ά5F_LEVit + ά6G_SALESit + ά7G_PPRit
+ ά8CFOit + ά9LOSSit + Industry_Dummy + εit (5)
where: GDP_Dummy = a binary variable coded 1 for 1999, 2000 and 2004 (high
real GDP growth years in the U.S.) and 0 for 2001, 2007, 2008 and 2009 (low real GDP growth years in the U.S.);
STRT*GDP_Dummy = the interaction term between STRT and GDP_Dummy to capture the effect of the wider macro-economic environments on the relation between business strategy and earnings quality.
All other variables are as defined earlier. Obviously, our variables of interest are STRT and
STRT*GDP_Dummy. In particular, we are interested to know whether the sign of α3 (ά3) differs
from that of α1 (ά1) in model (4) (model (5)) and whether α3 (ά3) is statistically significant. In
models (2) through (5), we follow prior research in selecting control variables to isolate firm
specific factors capable of influencing firms’ accruals or accounting conservatism.
We estimate all our models using ordinary least squares (OLS) regression technique. We
estimate both pooled and annual samples to enhance credibility of our results.
4 Sample and descriptive statistics
We obtained data for U.S. listed companies from the World Scope database for the period 1999-
2009. Initially, we identified 16,740 firm-years for the conservatism (CON) sample and 25,623
firm-years for the earnings management (DACCR) sample.3 For both samples, we then excluded
financial institutions, funds and overseas companies (81 observations in each sample) to keep this
3 For ease of exposition, frequently we refer to these two samples as the CON sample (for testing conservatism) and the DACCR sample (for testing accruals-based earnings management).
12

1524 1/16/15
study within the single regulatory environment of the U.S. and to avoid repeated counting of data
that may take place where a listed company is an investment vehicle or a share fund. Then we
excluded the top 0.5% and the bottom 0.5% observations for each variable as we considered these
to be extreme observations; thus, we excluded 1,565 firm-years data from the DACCR sample and
1,465 firm-years from the CON sample. Finally, we excluded 587 (465) firm-years from the
DACCR (CON) sample because these observations were larger than three times of the absolute
value of studentized residuals. Thus, our final sample is 14,729 (23,390) firm-years for the CON
(DACCR) analysis. The sample selection procedure is presented in Table 1, Panel A.
[INSERT TABLE 1]
Panel B of Table 1 shows sample composition by year. As Panel B reveals, the firm-years are
widely dispersed across the sample period. Table 1, Panel C shows industry composition of firm-
years, which was compiled in accordance with the Industry Classification Benchmark (ICB).4 As
Panel C shows, Technology (31.7%), Industrials (21.9%), Health Care (20.5%) and Consumer
Goods (15.2%) are the four most represented industries in our earnings management (DACCR)
sample. In the accounting conservatism (CON) sample, these industries represent 46.3%, 14.0%,
18.1% and 13.8% of the sample, respectively.
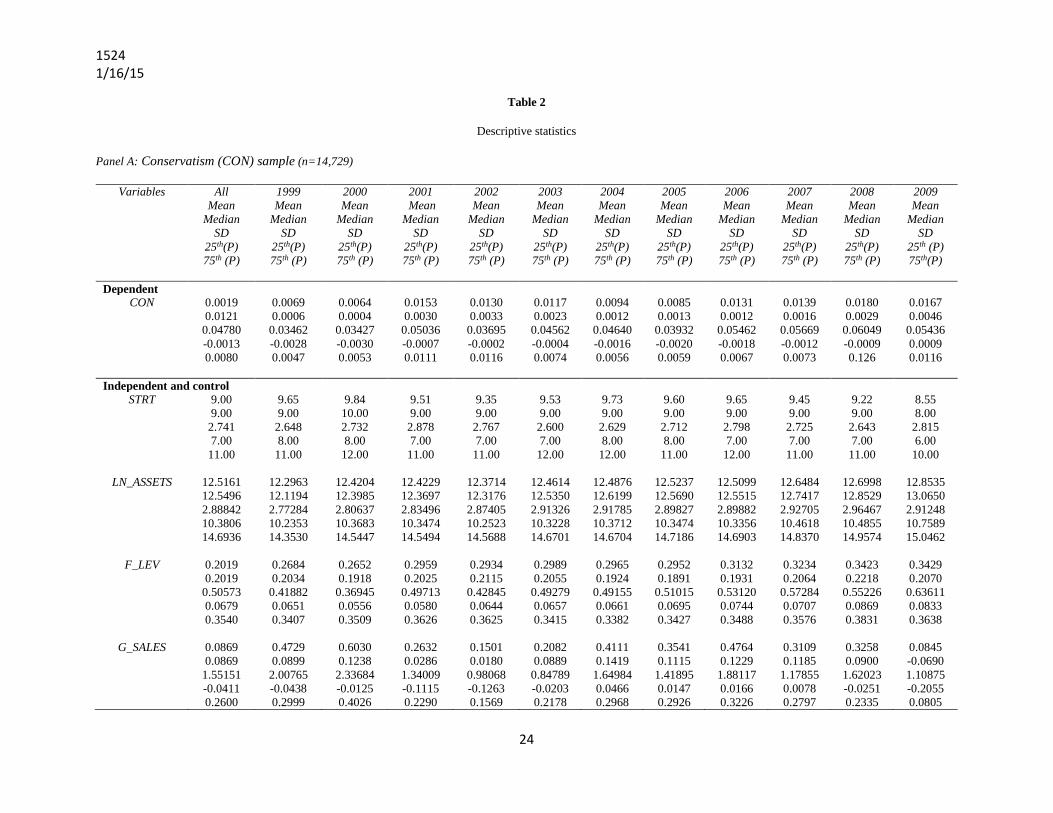
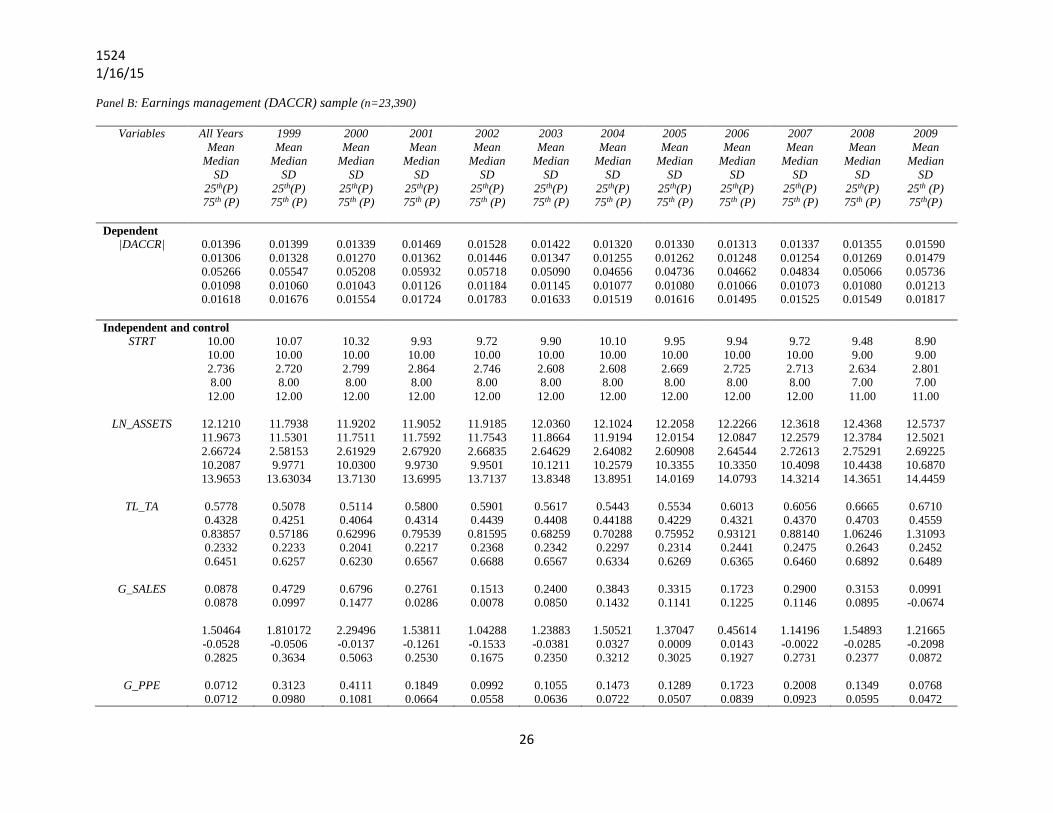
Table 2 presents descriptive statistics of the variables in relation to the conservatism sample
(Panel A) and the earnings management sample (Panel B). As reported in Panel A, the overall
mean (median) metric of conservatism (CON) is 0.0019 (0.0121) with year-to-year variations
ranging from 0.0064 (0.0004) in 2000 to 0.0167 (0.0046) in 2009. The overall mean (median)
score of STRT is 9.00 (9.00) with year-to-year variations ranging from the lowest of 8.55 (8.00) in
2009 to the highest of 9.84 (10.00) in 2000. In Panel B, absolute mean (median) discretionary
accruals, ׀DACCR׀, for the entire sample is 1.396% (1.306%) of total assets with year-to-year
variations ranging from the lowest of 1.313% (1.248%) in 2006 to the highest of 1.590% (1.479%)
in 2009. Absolute mean discretionary accruals have an upward trend during the global financial
crisis (2007-2009) suggesting the presence of greater earnings management in a shrinking
economy. In Panel B, the overall mean (median) score of strategy, STRT, is 10 with year-to-year
variations ranging from the lowest of 8.90 (9.00) in 2009 to 10.32 (10.00) in 2000. In terms of
4 Industry Classification Benchmark (ICB) was jointly developed by Dow Jones and FTSE in 2004. ICB is based on a 4-tier hierarchy and classifies securities into industries, super sectors, sectors and subsectors.
13

1524 1/16/15
strategy type, both panels suggest that an increasing proportion of firms adopted the defender
strategy during the global financial crisis. Moreover, as discussed later in Section 5, the strategy
scores in both the samples are consistent with firms responding to the wider economic environment
as reflected in the U.S. GDP growth rate.
[INSERT TABLE 2]
Table 3 reports the Pearson’s correlation coefficients for all the variables (Panel A: CON
sample; Panel B: DACCR sample). In Panel A, the dependent variable CON is significantly
positively correlated to business strategy, STRT (r = 0.205, p-value <0.001). Such a positive
correlation is consistent with the prediction of H1. CON is significantly positively correlated with
financial leverage (r = 0.408, p-value <0.001), growth in sales revenue, G_SALES, (r = 0.086, p-
value <0.001) and negatively correlated with firm size, LN_ASSETS, (r = -0.338, p-value <0.001),
and firm systematic risk, M_RISK, (r = -0.028, p-value = 0.001). In Panel B, the dependent
variable DACCR is significantly negatively correlated with STRT (r = -0.301, p-value <0.001).
Such a negative correlation is consistent with H2. That is, defender firms (with lower scores in
STRT) engage in more aggressive earnings management. Other results in Panel B suggest that
growing firms (growth in sales revenue and PPE) and firms with larger cash flow from operations
are less likely to engage in earnings management while loss-making firms are more likely to
engage in earnings management.
[INSERT TABLE 3]
5 Results
5.1 Accounting conservatism
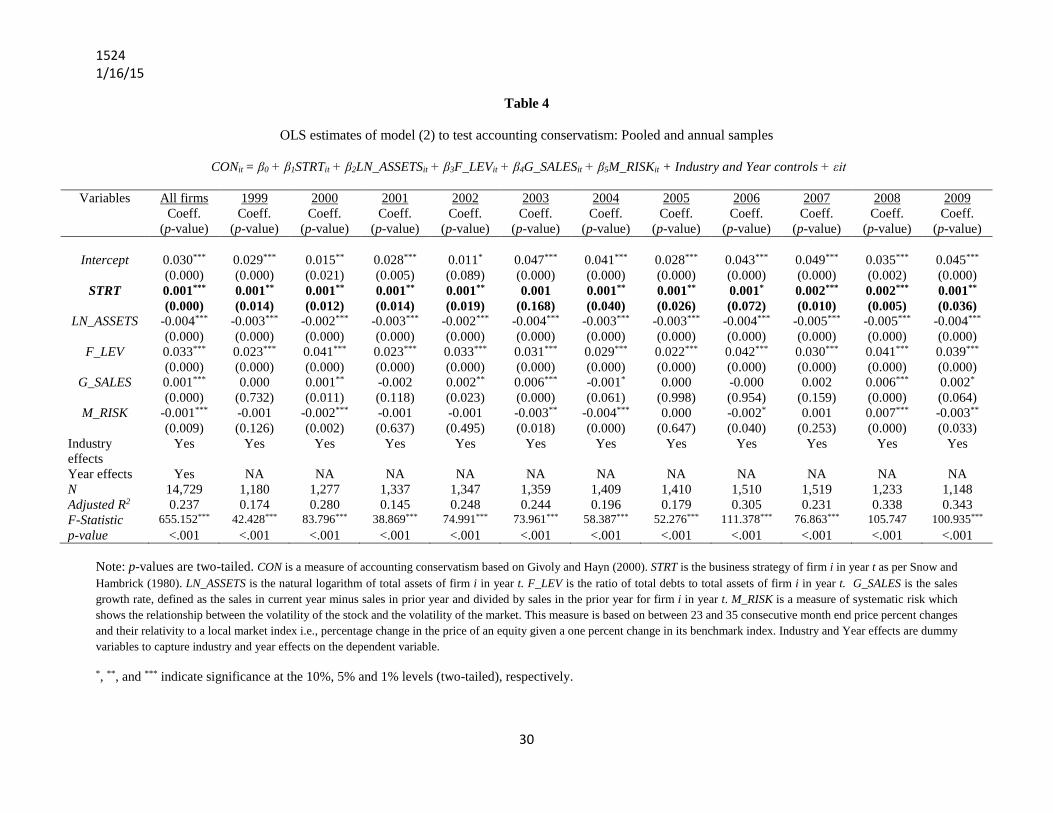
Table 4 presents the results of estimating model (2) on the pooled as well as annual samples. In
Table 4, the coefficient of STRT is statistically significant across all estimates at the 5% or better
levels (two-tailed), 5 except for 2003 and 2006. The coefficient of STRT is not significant at
conventional levels in 2003 while it is significant at the 10% level in 2006. Because we multiplied
our proxy for conservatism by -1 to produce an increasing measure of conservatism, the
consistently positive coefficient on STRT provides evidence supporting H1. That is, prospector
5 All significance tests in this paper are two-tailed.
14

1524 1/16/15
firms are more likely to adopt accounting conservatism than defender firms. Results in Table 4
further suggest that while larger firms (LN_ASSETS) and firms with greater systematic risk
(M_RISK) are less likely to adopt conservatism in reporting, more leveraged firms (F_LEV) and
growing firms (G_SALES) are more likely to adopt accounting conservatism. Thus, while debt
levels may play a monitoring role against aggressive financial reporting, incentives for aggressive
earnings management decline in growing firms (through growth in sales) allowing these firms to
adopt more conservative accounting policies. Further, firms with greater systematic risk cannot
afford to adopt conservatism because these firms are plausibly under pressure to maintain earnings
performance. Overall, the results in Table 4 suggest that firms which have a higher composite
score for strategy (prospector firms) are more likely to have higher levels of accounting
conservatism (CON).
[INSERT TABLE 4]
5.2 Earnings management
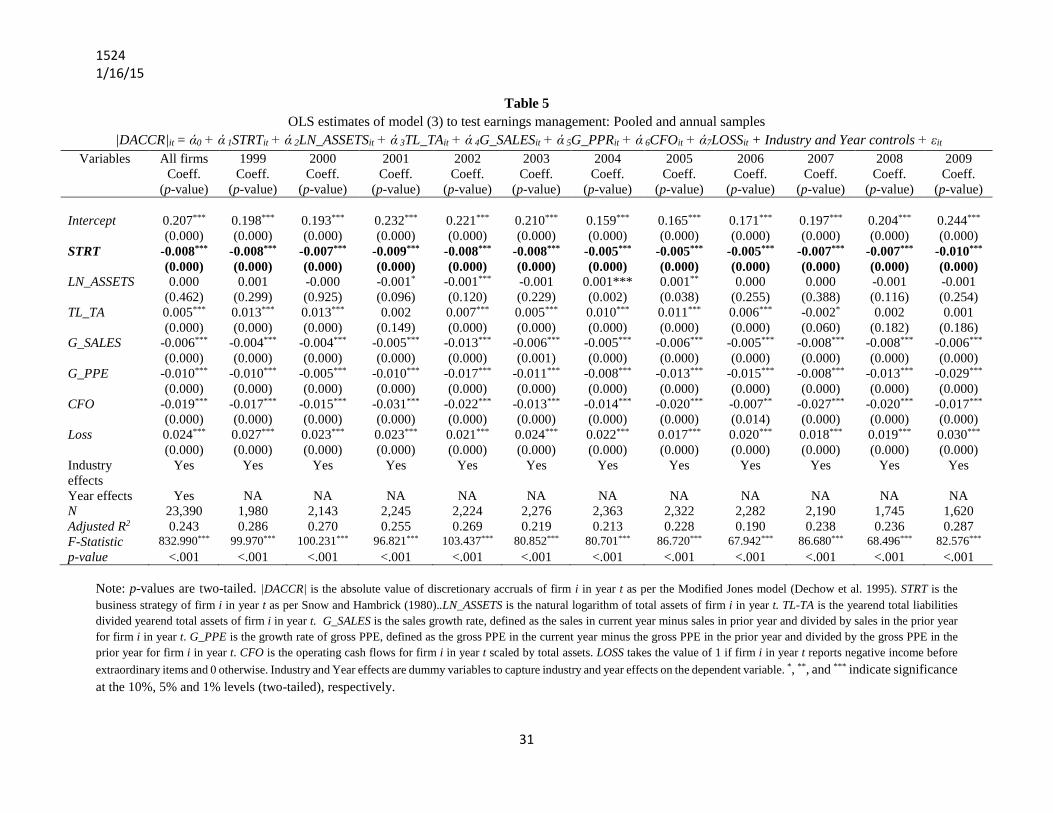
Table 5 reports the results of estimating model (3) on the pooled as well as annual samples over
the period 1999-2009. In Table 5, the coefficient of strategy (STRT) is consistently negative and
statistically significant at the 1% level across all the estimates. These results are consistent with
H2. That is, absolute discretionary accruals are higher for defender firms suggesting earnings
management by these firms. Among other results, the coefficient of LN_ASSETS is negative and
significant at the 10% level only in 2001 and positive and significant at the 1% and 5% levels in
2004 and 2005, respectively. Leverage (F_LEV) appears to be positive and statistically significant
at the 1% level in pooled estimate and most of the annual estimates; notable exceptions are 2007,
2008 and 2009. In 2007, the coefficient becomes negative and significant at the 10% level whereas
it is non-significant in 2008 and 2009. Note that 2007 marks the year for the onset of the GFC and
in 2008 and 2009, the GFC spread throughout Europe and other parts of the world.
In Table 5, the coefficients for G_SALES and G_PPE are consistently negative and statistically
significant at the 1% level across all estimates. Thus, firms experiencing growth in sales and
investments in PPE are less likely to engage in earnings management. Prospector firms, as opposed
to defender firms, are more likely to experience growth in these two areas. Further, firms with
large, positive operating cash flows are less likely, and loss-making firms are more likely to engage
15

1524 1/16/15
in earnings management. Overall, the results in Table 5 provide strong support for H2 that
defender-strategy firms are more likely to engage in earnings management via discretionary
accruals than prospector firms.
[INSERT TABLE 5]
5.3 GDP growth rates, business strategy, and earnings quality
Figure 1 plots the mean strategy scores of the two samples against one-year lagged U.S. real GDP
growth rates over the period 2000-2009. A visual inspection of Figure 1 would suggest that there
is some co-movement between business strategy and the GDP growth rates, especially for the
conservatism (CON) sample. Untabulated Pearson’s correlation test confirms a positive and
significant relation between the two variables (r = 0.107, p <0.001). In untabulated analysis,
regressing mean strategy scores on the annual GDP growth rates over the sample period (1999-
2009) results in 80.2% and 82.7% adjusted R2 in the DACCR and the CON sample, respectively.
The variable GDP growth rate (GDP_Rate) has a positive and significant coefficient in the DACCR
sample (coefficient = 0.158, p < 0.0001) as well as in the CON sample (coefficient = 0.148, p <
0.0001). These results suggest that outlook of the overall economy in the form of GDP growth rate
plays an important role in the formation of business strategies.
[INSERT FIGURE 1]
Table 6 reports the results of estimating models (4) and (5) on the CON and DACCR samples.
We have a smaller sample now (11,286 firms) because we excluded observations related to the
moderate GDP-growth rate years of 2002 (2.4%), 2003 (3.1%), 2005 (3.2%), and 2006 (3.2%).
As shown in Table 6, in the CON sample, the variable STRT is positive and significant at the 1%
level (two-tailed). This result is consistent with the previous results reported in Table 4. That is,
prospector firms, on average, exhibit more accounting conservatism than defender firms.
Interestingly, the negative coefficient of -0.001 (significant at the 1% level) on
STRT*GDP_Dummy suggests that during periods of high GDP growth, prospector firms become
less-conservative in reporting. This is potentially to match with investor sentiments in a strongly-
performing economy. On the other hand, in the DACCR sample, defender firms engage in less
earnings-management during periods of high GDP growth. This behavior of the defender firms is
evidenced by the positive sign on STRT*GDP_Dummy but negative sign on STRT. Thus, during
16
1524 1/16/15
periods of high economic growth, earnings quality of prospector firms declines (less conservatism)
while earnings quality of defender firms improve (less earnings-management). We find consistent
results (untabulated) when we set GDP_Dummy to 1 for low GDP-growth periods. That is, in low-
GDP growth periods, prospector firms become more conservative in reporting whereas defender
firms become more aggressive in earnings management. In summary, we find that prospector and
defender firms behave exactly opposite to each other in relation to financial reporting in both high
and low economic growth periods.
[INSERT TABLE 6]
6 Robustness checks
We conduct additional tests to assess the sensitivity of our main results to alternative proxies for
strategy (STRT), earnings management (DACCR), and accounting conservatism (CON).
6.1 Strategy (STRT) classification
Our strategy (STRT) proxy is inspired by the work of Snow and Hambrick (1980). Zahra & Pearce
(1990) argue that a single proxy for firm strategy is insufficient due to the differences in strategy
across industries which operate in different ways. This argument holds that, due to industry
characteristics, the differences between prospectors and defenders over different industries and
firms may be incorrectly classified when measured in a uniform manner.
In our analysis, we mitigated this concern by incorporating industry-effects to control for any
variation in strategy due to industry characteristics. Further, to ensure that our results are not
driven by the significant presence of the technology sector in our samples, we now exclude the
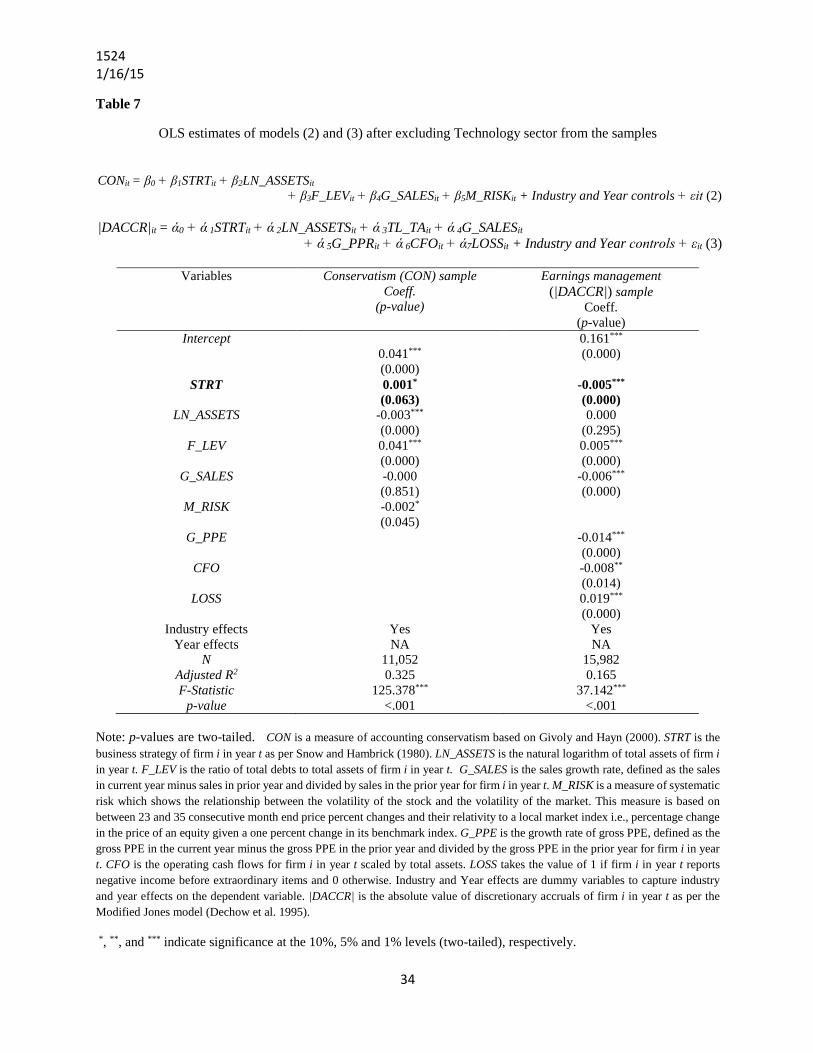
technology sector in re-estimating models (2) and (3). These results are reported in Table 7. We
exclude the technology sector because of the high rate of innovation, market creation, and growth
that would be expected in this industry.
[INSERT TABLE 7]
Results reported in Table 7 are consistent with our main results reported in Tables 4 and 5. In
the CON sample, the coefficient of 0.001 on STRT is still positive but significant only at the 10%
level (two-tailed). In the DACCR sample, the coefficient of -0.005 on STRT is negative and
17

1524 1/16/15
significant at the 1% level (two-tailed). Further, in untabulated tests, we treat strategy as a binary
variable with strategy scores not less than 10 set equal to 1 (i.e., prospector firms) and all other
strategy scores are set equal to zero (i.e., defender firms). We find results consistent with our main
results.
6.2 Alternative measures for accounting conservatism (CON) and earnings management (DACCR)
We use Khan and Watt’s (2009) asymmetric timeliness measure of conservatism as an alternative
proxy for accounting conservatism and the Jones model (1991) as an alternative proxy for earnings
management. Results presented in Table 8, based on these alternative proxies, are consistent with
our main results. In the CON sample, the coefficient of 0.001 on STRT is positive and significant
at the 1% level, which is consistent with the main results. In the DACCR sample, consistent with
previous results, STRT (coefficient = -0.009) is negative and significant at the 1% level.
In sum, the results are consistent with our predictions even after employing alternative proxies
for accounting conservatism and earnings management, alternative coding of business strategy and
exclusion of the technology sector from the analysis. Further, results are consistent across samples
and years.
[INSERT TABLE 8]
7 Conclusions
We investigated whether business strategy is associated with earnings quality. We also
investigated whether the relation between business strategy and earnings quality is affected by
wider macro-economic issues such as economic growth. The business strategy adopted by a firm
drives the fundamental earnings process of the firm and accounting policies are used to measure
and report the earnings process. However, evidence on the link between financial reporting quality
and business strategy is sparse. We provide direct evidence of the vital link between earnings
quality and business strategy.
Within the Miles and Snow (1978) strategy typology, we classified U.S. listed firms into
prospector- and defender-strategy firms based on the ‘objective-indicators’ approach proposed by
Snow and Hambrick (1980). We employed four proxies for strategy classification: (1) the ratio of
research and development expense to sales, (2) research and development expense per employee,
18
1524 1/16/15
(3) the ratio of employees to sales, and (4) the market to book ratio. Using these four proxies, we
computed composite strategy scores for each firm. Firms that scored 10 or more were classified as
prospector firms and firms that scored below 10 were classified as defender firms. In particular,
we analyzed a sample of 14,729 firm-years to test accounting conservatism and a sample of 23,390
firm-years to test earnings management. Our measure of accounting conservatism was based on
Givoly and Hayn’s (2000) measure of non-operating accruals. We also employed the Khan and
Watts (2009) measure of conservatism as an alternative proxy for conservatism. We measured
earnings management as the absolute value of discretionary accruals based on the modified Jones
model (Dechow et al. 1995). We also employed the Jones model (Jones 1991) as a further
sensitivity test of our results. In our analysis, we incorporated several control variables, including
industry and year effects.
We predicted and found evidence that prospector-strategy firms are associated with higher
levels of accounting conservatism and defender-strategy firms are associated with higher levels of
earnings management. However, this relation between business strategy and earnings quality is
altered during high economic growth periods. In high-growth periods, while prospector firms
exhibit lesser accounting conservatism, defender firms exhibit lesser earning management.
Our findings have important implications for investors, analysts, and auditors. That is, an
assessment of earnings quality (or lack of it) is incomplete and potentially misleading without
understanding business strategy of the firm in question. Investors and other users of financial
statements can develop insights into firms’ earnings quality by trying to identify their business
strategy in the first place.
*****
19

1524 1/16/15
References
Ahmed, A., Billings, B., Morton, R., & Stanford-Harris, M. (2002). The role of accounting
conservatism in mitigating bondholder-shareholder conflicts over dividend policy and in reducing
debt costs. The Accounting Review, 77(4), 867-890.
Archambault, J., & Archambault, M. (2003). A multinational test of determinants of corporate
disclosure. The International Journal of Accounting, 38(1), 173-194.
Artiach, C., & Clarkson, M. (2011). Disclosure, conservatism and the cost of equity capital: A
review of the foundation literature. Accounting & Finance, 51, 2-49.
Artiach, C., & Clarkson, M. (2014). Conservatism, disclosure and the cost of equity capital.
Australian Journal of Management, 39(2), 293-314.
Ball R., Kothari, S. P., & Robin, A. (2000). The effect of international institutional factors on
properties of accounting earnings. Journal of Accounting and Economics, 29 (1), 1-51.
Beard, D. W., & Dess, G. G. (1981). Corporate-level strategy, business-level strategy, and firm
performance. The Academy of Management Journal, 24(4), 663-688.
Bentley, K. A., Omer, T. C., & Sharp, N. Y. (2013). Business strategy, financial reporting
irregularities, and audit effort. Contemporary Accounting Research, 30(2), 780-817.
Coase, R. (1937). The nature of the firm. Economica, New Series, 4(16), 386-405.
Dechow, P., Ge, W., & Schrand, C. (2010). Understanding earnings quality: A review of the
proxies, their determinants and their consequences. Journal of Accounting and Economics,
50 (2-3), 344-401.
Dechow, P., Sloan, R. & Sweeney, A. (1995). Detecting earning management. The Accounting
Review, 70(2), 193-225.
Francis, J., R., LaFond, R., Olsson, P., & Schipper, K. (2004). Costs of equity and earnings
attributes. The Accounting Review, 79(4), 967-1010.
Francis, J. R., & Wang, D. (2008). The joint effect of investor protection and big 4 audits on
earnings quality around the world. Contemporary Accounting Research, 25(1), 157-191.
Givoly, D. & Hayn, C. (2000). The changing time-series properties of earnings, cash flows and
accruals: Has financial reporting become more conservative? Journal of Accounting and
Economics, 29 (3), 287- 320.
Hambrick, D. (1983). Some tests of the effectiveness and functional attributes of miles and snow's
strategic types. The Academy of Management Journal, 26(1), 5-26.
20

1524 1/16/15
Hill, C.W. L., & Snell, S. A. (1988). External control, corporate strategy, and firm performance in
research intensive industries. Strategic Management Journal, 9(6), 577-590.
Hofer, C. W., & Schendel, D. (1978). Strategy formulation: Analytical concepts, West.
Jensen, M. & Meckling, W. (1976). Theory of the firm: managerial behavior, agency costs and
ownership structure. Journal of Financial Economics, 3(4), 305-360.
Jones J. (1991). Earnings management during import relief investigations. Journal of Accounting
Research, 29(2), 193-228.
Khan M., & Watts R. (2009). Estimation and empirical properties of a firm-year measure of
accounting conservatism. Journal of Accounting and Economics, 48(2-3), 132-150.
La Porta R., Lopez-De-Silanes F., Shleifer A., & Vishny, R. (2000). Investor protection and
corporate governance. Journal of Financial Economics, 58(1-2), 3-27.
Leuz C., Nanda D., & Wysocki, P. D. (2003). Earnings management and investor protection: An
international comparison. Journal of Financial Economics, 69(3), 505-527.
Miller, D., & Friesen, P. H. (1978). Archetypes of strategy formulation. Management Science, 24,
921-933.
Miles, R., & Snow, C. (1978). Organizational strategy, structure, and process. New York:
McGraw-Hill.
Miles, R., Snow C., Meyer, A. & Coleman, H. (1978). Organizational strategy, structure, and
process. The Academy of Management Review, 3(3), 546-562.
Mintzberg, H. (1987). The strategy concept I: Five p’s for strategy. California Management
Review, Fall, 11-24.
Pfeffer, J., & Salancik, G. (1978). The external control of organizations: a resource dependence
perspective. New York: Harper & Row Publishers Inc.
Richard, O. C. (2000). Racial diversity, business strategy, and firm performance: A resource-based
view. The Academy of Management Journal, 43(2), 164-177.
Shan, Y., Terry W., & Stephan T. (2013). Fundamentals or managerial discretion? The relationship
between accrual variability and future stock return volatility. Abacus, 49(4), 441-475.
Simons, R. (1987). Accounting control systems and business strategy: An empirical analysis.
Accounting, Organizations and Society, 12(4), 357-374.
Snow, C. C., & Hambrick, D. C. (1980). Measuring organizational strategies: some theoretical and
methodological problems. The Academy of Management Review, 5(4), 527-538.
21

1524 1/16/15
Snow, C. C., & Hrebiniak, L. G. (1980). Strategy, distinctive competence, and organizational
performance. Administrative Science Quarterly, 25(2), 317-336.
Stimpert, J. L., & Duhaime, I. M. (1997). Seeing the big picture: The influence of industry,
diversification, and business strategy on performance. The Academy of Management
Journal, 40(3), 560-583.
Venkatraman, N., & Grant, J. H. (1986). Construct measurement in strategy research: A critique
and proposal. Academy of Management Review, 11(1), 71-86.
Watts, R., & Zimmerman, J. (1978). Towards a positive theory of the determination of accounting
standards. The Accounting Review, 53(1), 112-134.
Watts, R., & Zimmerman, J. (1990). Positive accounting theory: A ten year perspective. The
Accounting Review, 65(1), 131-156.
Williams, F. P., D’Souza, D. E., Rosenfeldt, M. E., & Kassaee, M. (1995). Manufacturing strategy,
business strategy and firm performance in a mature industry. Journal of Operations
Management, 13, 19-33.
Woolridge, J. R., & Snow, C. C. (1990). Stock market reaction to strategic investment decisions.
Strategic Management Journal, 11, 353-363.
Zahra, S. A., & Covin, J. G. (1993). Business strategy, technology policy and firm performance.
Strategic Management Journal, 14, 451-478.
Zahra, S., & Pearce, J. (1990). Research evidence on the Miles –Snow typology. Journal of
Management, 16(4), 751-768.
22

1524 1/16/15
Table 1
Panel A: Sample selection
Conservatism (CON) sample
Earnings management
(DACCR) sample No. of observations with no missing values on dependent and independent variables for 1999-2009
16,740 25,623
-No. of financial institutions, funds, overseas companies (81) (81) -No. of Observations with any variable registering in the top or bottom 0.5%
(1,465) (1,565)
- No. of observations with │Studentized residuals│>3 (465) (587) Total firm-years 14,729 23,390
Panel B: Sample by year
Year Conservatism (CON) sample
% Earnings management
(DACCR) sample
%
1999 1180 8.0 1980 8.5 2000 1277 8.7 2143 9.2 2001 1337 9.1 2245 9.6 2002 1347 9.1 2224 9.5 2003 1359 9.2 2276 9.7 2004 1409 9.6 2363 10.1 2005 1410 9.6 2322 9.9 2006 1510 10.3 2282 9.8 2007 1519 10.3 2190 9.4 2008 1233 8.4 1745 7.5 2009 1148 7.8 1620 6.9
Total (firm-years) 14,729 100 23,390 100
Panel C: Sample by industries
Industry Conservatism (CON) sample Earnings management (DACCR) sample
# Firm -years % # Firm -years % Basic Materials 1134 2.9 1449 6.2 Consumer Goods 2456 13.8 3557 15.2 Health Care 2880 18.1 4799 20.5 Industrials 3708 14.0 5122 21.9 Oil and Gas 411 0.5 493 2.1 Real Estate 87 1.0 136 0.6 Technology 3677 46.3 7408 31.7 Telecommunications 210 1.8 248 1.1 Utilities 166 1.7 178 0.8 Total (firm-years) 14,729 100 23,390 100
23
1524 1/16/15
Table 2
Descriptive statistics
Panel A: Conservatism (CON) sample (n=14,729)
Variables All Mean
Median SD
25th(P) 75th (P)
1999 Mean
Median SD
25th(P) 75th (P)
2000 Mean
Median SD
25th(P) 75th (P)
2001 Mean
Median SD
25th(P) 75th (P)
2002 Mean
Median SD
25th(P) 75th (P)
2003 Mean
Median SD
25th(P) 75th (P)
2004 Mean
Median SD
25th(P) 75th (P)
2005 Mean
Median SD
25th(P) 75th (P)
2006 Mean
Median SD
25th(P) 75th (P)
2007 Mean
Median SD
25th(P) 75th (P)
2008 Mean
Median SD
25th(P) 75th (P)
2009 Mean
Median SD
25th (P) 75th(P)
Dependent
CON 0.0019 0.0069 0.0064 0.0153 0.0130 0.0117 0.0094 0.0085 0.0131 0.0139 0.0180 0.0167 0.0121 0.0006 0.0004 0.0030 0.0033 0.0023 0.0012 0.0013 0.0012 0.0016 0.0029 0.0046 0.04780 0.03462 0.03427 0.05036 0.03695 0.04562 0.04640 0.03932 0.05462 0.05669 0.06049 0.05436 -0.0013 -0.0028 -0.0030 -0.0007 -0.0002 -0.0004 -0.0016 -0.0020 -0.0018 -0.0012 -0.0009 0.0009 0.0080 0.0047 0.0053 0.0111 0.0116 0.0074 0.0056 0.0059 0.0067 0.0073 0.126 0.0116
Independent and control
STRT 9.00 9.65 9.84 9.51 9.35 9.53 9.73 9.60 9.65 9.45 9.22 8.55 9.00 9.00 10.00 9.00 9.00 9.00 9.00 9.00 9.00 9.00 9.00 8.00 2.741 2.648 2.732 2.878 2.767 2.600 2.629 2.712 2.798 2.725 2.643 2.815 7.00 8.00 8.00 7.00 7.00 7.00 8.00 8.00 7.00 7.00 7.00 6.00 11.00 11.00 12.00 11.00 11.00 12.00 12.00 11.00 12.00 11.00 11.00 10.00
LN_ASSETS 12.5161 12.2963 12.4204 12.4229 12.3714 12.4614 12.4876 12.5237 12.5099 12.6484 12.6998 12.8535
12.5496 12.1194 12.3985 12.3697 12.3176 12.5350 12.6199 12.5690 12.5515 12.7417 12.8529 13.0650 2.88842 2.77284 2.80637 2.83496 2.87405 2.91326 2.91785 2.89827 2.89882 2.92705 2.96467 2.91248 10.3806 10.2353 10.3683 10.3474 10.2523 10.3228 10.3712 10.3474 10.3356 10.4618 10.4855 10.7589 14.6936 14.3530 14.5447 14.5494 14.5688 14.6701 14.6704 14.7186 14.6903 14.8370 14.9574 15.0462
F_LEV 0.2019 0.2684 0.2652 0.2959 0.2934 0.2989 0.2965 0.2952 0.3132 0.3234 0.3423 0.3429
0.2019 0.2034 0.1918 0.2025 0.2115 0.2055 0.1924 0.1891 0.1931 0.2064 0.2218 0.2070 0.50573 0.41882 0.36945 0.49713 0.42845 0.49279 0.49155 0.51015 0.53120 0.57284 0.55226 0.63611 0.0679 0.0651 0.0556 0.0580 0.0644 0.0657 0.0661 0.0695 0.0744 0.0707 0.0869 0.0833 0.3540 0.3407 0.3509 0.3626 0.3625 0.3415 0.3382 0.3427 0.3488 0.3576 0.3831 0.3638
G_SALES 0.0869 0.4729 0.6030 0.2632 0.1501 0.2082 0.4111 0.3541 0.4764 0.3109 0.3258 0.0845
0.0869 0.0899 0.1238 0.0286 0.0180 0.0889 0.1419 0.1115 0.1229 0.1185 0.0900 -0.0690 1.55151 2.00765 2.33684 1.34009 0.98068 0.84789 1.64984 1.41895 1.88117 1.17855 1.62023 1.10875 -0.0411 -0.0438 -0.0125 -0.1115 -0.1263 -0.0203 0.0466 0.0147 0.0166 0.0078 -0.0251 -0.2055 0.2600 0.2999 0.4026 0.2290 0.1569 0.2178 0.2968 0.2926 0.3226 0.2797 0.2335 0.0805
24

1524 1/16/15
M_RISK 1.3292 1.3093 1.2921 1.2995 1.3408 1.3330 1.3530 1.3561 1.3379 1.3554 1.3109 1.3186
1.2400 1.1900 1.1800 1.2000 1.2600 1.2700 1.2800 1.2700 1.2600 1.2800 1.2400 1.2400 1.04217 1.03274 1.09075 1.02993 1.01333 0.99634 1.01084 1.07693 1.09749 1.12441 0.96841 0.97988 0.7800 0.7600 0.7600 0.7600 0.8000 0.8000 0.8200 0.7800 0.7700 0.7900 0.7850 0.7900 1.7000 1.6500 1.6200 1.6400 1.6900 1.7100 1.7200 1.7200 1.7200 1.7200 1.7100 1.7100
25
1524 1/16/15
Panel B: Earnings management (DACCR) sample (n=23,390)
Variables All Years Mean
Median SD
25th(P) 75th (P)
1999 Mean
Median SD
25th(P) 75th (P)
2000 Mean
Median SD
25th(P) 75th (P)
2001 Mean
Median SD
25th(P) 75th (P)
2002 Mean
Median SD
25th(P) 75th (P)
2003 Mean
Median SD
25th(P) 75th (P)
2004 Mean
Median SD
25th(P) 75th (P)
2005 Mean
Median SD
25th(P) 75th (P)
2006 Mean
Median SD
25th(P) 75th (P)
2007 Mean
Median SD
25th(P) 75th (P)
2008 Mean
Median SD
25th(P) 75th (P)
2009 Mean
Median SD
25th (P) 75th(P)
Dependent
|DACCR| 0.01396 0.01399 0.01339 0.01469 0.01528 0.01422 0.01320 0.01330 0.01313 0.01337 0.01355 0.01590 0.01306 0.01328 0.01270 0.01362 0.01446 0.01347 0.01255 0.01262 0.01248 0.01254 0.01269 0.01479 0.05266 0.05547 0.05208 0.05932 0.05718 0.05090 0.04656 0.04736 0.04662 0.04834 0.05066 0.05736 0.01098 0.01060 0.01043 0.01126 0.01184 0.01145 0.01077 0.01080 0.01066 0.01073 0.01080 0.01213 0.01618
0.01676 0.01554 0.01724 0.01783 0.01633 0.01519 0.01616 0.01495 0.01525 0.01549 0.01817
Independent and control STRT 10.00
10.00 10.07 10.00
10.32 10.00
9.93 10.00
9.72 10.00
9.90 10.00
10.10 10.00
9.95 10.00
9.94 10.00
9.72 10.00
9.48 9.00
8.90 9.00
2.736 2.720 2.799 2.864 2.746 2.608 2.608 2.669 2.725 2.713 2.634 2.801 8.00 8.00 8.00 8.00 8.00 8.00 8.00 8.00 8.00 8.00 7.00 7.00 12.00
12.00 12.00 12.00 12.00 12.00 12.00 12.00 12.00 12.00 11.00 11.00
LN_ASSETS 12.1210 11.9673
11.7938 11.5301
11.9202 11.7511
11.9052 11.7592
11.9185 11.7543
12.0360 11.8664
12.1024 11.9194
12.2058 12.0154
12.2266 12.0847
12.3618 12.2579
12.4368 12.3784
12.5737 12.5021
2.66724 2.58153 2.61929 2.67920 2.66835 2.64629 2.64082 2.60908 2.64544 2.72613 2.75291 2.69225 10.2087 9.9771 10.0300 9.9730 9.9501 10.1211 10.2579 10.3355 10.3350 10.4098 10.4438 10.6870 13.9653
13.63034 13.7130 13.6995 13.7137 13.8348 13.8951 14.0169 14.0793 14.3214 14.3651 14.4459
TL_TA 0.5778 0.4328
0.5078 0.4251
0.5114 0.4064
0.5800 0.4314
0.5901 0.4439
0.5617 0.4408
0.5443 0.44188
0.5534 0.4229
0.6013 0.4321
0.6056 0.4370
0.6665 0.4703
0.6710 0.4559
0.83857 0.57186 0.62996 0.79539 0.81595 0.68259 0.70288 0.75952 0.93121 0.88140 1.06246 1.31093 0.2332 0.2233 0.2041 0.2217 0.2368 0.2342 0.2297 0.2314 0.2441 0.2475 0.2643 0.2452 0.6451
0.6257 0.6230 0.6567 0.6688 0.6567 0.6334 0.6269 0.6365 0.6460 0.6892 0.6489
G_SALES 0.0878 0.0878
0.4729 0.0997
0.6796 0.1477
0.2761 0.0286
0.1513 0.0078
0.2400 0.0850
0.3843 0.1432
0.3315 0.1141
0.1723 0.1225
0.2900 0.1146
0.3153 0.0895
0.0991 -0.0674
1.50464 1.810172 2.29496 1.53811 1.04288 1.23883 1.50521 1.37047 0.45614 1.14196 1.54893 1.21665 -0.0528 -0.0506 -0.0137 -0.1261 -0.1533 -0.0381 0.0327 0.0009 0.0143 -0.0022 -0.0285 -0.2098 0.2825
0.3634 0.5063 0.2530 0.1675 0.2350 0.3212 0.3025 0.1927 0.2731 0.2377 0.0872
G_PPE 0.0712 0.0712
0.3123 0.0980
0.4111 0.1081
0.1849 0.0664
0.0992 0.0558
0.1055 0.0636
0.1473 0.0722
0.1289 0.0507
0.1723 0.0839
0.2008 0.0923
0.1349 0.0595
0.0768 0.0472
26

1524 1/16/15
0.57701 0.80082 0.98835 0.58734 0.34386 0.40204 0.49591 0.46566 0.50948 0.60043 0.46011 0.24462 0.0040 0.0149 0.0212 -0.0033 -0.0092 0.0020 0.0132 -0.0113 -0.0859 0.0205 -0.0060 0.0003 0.1922
0.2983 0.3616 0.2261 0.1590 0.1570 0.1628 0.1575 0.1185 0.2135 0.1896 0.1200
CFO -0.0744 0.0539
-0.0614 0.0492
-0.0971 0.0284
-0.1069 0.0370
-0.0778 0.0528
-0.0455 0.0550
-0.0702 0.0535
-0.0689 0.0565
-0.0911 0.0566
-0.0826 0.0613
-0.0725 0.0613
-0.0324 0.0784
0.44417 0.40086 0.43423 0.46576 0.44888 0.38068 0.43042 0.43138 0.494 0.49309 0.44621 0.41397 -0.0893 -0.0826 -0.1336 -0.1374 -0.1036 -0.0818 -0.0937 -0.0838 0.00 -0.0738 -0.0622 -0.0203 0.1176
0.1167 0.1035 0.1113 0.1191 0.1169 0.1160 0.1180 1.00 0.1211 0.1224 0.1301
LOSS 0.47 0.00
0.44 0.00
0.47 0.00
0.56 1.00
0.54 1.00
0.49 0.00
0.42 0.00
0.42 0.00
0.42 0.00
0.43 0.00
0.47 0.00
0.49 0.00
0.499 0.496 0.499 0.496 0.498 0.500 0.494 0.493 0.494 0.495 0.499 0.500 0.00 0.00 0.00 0.00 0.00 0.00 0.00 0.00 0.00 0.00 0.00 0.00 1.00 1.00 1.00 1.00 1.00 1.00 1.00 1.00 1.00 1.00 1.00 1.00
Variable definitions: CON is a measure of accounting conservatism based on Givoly and Hayn (2000). STRT is the business strategy of firm i in year t as per Snow and Hambrick (1980). LN_ASSETS is the natural logarithm of total assets of firm i in year t. F_LEV is the ratio of total debts to total assets of firm i in year t. G_SALES is the sales growth rate, defined as the sales in current year minus sales in prior year and divided by sales in the prior year for firm i in year t. M_RISK is a measure of systematic risk which shows the relationship between the volatility of the stock and the volatility of the market. This measure is based on between 23 and 35 consecutive month end price percent changes and their relativity to a local market index i.e., percentage change in the price of an equity given a one percent change in its benchmark index. |DACCR| is the absolute value of discretionary accruals of firm i in year t as per the Modified Jones model (Dechow et al. 1995). TL-TA is the yearend total liabilities divided yearend total assets of firm i in year t. G_PPE is the growth rate of gross PPE, defined as the gross PPE in the current year minus the gross PPE in the prior year and divided by the gross PPE in the prior year for firm i in year t. CFO is the operating cash flows for firm i in year t scaled by total assets. LOSS takes the value of 1 if firm i in year t reports negative income before extraordinary items and 0 otherwise.
27

1524 1/16/15
Table 3 Pearson’s Correlation Matrix
Panel A: Conservatism (CON) sample (n=14,729)
Variables CON STRT LN_ASSETS F_LEV G_SALES M_RISK
CON
1
STRT
0.205***
(0.000)
1
LN_ASSETS -0.338***
(0.000) -0.452***
(0.000)
1
F_LEV 0.408***
(0.000) 0.075***
(0.000) -0.239***
(0.000)
1
G_SALES 0.086***
(0.000) 0.279***
(0.000) -0.123***
(0.000) 0.044***
(0.000)
1
M_RISK -0.028***
(0.001) -0.047***
(0.000) 0.076***
(0.000) 0.033***
(0.000) -0.001 (0.882)
1
Panel B: Earnings management (DACCR) sample (n=23,390)
Variables |DACCR| STRT LN_ASSETS TL_TA G_SALES G_PPE CFO LOSS
|DACCR|
1
STRT
-0.301***
(0.000)
1
LN_ASSETS -0.016**
(0.016) -0.414***
(0.000)
1
TL_TA 0.177***
(0.000) 0.028***
(0.000) -0.218***
(0.000)
1
G_SALES -0.256***
(0.000) 0.277***
(0.000) -0.091***
(0.000) 0.008
(0.226)
1
G_PPE -0.211***
(0.000) 0.198***
(0.000) -0.023***
(0.001) -0.066***
(0.000) 0.278***
(0.000)
1
CFO -0.113***
(0.000) -0.395***
(0.000) 0.480***
(0.000) -0.466***
(0.000) -0.126***
(0.000) -0.026***
(0.000)
1
LOSS 0.130***
(0.000) 0.398***
(0.000) -0.459***
(0.000) 0.170***
(0.000) 0.094***
(0.000) 0.057***
(0.000) -0.441***
(0.000)
1
28

1524 1/16/15
Note: Two-tailed p-values are in parenthesis. *, **, and *** indicate significance at the 10%, 5% and 1% levels (two-tailed), respectively.
Variable definitions: CON is a measure of accounting conservatism based on Givoly and Hayn (2000). STRT is the business strategy of firm i in year t as per Snow and Hambrick (1980). LN_ASSETS is the natural logarithm of total assets of firm i in year t. F_LEV is the ratio of total debts to total assets of firm i in year t. G_SALES is the sales growth rate, defined as the sales in current year minus sales in prior year and divided by sales in the prior year for firm i in year t. M_RISK is a measure of systematic risk which shows the relationship between the volatility of the stock and the volatility of the market. This measure is based on between 23 and 35 consecutive month end price percent changes and their relativity to a local market index i.e., percentage change in the price of an equity given a one percent change in its benchmark index. |DACCR| is the absolute value of discretionary accruals of firm i in year t as per the Modified Jones model (Dechow et al. 1995). TL-TA is the yearend total liabilities divided yearend total assets of firm i in year t. G_PPE is the growth rate of gross PPE, defined as the gross PPE in the current year minus the gross PPE in the prior year and divided by the gross PPE in the prior year for firm i in year t. CFO is the operating cash flows for firm i in year t scaled by total assets. LOSS takes the value of 1 if firm i in year t reports negative income before extraordinary items and 0 otherwise.
29
1524 1/16/15
Table 4
OLS estimates of model (2) to test accounting conservatism: Pooled and annual samples
CONit = β0 + β1STRTit + β2LN_ASSETSit + β3F_LEVit + β4G_SALESit + β5M_RISKit + Industry and Year controls + εit
Variables All firms Coeff.
(p-value)
1999 Coeff.
(p-value)
2000 Coeff.
(p-value)
2001 Coeff.
(p-value)
2002 Coeff.
(p-value)
2003 Coeff.
(p-value)
2004 Coeff.
(p-value)
2005 Coeff.
(p-value)
2006 Coeff.
(p-value)
2007 Coeff.
(p-value)
2008 Coeff.
(p-value)
2009 Coeff.
(p-value)
Intercept
0.030***
(0.000)
0.029***
(0.000)
0.015**
(0.021)
0.028***
(0.005)
0.011*
(0.089)
0.047***
(0.000)
0.041***
(0.000)
0.028***
(0.000)
0.043***
(0.000)
0.049***
(0.000)
0.035***
(0.002)
0.045***
(0.000) STRT 0.001***
(0.000) 0.001** (0.014)
0.001**
(0.012) 0.001**
(0.014) 0.001**
(0.019) 0.001
(0.168) 0.001**
(0.040) 0.001**
(0.026) 0.001*
(0.072) 0.002***
(0.010) 0.002***
(0.005) 0.001**
(0.036) LN_ASSETS -0.004***
(0.000) -0.003***
(0.000) -0.002***
(0.000) -0.003***
(0.000) -0.002***
(0.000) -0.004***
(0.000) -0.003***
(0.000) -0.003***
(0.000) -0.004***
(0.000) -0.005***
(0.000) -0.005***
(0.000) -0.004***
(0.000) F_LEV 0.033***
(0.000) 0.023***
(0.000) 0.041***
(0.000) 0.023***
(0.000) 0.033***
(0.000) 0.031***
(0.000) 0.029***
(0.000) 0.022***
(0.000) 0.042***
(0.000) 0.030***
(0.000) 0.041***
(0.000) 0.039***
(0.000) G_SALES 0.001***
(0.000) 0.000
(0.732) 0.001**
(0.011) -0.002 (0.118)
0.002**
(0.023) 0.006***
(0.000) -0.001*
(0.061) 0.000
(0.998) -0.000 (0.954)
0.002
(0.159) 0.006***
(0.000) 0.002*
(0.064) M_RISK -0.001***
(0.009) -0.001 (0.126)
-0.002***
(0.002) -0.001 (0.637)
-0.001 (0.495)
-0.003**
(0.018) -0.004***
(0.000) 0.000
(0.647) -0.002*
(0.040) 0.001
(0.253) 0.007***
(0.000) -0.003**
(0.033) Industry effects
Yes Yes Yes Yes Yes Yes Yes Yes Yes Yes Yes Yes
Year effects Yes NA NA NA NA NA NA NA NA NA NA NA N 14,729 1,180 1,277 1,337 1,347 1,359 1,409 1,410 1,510 1,519 1,233 1,148 Adjusted R2 0.237 0.174 0.280 0.145 0.248 0.244 0.196 0.179 0.305 0.231 0.338 0.343 F-Statistic 655.152*** 42.428*** 83.796*** 38.869*** 74.991*** 73.961*** 58.387*** 52.276*** 111.378*** 76.863*** 105.747 100.935***
p-value <.001 <.001 <.001 <.001 <.001 <.001 <.001 <.001 <.001 <.001 <.001 <.001 Note: p-values are two-tailed. CON is a measure of accounting conservatism based on Givoly and Hayn (2000). STRT is the business strategy of firm i in year t as per Snow and Hambrick (1980). LN_ASSETS is the natural logarithm of total assets of firm i in year t. F_LEV is the ratio of total debts to total assets of firm i in year t. G_SALES is the sales growth rate, defined as the sales in current year minus sales in prior year and divided by sales in the prior year for firm i in year t. M_RISK is a measure of systematic risk which shows the relationship between the volatility of the stock and the volatility of the market. This measure is based on between 23 and 35 consecutive month end price percent changes and their relativity to a local market index i.e., percentage change in the price of an equity given a one percent change in its benchmark index. Industry and Year effects are dummy variables to capture industry and year effects on the dependent variable.
*, **, and *** indicate significance at the 10%, 5% and 1% levels (two-tailed), respectively.
30
1524 1/16/15
Table 5 OLS estimates of model (3) to test earnings management: Pooled and annual samples
|DACCR|it = ά0 + ά 1STRTit + ά 2LN_ASSETSit + ά 3TL_TAit + ά 4G_SALESit + ά 5G_PPRit + ά 6CFOit + ά7LOSSit + Industry and Year controls + εit Variables All firms
Coeff. (p-value)
1999 Coeff.
(p-value)
2000 Coeff.
(p-value)
2001 Coeff.
(p-value)
2002 Coeff.
(p-value)
2003 Coeff.
(p-value)
2004 Coeff.
(p-value)
2005 Coeff.
(p-value)
2006 Coeff.
(p-value)
2007 Coeff.
(p-value)
2008 Coeff.
(p-value)
2009 Coeff.
(p-value) Intercept
0.207***
(0.000)
0.198***
(0.000)
0.193***
(0.000)
0.232***
(0.000)
0.221***
(0.000)
0.210***
(0.000)
0.159***
(0.000)
0.165***
(0.000)
0.171***
(0.000)
0.197***
(0.000)
0.204***
(0.000)
0.244***
(0.000) STRT -0.008***
(0.000) -0.008***
(0.000) -0.007***
(0.000) -0.009***
(0.000) -0.008***
(0.000) -0.008***
(0.000) -0.005***
(0.000) -0.005***
(0.000) -0.005***
(0.000) -0.007***
(0.000) -0.007***
(0.000) -0.010***
(0.000) LN_ASSETS 0.000
(0.462) 0.001
(0.299) -0.000 (0.925)
-0.001*
(0.096) -0.001***
(0.120) -0.001 (0.229)
0.001*** (0.002)
0.001**
(0.038) 0.000
(0.255) 0.000
(0.388) -0.001
(0.116) -0.001 (0.254)
TL_TA 0.005***
(0.000) 0.013***
(0.000) 0.013***
(0.000) 0.002
(0.149) 0.007***
(0.000) 0.005***
(0.000) 0.010***
(0.000) 0.011***
(0.000) 0.006***
(0.000) -0.002*
(0.060) 0.002
(0.182) 0.001
(0.186) G_SALES -0.006***
(0.000) -0.004***
(0.000) -0.004***
(0.000) -0.005***
(0.000) -0.013***
(0.000) -0.006***
(0.001) -0.005***
(0.000) -0.006***
(0.000) -0.005***
(0.000) -0.008***
(0.000) -0.008***
(0.000) -0.006***
(0.000) G_PPE -0.010***
(0.000) -0.010***
(0.000) -0.005***
(0.000) -0.010***
(0.000) -0.017***
(0.000) -0.011***
(0.000) -0.008***
(0.000) -0.013***
(0.000) -0.015***
(0.000) -0.008***
(0.000) -0.013***
(0.000) -0.029***
(0.000) CFO -0.019***
(0.000) -0.017***
(0.000) -0.015***
(0.000) -0.031***
(0.000) -0.022***
(0.000) -0.013***
(0.000) -0.014***
(0.000) -0.020***
(0.000) -0.007**
(0.014) -0.027***
(0.000) -0.020***
(0.000) -0.017***
(0.000) Loss 0.024***
(0.000) 0.027***
(0.000) 0.023***
(0.000) 0.023***
(0.000) 0.021***
(0.000) 0.024***
(0.000) 0.022***
(0.000) 0.017***
(0.000) 0.020***
(0.000) 0.018***
(0.000) 0.019***
(0.000) 0.030***
(0.000) Industry effects
Yes Yes Yes Yes Yes Yes Yes Yes Yes Yes Yes Yes
Year effects Yes NA NA NA NA NA NA NA NA NA NA NA N 23,390 1,980 2,143 2,245 2,224 2,276 2,363 2,322 2,282 2,190 1,745 1,620 Adjusted R2 0.243 0.286 0.270 0.255 0.269 0.219 0.213 0.228 0.190 0.238 0.236 0.287 F-Statistic 832.990*** 99.970*** 100.231*** 96.821*** 103.437*** 80.852*** 80.701*** 86.720*** 67.942*** 86.680*** 68.496*** 82.576***
p-value <.001 <.001 <.001 <.001 <.001 <.001 <.001 <.001 <.001 <.001 <.001 <.001 Note: p-values are two-tailed. |DACCR| is the absolute value of discretionary accruals of firm i in year t as per the Modified Jones model (Dechow et al. 1995). STRT is the business strategy of firm i in year t as per Snow and Hambrick (1980)..LN_ASSETS is the natural logarithm of total assets of firm i in year t. TL-TA is the yearend total liabilities divided yearend total assets of firm i in year t. G_SALES is the sales growth rate, defined as the sales in current year minus sales in prior year and divided by sales in the prior year for firm i in year t. G_PPE is the growth rate of gross PPE, defined as the gross PPE in the current year minus the gross PPE in the prior year and divided by the gross PPE in the prior year for firm i in year t. CFO is the operating cash flows for firm i in year t scaled by total assets. LOSS takes the value of 1 if firm i in year t reports negative income before extraordinary items and 0 otherwise. Industry and Year effects are dummy variables to capture industry and year effects on the dependent variable. *, **, and *** indicate significance at the 10%, 5% and 1% levels (two-tailed), respectively.
31

1524 1/16/15
Table 6
OLS estimates of models (4) and (5) to test the effect of wider economic environments on the relation between strategy and earnings quality
CONit = β0 + β1STRTit + β2 GDP_Dummy + β3STRT* GDP_Dummy
+ β4 Ln_Assetsit + β5F_LEVit + β6G_SALESit + Industry_Dummy + εit (4)
|DACCR|it = ά0 + ά 1STRTit + ά 2 GDP_Dummy + ά 3STRT* GDP_Dummy + ά 4 LN_ASSETSit + ά 5F_LEVit + ά
6G_SALESit + ά 7G_PPRit + ά 8CFOit + ά9LOSSit + Industry_Dummy + εit (5)
Variables Earnings Quality Conservatism (CON) sample
Coeff. (p-value)
Earnings management (|DACCR|) sample
Coeff. (p-value)
Intercept 0.009*** (0.002)
0.211***
(0.000) STRT 0.002***
(0.000) -0.008***
(0.000) GDP_Dummy -0.000
(0.983) -0.013***
(0.000) STRT* GDP_Dummy -0.001***
(0.002) 0.001***
(0.000) LN_ASSETS -0.002***
(0.000) -0.000 (0.734)
F_LEV 0.026***
(0.000) 0.003***
(0.000) G_SALES 0.001***
(0.001) -0.005***
(0.000) G_PPE -0.008***
(0.000) CFO -0.022***
(0.000) LOSS 0.024***
(0.000) Industry_Dummy Yes Yes N 14,286 14,286 Adjusted R2 0.307 0.252 F-Statistic 904.204*** 481.176***
p-value <.001 <.001
Note: p-values are two-tailed.
CON is a measure of accounting conservatism based on Givoly and Hayn (2000). STRT is the business strategy of firm i in year t as per Snow and Hambrick (1980). GDP_Dummy is a binary variable coded 1 for 1999, 2000 and 2004 (high real GDP growth years in the U.S.) and 0 for 2001, 2007, 2008 and 2009 (low real GDP growth years in the U.S.). STRT*GDP_Dummy is the interaction term between STRT and GDP_Dummy. LN_ASSETS is the natural logarithm of total assets of firm i in year t. F_LEV is the ratio of total debts to total assets of firm i in year t. G_SALES is the sales growth rate, defined as the sales in current year minus sales in prior year and divided by sales in the prior year for firm i in year t. M_RISK is a measure of systematic risk which shows the relationship between the volatility of the stock and the volatility of the market. This measure is based on between 23 and 35 consecutive month end price percent changes and their relativity to a local market index i.e., percentage change in the price of an equity given a one percent change in its benchmark index. |DACCR| is the absolute value of discretionary accruals of firm i in year t as per the Modified Jones model (Dechow et al. 1995). TL-TA is the yearend total liabilities divided yearend total assets of firm i in year t. G_PPE is the growth rate of gross PPE, defined as the gross PPE in the current year minus the gross PPE in the prior year
32

1524 1/16/15
and divided by the gross PPE in the prior year for firm i in year t. CFO is the operating cash flows for firm i in year t scaled by total assets. LOSS takes the value of 1 if firm i in year t reports negative income before extraordinary items and 0 otherwise. Industry_Dummy is a dummy variable to capture the industry effect on the dependent variable. *, **, and *** indicate significance at the 10%, 5% and 1% levels (two-tailed), respectively.
33
1524 1/16/15
Table 7
OLS estimates of models (2) and (3) after excluding Technology sector from the samples
CONit = β0 + β1STRTit + β2LN_ASSETSit
+ β3F_LEVit + β4G_SALESit + β5M_RISKit + Industry and Year controls + εit (2)
|DACCR|it = ά0 + ά 1STRTit + ά 2LN_ASSETSit + ά 3TL_TAit + ά 4G_SALESit + ά 5G_PPRit + ά 6CFOit + ά7LOSSit + Industry and Year controls + εit (3)
Variables Conservatism (CON) sample
Coeff. (p-value)
Earnings management (|DACCR|) sample
Coeff. (p-value)
Intercept 0.041***
(0.000)
0.161***
(0.000)
STRT 0.001*
(0.063) -0.005***
(0.000) LN_ASSETS -0.003***
(0.000) 0.000
(0.295) F_LEV 0.041***
(0.000) 0.005***
(0.000) G_SALES -0.000
(0.851) -0.006***
(0.000) M_RISK -0.002*
(0.045)
G_PPE -0.014***
(0.000) CFO -0.008**
(0.014) LOSS 0.019***
(0.000) Industry effects Yes Yes
Year effects NA NA N 11,052 15,982
Adjusted R2 0.325 0.165 F-Statistic 125.378*** 37.142***
p-value <.001 <.001 Note: p-values are two-tailed. CON is a measure of accounting conservatism based on Givoly and Hayn (2000). STRT is the business strategy of firm i in year t as per Snow and Hambrick (1980). LN_ASSETS is the natural logarithm of total assets of firm i in year t. F_LEV is the ratio of total debts to total assets of firm i in year t. G_SALES is the sales growth rate, defined as the sales in current year minus sales in prior year and divided by sales in the prior year for firm i in year t. M_RISK is a measure of systematic risk which shows the relationship between the volatility of the stock and the volatility of the market. This measure is based on between 23 and 35 consecutive month end price percent changes and their relativity to a local market index i.e., percentage change in the price of an equity given a one percent change in its benchmark index. G_PPE is the growth rate of gross PPE, defined as the gross PPE in the current year minus the gross PPE in the prior year and divided by the gross PPE in the prior year for firm i in year t. CFO is the operating cash flows for firm i in year t scaled by total assets. LOSS takes the value of 1 if firm i in year t reports negative income before extraordinary items and 0 otherwise. Industry and Year effects are dummy variables to capture industry and year effects on the dependent variable. |DACCR| is the absolute value of discretionary accruals of firm i in year t as per the Modified Jones model (Dechow et al. 1995).
*, **, and *** indicate significance at the 10%, 5% and 1% levels (two-tailed), respectively.
34

1524 1/16/15
Table 8 OLS estimates of models (2) and (3)
using alternative measures of conservatism and discretionary accruals
CONit = β0 + β1STRTit + β2LN_ASSETSit + β3F_LEVit + β4G_SALESit + β5M_RISKit + Industry and Year controls + εit (2)
|DACCR|it = ά0 + ά 1STRTit + ά 2LN_ASSETSit + ά 3TL_TAit + ά 4G_SALESit
+ ά 5G_PPRit + ά 6CFOit + ά7LOSSit + Industry and Year controls + εit (3)
Variables Conservatism (CON) sample Coeff.
(p-value)
Earnings management (|DACCR|) sample
Coeff. (p-value)
Intercept 0.025***
(0.000) 0.196***
(0.000) STRT 0.001***
(0.000) -0.009***
(0.000) LN_ASSETS -0.005***
(0.000) 0.000
(0.483) F_LEV 0.029***
(0.000) 0.005***
(0.000) G_SALES 0.001***
(0.000) -0.005***
(0.000) M_RISK -0.001***
(0.008)
G_PPE -0.009***
(0.000) CFO -0.017***
(0.000) LOSS 0.028***
(0.000) Industry effects Yes Yes
Year effects Yes Yes N 14,729 23,390
Adjusted R2 0.256 0.263 F-Statistic 657.142*** 886.191***
p-value <.001 <.001 Note: p-values are two-tailed. CON is based on the Khan and Watts (2009) asymmetric timeliness measure of conservatism. STRT is the business strategy of firm i in year t based on the approach developed by Snow and Hambrick (1980). LN_ASSETS is the natural logarithm of total assets of firm i in year t. F_LEV is the ratio of total debts to total assets of firm i in year t. G_SALES is the sales growth rate, defined as the sales in current year minus sales in the prior year and divided by sales in the prior year for firm i in year t. M_RISK is a measure of systematic risk which shows the relationship between the volatility of the stock and the volatility of the market. This measure is based on 23 to 35 consecutive month end price percent changes and their relativity to a local market index. G_PPE is the growth rate of gross PPE, defined as the gross PPE in the current year minus the gross PPE in the prior year and divided by the gross PPE in the prior year for firm i in year t. CFO is the operating cash flows for firm i in year t scaled by total assets. LOSS takes the value of 1 if firm i in year t reports negative income before extraordinary items and 0 otherwise. Industry and Year effects are dummy variables to capture industry and year effects on the dependent variable. |DACCR| is the absolute value of discretionary accruals of firm i in year t under the Jones (1991) model. *, **, and *** indicate significance at the 10%, 5% and 1% levels (two-tailed), respectively
35
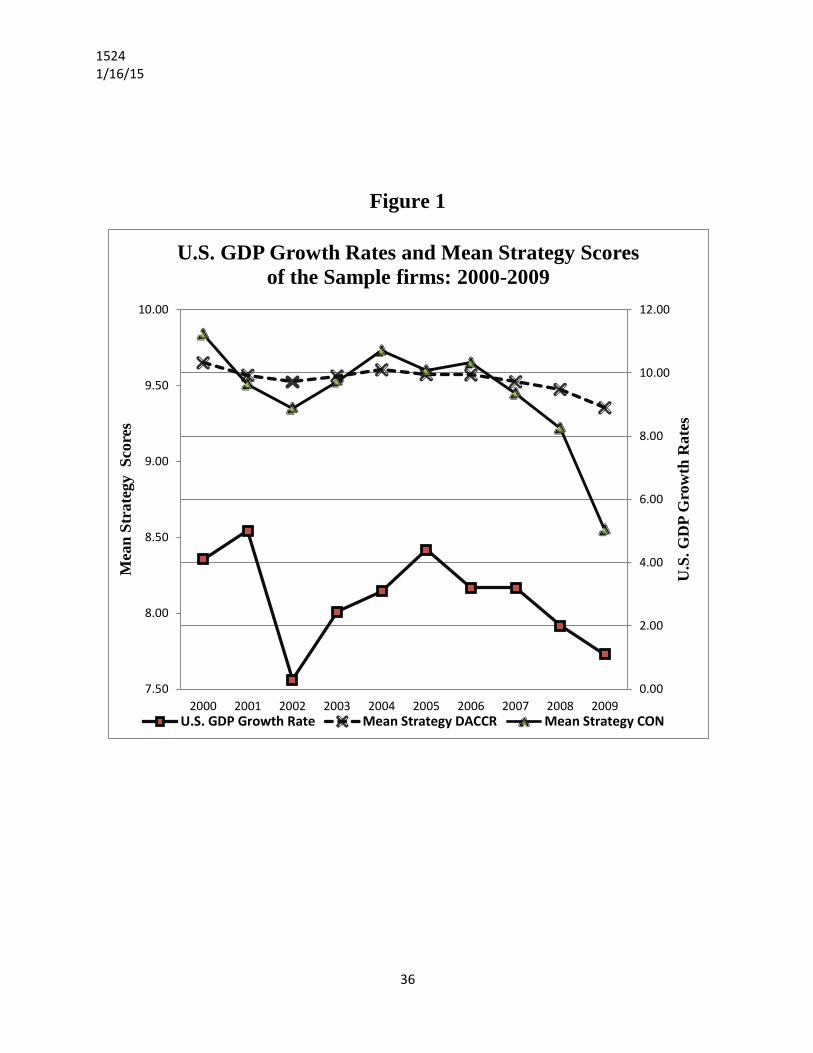
1524 1/16/15
Figure 1
7.50
8.00
8.50
9.00
9.50
10.00
2000 2001 2002 2003 2004 2005 2006 2007 2008 20090.00
2.00
4.00
6.00
8.00
10.00
12.00
Mea
n St
rate
gy S
core
s
U.S
. GD
P G
row
th R
ates
U.S. GDP Growth Rates and Mean Strategy Scores of the Sample firms: 2000-2009
U.S. GDP Growth Rate Mean Strategy DACCR Mean Strategy CON
36