business taxation under the coalition government under the coalition government ... the report...
TRANSCRIPT

Business Taxation under the Coalition Government Edited by Giorgia Maffini February 2015

2 Business taxation under the Coalition
Oxford University Centre For Business Taxation
Saïd Business School Park End Street, Oxford OX1 1HP, UKwww.sbs.oxford.edu/tax
© Oxford University Centre for Business Taxation, 2015
The opinions expressed in this report represent the views of the authors. They do not represent the views of the Oxford University Centre for Business Taxation, which has no corporate views.This report is part of the output of the Oxford University Centre for Business Taxation. The report draws from several elements of the Centre’s research programme. The Centre’s research and other activities are funded from a number of sources, including the Economic and Social Research Council, the Nuffield Foundation, and a number of companies listed on the Centre’s website at www.sbs.oxford.edu/tax In preparing this report, we are grateful for many helpful comments and suggestions from Stephen Bond and Judith Freedman, and other researchers in the Centre.
ISBN number: 978-0-9559350-6-0
2 Business taxation under the Coalition

www.sBs.oxford.edu/tax 3
Business Taxation under the Coalition Government
Edited by Giorgia Maffini February 2015
With contributions from:
Michael Devereux Rita de la Feria Irem Guceri Strahil Lepoev John Vella Anzhela Yevgenyeva

4 Business taxation under the Coalition
Contents
Executive summary
1. Introduction 62. Reforms to the business tax regime 8 2.1. Corporation tax rates and base 8 2.2. Reforms to the Controlled Foreign Company Regime 9 2.3. The Patent Box 10 2.4. Research and Development 11 2.5. Special Reliefs 12 2.6. Financial sector 13 2.7. Costs of reforming corporation tax 16 2.8. Other taxes: shifting the burden? 16 2.9. International issues 213. Empirical evidence of the impact of reforms on UK competitiveness 24 3.1. Rankings of effective tax rates 24 3.2. Effects on investment 264. Avoidance 34 4.1. Summary of anti-avoidance measures 34 4.2. General Anti-Abuse Rule 34 4.3. Code of Conduct for Banks 35 4.4. Finance Act 2014 provisions 38 4.5. Diverted Profits Tax 385. Conclusion 40
References 41Appendix 42
4 Business taxation under the Coalition

www.sBs.oxford.edu/tax 5
Executive summary
This report describes and evaluates the measures taken by the 2010-15 Coalition government to reform the UK business tax regime. The government’s aims, set out in its original agreement in 2010 were as follows:
“We will reform the corporate tax system by simplifying reliefs and allowances, and tackling avoidance, in order to reduce headline rates. Our aim is to create the most competitive corporate tax regime in the G20, while protecting manufacturing industries”.1
The report considers each of the aspects of these aims.
The UK tax system in 2015 is much more competitive internationally than it was in 2010. By cutting the main rate of corporation tax from 28 per cent to 20 per cent, the UK now has the equal lowest statutory tax rate in the G20 – compared to the 7th lowest rate in 2010. The UK has also cut its effective average tax rate substantially, although this has only improved its ranking within the G20 from 7th place to 5th place. The UK is also now a more attractive location for headquarter companies. Building on reforms introduced by the last Labour government, the Coalition has made the UK a more attractive location for multinational companies by reforming Controlled Foreign Corporation rules and introducing the Patent Box. The Patent Box, together with enhanced tax breaks has also created stronger incentives to undertake research and development in the UK. Raising the threshold for the Annual Investment Allowance has created significantly better incentives for investment by small and medium-sized companies. However, the reduction in general rates of capital allowances have tended to offset the benefits of the lower corporation tax rate for capital expenditure by large companies – to this extent, the reforms have been targeted away from manufacturing industries, despite the Coalition’s aims. These reforms have had a significant cost: using the government projections we estimate foregone corporation tax revenues in 2015/16 to be around £7.5 billion.
The Coalition has been true to its intention to combat tax avoidance, introducing a number of specific measures. The report highlights and discusses some of the more innovative and controversial measures, including the General Anti-Abuse Rule, the Code of Conduct for Banks, and the recently-announced Diverted Profits Tax. One general problem is the extent to which the aims of creating a competitive tax system and tackling avoidance may be in conflict with one another. Aggregating the government’s own estimates of the additional revenues generated from its anti-avoidance measures, we find that it expected to raise up to £7.5 billion in 2015/16 (although not all from business taxes). If this is a realistic estimate, then its scale could easily be large enough to affect business decisions and undermine the move towards competitiveness.
The government has been much less successful in trying to simplify the tax system. The Office of Tax Simplification recently identified that since
1 Coalition agreement, May 2010.
2010, the government has abolished 57 reliefs, but added 151 new ones. A large part of the problem of simplification stems from problems in fundamental structure of the tax system, including the international system for allocating the profit of a multinational company between countries. Despite its reforms, both at home and internationally, especially as part of the G20/OECD Base Erosion and Profit Shifting project, the Coalition government – like its predecessors - has been unwilling to address the underlying issue of the structure of the tax system. Until governments do so, the business tax system will continue to become more complex. And strong competitive forces – which the Coalition government has led and encouraged – will continue to push down rates of corporation tax and the associated tax revenues.
www.sBs.oxford.edu/tax 5

6 Business taxation under the Coalition
1. Introduction
The Coalition government that took office in 2010 was clear and ambitious in its objectives for business taxation, stating in its original agreement that:
“We will reform the corporate tax system by simplifying reliefs and allowances, and tackling avoidance, in order to reduce headline rates. Our aim is to create the most competitive corporate tax regime in the G20, while protecting manufacturing industries”.1
Nearly five years later, UK corporation tax has been significantly reformed. The UK tax system is generally acknowledged to be attractive for mobile international business, in a number of ways. It is also generous to small and medium sized enterprises (SMEs), and provides significant incentives for research and development (R&D). But problems remain. Despite introducing many anti-avoidance measures, there is now more public concern about tax avoidance than ever. And the government has found it difficult to simplify the UK business tax system.
This report sets out to describe and evaluate the measures taken by the Coalition government to reform the UK business tax regime, and the current state of the regime. We first review in Section 2 the most significant reforms since 2010. We then outline empirical evidence on the impact of those changes. In Section 3 we use a number of measures to evaluate the competitive position of the UK corporate tax system, and the impact of the Coalition’s reforms on business investment. In Section 4 we describe and evaluate the main measures taken to combat tax avoidance.
Competitiveness in business taxation is a key concept in the Coalition’s reform plans. The Corporate Tax Road Map which set out the government’s plans for corporation tax reform was focused squarely on the need to make the UK corporate tax more competitive. This began with a statement from the Exchequer Secretary, David Gauke, MP, declaring that “The Government wants to send out the signal loud and clear that Britain is open for business”.2 It went on to outline five principles for corporate tax reform:
• Lowering rates while maintaining the tax base• Maintaining stability• Being aligned with modern business practice• Avoiding complexity• Maintaining a level playing field for taxpayers. The specific reforms to corporation described in Section 2 below were nearly all outlined in the Road Map. So it is certainly
1 Coalition agreement, May 2010.
2 HM Treasury, Foreword, The Corporate Tax Roadmap, June 2010.
fair to say that the Coalition government set out a clear plan for corporation tax, and followed that plan closely, thereby removing some uncertainty for business.
But although the system is clearly more competitive than in 2010, the changes favour some businesses over others. Taxes on income from intellectual property and some forms of foreign income have been reduced, which favour multinational companies with significant research and development (R&D). But general rates of capital allowances have been cut, which tends to reduce the incentive for large business to invest in the UK, which calls into question the commitment of protecting the manufacturing industry. Despite this, the overall set of reforms has created a favourable environment for investment. In Section 3 we document evidence from the academic empirical literature on the effects of taxes on investment and foreign direct investment (FDI).
An increase in competitiveness through reducing tax rates almost inevitably implies a reduction in tax revenue. Using the projections made by the government at each Budget and Autumn Statement, we estimate annual foregone corporation tax revenues in a full year such as 2015/16 to be around £7.5 billion.3 This cost must be financed by a higher deficit, lower public sector spending and (or) an increase in other tax revenues.4 Partly this cost has been offset by a rise in value added tax (VAT) revenues, after the Coalition increased the standard rate of VAT for the first time since 1991.
The second key element of the corporation tax strategy was introduced in more detail in a March 2011 report, entitled Tackling Tax Avoidance. This also began with a statement from the Exchequer Secretary: “I want to be clear that being open for business does not mean being open to tax avoidance.” 5
Again, the Coalition government has remained largely true to this strategy. It has introduced a number of specific measures to combat avoidance. In Section 4, we highlight and discuss some of the more innovative and controversial measures. One issue, of course, is the extent to which the aims of creating a competitive tax system and tackling avoidance may be in conflict with one another. The government’s own estimates of the additional revenue generated from its anti-avoidance measures are large, and of a comparable magnitude to the costs of the corporation tax reforms. Although introducing anti-avoidance measures may have a different impact on investment and competitiveness compared with corporation tax reforms, the overall size of the estimated revenue from fighting avoidance may also have
3 Using a more sophisticated general equilibrium model, HM Treasury and HMRC
(2013) estimate the cost in 2016/7 to be £7.8 billion.
4 This report does not discuss the evolution of the UK budget deficit or that of
public spending under the Coalition. For a discussion of the evolution of the deficit
and public spending, see Crawford et al. (2015).
5 HM Treasury, Tackling Tax Avoidance, March 2011, page 8.

www.sBs.oxford.edu/tax 7
some real economic impact. It is clear, though, that in general (and with some exceptions) the government has not been willing to permit a lax anti-avoidance strategy to be part of its competitiveness agenda.
The third component of the government’s strategy was announced in its report entitled Tax Policy Making: a New Approach:6 “the Government is committed to a new approach to tax policy making, designed to support its ambition for a more predictable, stable and simple tax system: to increase predictability, the government will provide taxpayers with clarity on its approach and certainty on the future direction of the tax system; to increase stability, the government will slow down the rate of change to the tax code, focusing on fewer and better developed proposals supported by improved processes for changing tax law; to increase simplicity, the government has confirmed its intention to create an independent Office of Tax Simplification.”
In Section 2, we review special reliefs and we find little evidence of real simplification: the government has introduced as many reliefs as it has abolished, and the Office of Tax Simplification has counted over 1,000 reliefs remaining. The Coalition’s report also promised that the government would ensure there was sufficient opportunity for policy and legislation to be properly scrutinised, be more transparent about the rationale and impact of tax policy changes, and evaluate the impact of significant changes after implementation.
In the case of some of its measures – for example, in introducing the new Controlled Foreign Corporation (CFC) rules and the Patent Box regime - the Coalition has broadly followed this approach, being transparent about aims and objectives and consulting widely.7 Indeed, the government has been criticised at times for consulting perhaps too widely – there is possibly a grey area where consultation shades into lobbying. However, this approach has been at times inconsistent. For example, although there have been some attempts to evaluate significant tax reforms, there does not seem to have been a comprehensive approach to evaluation. And at times – most significantly with the recent Diverted Profits Tax, where the period between announcing the tax and it being implemented is likely to be very short – these principles have arguably been abandoned.8
It should also be noted at the outset that the policies set out by the Coalition did not mark a complete break from the previous Labour government. Certainly, some of the specific proposals originated with the Labour government, although it seems unlikely that if the Labour Party had formed the government since 2010, it would have been nearly as aggressive in reducing the main rate of corporation tax.
6 HM Treasury, Tax Policy Making: A new approach, June 2010.
7 A comparison of the UK’s record on tax policy making with that of other
countries is described in Wales and Wales (2013).
8 In defence of the government, it would argue that the Diverted Profits Tax is
an anti-avoidance measure, which the government reserves the right to introduce
without consultation.
Nevertheless, the Coalition’s business tax reforms have not generally been strongly contested politically.
A number of questions remain. Perhaps the most important question is why should the UK aim to have the most competitive regime in the G20? Among other things, this seems to offer a hostage to fortune: how would the Coalition have responded if another G20 member had decided to reduce its rate to, say, 5 per cent? What about competition with countries that are not part of the G20? In any case, it is not obvious that the optimal corporation tax rate for the UK is no higher than any other G20 country. It would be possible to make a case for UK tax rate to be higher than this – to generate more revenue during a period of large deficits – or lower – to be still more competitive. But perhaps it is better not to take the statement in the Coalition agreement too literally, but to interpret it more as a political statement designed to indicate that the government would not look to corporation tax to help reduce the deficit – indeed, rather that the government considered that creating incentives for business to locate and invest in the UK was a high priority.
One final point to note is that this report focuses on reforms introduced in the UK by the Coalition government. Of course, the government has also been actively engaged in corporation tax issues internationally, especially in the EU and the OECD. A major focus of debate over the last two years has been the OECD project on Base Erosion and Profit Shifting (BEPS). The UK government has been closely involved in this project, which has already contributed many consultation documents discussing potential reforms to the international tax system. However, this has not yet resulted in reforms in the UK, and we therefore only discuss the BEPS project and European Union (EU) initiatives briefly in Section 2.

8 Business taxation under the Coalition
2. Reforms to the business tax regime
In this section we review the main reforms to the tax code implemented by the Coalition (see table 1A in the Appendix). We consider various aspects of the reforms in turn, starting with cuts to the main rate of corporation tax and changes to the capital allowances regime. We then discuss measures targeted to large, internationally mobile companies: the introduction of the new CFC regime and the Patent Box. We describe the innovations to the R&D tax incentives schemes for both SMEs and for larger corporations. We then comment on the government’s progress towards its aim, set out in the original coalition agreement, of “simplifying reliefs and allowances”.1 Finally, we consider the costs of the reforms in terms of foregone tax revenues, and analyse the extent to which these costs have partially been compensated by higher revenues from other taxes, including those levied on the financial sector.
1 The Coalition: our programme for government, HM Government 2010.
2.1 Corporation Tax Rates and Base
Over the last 30 years and until the global financial crisis, governments across the OECD have gradually cut statutory rates of corporation tax to attract mobile activities and profits (see Figure 1). This trend had slowed by 2010 when the Coalition government took office. At that time, at the height of the global economic crisis, governments were struggling to reduce their budget deficits inflated by public intervention in the financial sector and by a shrinking economy. In this context, there was little room for tax cuts. This left governments facing a dilemma: whether to cut taxes on business in an attempt to stimulate investment and growth, or to maintain higher taxes on business in order to reduce the deficit or protect more public spending. In this context, most OECD countries decided to avoid large tax cuts.
The Coalition announced a very different plan: as it took office, the new government proclaimed its aim to make the UK the most competitive business tax regime in the G20, despite the consequences for public spending and the deficit. As of 2015, the Coalition has cut the main statutory corporation tax rate by 8 percentage points in five years, from 28 per cent in 2010 to 20 per cent in 2015. This is the (equal)
Figure 1. Statutory Corporation Tax Rates
GermanyOECD - Average
FranceUnited Kingdom
20%
25%
30%
35%
40%
45%
50%
55%
60%
1994
1995
1996
1997
1998
1999
2000
2001
2002
2003
2004
2005
2006
2007
2008
2009
2010
2011
2012
2013
2014
2015
Source: CBT tax database. www.sbs.ox.ac.uk/ideas-impact/tax/publications/data

www.sBs.oxford.edu/tax 9
lowest corporation tax rate in the G20 and the lowest in UK history. The small profits rate applicable to profits below £300,000 was cut from 21 to 20 per cent in 2011 so that in 2015, the UK has a single statutory corporation tax rate of 20 per cent.
In terms of tax revenue, these rate cuts have been partially compensated for by enlarging the tax base.2 In 2012, writing-down allowances for plant and machinery were cut from 20 to 18 per cent for the main pool and from 10 to 8 per cent for the special pool.3 Additionally, the government did not repeal the Labour government’s decision to phase out allowances for industrial buildings by 2011.
However, the value of allowances for SMEs differs markedly, due primarily to the Annual Investment Allowance (AIA). This was introduced by the Labour government in 2008, and gives a 100 per cent deduction for expenditure in plant and machinery with a threshold of investment initially of £50,000 and then of £100,000. The Coalition announced temporary changes to the AIA threshold several times. If the government’s announcement were credible, a temporarily higher threshold may provide an incentive for business to bring investment forward.4 In its first Budget in June 2010, the Coalition announced a cut in the AIA threshold to £25,000 to be implemented almost two years after the announcement, for expenditures incurred on or after 1 April 2012. However, subsequently, the AIA threshold was kept at £25,000 only for eight months (between 1 April and the 31 December 2012). It was then raised tenfold, again on a temporary basis, to £250,000 for expenditures incurred on or after 1 January 2013 and then doubled – yet again on a temporary basis - to £500,000 for expenditures incurred on or after 1 April 2014. Although the AIA is available for all companies, it narrows the tax base for SMEs substantially as it covers all or most of their investment in plant and machinery. We discuss this further in Section 3.2.
2.2 Reforms to the Controlled Foreign Company Regime
The tax rate is clearly an important element of the competitiveness of the UK corporation tax. Capital allowances are important for capital expenditure taking place in the UK. A reform of the CFC regime was instead targeted at multinational companies headquartered in the UK. CFC rules are an anti-avoidance measure whereby under certain conditions profits of CFCs located in low-tax jurisdictions are taxed upon accrual at the domestic corporation tax rate. The old UK CFC rules had been designed for a system of worldwide taxation in which
2 Using a panel of 29 OECD countries (1980-2008), Slemrod and Kawano (2012)
find only limited evidence for a general tendency towards rate cut cum base broadening
tax policies. In their data, rate cuts were accompanied by base broadening measures
39 per cent of the time and by base narrowing measures 32 per cent of the time. Rate
cut cum base broadening policies have however characterised UK tax policy since the
1980s.
3 The main pool attracts the majority of standard plant and equipment. The main
items in the special pool will be long-life assets or cars with higher CO2 emissions.
4 Clearly, frequent and close announcements of temporary increases reduce the
credibility of each further announcement.
repatriated dividends of UK companies were taxable in the UK; and the rules had been deemed stringent and not in line with business practices.5 A reform of the CFC regime was first launched by the Labour government and in part motivated by a ruling of the Court of Justice of the European Union (CJEU).6 The Coalition continued Labour’s plan and delivered the final CFC regime applicable to financial years starting on or after 1 January 2013.
The new regime is considered more business friendly than the previous one for a number of reasons. The new regime is now based on an estimate of the amount of profit diverted from the UK whilst the previous regime had an entity-based approach: all or none of the profit of a CFC was subject to the CFC rules. The new regime targets the “artificial” diversion of profits and passive income when there is no economic substance in the low-tax location of the profits whereas in the previous regime all passive income and profits located in a low-tax jurisdiction may have been subject to the CFC rules.7 The principles underlying the new regime are reflected in the introduction of specific exemptions. For example, the new regime provides for a 12 months’ exemption for foreign subsidiaries which come under UK control, after the restructuring of a group. This facilitates reorganizations involving UK companies.
However, some provisions have proved controversial. In particular, the finance company exemption provides that only one quarter of profits earned by a CFC from loans to overseas companies is taxable at the main UK corporate income tax rate. This implies that the effective tax rate for such companies in 2015 is 5 per cent. This has been strongly criticised as helping UK companies to shift profit from other jurisdictions to tax havens. In one way the criticism appears valid: interest paid from a high tax jurisdiction to a tax haven CFC will receive relief in the high tax jurisdiction and pay little or no tax either in the tax haven or in the UK. From another perspective, however, it is questionable as to whether the UK should tax this income. If it was not ultimately generated in the UK, and if the CFC is financed by equity then subsequent dividends are no longer taxable in the UK. So it is not obvious that the interest income arising in the tax haven should be subject to UK tax. Whatever the merits of the arrangement, however, this rule does appear to create a competitive advantage to locating a headquarters company in the UK.
5 See, for example, Griffith et al., 2010.
6 In September 2006 in the Cadbury Schweppes plc case, the CJEU held that the
UK CFC rules restricted the freedom of establishment within the EU.
7 The new CFC regime is also an EU compliant regime whilst the previous CFC
rules entailed two separate CFC regimes: one for the EU and one for non-EU
jurisdictions.

10 Business taxation under the Coalition
2.3 The Patent Box
The Patent Box was introduced by the Coalition but it was first proposed by the Labour government in its 2009 Pre-Budget Report.8 In a nutshell, the Patent Box rules enable companies to apply a lower rate of corporation tax (10 per cent) to profits earned from exploiting patented inventions. The Patent Box was promoted as a tool for making the UK a more attractive location for innovative industries, and it became one of the key elements in the Coalition’s strategy to create the most competitive tax system in the G20.9 Following two rounds of consultations on design, legislation to introduce the Patent Box was included in the Finance Act 2012. The reform came into effect from 1 April 2013; however, the benefits of this relief have been phased in gradually, aiming to reach their full potential in 2017.10
To benefit from the Patent Box regime a company must own (or exclusively license-in) the patents and must have undertaken qualifying development by making a significant contribution to either: (i) the creation or development of the patented invention, or (ii) a product incorporating the patented invention. The controversial element was that the qualifying development might be undertaken by another member of the same group. In order to benefit from the Patent Box regime, the group member claiming the Patent Box had to take a significant role in managing the portfolio of eligible patents. Only income earned from exploiting patented inventions could benefit from a lower tax rate. Broadly speaking, the relevant intellectual property (IP) income may come from selling patented products, licensing out patent rights, selling patented rights, infringement income, and damages, insurance or other compensation related to patent rights.
The Patent Box has proved controversial. It was welcomed by the business community and has been referred to as an important consideration in their commercial decisions as to the location of IP-related activities. However, other countries, particularly Germany, raised concerns over “harmful” tax competition. The heart of the dispute was the extent to which the Patent Box could be a device for encouraging companies to shift to the UK the ownership of patents created elsewhere. It was felt by many that the Patent Box could be exploited in this way. This was exacerbated as concerns about base erosion and profit shifting led to intense debate at the OECD and the EU.
Under the OECD BEPS Action Plan, the beneficial tax treatment of intellectual property was explicitly addressed through Action 5 (“Counter harmful tax practices more effectively, taking into account
8 HM Treasury, Pre-Budget Report, Securing the Recovery: Growth and
Opportunity, December 2009, para 4.40.
9 HM Treasury, The 2010 Corporate Tax Road Map, para 3.15.
10 Companies need to apply an appropriate percentage to the company
earnings from patented inventions, i.e. 1 April 2013 to 31 March 2014: 60 per
cent; 1 April 2014 to 31 March 2015: 70 per cent; 1 April 2015 to 31 March
2016: 80 per cent; 1 April 2016 to 31 March 2017: 90 per cent; and from 1 April
2017: 100 per cent.
transparency and substance”). This emphasised the need to ensure that profits are not geographically divorced from real economic activities. To promote this objective in the context of Action 5, the requirement of substantial activity was elevated to one of the key factors that help to assess if any given preferential regime is potentially “harmful”. Three approaches were considered to test for substantial activities: (i) a value creation approach, (ii) a transfer pricing approach, and (iii) a nexus approach. In an OECD publication in September 2014 the UK, Luxembourg, the Netherlands and Spain were in the minority with their preference for the transfer pricing approach, whereas the majority of 40 countries supported the modified nexus approach.11
In parallel, the Patent Box regime was also scrutinised by the EU Code of Conduct Group for Business Taxation. The Council of the European Union invited the Group to assess all patent boxes in the EU, taking into account the relevant international developments. In addition, the European Commission started gathering information to access this type of tax relief under EU State Aid Law.
These tensions have been resolved through negotiation with Germany which reached an agreement in November 2014.12 The compromise solution was developed on the basis of the modified nexus approach, which requires a close link between the jurisdiction where patents have been developed and the jurisdiction granting patent box benefits. Existing IP regimes need to be closed to new entrants by 30 June 2016 and should be abolished by 30 June 2021. A new regime incorporating the “modified nexus approach” will co-exist in parallel with the old one until 2021. After this date, all countries have to maintain “nexus-compliant” regimes. When the new rules are further developed in the international arena, the UK Government will initiate consultations on the legislative amendments required to make the UK Patent Box compliant with the re-modified nexus approach.13
The UK-German compromise on the Patent Box was described by the Coalition government as “a great deal for Britain” but the evaluation given by the business community is less optimistic.14 There also remain questions about whether the new approach is compatible with EU law. And there remain questions as regards the operation of the new approach, such as the tracking and tracing methodology for qualifying R&D expenditures.
11 BEPS 2014 Deliverable: Counter harmful tax practices (Action 5, September 2014).
See OECD (2014).
12 Germany-UK Joint Statement “Proposals for New Rules for Preferential IP
Regimes” (11 November 2014).
13 The compromise solution was presented to the OECD-G20 members at
the Forum on Harmful Tax Practices (FHTP) and to EU Member States at the
Code of Conduct Group. It is now being taken forward by the FHTP which will
determine how to put this approach into practice. The EU Code of Conduct Group
also endorsed the modified nexus approach, and it will continue to monitor the
developments taking place in this respect from 2015.
14 Goundar (2014).

www.sBs.oxford.edu/tax 11
2.4 Research and Development
R&D tax incentives are an important part of the UK corporate tax system. For decades, British firms have been undertaking lower R&D than their counterparts in the US, Germany, Japan and France (see Figure 2). To counter this trend, the Labour government introduced R&D tax incentives in the early 2000s and progressively made them more generous. The R&D tax relief in the form of a deduction from the tax base was introduced for SMEs15 in 2000 and then for large companies in 2002.16 Following the same approach, the Coalition
15 For the purpose of the R&D Tax Relief for SMEs, a company needed to have fewer
than 250 employees, and either a turnover of less than €50 million (around £37 million) or
a balance sheet size of less than €43 million (around £32 million) and should not be part of
a group that exceeds the thresholds, with the definition of such affiliation determined by a
minimum of 25 per cent share ownership. Applicable exchange rates are published on the
HMRC website.
16 In the beginning, the enhanced deduction scheme allowed SMEs to tax deduct £150
for every £100 spent in R&D and for larger companies, £125 for every £100 of R&D
expenditure. Additionally, loss-making SMEs were eligible for cash payments. All companies
could carry forward their losses calculated using the enhanced deduction rates. The Labour
Government increased the deduction rates in 2008, from 150 to 175 percent for SMEs
and from 125 to 130 percent for large companies. In the same year, the generosity of the
scheme was expanded when the SME thresholds were doubled .
government increased the R&D tax relief in scale and generosity.
HM Treasury held two wide-scale consultations on the R&D tax credit scheme involving individual and institutional stakeholders from industry, professional associations, accountancy and consultancy firms, policymakers and academia. The first consultation started in November 2010, for which the conclusions were summarized in the June 2011 report,17 emphasizing the need for further investigation into the specific suggestions put forward, including an “above the line” credit. This is a tax credit, that is an amount which can be directly deducted from the corporate tax liability, and the tax credit itself is taxable. The R&D tax relief discussed above is instead a deduction on the corporate tax base. In March 2012, consultations began for the “above the line” credit. The idea was to gradually replace the deduction scheme for large companies, first giving them the option to choose one of the two schemes (from April 2013) and then completely transforming the
17 The consultation was launched in the document “Tax policy making: a new
approach” published with the June 2010 Budget. The complete consultation
document was “Corporate Tax Reform: delivering a more competitive system”
(section “The taxation of innovation and intellectual property”). A summary of
the results and further consultation is available in the June 2011 document titled:
“Research and Development tax credits: response and further consultation”.
Figure 2. Business enterprise research and development as a share of total GDP
European Union (15 countries)United KingdomFrance
GermanyUnited StatesJapan
1%
1.5%
2%
2.5%
1990
1991
1992
1993
1994
1995
1996
1997
1998
1999
2000
2001
2002
2003
2004
2005
2006
2007
2008
2009
2010
2011
2012
Source: OECD Main Science and Technology Indicators Database
12 Business taxation under the Coalition
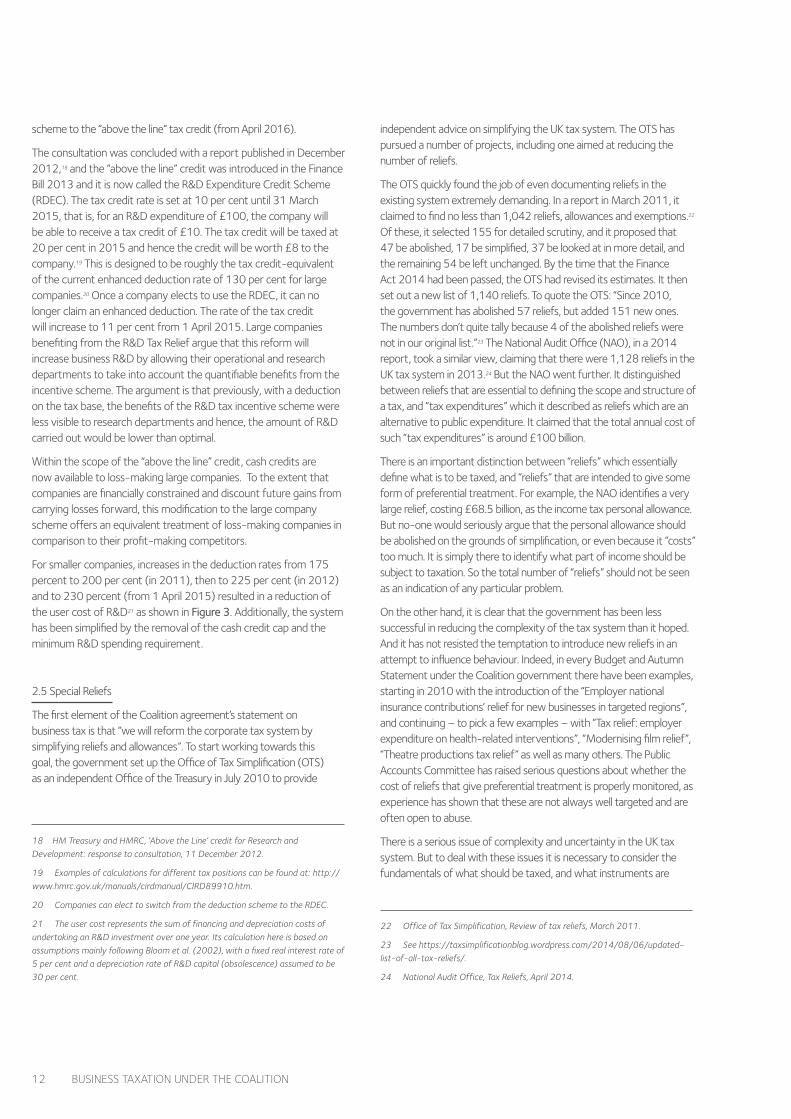
scheme to the “above the line” tax credit (from April 2016).
The consultation was concluded with a report published in December 2012,18 and the “above the line” credit was introduced in the Finance Bill 2013 and it is now called the R&D Expenditure Credit Scheme (RDEC). The tax credit rate is set at 10 per cent until 31 March 2015, that is, for an R&D expenditure of £100, the company will be able to receive a tax credit of £10. The tax credit will be taxed at 20 per cent in 2015 and hence the credit will be worth £8 to the company.19 This is designed to be roughly the tax credit-equivalent of the current enhanced deduction rate of 130 per cent for large companies.20 Once a company elects to use the RDEC, it can no longer claim an enhanced deduction. The rate of the tax credit will increase to 11 per cent from 1 April 2015. Large companies benefiting from the R&D Tax Relief argue that this reform will increase business R&D by allowing their operational and research departments to take into account the quantifiable benefits from the incentive scheme. The argument is that previously, with a deduction on the tax base, the benefits of the R&D tax incentive scheme were less visible to research departments and hence, the amount of R&D carried out would be lower than optimal.
Within the scope of the “above the line” credit, cash credits are now available to loss-making large companies. To the extent that companies are financially constrained and discount future gains from carrying losses forward, this modification to the large company scheme offers an equivalent treatment of loss-making companies in comparison to their profit-making competitors.
For smaller companies, increases in the deduction rates from 175 percent to 200 per cent (in 2011), then to 225 per cent (in 2012) and to 230 percent (from 1 April 2015) resulted in a reduction of the user cost of R&D21 as shown in Figure 3. Additionally, the system has been simplified by the removal of the cash credit cap and the minimum R&D spending requirement.
2.5 Special Reliefs
The first element of the Coalition agreement’s statement on business tax is that “we will reform the corporate tax system by simplifying reliefs and allowances”. To start working towards this goal, the government set up the Office of Tax Simplification (OTS) as an independent Office of the Treasury in July 2010 to provide
18 HM Treasury and HMRC, ‘Above the Line’ credit for Research and
Development: response to consultation, 11 December 2012.
19 Examples of calculations for different tax positions can be found at: http://
www.hmrc.gov.uk/manuals/cirdmanual/CIRD89910.htm.
20 Companies can elect to switch from the deduction scheme to the RDEC.
21 The user cost represents the sum of financing and depreciation costs of
undertaking an R&D investment over one year. Its calculation here is based on
assumptions mainly following Bloom et al. (2002), with a fixed real interest rate of
5 per cent and a depreciation rate of R&D capital (obsolescence) assumed to be
30 per cent.
independent advice on simplifying the UK tax system. The OTS has pursued a number of projects, including one aimed at reducing the number of reliefs.
The OTS quickly found the job of even documenting reliefs in the existing system extremely demanding. In a report in March 2011, it claimed to find no less than 1,042 reliefs, allowances and exemptions.22 Of these, it selected 155 for detailed scrutiny, and it proposed that 47 be abolished, 17 be simplified, 37 be looked at in more detail, and the remaining 54 be left unchanged. By the time that the Finance Act 2014 had been passed, the OTS had revised its estimates. It then set out a new list of 1,140 reliefs. To quote the OTS: “Since 2010, the government has abolished 57 reliefs, but added 151 new ones. The numbers don’t quite tally because 4 of the abolished reliefs were not in our original list.”23 The National Audit Office (NAO), in a 2014 report, took a similar view, claiming that there were 1,128 reliefs in the UK tax system in 2013.24 But the NAO went further. It distinguished between reliefs that are essential to defining the scope and structure of a tax, and “tax expenditures” which it described as reliefs which are an alternative to public expenditure. It claimed that the total annual cost of such “tax expenditures” is around £100 billion.
There is an important distinction between “reliefs” which essentially define what is to be taxed, and “reliefs” that are intended to give some form of preferential treatment. For example, the NAO identifies a very large relief, costing £68.5 billion, as the income tax personal allowance. But no-one would seriously argue that the personal allowance should be abolished on the grounds of simplification, or even because it “costs” too much. It is simply there to identify what part of income should be subject to taxation. So the total number of “reliefs” should not be seen as an indication of any particular problem.
On the other hand, it is clear that the government has been less successful in reducing the complexity of the tax system than it hoped. And it has not resisted the temptation to introduce new reliefs in an attempt to influence behaviour. Indeed, in every Budget and Autumn Statement under the Coalition government there have been examples, starting in 2010 with the introduction of the “Employer national insurance contributions’ relief for new businesses in targeted regions”, and continuing – to pick a few examples – with “Tax relief: employer expenditure on health-related interventions”, “Modernising film relief”, “Theatre productions tax relief” as well as many others. The Public Accounts Committee has raised serious questions about whether the cost of reliefs that give preferential treatment is properly monitored, as experience has shown that these are not always well targeted and are often open to abuse.
There is a serious issue of complexity and uncertainty in the UK tax system. But to deal with these issues it is necessary to consider the fundamentals of what should be taxed, and what instruments are
22 Office of Tax Simplification, Review of tax reliefs, March 2011.
23 See https://taxsimplificationblog.wordpress.com/2014/08/06/updated-
list-of-all-tax-reliefs/.
24 National Audit Office, Tax Reliefs, April 2014.

www.sBs.oxford.edu/tax 13
required. For example, as the OTS argued in its 2011 report, merging income tax and national insurance contributions would be a long term project of structural reform that could deliver a major simplification to the tax system. The Coalition government has failed to address such fundamental issues, and has instead presided over a system that continues to grow in complexity and uncertainty.
2.6 The costs of corporation tax reforms
In Section 3 below we discuss how far the corporation tax reforms have succeeded in improving the competitiveness of the UK tax system. However, there is clearly a cost to that, in terms of foregone revenue from reducing the rate and implementing other reforms. Table 1 summarises the government’s own anticipated revenue costs, taken from Budget and Autumn Statement documents between June 2010 and December 2014. We report post-behavioural costs that take account of the responses of business and other economic agents to the tax reforms. Static costs are also available for some measures, but
the behavioural costs are more widely available.25 Of course, attempting to take into account behavioural responses to tax reforms is extremely difficult, and so the figures should be interpreted in that light.
In aggregate, based on these figures, the cost of gradually reducing the main rate of corporate income tax between 2010/11 and 2015/16 has been about £18.6 billion. For a single year, 2015/16, when the rate will be 20 per cent, the anticipated cost is identified as £7.2 billion. This amounts to nearly 20 per cent of the average annual corporate
25 For the purpose of estimating the effect of different tax measures on public
finances, the OBR employs both static and post-behavioural costings. For the static
costings, it estimates the cost of the measure by keeping the relevant tax base
constant and for example, by applying to such base a lower corporate income tax
rate. It then adjusts the tax base for potential behavioural responses triggered by
the measure and produces the post-behavioural costing. For more information, see
OBR (2014).
Large company for R&D tax credit, pays main rateSME for R&D tax credit, pays main rateLarge company for R&D tax credit, pays small profits rateSME for R&D tax credit, pays small profits rate
0.6
0.7
0.65
0.75
0.8
0.85
0.9
0.95
2002
2003
2004
2005
2006
2007
2008
2009
2010
2011
2012
2013
2014
2015
2016
Figure 3 Evolution of the tax component of the user cost for research and development
Source: Guceri and Liu (2014), mimeo. The figure does not show the user cost for companies which are eligible for marginal rate relief.

14 Business taxation under the Coalition
Table 1. Costings of the corporation tax reform Amounts: £ million
Tax year Changes Announcement year 2010/11 2011/12 2012/13 2013/14 2014/15 2015/16 Total
Changes to the main rate of corporate income tax
2011/12 28% to 27% 2010 -10 -400
27% to 26% 2011 -425
2012/13 28% to 26% 2010 -1,000
26% to 25% 2011 -670
25% to 24% 2012 -405
2013/14 28% to 25% 2010 -1,720
25% to 24% 2011 -705
24% to 23% 2012 -695
23% (Autumn Statement)2012 -5
2014/15 28% to 24% 2010 -3,105
24% to 23% 2011 -905
23% to 22% 2012 -915
22% to 21% (Autumn Statement)2012 -495
21% to 20% 2013 -10
2015/16 28% to 24% 2010 -3,775
24% to 23% 2011 -965
23% to 22% 2012 -975
22% to 21% (Autumn Statement)2012 -940
21% to 20% 2013 -510
Total main rate -10 -825 -2,075 -3,125 -5,430 -7,165 -18,630
Changes in capital allowances
WDAs general pol: 20% to 18% 2010 (estimates form Budget 2012) 695 1,180 1,115 1,075 4,065
WDAs special pool 10% to 8%
Annual Investment Allowance Thresholds
From £100k to £25k 2010 155 605 570 575
From £25k to £250k 2012 -305 -670 -910 -400
From £250k to £500k 2014 -85 -665
Total capital allowances -150 -65 -425 -490 -1,130
Total main rate + capital allowances -10 -825 -1,530 -2,010 -4,740 -6,580 -15,695

www.sBs.oxford.edu/tax 15
Changes Announcement year 2010/11 2011/12 2012/13 2013/14 2014/15 2015/16 Total
Controlled Foreign Corporation (CFC) rules
Interim changes 2011 -55 -15 -25 -25 -25
Full CFC rules 2011 -210 -540 -770 -840
Additional CFC modifications 2012 210 365 320 150
Total CFC rules -55 -15 -200 -475 -715 -1,460
Research and development
Small, medium companies (SMEs)
Enhanced deduction rate: 175 to 200 2011 -20 -75 -105 -105 -115
Enhanced deduction rate: 200 to 225
Enhanced deduction rate: 200 to 225 2014 -5 -35
Large companies
ATL introduced 2012 5 -205
ATL increase to 10% 2013 -20 -80 -85
Cash for loss making large companies
All companies
SMEs: enhanced deduction rate 225 to 230 2014 (Autumn Statement)
-45
Large: ATL 10% to 11%
Restriction on qualifying expenditure 2014 (Autumn Statement)
20
Total R&D regime -20 -75 -120 -395 -260 -870
Changes in the small profits rate
22% to 20% 2010 -100 -1,000 -1,300 -1,400 -3,800
Total -10 -1,000 -2,620 -3,630 -7,010 -7,555 -21,825
16 Business taxation under the Coalition
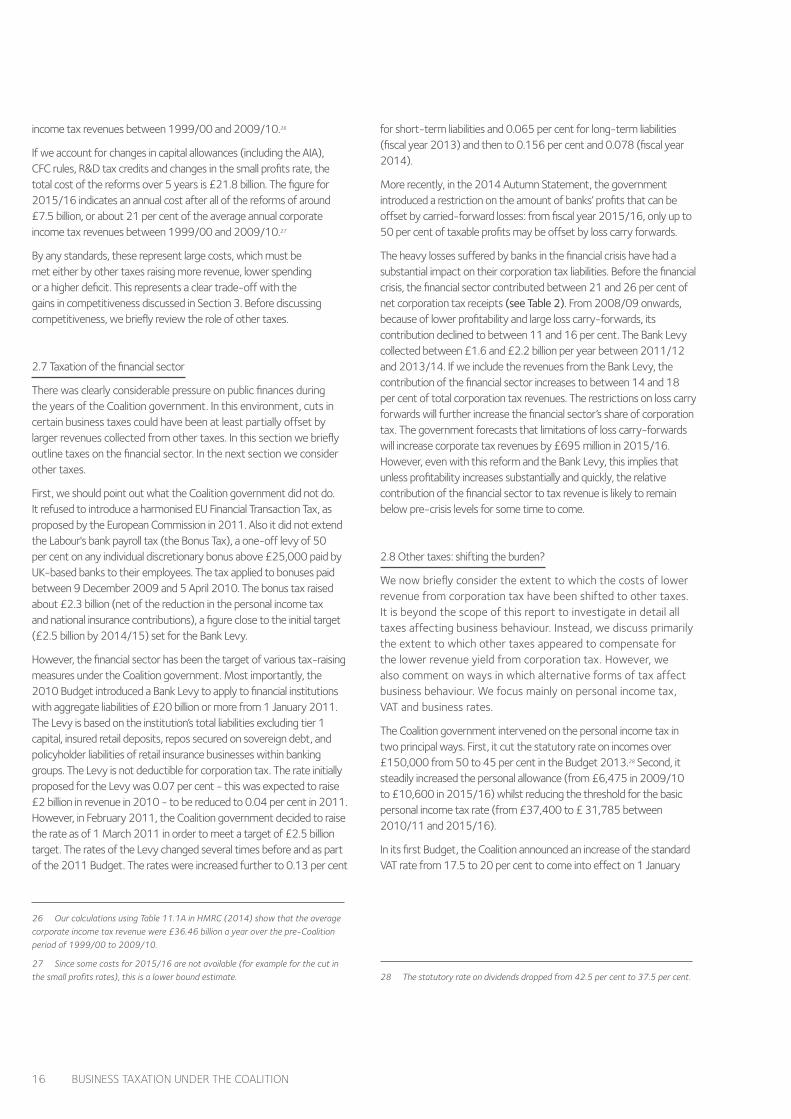
income tax revenues between 1999/00 and 2009/10.26
If we account for changes in capital allowances (including the AIA), CFC rules, R&D tax credits and changes in the small profits rate, the total cost of the reforms over 5 years is £21.8 billion. The figure for 2015/16 indicates an annual cost after all of the reforms of around £7.5 billion, or about 21 per cent of the average annual corporate income tax revenues between 1999/00 and 2009/10.27
By any standards, these represent large costs, which must be met either by other taxes raising more revenue, lower spending or a higher deficit. This represents a clear trade-off with the gains in competitiveness discussed in Section 3. Before discussing competitiveness, we briefly review the role of other taxes.
2.7 Taxation of the financial sector
There was clearly considerable pressure on public finances during the years of the Coalition government. In this environment, cuts in certain business taxes could have been at least partially offset by larger revenues collected from other taxes. In this section we briefly outline taxes on the financial sector. In the next section we consider other taxes.
First, we should point out what the Coalition government did not do. It refused to introduce a harmonised EU Financial Transaction Tax, as proposed by the European Commission in 2011. Also it did not extend the Labour's bank payroll tax (the Bonus Tax), a one-off levy of 50 per cent on any individual discretionary bonus above £25,000 paid by UK-based banks to their employees. The tax applied to bonuses paid between 9 December 2009 and 5 April 2010. The bonus tax raised about £2.3 billion (net of the reduction in the personal income tax and national insurance contributions), a figure close to the initial target (£2.5 billion by 2014/15) set for the Bank Levy.
However, the financial sector has been the target of various tax-raising measures under the Coalition government. Most importantly, the 2010 Budget introduced a Bank Levy to apply to financial institutions with aggregate liabilities of £20 billion or more from 1 January 2011. The Levy is based on the institution’s total liabilities excluding tier 1 capital, insured retail deposits, repos secured on sovereign debt, and policyholder liabilities of retail insurance businesses within banking groups. The Levy is not deductible for corporation tax. The rate initially proposed for the Levy was 0.07 per cent - this was expected to raise £2 billion in revenue in 2010 - to be reduced to 0.04 per cent in 2011. However, in February 2011, the Coalition government decided to raise the rate as of 1 March 2011 in order to meet a target of £2.5 billion target. The rates of the Levy changed several times before and as part of the 2011 Budget. The rates were increased further to 0.13 per cent
26 Our calculations using Table 11.1A in HMRC (2014) show that the average
corporate income tax revenue were £36.46 billion a year over the pre-Coalition
period of 1999/00 to 2009/10.
27 Since some costs for 2015/16 are not available (for example for the cut in
the small profits rates), this is a lower bound estimate.
for short-term liabilities and 0.065 per cent for long-term liabilities (fiscal year 2013) and then to 0.156 per cent and 0.078 (fiscal year 2014).
More recently, in the 2014 Autumn Statement, the government introduced a restriction on the amount of banks’ profits that can be offset by carried-forward losses: from fiscal year 2015/16, only up to 50 per cent of taxable profits may be offset by loss carry forwards.
The heavy losses suffered by banks in the financial crisis have had a substantial impact on their corporation tax liabilities. Before the financial crisis, the financial sector contributed between 21 and 26 per cent of net corporation tax receipts (see Table 2). From 2008/09 onwards, because of lower profitability and large loss carry-forwards, its contribution declined to between 11 and 16 per cent. The Bank Levy collected between £1.6 and £2.2 billion per year between 2011/12 and 2013/14. If we include the revenues from the Bank Levy, the contribution of the financial sector increases to between 14 and 18 per cent of total corporation tax revenues. The restrictions on loss carry forwards will further increase the financial sector’s share of corporation tax. The government forecasts that limitations of loss carry-forwards will increase corporate tax revenues by £695 million in 2015/16. However, even with this reform and the Bank Levy, this implies that unless profitability increases substantially and quickly, the relative contribution of the financial sector to tax revenue is likely to remain below pre-crisis levels for some time to come.
2.8 Other taxes: shifting the burden?
We now briefly consider the extent to which the costs of lower revenue from corporation tax have been shifted to other taxes. It is beyond the scope of this report to investigate in detail all taxes affecting business behaviour. Instead, we discuss primarily the extent to which other taxes appeared to compensate for the lower revenue yield from corporation tax. However, we also comment on ways in which alternative forms of tax affect business behaviour. We focus mainly on personal income tax, VAT and business rates.
The Coalition government intervened on the personal income tax in two principal ways. First, it cut the statutory rate on incomes over £150,000 from 50 to 45 per cent in the Budget 2013.28 Second, it steadily increased the personal allowance (from £6,475 in 2009/10 to £10,600 in 2015/16) whilst reducing the threshold for the basic personal income tax rate (from £37,400 to £ 31,785 between 2010/11 and 2015/16).
In its first Budget, the Coalition announced an increase of the standard VAT rate from 17.5 to 20 per cent to come into effect on 1 January
28 The statutory rate on dividends dropped from 42.5 per cent to 37.5 per cent.

www.sBs.oxford.edu/tax 17
2011.29 This was the first change in the standard VAT rate since 1991, with the exception of the anti-cyclical cut from 17.5 to 15 per cent between 1 December 2008 and 31 December 2009. Until 2007/08, the VAT rate was 12.5 percentage points lower (17.5 per cent) than the corporate income tax rate (30 per cent). By 2015/16, at the end of the Coalition term both the VAT and corporate income tax rate are 20 per cent. Whilst there were some attempts at broadening the VAT base by the government, most notably with the infamous “pasties’ tax”,30 ultimately no significant measures were adopted, although studies show that, given current levels of base erosion, revenue gains could be significant.31
The Coalition government also intervened on business rates. Business
29 The UK was not alone, however; on the contrary, the increase was part of a
trend witnessed both within Europe, and more generally within OECD countries. As
demonstrated in Table 1, during the period between 2008 and 2014 a staggering
22, out of the 28 EU Member States, increased their VAT rates; amongst the few
Member States not to change their rates was Germany, which had increased its
standard rate by 3 per cent the year before. At OECD, after a period of relative
stability between 1996 and 2008, the average standard rate of VAT started to rise
again after 2008, and it now stands at around 21.5 per cent, leaving the UK still
below the OECD average (OECD, 2012).
30 In 2012, the Chancellor of the Exchequer George Osborne proposed to unify
the VAT treatment of all hot takeaway food so that the VAT would be charged at
20 per cent in all cases. At the moment, some types of take away food are zero
rated (if bought to be consumed at home) and some are charged the 20 per cent
rate (if bought to be consumed at a restaurant).
31 Crawford et al. (2010).
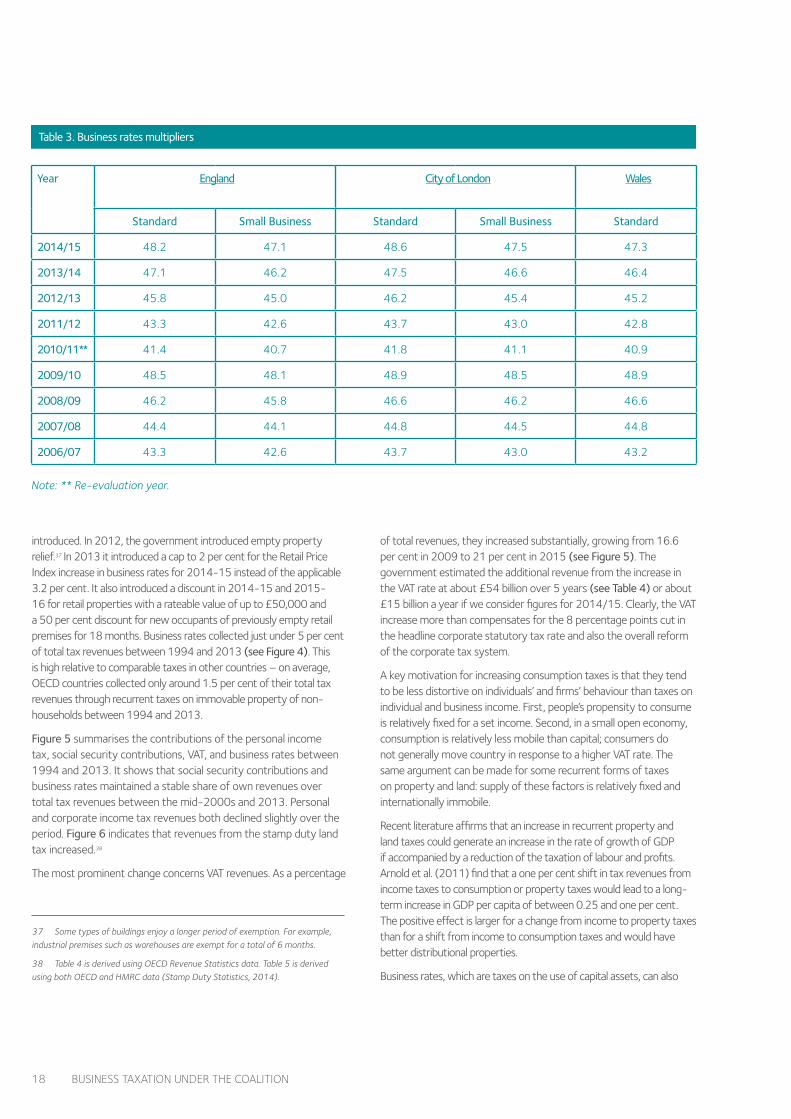
rates are charged on most non-domestic properties,32 and are collected by the local authority at a rate set by central government. The business rate liability is calculated by multiplying the rateable value set by the Valuation Office Agency every 5 years and the multiplier (the Uniform Business Rate), set annually by the government. The multiplier is set separately for England, Wales and the City of London. It is increased by the Retail Price Index every year. Within England and the City of London, there are two multipliers, a standard one and a small business33 one, while for Wales there is only a standard multiplier. Table 3 shows the multipliers over the period 2006/07 – 2014/15.
Four times since the first Coalition budget in June 2010, the government has announced the extension of the temporary doubling34 of the small business relief in England, now running until April 2015. This gives “full relief for eligible businesses occupying premises with a rateable value of up to £6,000 and tapering relief35 to £12,000” (Budget 2010).36 A number of other reforms have also been
32 Exemptions include agricultural land and buildings, buildings used for training
or welfare of disabled people and buildings registered for public religious worship or
church halls.
33 A business is considered as a small business for the purpose of business rates
if its property has a rateable value below £18,000 (£25,500 in Greater London).
34 The normal rate is 50 per cent so doubling means a 100 per cent, or full
relief from the applicable business rate.
35 This means that the relief gradually decreases from 100 per cent to 0 for
properties with a rateable value between £6,001 and £12,000.
36 The threshold for the rateable value is £25,500 for London.
Table 2. Corporation Tax and Bank Levy net receipts. Amounts: £ million
2000-01 2001-02 2002-03 2003-04 2004-05 2005-06 2006-07 2007-08 2008-09 2009-10 2010-11 2011-12 2012-13 2013-14
Corporation tax receipts for financial sector excluding life assurance
8,445 8,094 6,409 5,844 7,282 9,543 10,733 10,293 6,954 4,565 6,157 4,456 5,151 4,797
Total net receipts of corporation tax
32,421 32,041 29,268 28,077 33,573 41,829 44,308 46,383 43,077 35,805 42,121 42,151 39,452 39,274
Percentage contribution of financial sector
26.0% 25.3% 21.9% 20.8% 21.7% 22.8% 24.2% 22.2% 16.1% 12.7% 14.6% 10.6% 13.1% 12.2%
Bank levy receipts 1,612 1,594 2,200
Source: HMRC Corporation Tax Statistics, table 11.1A, 2014.
18 Business taxation under the Coalition
introduced. In 2012, the government introduced empty property relief.37 In 2013 it introduced a cap to 2 per cent for the Retail Price Index increase in business rates for 2014-15 instead of the applicable 3.2 per cent. It also introduced a discount in 2014-15 and 2015-16 for retail properties with a rateable value of up to £50,000 and a 50 per cent discount for new occupants of previously empty retail premises for 18 months. Business rates collected just under 5 per cent of total tax revenues between 1994 and 2013 (see Figure 4). This is high relative to comparable taxes in other countries – on average, OECD countries collected only around 1.5 per cent of their total tax revenues through recurrent taxes on immovable property of non-households between 1994 and 2013.
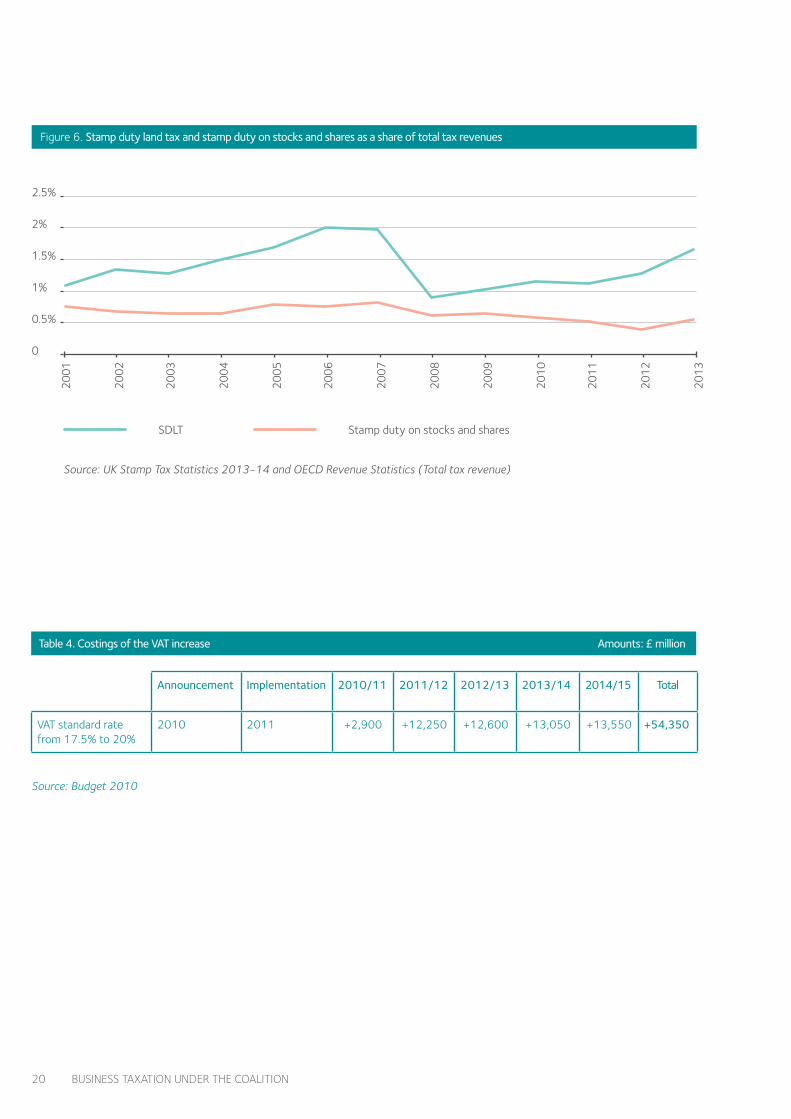
Figure 5 summarises the contributions of the personal income tax, social security contributions, VAT, and business rates between 1994 and 2013. It shows that social security contributions and business rates maintained a stable share of own revenues over total tax revenues between the mid-2000s and 2013. Personal and corporate income tax revenues both declined slightly over the period. Figure 6 indicates that revenues from the stamp duty land tax increased.38
The most prominent change concerns VAT revenues. As a percentage
37 Some types of buildings enjoy a longer period of exemption. For example,
industrial premises such as warehouses are exempt for a total of 6 months.
38 Table 4 is derived using OECD Revenue Statistics data. Table 5 is derived
using both OECD and HMRC data (Stamp Duty Statistics, 2014).
of total revenues, they increased substantially, growing from 16.6 per cent in 2009 to 21 per cent in 2015 (see Figure 5). The government estimated the additional revenue from the increase in the VAT rate at about £54 billion over 5 years (see Table 4) or about £15 billion a year if we consider figures for 2014/15. Clearly, the VAT increase more than compensates for the 8 percentage points cut in the headline corporate statutory tax rate and also the overall reform of the corporate tax system.
A key motivation for increasing consumption taxes is that they tend to be less distortive on individuals’ and firms’ behaviour than taxes on individual and business income. First, people’s propensity to consume is relatively fixed for a set income. Second, in a small open economy, consumption is relatively less mobile than capital; consumers do not generally move country in response to a higher VAT rate. The same argument can be made for some recurrent forms of taxes on property and land: supply of these factors is relatively fixed and internationally immobile.
Recent literature affirms that an increase in recurrent property and land taxes could generate an increase in the rate of growth of GDP if accompanied by a reduction of the taxation of labour and profits. Arnold et al. (2011) find that a one per cent shift in tax revenues from income taxes to consumption or property taxes would lead to a long-term increase in GDP per capita of between 0.25 and one per cent. The positive effect is larger for a change from income to property taxes than for a shift from income to consumption taxes and would have better distributional properties.
Business rates, which are taxes on the use of capital assets, can also
Table 3. Business rates multipliers
Year England City of London Wales
Standard Small Business Standard Small Business Standard
2014/15 48.2 47.1 48.6 47.5 47.3
2013/14 47.1 46.2 47.5 46.6 46.4
2012/13 45.8 45.0 46.2 45.4 45.2
2011/12 43.3 42.6 43.7 43.0 42.8
2010/11** 41.4 40.7 41.8 41.1 40.9
2009/10 48.5 48.1 48.9 48.5 48.9
2008/09 46.2 45.8 46.6 46.2 46.6
2007/08 44.4 44.1 44.8 44.5 44.8
2006/07 43.3 42.6 43.7 43.0 43.2
Note: ** Re-evaluation year.

www.sBs.oxford.edu/tax 19
Figure 4. Tax on immovable property of non-households as a share of total tax revenues
United KingdomOECD - Average
FranceGermany
0
1%
2%
3%
4%
5%
6%
1994
1995
1996
1997
1998
1999
2000
2001
2002
2003
2004
2005
2006
2007
2008
2009
2010
2011
2012
2013
Source: OECD Revenue Statistics, series 4120.
Figure 5. Various taxes as a share of total tax revenues
Business rates
Corporation income taxPersonal income taxValue added tax
Social security contributions
0
5%
10%
15%
20%
25%
30%
1994
1995
1996
1997
1998
1999
2000
2001
2002
2003
2004
2005
2006
2007
2008
2009
2010
2011
2012
2013
Source: OECD Revenue Statistics, series 1110 (personal income tax), 1210 (corporate income tax), 2000 (social security contributions), 4120 (Business rates), 5111 (VAT).
20 Business taxation under the Coalition
Figure 6. Stamp duty land tax and stamp duty on stocks and shares as a share of total tax revenues
Stamp duty on stocks and sharesSDLT
0
0.5%
1%
1.5%
2%
2.5%
2001
2002
2003
2004
2005
2006
2007
2008
2009
2010
2011
2012
2013
Source: UK Stamp Tax Statistics 2013-14 and OECD Revenue Statistics (Total tax revenue)
Table 4. Costings of the VAT increase Amounts: £ million
Announcement Implementation 2010/11 2011/12 2012/13 2013/14 2014/15 Total
VAT standard rate from 17.5% to 20%
2010 2011 +2,900 +12,250 +12,600 +13,050 +13,550 +54,350
Source: Budget 2010

www.sBs.oxford.edu/tax 21
be distortive as taxing an intermediate input (business premises in this case) violates production efficiency.39 Businesses will have an incentive to invest in less immovable-property intensive activities: all things being equal, the net-of-all-tax return to investment will be higher the lower the business rates paid and hence, the smaller the rateable value of the property (that is, the smaller the property or the less expensive the location is). The long-run effect of business rates will depend on the incidence of the tax: the more the tax can be passed on from the business occupying the property to the owner, the less distorted the production decision will be. There is some evidence that in the long run,40 tenants are able to pass the tax on substantially to the property owners since the offer of business premises is more rigid than the demand but it seems unlikely that it would all be borne by owners. Many businesses own the premises from where they operate. If business rates are incorporated in prices, then the seller is likely to bear much of the tax through a lower selling price.
2.9 International issues
The OECD/G20 Campaign on Base Erosion and Profit Shifting
One of the major developments over the last two years has been the OECD/G20 project on BEPS. This project emerged from the growing awareness that the existing system of international tax rules, which was first developed back in the 1920s, has been showing some evident flaws as business operations are becoming more global and technologically advanced. The change in the status quo, however, required a broad international agreement. The global financial crisis and the public criticism of the tax affairs of several well-known multinational companies, such as Starbucks, Google and Amazon, have created a political momentum for addressing these challenges. In response, the G20 Finance Ministers called on the OECD to consider how to close the existing loopholes in the current international tax rules. In July 2013, the OECD published a detailed plan of 15 actions, which was endorsed by the G20 leaders.41
The UK government played one of the leading roles in promoting the launch of the BEPS project under the coordination of the OECD. Together with Germany and France, the UK contributed €550,000 in order to support the OECD’s work towards the objectives set out in the BEPS Action Plan. The government claims to participate pro-actively in all the BEPS Working Parties.42 Broadly speaking, the UK’s fundamental objectives are closely aligned with those pursued by the OECD/G20. The
39 Diamond and Mirrlees (1971).
40 See S. Bond at al. (1996).
41 OECD Report, Action Plan on Base Erosion and Profit Shifting, July 2013.
42 Mike Williams at the Open Day on Diverted Profits Tax, held by HM Revenue
& Customs on 8 January 2015.
government remains committed to “the fundamental principles that underpin the international tax rules”43 and sees the BEPS project as a way to deliver a modernised set of international tax rules rather than to engage in a fundamental review of the existing approaches. The government believes that adjustments in the existing rules are needed to ensure that taxing rights over profits are closely aligned with the economic activities and that the instances of double non-taxation are addressed.
Three rounds of deliverables are envisaged between September 2014 and December 2015. The objective evaluation of this process would only be possible once all major outputs are in place and are being translated into reforms in the UK and elsewhere in the world. We therefore leave further discussion of the BEPS project to one side with some of the preliminary developments, such as the implications on the UK Patent Box and the introduction of the diverted profits tax, discussed in Section 4.
The UK membership in the European Union
The Coalition government initiated the Balance of Competence Review which explored the impact of the European Union in various policy areas, including taxation. The HM Treasury report (July 2013) showed that the UK was unlikely to lead any major tax initiative at the EU level.44 Quite the opposite, the report reiterated the existing division of competences between the UK and the EU in the field of taxation, suggesting that further integration should respect these boundaries. Overall, the UK-EU relationships have reflected the general trend of a pragmatic balancing exercise between two objectives. On the one hand, the UK intends to remain an open economy with a competitive tax regime that stimulates investment and economic growth. On the other hand, the need to design an effective and internationally coordinated strategy to prevent tax avoidance and aggressive tax planning is also of a high priority.
Pursuing the first objective (competitiveness), the UK government engaged in the political battle with the EU over a financial transaction tax (FTT). The FTT legislative proposal, which was published by the European Commission in September 2011, has sparked intense debate.45 Despite the Commission’s efforts, the differences in opinion amongst Member States could not be bridged. In October 2012, 11 Member States in favour of the FTT requested the Commission to use a “last resort” option envisaged by the EU Treaties: the enhanced
43 HT Treasury & HMRC, Tackling Aggressive Tax Planning in the Global
Economy: UK Priorities for the G20-OECD, 2011, para 1.6.
44 HM Government, Review of the Balance of Competences between the United
Kingdom and the European Union Taxation, July 2013.
45 Commission Proposal for a Council Directive on a common system of
financial transaction tax and amending Directive 2008/7/EC, COM(2011) 594
final of October 28, 2011.

22 Business taxation under the Coalition
cooperation procedure. The Council authorised the use of enhanced cooperation in January 2013. When the revised version of the FTT proposal was published, the Coalition government concluded that it carries potential adverse effects for the UK financial markets.46 In April 2013 it initiated a legal challenge of the Council’s authorisation decision in the Court of Justice of the European Union. It was widely accepted, including by the UK itself, that the challenge was premature. The UK arguments were rejected by the Court.47 However, this legal challenge sent a clear political signal that should the decision be adopted in its initial form, it will be opposed further. In addition to this “external” pressure, the Council itself encountered difficulties with reaching a compromise between the participating Member States.48 The self-imposed deadline of December 2014 was postponed until early 2015.49 The political agreement is still pending.
In the light of the second priority (preventing tax avoidance and aggressive tax planning), the UK government supported the amendments to the EU’s Parent-Subsidiary Directive. In July 2014, the directive was amended to prevent corporate groups from using hybrid loan arrangements to benefit from double-non taxation.50 This was followed by further agreement on introducing a binding anti-abuse clause to prevent tax avoidance and aggressive tax planning by corporate groups in December 2014.51 Further progress at EU level was also reached on the closer cooperation between tax authorities, most notably on the automatic exchange of information.52 These changes reflect a broad international consensus on the need to tackle the problem of corporate tax avoidance. The EU remains a proactive actor in this field and further coordination initiatives at various levels may be expected as the OECD/G20 work in this area continues.
46 Commission Proposal for a Council Directive implementing enhanced
cooperation in the area of financial transaction tax, COM(2013) 71 final of
February 14, 2013.
47 Case C-209/13 United Kingdom v Council, ECLI:EU:C:2014:283.
48 Council of the European Union, ‘3356th meeting of the Council of the
European Union (Economic and Financial Affairs)’ held in Brussels on 9 December
2014.
49 Ibid.
50 Council Directive 2014/86/EU of 8 July 2014 amending Directive
2011/96/EU on the common system of taxation applicable in the case of parent
companies and subsidiaries of different Member States.
51 Council Directive amending Directive 2011/96/EU on the common system
of taxation applicable in the case of parent companies and subsidiaries of different
Member States (17 December 2014, 16633/14).
52 Council Directive 2014/107/EU of 9 December 2014 amending Directive
2011/16/EU as regards mandatory automatic exchange of information in the field
of taxation; Council Directive 2011/16/EU of 15 February 2011 on administrative
cooperation in the field of taxation and repealing Directive 77/799/EEC.

www.sBs.oxford.edu/tax 23

24 Business taxation under the Coalition
3. Empirical evidence on the impact of reforms on UK competitiveness
We now turn to considering empirical evidence on the change in competitiveness of the UK corporation tax under the Coalition government. We do this primarily by comparing the UK to OECD countries and also, more specifically to France and Germany. As we noted above, though, the government’s aim was to ensure the most competitive tax regime in the G20. For this reason, we also rank G20 countries according to a number of measures of the corporation tax, and we observe how the rankings changed between 2010 and 2015. We also provide some tentative evidence of the effects of the reforms on foreign direct investment, capital expenditure by UK business, and on research and development.
3.1 Rankings of some measures of competitiveness
Three measures have often been used to assess the tax costs associated with corporation tax: the main statutory rate and two summary measures that account for both the statutory rate and the tax base: the effective average tax rate (EATR) and the effective marginal tax rate (EMTR).1
By shifting profits from a high-tax to a low-tax jurisdiction, multinational corporations are able to reduce their aggregate tax liabilities, at least to some extent independently of where they locate real activities. The marginal incentive to shift an additional unit of profit depends on the statutory tax rate: the lower the rate differential, the lower the incentive to shift income to a low-tax jurisdiction. Figure 1 shows that the UK rate had been lower than the average OECD statutory rate until 2004, after which cuts to the tax rate in other OECD countries reversed this position for the first time in 20 years. The cuts in the main statutory rate implemented by the Coalition have meant that, from 2012, the UK rate again dropped below the OECD average - about 25.7 per cent in 2015 against 20 per cent for the UK. Although the UK rate has been consistently lower than the French and German rates, smaller, low-tax, OECD jurisdictions such as Ireland have had lower rates. Such small jurisdictions have now become less attractive for shifting profits from the UK, given the UK rate of 20 per cent or 10 per cent rate within the Patent Box.2
The EATR measures the difference in the before- and after-tax net present value of a profitable real investment project. Because it measures the effect on real investment projects, it also takes account of the definition of the tax base, and in particular the generosity of
1 Such measures help in comparing the UK to other countries, but only relative
to the costs associated to the corporate tax system: they tell us whether the UK
corporate tax burden is low enough to attract and foster investment in competition
with other countries, ceteris paribus. They are not suitable to derive conclusions
on the broader welfare implications of tax policy measures or on the broader
economic performance of the UK.
2 For a description of the transitional rates, see Section 2.3.
capital allowances. There is strong empirical evidence that differences in the EATR across countries affect the location of investment projects. The EATR is relevant in a context where a firm needs to decide among a set of mutually exclusive projects.3 This is the typical decision faced by a multinational choosing to locate investment in one of the OECD countries.4 In other words, the EATR affects inbound FDI to the UK. Figure 7 shows that, until 2013, the UK EATR was not particularly competitive compared to the OECD average; the differences from Figure 1 reflect primarily the relatively low capital allowances available in the UK. But since 2011, the UK EATR began declining and by 2015, it is well below the OECD average. The UK EATR has generally been lower than the comparable rate in France and Germany with the gap widening substantially since 2011.
The EMTR is the tax component of the user cost of capital and identifies the percentage rise in the cost of capital for an investment project due to taxation.5 Conditional on locating in the UK, it affects the scale of investment: a higher cost of capital is associated with lower investment. Like the EATR, the EMTR depends on both the statutory tax rate and the definition of the tax base; however, the tax base plays a more dominant role in the determination of the EMTR6 and this largely accounts for the difference in the two measures. Figure 8 shows that, since the 1990s, the UK EMTR has been consistently higher than the OECD average.7 The gap widened further in 2008 with the Labour reform of capital allowances.8 It declined again between 2011 and 2015 because of the statutory rate cuts and despite a further enlargement of the tax base. Overall, in 2015 the UK EMTR remains well above the OECD average but slightly lower than the French one and close to the German one.
3 Devereux and Griffith (1998, 2003).
4 The EATR is relevant for real investment in real assets. It is less relevant for
comparing location of headquarters, which depends more on the tax treatment of
foreign subsidiaries and on CFC rules.
5 It is the percentage difference between the before- and after-tax cost of
capital for a hypothetical investment project breaking even. This approach to the
cost of capital was first proposed by Jorgensen (1963) and Hall and Jorgensen
(1967).
6 This is because the EMTR reflects the taxation of an investment that just
breaks even, while the EATR reflects the taxation of an investment which is more
profitable. Capital allowances become relatively less important as the rate of profit
earned increases, and so are less important in affecting the EATR.
7 This is for large companies with investment above the AIA threshold.
8 During the 2007 Budget, the Chancellor announced an overhaul of the existing
capital allowances system. Accelerated first year investment allowances for plant
and machinery for SMEs were repealed. In 2008, the rate for main allowances for
plant and machinery was decreased from 25 to 20 per cent and the government
announced the phasing-out of allowances for industrial buildings by 2011, with a
reduction in the rate of 1 percentage point per year. This was the largest reform in
capital allowances since the 1980s.

www.sBs.oxford.edu/tax 25
Figure 7. Effective average tax rates (EATRs)
OECD - AverageGermany
FranceUnited Kingdom
15%
20%
25%
30%
35%
40%
45%
50%
1994
1995
1996
1997
1998
1999
2000
2001
2002
2003
2004
2005
2006
2007
2008
2009
2010
2011
2012
2013
2014
2015
Source: CBT tax database. www.sbs.ox.ac.uk/ideas-impact/tax/publications/data
Figure 8. Effective marginal tax rates (EMTRs)
10%
15%
20%
25%
30%
35%
1994
1995
1996
1997
1998
1999
2000
2001
2002
2003
2004
2005
2006
2007
2008
2009
2010
2011
2012
2013
2014
2015
Source: CBT tax database. www.sbs.ox.ac.uk/ideas-impact/tax/publications/data
OECD - AverageGermany
FranceUnited Kingdom

26 Business taxation under the Coalition
The reason for the high UK EMTR is because capital allowances for plant and machinery are low by international standards (see Table 5) and they have been reduced from 25 to 20 per cent in 2008 and then to 18 per cent in 2012. Commercial buildings cannot be depreciated, and since 2012, industrial buildings and structures, agricultural buildings and hotels cannot be depreciated either. As we discuss below, however, the introduction of the AIA means that the EMTR is considerably lower for SMEs with investment below the AIA threshold.9
Overall, the competitive position of the UK with respect to the OECD has improved substantially since 2011, and by 2015, the main corporate statutory tax rate and the EATR were well beneath the OECD average mainly reflecting the cuts in the main statutory corporate tax rate. The UK rates have remained below the French and German equivalents with the gap widening substantially since 2011, suggesting that for the location of profits and of investment, the UK became even more attractive. The UK tax component of the user cost of capital (EMTR) has historically been higher than the OECD average and this has not changed under the Coalition. For large companies, the UK capital allowances regime remains one of the least generous in the OECD. This affects firms’ cost of capital negatively, especially for businesses with substantial investment in physical assets such as plant and machinery and buildings.
We have evaluated the competitiveness of the UK tax system relative to the OECD average, France and Germany as these economies are comparable to the UK economy. Nonetheless, the Coalition’s aim was to be the most competitive in the G20. Table 6 shows that the same broad conclusions can be drawn with respect to the G20 countries. Overall, the competitive position of the UK improved between 2010 and 2015. More specifically, in 2015, the UK tax system has become
9 We do not compare the UK EMTR calculated considering the AIA with other
countries because, for other jurisdictions, we do not have information on capital
allowances of the type of the AIA.
very competitive with respect to the G20 for the main statutory rate and, to a lesser extent for the EATR. It is much less competitive in the EMTR. The statutory corporate tax rate is now the lowest in the G20, together with Russia, Saudi Arabia and Turkey. The EATR is also low but higher than in Russia, Saudi Arabia, Korea and Turkey whilst the EMTR remains the least competitive amongst the three rates, with 9 G20 countries displaying a lower EMTR.
For SMEs, where investment is fully covered by the AIA, the EATR and EMTR are substantially lower. The AIA reduces the EMTR only for companies with investment below the AIA threshold. Figure 9 shows that since the introduction of the AIA under the Labour government, the EMTR for companies with investment below the AIA threshold is on average 6 percentage points lower than that of companies with investment above the AIA limit.
It should be noted that the EATR and EMTR measures do not incorporate other important features of the tax system such as the new CFC regime and the introduction of the Patent Box. These features have also made the UK more competitive, particularly in attracting the headquarters of multinational companies.10
3.2 Effects on investment
In a 2013 statement, in response to a report of the House of Lords Economic Affairs Committee, HM Treasury made it clear that the reason for aiming for a more competitive corporation tax regime was “to make the UK tax system more competitive to ensure it supports investment and growth”.11 Figure 10 shows the record of total gross fixed capital formation, business investment and inbound
10 The effective rates also do not include R&D tax incentives, taxes such as the
personal income tax or business rates which are relevant for determining the cost
of capital.
11 HM Treasury response to House of Lords Economic Affairs Committee, 2013.
Table 5. Present value of capital allowances (2015)
Plant and Machinery Industrial Buildings
France 85.7 54.3
OECD average 82 44.5
Great Britain 75.6 0
Germany 73.4 38.6
Note: The figures shown are an estimate of the present value of capital allowances availiable for an item of capital expenditure, expressed as a percentage of the cost of the asset purchased.

www.sBs.oxford.edu/tax 27
Table 6. UK rates versus other G20 countries, 2010 and 2015
Year: 2010
Position Country Statutory corporate rate
Country EATR Country EMTR Country Present value of capital allowances
1 Russia 20 Russia 16.71 Russia 7.89 Korea 73.77
2 Saudi Arabia 20 Turkey 16.91 Korea 8.1 France 73
3 Turkey 20 Saudi Arabia 18.08 Turkey 8.73 South Africa 70.85
4 Korea 24.2 Korea 19.82 Saudi Arabia 13.36 Russia 70.53
5 China 25 China 22.38 Germany 15.12 India 68.78
6 Indonesia 25 Indonesia 23.01 Italia 15.74 Turkey 67.46
7 UK 28 UK 25.96 China 16.23 Italy 66.5
8 Australia 30 Mexico 26.11 Mexico 17.09 Mexico 65.59
9 Mexico 30 Germany 26.28 France 17.51 China 65.59
10 Germany 30.95 Australia 26.63 Canada 17.84 Germany 65.11
11 Canada 31 Italia 26.68 Indonesia 18.52 Australia 64.97
12 Italia 31.29 Canada 27 Australia 19.09 Canada 64.78
13 India 33.22 France 29.3 South Africa 19.25 Brazil 62.77
14 Brazil 34 India 29.53 UK 21.62 USA 62
15 France 34.43 South Africa 29.81 India 21.67 Indonesia 61.7
16 South Africa 34.55 Brazil 30.68 USA 23.25 Saudi Arabia 60.66
17 Argentina 35 ARG 32.26 Brazil 23.91 UK 57.86
18 USA 40.46 USA 34.85 Japan 26.97 Japan 56.72
19 Japan 40.76 Japan 36.04 Argentina 27 Argentina 54.56
Year 2015
1 UK 20 Russia 16.71 Italia -9.81 Korea 73.77
2 Russia 20 Turkey 16.91 Korea 7.19 France 73
3 Saudi Arabia 20 Korea 18.01 Russia 7.89 South Africa 70.85
4 Turkey 20 Saudi Arabia 18.08 Turkey 8.73 Russia 70.53
5 Korea 22 UK 18.49 Saudi Arabia 13.36 Indonesia 68.78
6 China 25 China 22.38 ZAF 14.83 Turkey 67.46
7 Indonesia 25 Indonesia 23.01 Canada 14.92 Italia 66.5
8 Canada 26.75 Canada 23.27 China 16.23 Mexico 65.59
9 South Africa 28 Italia 23.81 Mexico 17.09 China 65.59
10 Australia 28.5 South Africa 24.13 UK 17.14 Australia 64.97
11 Mexico 30 Australia 25.29 Australia 17.98 Canada 64.78
12 Italia 30.04 Mexico 26.11 Germany 18.17 Brazil 62.77
13 Germany 30.95 Germany 27.04 Indonesia 18.52 USA 62
14 India 33.99 India 30.22 France 19.92 India 61.7
15 Brazil 34 Brazil 30.68 India 22.27 Germany 61.14
16 Argentina 35 Japan 31.5 Japan 22.85 Saudi Arabia 60.66
17 Japan 35.64 Argentina 32.26 USA 23.25 Japan 56.72
18 France 38 France 32.35 Brazil 23.91 Argentina 54.56
19 USA 40.46 USA 34.85 Argentina 27 UK 45.53
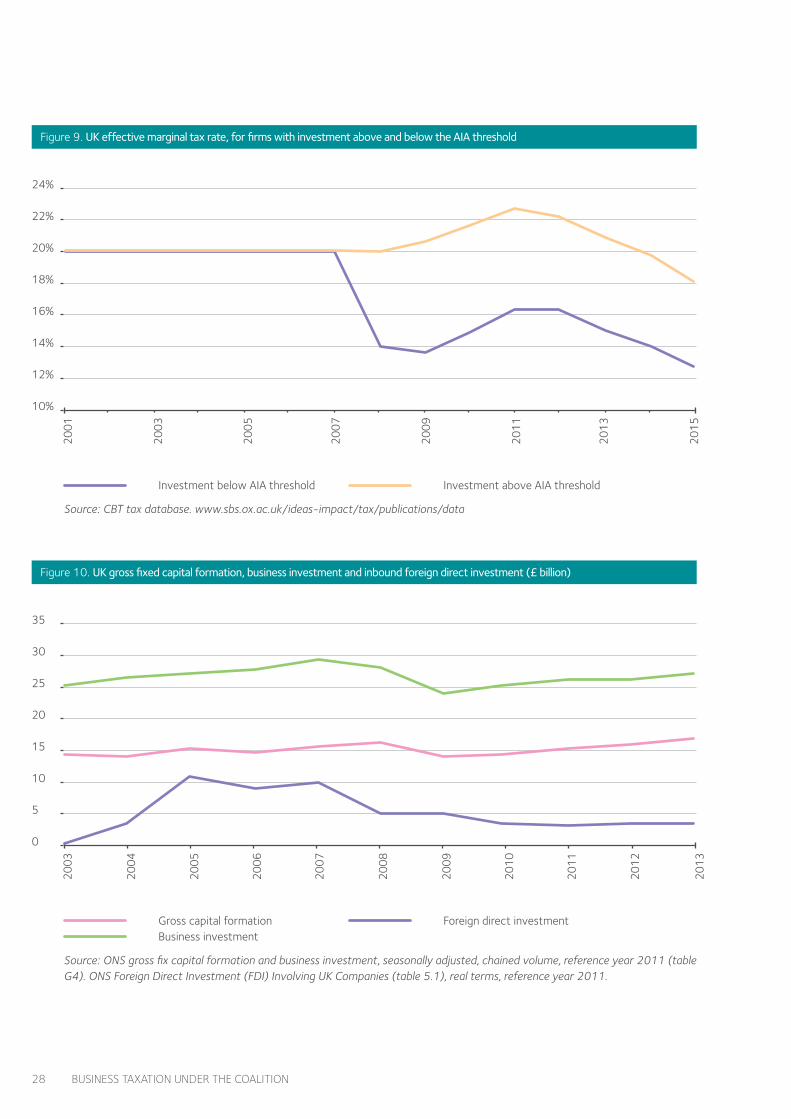
28 Business taxation under the Coalition
Figure 9. UK effective marginal tax rate, for firms with investment above and below the AIA threshold
Investment above AIA thresholdInvestment below AIA threshold
10%
12%
14%
16%
18%
20%
22%
24%
2001
2003
2005
2007
2009
2011
2013
2015
Source: CBT tax database. www.sbs.ox.ac.uk/ideas-impact/tax/publications/data
Figure 10. UK gross fixed capital formation, business investment and inbound foreign direct investment (£ billion)
Foreign direct investmentBusiness investmentGross capital formation
0
5
10
15
20
25
30
35
2003
2004
2005
2006
2007
2008
2009
2010
2011
2012
2013
Source: ONS gross fix capital formation and business investment, seasonally adjusted, chained volume, reference year 2011 (table G4). ONS Foreign Direct Investment (FDI) Involving UK Companies (table 5.1), real terms, reference year 2011.

www.sBs.oxford.edu/tax 29
foreign direct investment in the UK since 2002 in real terms. All three measures declined following the financial crisis, and were well below their peak at the beginning of the Coalition government in 2010. There was therefore little doubt about the benefits of stimulating investment at that time.
Foreign direct investment
One element of investment is inbound foreign direct investment. This is not a direct component of gross fixed capital formation – rather it measures flows of funds into the UK for the purposes of investment, which may include acquisitions. Nevertheless, it is a benchmark for considering the impact on the tax reforms on the attractiveness of the UK as a location for real investment.
There have been numerous studies on the impact of taxation on flows of foreign direct investment. These have used aggregate data, and consolidated and unconsolidated financial statement data, and a number of measures of effective tax rates. It is not straightforward to use these studies to generate a reasonable consensus estimate of the impact of taxation on FDI flows. Here we use an analysis which undertakes a meta-study of the estimates produced in the literature.12 Taking into account a wide range of factors, this study arrives at a consensus estimate of a semi-elasticity of around -1.68. This implies that – holding all other things constant, including the tax rates in other countries - a one percentage point drop in the tax rate (for example from 28 to 27 per cent) would lead to an increase in inbound FDI of 1.68 per cent.
We can use this to generate a very broad estimate of the impact of the UK tax reforms on inward FDI into the UK. Specifically, consider the reduction in the EATR from 25.96% in 2010 to 18.49% in 2015. Using this estimate of the semi-elasticity, this would imply that after the reform had been fully introduced, inbound FDI into the UK would be around 12.5 per cent higher than it otherwise would have been.
To consider this effect in terms of actual flows, we would need to apply this 12.5 per cent to the counterfactual of what inbound FDI would have been in the absence of the tax reform. This raises considerable uncertainty, however, since FDI has been highly volatile, and so it is not clear what should be the counterfactual. One approach is to take a figure for inbound FDI for a year before the tax reform could have had an effect, say 2009, with inbound FDI of around £49 billion. So if the tax rate in 2009 had been 20 per cent, we might have expected inbound FDI to be higher by about £6.1 billion. However, 2009 was already a year hit by recession. If we based the counterfactual instead on 2007, with inbound FDI of £93 billion, we would estimate inbound FDI £11.7 billion higher. It has to be acknowledged then that there is considerable uncertainty about the likely effects of the tax rate reduction on inbound FDI in money terms. Consequently, it is very difficult to make a valid comparison with the revenue cost of the reform.
12 Feld and Heckemeyer (2009).
Business Investment
In principle, the tax system may affect the magnitude of business investment in fixed capital through two channels. First, lower tax reduces the cost of capital by reducing the tax burden on the marginal unit of investment. Essentially, since the return on a unit of investment is taxed at a lower rate, then there is a greater incentive to undertake investment. Second, a lower tax implies a reduced liability and hence higher net cash flow. Companies that are unable to raise external finance, or are able to do so only at a prohibitively high cost may use the tax saving as a resource to undertake additional investment.
As with FDI, there have been numerous studies of the effects of changes in the cost of capital on levels of investment. We draw on one recent empirical study13 which finds a long-run elasticity of the fixed stock of equipment with respect to the cost of capital of around 0.75. That is, a 1 per cent fall in the cost of capital would induce a 0.75 per cent rise in the long-run stock of equipment.
Between 2010 and 2015, the cost of capital for investment in equipment fell by around 3 per cent due to the reforms to the tax rate and capital allowances (excluding the AIA).14 This would suggest that there would be a long run impact on the stock of equipment of around 2.25 per cent. In the short run, the impact on investment should be much higher, in order to move towards the new level of the capital stock. To get some idea of the magnitude of these effects, according to the Office of National Statistics (ONS), the net UK capital stock in machinery and equipment in 2009 was just over £500 billion.15 A 2.25 per cent increase in this would represent just over £11 billion. In terms of investment, total business investment was around £138 billion in 2009. A rise of £11 billion in investment to generate the expected rise in the capital stock would therefore represent a rise in investment of around 8 per cent, though we would expect this to be spread over some years.
13 Bond and Xing (2015).
14 This estimate is based on the same approach as used for the effective
marginal tax rate calculations above.
15 ONS Capital Stocks and Capital Consumption data, Table 2.1.1 (current
prices, other machinery and equipment).

30 Business taxation under the Coalition
The AIA permits capital expenditure up to a threshold to be set against tax immediately, rather than deferred using capital allowances. As noted above, the threshold has changed several times under both the Coalition government and the previous Labour government. At the margin, the AIA only has an effect on the incentive to invest for companies that invest below the threshold. These are obviously likely to be smaller companies. Table 7 shows the average investment of firms of different size. On average the AIA threshold only consistently covers investment of firms with less than 100 employees. Larger firms invest on average well above the AIA threshold and the AIA will not affect their cost of capital.
The AIA also increases firm cash flow because of a reduced tax liability. This could be particularly important for cash-constrained firms which can use the extra cash for additional investment. All firms receive a cash benefit from claiming the AIA, but this benefit is larger (as percentage of their investment) and more valuable to SMEs as they are generally more financially constrained than larger companies. Overall, both of these channels suggest that the AIA is likely to stimulate investment more for SMEs than for larger companies.
SMEs are a large fraction of the UK economy but, at the same time, the majority of investment is carried out by large companies. At the beginning of 2012, 99.5 per cent of corporations were SMEs (less than 250 employees).16 But, on average, businesses with less than 300 employees accounted for only about 38 per cent of total net capital expenditure between 2011 and 2014 (see Table 8).17 In most years, firms with investment below the AIA threshold and hence, likely to be positively affected by the AIA, are firms with less than 100 employees; these account only for around 20 per cent of total gross capital expenditure.
Overall, because the AIA targets only small firms contributing relatively less to aggregate capital expenditure, it is uncertain whether the AIA can increase aggregate investment substantially.18
16 See BIS (2012).
17 Our calculations using ONS Quarterly capital expenditure and survey
populations by employment size bands, 2014 (ref. 003247).
18 The Centre for Business Taxation is currently undertaking research on this
issue using tax return data from the HRMC Datalab. However, results are not yet
available.
Research and Development
The combination of the Patent Box with the Research and Development (R&D) tax incentives has created a very favourable environment for the development and location of patents in the UK. Relative to the schemes in France, Canada and the US, the volume-based UK R&D tax incentive schemes had a relatively simple design.19 For example, the US has a temporary scheme that is renewed after each expiry (every few years), and businesses have argued that this is a cause of uncertainty for their planning purposes, although the probability of renewal is known to be very high to them. In addition, the US scheme is ‘incremental’, where the base of the tax credits is the increase in R&D performed by the firm in a given period rather than the total amount spent in that period, as in the UK. France has one of the most generous R&D tax incentive schemes in the world, although until 2008, France also used to have an incremental scheme which was found to be complex and the scheme gradually transitioned into a volume-based credit.
Figure 11 compares tax incentives for R&D across a number of countries in 2013, based on a measure called the B-index,20 which captures the generosity of tax incentives. The Figure plots the value of 1 B-index: so the higher the value is, the more generous are the incentives. The figure shows values separately for large firms and SMEs, and also separately for whether or not the firm has a tax loss. In 2013, the UK R&D Tax Relief was relatively generous towards SMEs and about as generous as the US scheme towards large companies. The metric does not take into account any incentives related to the patent box, which is likely to affect larger companies more than SMEs.
Figure 3 presents the changes in the tax component of the user cost of R&D21 in the past decade, separately for SMEs and large companies paying the small profits rate and the main rate of corporate income tax. The user cost of R&D takes into account the changes in the corporation tax rates and R&D Tax Relief rates for companies with different taxable profits. The Figure shows that, since 2012, some of the benefits from higher
19 In the early 2000s, despite the simplicity of the scheme, take up, especially
among SMEs remained low until around the end of the decade. Later, the 2011
consultation, which was initiated by the Coalition government, revealed that
a considerable portion of the benefit from tax incentives flowed to external
consultants which assisted companies to file a claim for the relevant scheme, as
companies struggled to understand how the scheme operated. The low SME take
up was also partly attributable to the restrictions on their use of the R&D Tax
Relief: (i) until 2011, the cash credit claimed by the lossmaking companies could
not exceed the total of the company’s NIC and PAYE liabilities for the claim period
, (ii) until 2009, any intellectual property arising from the R&D carried out with
the funds supported by the R&D Tax Relief needed to be vested in the company
, and (iii) until 2012, a minimum spending on R&D of £10,000 was required for
companies to benefit from the scheme.
20 See McFetridge and Warda (1983) for details on the B-index.
21 For a description of the user cost of R&D, see Section 2.4.

www.sBs.oxford.edu/tax 31
Table 7. Average investment per size class Amounts £ thousand
Number of employees AIA threshold
20-49 50-99 100-299 300+
2012 Q1 51 119 345 3,064 100
2012 Q2 49 107 386 2,819 100
2012 Q3 48 115 376 3,099 25
2012 Q4 50 124 451 3,467 25
2013 Q1 36 102 337 3,085 250
2013 Q2 40 145 362 2,930 250
2013 Q3 45 151 355 3,283 250
2013 Q4 43 153 426 3,528 250
2014 Q1 47 117 365 3,388 250
2014 Q2 42 106 442 3,090 500
Average 45,210 123,920 384,540 3,175,260
Source: ONS CAPEX estimates, current prices. Averages derived using the population of firms (2014).
Table 8. Business investment by size class Amounts £ thousand
Number of employees Total Share of investment of firms with less than 100 employees
Share of investment of firms with less than 300 employees20-49 50-99 100-299 300+
2012 13,203,683 10,057,295 20,923,299 70,461,464 114,645,741 20% 39%
2013 11,804,027 12,282,937 20,405,580 74,327,484 118,820,028 20% 37%
2014 (Q1 and Q2)
6,681,211 5,126,045 11,358,684 38,476,125 61,642,065 19% 38%
Average 20% 38%
Source: ONS CAPEX estimates, current prices, population of firms (2014).

32 Business taxation under the Coalition
R&D Tax Relief rates have been offset by the reductions in the statutory corporation tax rate, because the value of deductions are reduced under low tax rates.
Findings suggest that the overall effect of R&D tax incentives over the amount of R&D carried out by firms may be positive,
but that they differ widely between different types of firms.22 For example, larger companies appear to find it easier to use the tax incentives, and more R&D intensive firms appear to benefit more from such schemes. Based on the published work in this literature, it seems that a simpler and more generous tax
22 See Hall and Van Reenen (2000), Lokshin and Mohnen (2012) for a study
on the Netherlands, Mairesse and Mulkay (2011) for France and Agrawal et al.
(2014) for Canada.
Figure 11. Tax incentives for R&D across the OECD measured by the B-index (2013)
Fran
ce
Large, profitable firm SME, profitable firm Large, loss-making firm SME, loss-making firm
Cana
da
Irelan
d
Finlan
d UK
Braz
il
Norw
ay
Japa
n
China US
A
Swed
en
Germ
any
Source: OECD Science, Technology and Innovation (STI) Scoreboard, 2013 (based on OECD R&D tax incentives questionnaire and publicly available sources, June 2013). The values assume that carry forward provisions and cash benefits allow lossmaking companies to benefit from tax incentives to the same extent as profitmaking companies.
-0.1
0.1
0.2
0.3
0.4
0.5
0.6

www.sBs.oxford.edu/tax 33
incentive scheme for R&D helps in generating business R&D which would otherwise have not taken place. In assessing the net benefits of R&D incentives, it is important to bear in mind that these schemes are costly, as shown in Figure 12. Again though, it is difficult to assess the additional R&D generated
relative to the cost for all beneficiaries of the R&D tax relief. There are potentially large differences between smaller and larger spenders in R&D, as well as cross-sectorial differences which are also primarily based on varying degrees of R&D intensities of the companies in these sectors.
Figure 12. Cost of research and development support (rounded to nearest £10 million, real 2011 GBP)
2002
2003
2004
2005
2006
2007
2008
2009
2010
2011
2012
0
200
200
400
800
1,000
1,200
1,400
Source: HMRC Table RD3, ‘Cost of support claimed for the R&D tax credit by scheme and financial year on a receipts basis, 2000-01 to 2012-13’, part of Research and Development Tax Credits Statistics. Values deflated using the OECD Economic Outlook GDP deflator series.

34 Business taxation under the Coalition
4. Avoidance
The Coalition government placed the need to tackle tax avoidance at the heart of its tax reform programme right from the start. The commitment given in its 5-year programme1 to tackle avoidance was elaborated first in the June 2010 document “Tax policy making: a new approach”2 and more fully in the March 2011 document “Tackling tax avoidance”.3 In the foreword to the latter document, the Exchequer Secretary to the Treasury, David Gauke MP, explained that the Coalition is
“committed to tackling it differently from our predecessors. That means a more strategic approach that gets to the root of the problem, rather than treating the symptoms. This Budget unveils an ambitious package of measures to help us do that.”
One could discuss whether the Coalition’s approach was more strategic than that of its predecessors, but it certainly introduced a number of robust, even controversial, measures to tackle avoidance. In this report, we discuss some of the measures which were meant to have a broader effect. Before that we briefly list the main tax avoidance measures that were introduced and costed in the Budgets and Autumn Statements since 2010.
4.1 Summary of anti-avoidance measures
Table 9 presents a brief summary of anti-avoidance measures introduced by the Coalition government where a revenue estimate was provided in a Budget statement or Autumn Statement. We have not distinguished between measures that could be classified as addressing business taxes, as opposed to non-business taxes; in at least some cases the measures could reasonable be interpreted as addressing both.
Two points stand out. First, setting out specific anti-avoidance measures has been a regular undertaking. Most set piece occasions include the introduction of measures to close loopholes. Second, the amounts of revenue that the government has claimed would be raised from these measures are substantial. If we take all the revenue projects at face value, then revenue will be more than £7.5 billion higher in 2015/6 than it would have been without these measures. This seems high in relation to HMRC’s estimates of the tax gap, which has actually increased since 2009/10, just before the Coalition came to power from £31 billion in 2009/10 to £34 billion in 2012/13.4
1 HM Government “The Coalition: our programme for Government”, p. 10, May
2010. See also p. 30.
2 HM Treasury and HM Revenue & Customs, “Tax policy making: a new
approach”, June 2010.
3 HM Treasury and HM Revenue & Customs, “Tackling tax avoidance”, March 2011.
4 See Measuring tax gaps 2014 edition: Tax gap estimates for 2012-13, HMRC
(2014), Of course, this does not just include revenues lost from avoidance.
It could be possible to interpret the revenue estimates as defending revenues that would otherwise be lost to tax avoidance; but under that interpretation it is not also possible to claim that the additional revenue is new income to the government, available to support public spending or to reduce the deficit.
The estimate of £7.5 billion for 2015/6 also seems high relative to the cost of the reforms to corporation tax designed to make the UK tax system more competitive. Indeed, this sum is almost identical to estimated cost of the reforms in 2015/6, shown in Table 2. Of course, not all of the anti-avoidance measures relate specifically to business. But the fact that such large sums are estimated to be raised from anti-avoidance measures opens the question of whether these measures are acting as a significant counter-balance to the move towards competitiveness.
4.2 General Anti-Abuse Rule
Arguably the most significant domestic development in the fight against avoidance over the past five years was the introduction of a General Anti-Avoidance Rule (GAAR). Previous governments had considered introducing a GAAR but rejected it.5 In contrast, the Coalition government set about pursuing this possibility soon after being elected. The June 2010 Budget announced that the government would examine whether there is a case for developing a GAAR.6 A Study Group,7 chaired by Graham Aaronson QC, was set up in December 2010 to report on this matter. Mr Aaronson QC reported in November 2011,8 recommending a narrowly focused General Anti-Abuse Rule, and providing an illustrative draft rule. In the 2012 Budget, the Chancellor of the Exchequer confirmed that the government would follow this recommendation. Following a brief but important consultation,9 the General Anti-Abuse Rule was introduced in the Finance Act 2013, and came into force in July 2013.
The choice of the term “Abuse” rather than “Avoidance” was meant to signify that this particular GAAR is moderate and narrower than some of the GAARs found in other jurisdictions.10 This might partly explain the widespread, albeit not unanimous, support received from business and the professions. The Aaronson Report argued against a broad GAAR but insisted that a narrower version which targeted egregious tax avoidance would bring a number of benefits:
5 Inland Revenue, A General Anti-Avoidance Rule for Direct Taxes, 1998.
6 The Liberal Democrats had made their support for a GAAR known before the
election. Andrew Goodall, “Avoidance: GAAR debate begins amid public scrutiny”,
Tax Journal, 8 December 2010.
7 Professor Judith Freedman CBE, Director of Legal Research at the Oxford
University Centre for Business Taxation, was a member of the study group.
8 HM Treasury, “GAAR Study: a report by Graham Aaronson QC”, 11 November 2011.
9 HM Revenue & Customs, A General Anti-Abuse Rule – consultation document, June 2012.
10 The acronym GAAR will be used for both General Anti Avoidance Rules and
General Anti-Abuse Rules, despite the fact that the former should be broader than
the latter.

www.sBs.oxford.edu/tax 35
it would deter (and, where deterrence fails, counteract) contrived and artificial schemes; it should contribute to providing a more level playing field for business and professionals; it would help reduce the risk of stretched interpretation by courts and the uncertainty which this entails; it could lead to simpler and clearer tax legislation; it would not require a comprehensive system of clearances; it should help and inform the public debate about tax avoidance and abusive practices; and it should help build trust between taxpayers and HMRC.11
Beyond its intended narrow focus the UK GAAR has a number of interesting, and at times innovative features. The narrow and targeted focus of the GAAR is primarily achieved through a “double reasonableness test”. A GAAR advisory panel has been set up with two main functions. It is to consider, review, and (if appropriate) approve HMRC’s guidance on the GAAR. Furthermore, all GAAR cases must be first put to the Panel and it is to deliver opinions on these individual cases. A court or tribunal must take into account both the guidance and the opinions when determining any issue in connection with the GAAR.12 In cases where HMRC seeks to apply the GAAR, the onus of proof is on HMRC to show that the tax arrangements are abusive.
The benefits listed above are to be welcomed. However, it is not yet possible to ascertain whether the GAAR will deliver them. The GAAR has not been tested in the courts yet, partly because it only had prospective effect. In terms of design, one could argue about whether it is as narrowly targeted as it claims to be, and whether such narrowness is desirable at all. Some certainly would have preferred a broader GAAR, yet that might have created more uncertainty. It is clear, however, that the status quo was unsatisfactory. Recent cases in which courts found themselves unable to strike down egregious tax avoidance schemes as well as those in which courts were willing to stretch legislation to an unexpected degree to strike down such schemes both raised severe concerns and showed that legislative intervention was desirable. In that respect, the case for the adoption of a GAAR certainly was strong. Judgment has to be reserved, for the time being, as to whether the narrow GAAR adopted will operate as intended and bring the benefits promised.
4.3 Code of Conduct for Banks
In 2009 the then Chancellor of the Exchequer, Alistair Darling MP, announced the introduction of a Code of Practice on Taxation for Banks (the Code).13 The Code was said to be voluntary, and as at October 17, 2010, only four out of the top fifteen banks had adopted it. Despite remaining ‘voluntary’ in nature, the current Chancellor of the Exchequer, George
11 Aaronson Report, pp. 4-7.
12 HM Revenue & Customs, “General Anti-Abuse Rule (GAAR) Advisory Panel:
terms of reference”, May 2013.
13 HM Revenue & Customs, “A Code of Practice on Taxation for Banks”
December 2009. A consultation is currently on going on strengthening the code:
HMRC, “Strengthening the Code of Practice on Taxation for Banks”, 31 May 2013.
Osborne MP, gave the major UK banks a deadline within which to sign up to it.14 By the end of November the top fifteen banks operating in the UK had adopted the Code.
The Code has been controversial from the start, particularly with respect to tax planning.15 The Code explains that “[t]he Government expects that banking groups, their subsidiaries, and their branches operating in the UK, will comply with the spirit, as well as the letter, of tax law, discerning and following the intentions of Parliament.” The Code thus enjoins banks to refrain from undertaking certain forms of tax planning activities; however this appears to extend to transactions which technically comply with the law.16 It could be argued that it requires banks to comply with HMRC’s interpretation of the law. The extent to which this is problematic partly depends on the sanctions which follow from a breach of the Code.
Initially, breach of the Code meant a bank could not be “low risk” for administrative purposes, which entails, amongst other things, greater scrutiny of its tax affairs,17 and that it had to acknowledge that it breached the Code in any public pronouncements it made on its operation of the Code.18 As explained below, the Coalition government took the controversial step of using a bank’s adoption of the Code as justification for introducing retrospective legislation to counter a tax avoidance scheme. In Finance Act 2014 the Coalition government introduced further changes and sanctions. As a result of these changes, banks which do not sign up to the Code are “named and shamed” by HMRC. Furthermore, and more worryingly still, subject to some procedural safeguards, banks which are deemed to be in breach of the Code are also “named and shamed” by HMRC.
14 <http://www.hm-treasury.gov.uk/press_66_10.htm>
15 For criticism of the first draft of the Code see Financial Markets Law
Committee, “Response to the June 2009 HM Revenue & Customs Consultation
Document on a Code of Practice for Banks”, Issue 146, October 2009. The Code
was then amended but some of the criticism still stands.
16 See “Parliamentary Commission for Banking Standards: Written evidence
submitted by Professor Michael P. Devereux and Dr. John Vella”, June 2013.
www.publications.parliament.uk/pa/jt201314/jtselect/jtpcbs/27/27ix_we_h14.htm
17 HM Revenue & Customs, A Code of Practice on Taxation for banks -
Supplementary Guidance Note, 9 December 2009, p.9.
18 HM Government, HMRC Governance Protocol on compliance with the Code
of Practice on Taxation for Banks, 26 March 2012, p.4.

36 Business taxation under the Coalition Tab
le 9.
Cos
tings
of a
nti-a
void
ance
mea
sure
s
Amou
nts £
milli
on
Docu
men
t20
11/1
220
12/1
320
13/1
420
14/1
520
15/1
620
16/1
720
17/1
820
18/1
920
19/2
0
Disg
uise
d re
mun
erat
ion
Budg
et 2
011
750
760
730
770
760
Curre
ncy f
or ta
x calc
ulatio
nsBu
dget
201
160
6060
6060
Sale
of le
ssor
com
panie
sBu
dget
201
125
2020
1515
Leas
ing
doub
le a
llow
ance
sBu
dget
201
180
130
130
120
120
Stam
p D
uty
Land
Tax
Budg
et 2
011
3030
4040
50
Stam
p D
uty
Land
Tax:
avo
idan
ce o
n re
siden
tial
Budg
et 2
012
*65
6565
75
Capi
tal a
llow
ance
s: av
oida
nce
Budg
et 2
012
2545
4545
45
Sett
lor-
inte
rest
ed tr
usts
: avo
idan
ceBu
dget
201
20
1510
1010
Deb
t buy
back
s: av
oida
nce
Budg
et 2
012
395
210
550
0
Tax
repa
triat
ion
from
Sw
itzer
land
Autu
mn
Stat
emen
t 201
233
031
2061
092
018
015
0
HMRC
: ant
i avo
idan
ceAu
tum
n St
atem
ent 2
012
1520
095
330
385
355
HMRC
inve
stm
ent
Autu
mn
Stat
emen
t 201
2-1
0-8
0-2
50
00
Tax
repa
triat
ion
from
Jers
ey, G
uern
sey,
and
Isle
of M
anBu
dget
201
380
240
325
235
170
Off
shor
e em
ploy
men
t int
erm
ediar
ies
Budg
et 2
013
080
8585
90
Corp
orat
ion
Tax:
loss
esBu
dget
201
326
030
527
020
519
0
Gene
ral A
nti-
Abus
e Ru
le: n
on re
venu
e pr
otec
tion
Budg
et 2
013
060
5040
85
Stam
p D
uty
Land
Tax:
subs
ales
Budg
et 2
013
4535
3025
25
Avoi
danc
e sc
hem
es: e
nhan
ced
info
rmat
ion
pow
ers
Budg
et 2
013
05
3535
35
Pena
lties
in a
void
ance
cas
esBu
dget
201
30
5560
510
Acce
lera
ted
paym
ents
in fo
llow
er c
ases
Autu
mn
Stat
emen
t 201
30
135
660
-35
-40
-45
Avoi
danc
e sc
hem
es: u
sing
deriv
ativ
esAu
tum
n St
atem
ent 2
013
4040
2010
00
Dua
l Con
trac
tsAu
tum
n St
atem
ent 2
013
00
8560
6065
Dou
ble
taxa
tion
relie
f: clo
sing
loop
hole
sAu
tum
n St
atem
ent 2
013
1020
50
00
Com
pens
atin
g Ad
just
men
tsAu
tum
n St
atem
ent 2
013
060
125
120
115
110

www.sBs.oxford.edu/tax 37Ons
hore
em
ploy
men
t int
erm
ediar
ies
Autu
mn
Stat
emen
t 201
30
520
425
380
415
445
Part
ners
hips
: con
firm
ing
exte
nsio
n to
Alte
rnat
ive
Inve
stm
ent F
unds
Autu
mn
Stat
emen
t 201
30
068
043
041
040
0
Acce
lerat
ed pa
ymen
ts: e
xten
sion t
o disc
losed
tax a
voida
nce s
chem
es an
d the
GAA
RBu
dget
201
429
012
3013
0071
538
5
Avoi
danc
e sc
hem
es u
sing
the
tran
sfer
of c
orpo
rate
pro
fits
Budg
et 2
014
6080
8085
75
Dire
ct re
cove
ry o
f deb
tsBu
dget
201
40
6511
010
090
Enve
lope
d dw
ellin
gs: n
ew b
ands
bet
wee
n £5
00,0
00 a
nd £
2 m
illion
Budg
et 2
014
3570
9080
90
Vent
ure
capi
tal s
chem
es: r
estr
ictio
ns o
n us
eBu
dget
201
40
3565
5545
Div
erte
d pr
ofits
tax
Autu
mn
Stat
emen
t 201
4 0
2527
036
034
535
5
Corp
orat
ion
tax:
hyb
rids
Autu
mn
Stat
emen
t 201
4 0
015
7085
90
Corp
orat
ion
tax:
cou
ntry
-by-
coun
try
repo
rtin
gAu
tum
n St
atem
ent 2
014
05
510
1015
Corp
orat
ion
tax:
acc
ount
ing
trea
tmen
t of c
redi
t los
ses
Autu
mn
Stat
emen
t 201
40
05
1024
040
Corp
orat
ion
tax:
ban
k lo
sses
rest
rictio
nAu
tum
n St
atem
ent 2
014
069
576
570
569
562
5
Non-
dom
icile
s: in
crea
se re
mitt
ance
bas
is ch
arge
Autu
mn
Stat
emen
t 201
40
012
090
9090
Self-
inco
rpor
atio
n: in
tang
ible
ass
ets
Autu
mn
Stat
emen
t 201
45
3080
110
135
155
Stam
p du
ty o
n sh
ares
: sch
emes
of a
rrang
emen
tAu
tum
n St
atem
ent 2
014
*65
6555
5050
Spec
ial p
urpo
se sh
are
sche
mes
Autu
mn
Stat
emen
t 201
40
045
4040
40
Vent
ure
capi
tal s
chem
es: r
estr
ictio
ns o
n us
eAu
tum
n St
atem
ent 2
014
0-1
530
1010
10
Inco
me
tax:
salar
y sa
crifi
ce a
nd e
xpen
ses,
inclu
ding
um
brel
la co
mpa
nies
Autu
mn
Stat
emen
t 201
40
012
090
7575
Tota
l94
51,
755
4,99
03,
805
7,51
55,
455
4,65
53,
435
1,54
5
Sour
ce: B
udge
ts a
nd A
utum
n St
atem
ents
bet
wee
n 2
01
0 a
nd 2
01
4. *
Neg
ligib
le a
mou
nt.

38 Business taxation under the Coalition
The introduction of sanctions against banks which breach the Code is controversial and raises serious rule of law concerns. For this reason, the changes introduced by the Coalition appear ill judged. The view expressed by the Financial Markets Law Committee (FMLC),19 chaired by Lord Hoffmann, on the first draft of the Code is easily shared:
“It does not appear to this Committee that there are any other circumstances in which it would be considered legitimate for an agency of the executive to require citizens to comply, not just with the law as it exists, but with the law as the executive would like it to be and to police this requirement with potentially stringent sanctions. While it is recognised that tax planning and tax avoidance are currently emotive political issues, it does not appear to the FMLC that these are sufficient grounds to justify such a significant departure from well- established “rule of law” values such as: a) the law must be clear and ascertainable so that citizens can govern their conduct according to its precepts; and b) citizens are entitled to expect that administrative decisions will be applied to them on the same basis.”20
In February 2012, HM Treasury intervened in a high-profile avoidance case involving Barclays.21 The Treasury took the uncommon and controversial step of introducing retrospective legislation22 to ensure that the transactions in question would not work. Equally controversially, this step was partly justified on the ground that Barclays had signed up to the Code.23
4.4 Finance Act 2014 provisions
The government reconfirmed its aims to “change the economics of entering into tax avoidance schemes, and to change the behaviours of taxpayers and promoters in relation to tax avoidance” in consultation documents issued in 201324 and 2014.25 Following this consultation, a number of robust measures were introduced in
19 The Financial Markets Law Committee is a “not-for-profit organisation with
the aim to identify issues of legal uncertainty, or misunderstanding, present and
future, in the framework of the wholesale financial markets which might give rise
to material risks, and to consider how such issues should be addressed.”
20 Financial Markets Law Committee, Response to the June 2009 HM Revenue
& Customs Consultation Document on a Code of Practice for Banks, Issue 146,
October 2009, para. 5.10.
21 In one scheme Barclays maintained that the profits arising from the buyback
of its own IOUs (an informal document acknowledging a debt owed) were not
taxable under the UK corporate income tax. In the second tax avoidance scheme
designed by Barclays, investment funds claimed tax credits on non-taxable income.
22 On the issues which arise in the use of retrospective tax legislation see, for example,
Loomer (2006). See also, Treasury Select Committee, “Thirtieth Report – Budget 2012”,
18 April 2012, paras. 85-89.
23 See www.guardian.co.uk/business/2012/feb/28/treasury-closes-barclays-
tax-schemes; www.hm-treasury.gov.uk/d/wms_xst_270212.pdf and
www.bbc.co.uk/news/business-17181213
24 HM Revenue & Customs, Raising the Stakes on Avoidance, July 2013.
25 HM Revenue & Customs, Tackling marketed tax avoidance, January 2014.
Finance Act 2014 causing some controversy.
We here focus on two measures.
Follower Notices HMRC guidance explains that follower notice rules are “designed to improve the rate at which tax avoidance cases are resolved where the point at issue has, in HMRC’s view, already been decided in another taxpayer’s case.”26 The rules operate when HMRC are successful in litigation against a tax avoidance scheme, and other taxpayers have the same or similar schemes in place. In such cases HMRC can issue a follower notice which gives the taxpayer a choice: settle their issue with HMRC in line with the other judicial ruling, or continue their dispute with the risk of a 50 per cent penalty.
Accelerated payments Accelerated Payment rules were also introduced in the Finance Act 2014. Under these rules, if a taxpayer has been issued with a follower notice or a counteraction notice under the GAAR, or if an arrangement is within the Disclosure of Tax Avoidance Schemes (DOTAS) rules, taxpayer may be required to pay the disputed tax to HMRC if they decide to continue with the dispute. This is meant to remove the cash flow advantage that previously existed in direct tax cases when the taxpayer was required to pay its liability only after the dispute is settled.
These rules have been somewhat controversial. As accelerated payments can be applied to DOTAS and GAAR cases taxpayers could be required to pay tax even if their tax arrangements might fall on the right side of the law.
4.5 Diverted Profits Tax
In the 2014 Autumn Statement the government announced the introduction of a new Diverted Profits Tax (DPT) to be applied from 1 April 2015.27 The details of the tax were revealed on 10 December 2014 when draft legislation and guidance were published.
The main objective of the tax is to “counteract arrangements used by large companies (typically multinational enterprises) that would otherwise erode the UK tax base.” It is meant as a targeted measure which only seeks to close some loopholes in the existing system. “Diverted profits” will now be taxed at a rate of 25 per cent. Profits are deemed to be “diverted” in two broad circumstances. The first is where foreign companies have significant operations in the UK, but under the existing rules avoid having a taxable presence in the UK. The second is where UK companies are using transactions or entities that lack economic substance in order to create tax advantages, in
26 HM Revenue & Customs, ‘Guidance: FA 2014 Part 4 Follower notices and
accelerated payments’, July 2014.
27 HM Treasury, Autumn Statement 2014.

www.sBs.oxford.edu/tax 39
particular pay royalties to jurisdictions where they are subject to little or no tax on the receipt despite receiving relief from UK corporation tax.
The DPT has proved to be one of the most controversial tax measures adopted in this field by the government and has been criticised on various grounds. For a start, the legislation is especially complex and hard to follow. The consistency of the measure with EU Law as well as Double Tax Treaties has been questioned. Although the government has countered this vigorously, there remain, at the very least, some serious questions in this respect. A group comprising some of the most respected international tax lawyers have argued that “[t]he DPT legislation is inconsistent with at least the spirit of existing income tax treaties, whether or not under certain treaties it technically is a treaty breach.”28
The mechanisms for the collection of the DPT are controversial as is the decision by the UK to break ranks midway through the OECD Base Erosion and Profit Shifting (BEPS) process, to take action against such activities unilaterally. The government allowed very little time and showed a limited appetite for meaningful consultation over the DPT, and thus appeared to depart from the principles it set itself for tax policy making. Whilst that has been justified by government officials in public fora as being consistent with its stated ambition of acting quickly when dealing with avoidance, it is noteworthy that when introducing similarly delicate anti-avoidance measures in the past, such as the GAAR, ample time was allowed for consultation. Finally, it has been argued that because of the potential breadth of the DPT it could have a decidedly negative impact on the competitiveness of the UK tax system.
28 Response by the International Tax Group on the Proposed Discussion Draft
on BEPS Action 7, at footnote 28. This is available in OECD, Comments Received on
Public Discussion Draft, BEPS Action 7:Prevent the avoidance of artificial PE status,
12 January 2015.

40 Business taxation under the Coalition
5. Conclusion
The existing state of UK business tax is the result of the actions of both the current Coalition government and of the previous Labour government. Policy changes introduced under the Coalition have been successful in improving the competitive position of the UK partly because they were implemented into a system that already became more competitive under Labour. In particular, in 2009, Labour introduced the exemption for foreign source dividends. It also worked towards reforming the old CFC regime; first proposed the introduction of a Patent Box; and reduced the general scale of capital allowances, though introduced special allowance for SMEs. The Coalition government has implemented the new CFC rules and the Patent Box, and continued developing capital allowances in the same direction. Significantly, the Coalition government has also considerably cut the main rate of corporation tax. Both governments introduced a variety of anti-avoidance measures, though the Coalition government in particular has introduced innovative measures.
Overall, six main reasons make today’s UK tax system attractive, especially for the location of headquarter companies and more generally for the location of activities of multinational companies. First, the exemption system of taxation of foreign profits allows parent companies located in the UK to receive dividends exempt from UK corporate income tax. Because of the substantial shareholding exemption introduced in 2002, foreign capital gains are also exempt. Second, the rate of corporate income tax is low with respect to other OECD countries, reaching 20 per cent in 2015. Third, the presence of a patent box regime with a rate of 10 per cent lowers the tax burden on very mobile factors such as intangibles and now, together with a relatively simple R&D tax incentives regime, makes it more attractive to develop and own UK-developed patents in the UK, rather than locate them in a low-tax entity. Fourth, the new CFC regime allows important exemptions which essentially lower the tax burden on CFCs located in low-tax jurisdictions. In particular, the finance company exemption allows financing of high-tax subsidiaries via a low-tax CFC. Fifth, historically the UK system does not charge withholding taxes on dividends paid from UK companies to their foreign shareholders. And the UK has signed a large number of tax treaties reducing withholding taxes on interest payments and on royalties. Sixth, the UK is part of the European Union: the EU Parent-Subsidiary Directive provides that intra-EU dividends paid by EU subsidiaries to an EU parent are exempt from withholding taxes, and the Interest and Royalties Directive provides that withholding taxes on intra-EU royalty and interest payments are set to zero.
The problems that remain are, however, deep-rooted. It is not through lack of trying that the government has found it impossible to simplify the tax system, or to convincingly deal with tax avoidance. These problems stem from the fundamental structure of the tax system. For international business, it stems from the international consensus on how the profit of a multinational company should be allocated between countries. Despite its
reforming zeal, both at home and internationally, this government – like its predecessors - has been unwilling to address the underlying issue of the structure of the tax system. Until governments do so, the business tax system will continue to become more complex. And strong competitive forces – which the Coalition government has led and encouraged – will continue to push down rates of corporation tax and the associated tax revenues.

www.sBs.oxford.edu/tax 41
References
Agrawal, A., Rosell, C., and Simcoe, T. S. (2014) “Do tax credits affect R&D expenditures by small firms? Evidence from Canada”, Working Paper 20615, National Bureau of Economic Research.
Arnold, J. M., Brys, B., Heady, C., Johansson, Å., Schwellnus, C. and Vartia, L. (2011) “Tax policy for economic recovery and growth”, Economic Journal -Royal Economic Society, vol.121(550), F59-F80, February.
Bloom, N., Griffith, R., and Reenen, J. V. (2002) “Do R&D tax credits work? Evidence from a panel of countries 1979-1997”, Journal of Public Economics 85(1), 1–31.
Bond, S., Denny, K., Hall, J., and McClusky, W. (1996) “Who pays business rates?”, Fiscal Studies, 17(1), 19-35.
Bond, S. and Jing, X. (2015) “Corporate taxation and capital accumulation: evidence from sectoral panel data for 14 OECD countries”, Oxford University Centre for Business Taxation working paper 10/15.
Crawford, I., Keen, M., and Smith, S. (2010) “Value-Added Tax and Excises” in S. Adam et al (eds.), Dimensions of Tax Design - The Mirrlees Review, Oxford: Oxford University Press, 275-422.
Crawford, R., Emmerson, C., Keynes, S. and Tetlow, G. (2015) “Fiscal aims and austerity: the parties’ plans compared”, IFS briefing note BN158, election briefing note 2015, no. 1
Department of Business, Innovation and Skills (2012) “Business population estimates – 2010 to 2012”. Available at www.gov.uk/government/statistics/bis-business-population-estimates
Devereux, M. P. and Griffith, R. (2003) “Evaluating Tax Policy for Location Decisions”, International Tax and Public Finance 10(2), 107-26.
Devereux, M. P. and Griffith, R. (1998) “Taxes and the location of production: evidence from a panel of US multinationals”, Journal of Public Economics 68(3), 335-367.
Devereux, M. P. and Vella, J. (2013) Parliamentary Commission for Banking Standards: Written evidence submitted by Professor Michael P. Devereux and Dr. John Vella”, June. Available at www.publications.parliament.uk/pa/jt201314/ jtselect/jtpcbs/27/27ix_we_h14.htm
Diamond P. and Mirrlees J. (1971) “Optimal taxation and public production I: production efficiency”, American Economic Review 61, 8-27.
Financial Markets Law Committee, (2009) “Response to the June 2009 HM Revenue and Customs Consultation Document on a Code of Practice for Banks”, Issue 146, October
Feld, L. P. and Heckemeyer, J. H. (2009) “FDI and taxation: a meta-study”, CESifo Working Paper Series 2540, CESifo Group Munich.
Goodall, A. (2010), “Avoidance: GAAR debate begins amid public scrutiny”, Tax Journal, 8 December.
Goundar, S. (2014), “Germany and UK agree patent box compromise”, Tax Journal, 14 November
Griffith et al. (2010) “International Capital Taxation”, Dimensions of Tax Design: The Mirrlees Review, Oxford: Oxford University Press, ch. 10, 914-1027.
Hall, R. and Jorgenson, D. (1967) “Tax Policy and Investment Behavior,” American Economic Review, June, 391-414.
Hall, B. and Van Reenen, J. (2000) “How effective are fiscal incentives for R&D? A review of the evidence”, Research Policy, 29(4-5):449-469.
HM Government (2010), The Coalition: our programme for government, April.
HM Government (2013), Review of the Balance of Competences between the United Kingdom and the European Union Taxation, July.
HM Revenue and Customs (2009), “A Code of Practice on Taxation for Banks”, December.
HM Revenue and Customs (2009), “A Code of Practice on Taxation for Banks – Supplementary guidance note”, December.
HM Revenue and Customs (2012), “A General Anti-Abuse Rule – consultation document”, June.
HM Revenue and Customs (2012), “HMRC Governance protocol on compliance with the Code of Practice on Taxation for Banks – Supplementary guidance note”, March.
HM Revenue and Customs (2013), “General Anti-Abuse Rule (GAAR) Advisory Panel: terms of reference”, May.
HM Revenue and Customs (2013), “Strengthening the Code of Practice on Taxation for Banks”, May.
HM Revenue and Customs (2013), “Raising stakes on avoidance”, July.
HM Revenue and Customs (2014), “Tackling marketed avoidance”, January.
HM Revenue and Customs (2014),”Guidance: FA 2014 Part 4 Follower notices and accelerated payments”, July.
HM Revenue and Customs (2014), “Corporation Tax Statistics”, August.
HM Revenue and Customs (2014), “Research and Development Tax Credits Statistics”, August.
HM Revenue and Customs (2014), “Measuring tax gaps”, October.
HM Treasury (2009), Securing the recovery: growth and opportunity, Pre-Budget Report, December.
HM Treasury (2010), Budget, March.
HM Treasury (2010), The corporate tax road map, April.
HM Treasury (2011), “GAAR Study: a report by Graham Aaronson QC”, 11 November.
HM Treasury (2013), Autumn Statement, December.
HM Treasury (2014), Autumn Statement, December.
HM Treasury and HM Revenue and Customs (2010), “Tax policy making: a new approach”, June.
HM Treasury and HM Revenue and Customs (2010) “Corporate Tax Reform: delivering a more competitive system”, November.
HM Treasury and HM Revenue and Customs (2011) “Research and Development tax credits: response and further consultation”, June.
HM Treasury and HM Revenue and Customs (2011) “Tackling tax avoidance”, March.
HM Treasury and HM Revenue and Customs (2012) “Research and Development tax credits: response to consultation”, December.
HM Treasury and HM Revenue and Customs (2013) “Analysis of the Dynamic Effects of Corporation Tax Reductions”, December.
HM Treasury and HM Revenue and Customs (2014), “Tackling aggressive tax planning in the global economy: UK priorities for the G20-OECD project for countering Base Erosion and Profit Shifting”, March.
HM Treasury (2014), Autumn Statement, December.
Inland Revenue. A General Anti-Avoidance Rule for Direct taxes, 1998.
Jorgenson, D. (1971) “Econometric Studies of Investment Behavior: A Survey,” Journal of Economic Literature, 1111-147.
Kawano, L. and Slemrod, J. (2012) “The Effect of Tax Rates and Tax Bases on Corporate Tax Revenues: Estimates with New Measures of the Corporate Tax Base”, Working Papers 1219, Oxford University Centre for Business Taxation.
Lokshin, B. and Mohnen, P. (2012) “How effective are level-based R&D tax credits? Evidence from the Netherlands”, Applied Economics 44(12), 1527–1538.
Loomer, G. T. (2006), “Taxing out of time: parliamentary supremacy and retroactive tax legislation”, British Tax Review, 1, 64-90.
Mairesse, J. and Mulkay, B. (2011) “Evaluation de l’impact du credit impot recherché”, Working Papers 2011-35, Centre de Recherche en Economie et Statistique.
McFetridge, D., and Warda J. (1983) “Canadian R&D Tax Incentives: Their Adequacy and Impact. In C. T. Foundation”, Canadian Tax Paper 70, Toronto.
Mirrlees, J. and Adam, S. and Besley, T. and Blundell, R. and Bond, S. and Chote, R. and Gammie, M. and Johnson, P. and Myles, G. and Poterba, J. (2011), Tax by Design: The Mirrlees Review, Oxford: Oxford University Press.
Office of Budget Responsibility (2014), “Briefing Paper No. 6: Policy costings and our forecast”, March.
Office of National Statistics (2014), “Capital Stock and Capital Consumption data”, November.
Office of National Statistics (2014), “Quarterly capital expenditure (CAPEX) and survey populations by employment size bands”, (ref. 003247).
Organization for Economic Cooperation and Development (2012), “Consumption Tax Trends 2012 – VAT/GST and Excise Rates, Trends and Administration Issues”, OECD Publishing, Paris.
Organization for Economic Cooperation and Development (2013), “Action Plan on Base Erosion and Profit Shifting”, OECD Publishing, Paris.
Organization for Economic Cooperation and Development (2013), “OECD Science, Technology and Industry Scoreboard 2013: Innovation for Growth”, OECD Publishing, Paris.
Organization for Economic Cooperation and Development OECD (2014), “Countering Harmful Tax Practices More Effectively, Taking into Account Transparency and Substance”, OECD/G20 Base Erosion and Profit Shifting Project, OECD Publishing, Paris.
Organization for Economic Cooperation and Development OECD (2014), “Revenue Statistics”, OECD Publishing, Paris.
Treasury Select Committee, (2012), “Thirtieth Report – Budget 2012”, 18 April.
Wales C.J. and Wales C.P. (2013), “Structures, processes and governance in tax policy-making”, Oxford University Centre for Business Taxation Report.
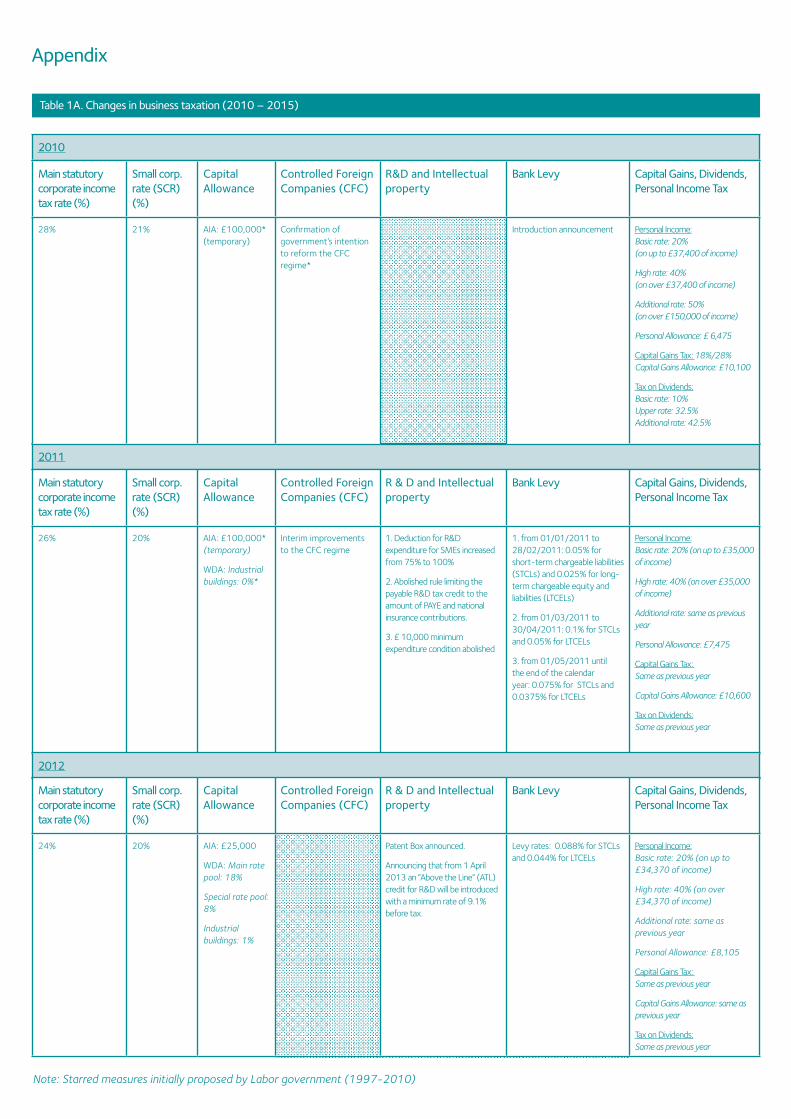
42 Business taxation under the Coalition
2011
Main statutory corporate income tax rate (%)
Small corp. rate (SCR)(%)
Capital Allowance
Controlled Foreign Companies (CFC)
R & D and Intellectual property
Bank Levy Capital Gains, Dividends, Personal Income Tax
26% 20% AIA: £100,000* (temporary)
WDA: Industrial buildings: 0%*
Interim improvements to the CFC regime
1. Deduction for R&D expenditure for SMEs increased from 75% to 100%
2. Abolished rule limiting the payable R&D tax credit to the amount of PAYE and national insurance contributions.
3. £ 10,000 minimum expenditure condition abolished
1. from 01/01/2011 to 28/02/2011: 0.05% for short-term chargeable liabilities (STCLs) and 0.025% for long-term chargeable equity and liabilities (LTCELs)
2. from 01/03/2011 to 30/04/2011: 0.1% for STCLs and 0.05% for LTCELs
3. from 01/05/2011 until the end of the calendar year: 0.075% for STCLs and 0.0375% for LTCELs
Personal Income: Basic rate: 20% (on up to £35,000 of income)
High rate: 40% (on over £35,000 of income)
Additional rate: same as previous year
Personal Allowance: £7,475
Capital Gains Tax: Same as previous year
Capital Gains Allowance: £10,600
Tax on Dividends: Same as previous year
Table 1A. Changes in business taxation (2010 – 2015)
2010
Main statutory corporate income tax rate (%)
Small corp. rate (SCR)(%)
Capital Allowance
Controlled Foreign Companies (CFC)
R&D and Intellectual property
Bank Levy Capital Gains, Dividends, Personal Income Tax
28% 21% AIA: £100,000* (temporary)
Confirmation of government’s intention to reform the CFC regime*
Introduction announcement Personal Income: Basic rate: 20% (on up to £37,400 of income)
High rate: 40% (on over £37,400 of income)
Additional rate: 50% (on over £150,000 of income)
Personal Allowance: £ 6,475
Capital Gains Tax: 18%/28% Capital Gains Allowance: £10,100
Tax on Dividends: Basic rate: 10% Upper rate: 32.5% Additional rate: 42.5%
2012
Main statutory corporate income tax rate (%)
Small corp. rate (SCR)(%)
Capital Allowance
Controlled Foreign Companies (CFC)
R & D and Intellectual property
Bank Levy Capital Gains, Dividends, Personal Income Tax
24% 20% AIA: £25,000
WDA: Main rate pool: 18%
Special rate pool: 8%
Industrial buildings: 1%
Patent Box announced.
Announcing that from 1 April 2013 an “Above the Line” (ATL) credit for R&D will be introduced with a minimum rate of 9.1% before tax.
Levy rates: 0.088% for STCLs and 0.044% for LTCELs
Personal Income: Basic rate: 20% (on up to £34,370 of income)
High rate: 40% (on over £34,370 of income)
Additional rate: same as previous year
Personal Allowance: £8,105
Capital Gains Tax: Same as previous year
Capital Gains Allowance: same as previous year
Tax on Dividends: Same as previous year
Appendix
Note: Starred measures initially proposed by Labor government (1997-2010)

www.sBs.oxford.edu/tax 43
2013
Main statutory corporate income tax rate (%)
Small corp. rate (SCR)(%)
Capital Allowance
Controlled Foreign Companies (CFC)
R&D and Intellectual property
Bank Levy Capital Gains, Dividends, Personal Income Tax
23%
Patent Box*: (10% but phased in gradually)
20% AIA: £250,000 (temporary)
New CFC rules enter into force for financial accounts starting on or after 1 January 2013*
“Above the Line” (ATL) credit for R&D introduced - the rate of the credit increased to 10%
Levy rates: 0.13 % for STCLs and 0.065% for LTCELs
Personal Income: Basic rate: 20% (on up to £32,010 of income)
High rate: 40% (on over £32,010 of income)
Additional rate: 45% (on over £150,000 of income)
Personal Allowance: £9,440
Capital Gains Tax: Same as previous year Capital Gains Allowance: £10,900
Tax on Dividends: Basic rate: Same as previous year Upper rate: Same as previous year Additional rate: 37.5%
2014
Main statutory corporate income tax rate (%)
Small corp. rate (SCR)(%)
Capital Allowance
Controlled Foreign Companies (CFC)
R & D and Intellectual property
Bank Levy Capital Gains, Dividends, Personal Income Tax
21% 20% AIA: £500,000* (temporary)
Increase in the payable credit to loss-makers under the SMEs R&D tax relief
- As of 01/04/2014 the rate of R&D payable tax credit for loss-making SMEs will increase from 11% to 14.5 %
Levy rates: 0.156% for STCLs and 0.078% for LTCELs
Personal Income: Basic rate: 20% (on up to £31,865 of income)
High rate: 40% (on over £31,865 of income)
Additional rate: 45% (on over £150,000 of income)
Personal Allowance: £10,000
Capital Gains Tax: Same as previous year Capital Gains Allowance: £11,000
Tax on Dividends: Same as previous year
2015
Main statutory corporate income tax rate (%)
Capital Allowance Controlled Foreign Companies (CFC)
R & D and Intellectual property
Bank Levy Capital Gains, Dividends, Personal Income Tax
20%
Diverted profits tax introduced (25% rate on diverted profits)
AIA: £ 500,000 (until 31/12/2015)
(temporary)
Personal Income: Basic rate: 20% (on up to £31,785 of income)
High rate: 40% (on over £31,785 of income)
Additional rate: same as previous year
Personal Allowance: £10,600
Capital Gains Tax: Same as previous year
Tax on Dividends: Same as previous year

WWW.SBS.OXFORD.EDU/TAX © 2014 said Business sChool.
oxford university Centre for Business taxation saïd Business school Park end street oxford ox1 1hP united Kingdom t: +44 (0) 1865 288790 e: [email protected]
The Oxford University Centre for Business Taxation
The Oxford University Centre for Business Taxation is an independent research centre which aims to promote effective policies for the taxation of business.
The Centre undertakes and publishes multidisciplinary research into the aims, practice and consequences of taxes which affect business. Although it engages in debate on specific policy issues, the main focus of the Centre’s research is on long-term, fundamental issues in business taxation. Its findings are based on rigorous analysis, detailed empirical evidence and in-depth institutional knowledge.
The Centre provides analysis independent of government, political party or any other vested interest. The Centre has no corporate views: publications of the Centre are the responsibility of named authors. The Centre is not a consultancy: it reserves the right to publish the results of its research.
The Centre’s research programme is determined on the basis of academic merit and policy relevance, and is the responsibility of the Director and the Centre’s Steering Committee. Decisions on the Centre’s research programme and the content of research are taken independently of the views of the Centre’s donors and other funding agencies and comply with the University’s Donor Charter. All research carried out at the Centre is undertaken with a view to publication.
The Centre complies with the University’s policy on conflict of interest.
Saïd Business School
saïd Business school at the university of oxford blends the best of new and old. we are a vibrant and innovative business school, but yet deeply embedded in an 800-year-old world-class university. we create programmes and ideas that have global impact. we educate people for successful business careers, and as a community seek to tackle world-scale problems. we deliver cutting-edge programmes and ground-breaking research that transform individuals, organisations, business practice, and society. we seek to be a world-class business school community, embedded in a world-class university, tackling world-scale problems.