business transformation in the chemical industry are you ... · business transformation in the...
TRANSCRIPT

Business Transformation in the Chemical IndustryAre you ready?


Business Transformation in the Chemical Industry | Are you ready?
03
The chemical industry – proud of the past 04
The chemical industry going forward – mind the gap 06
Business transformation in the chemical industry 12
Deloitte – The partner for a successful business transformation 17
Contact 18
04
The chemical industry – proud of the past
Today's chemical industry is a €3,347bnmarket with growth rates exceeding 5 percent per annum, a value 1.8 times that of Germany's GDP as well as considerable profitability and stability. It has created more value for shareholders, employees and customers than most other industries.
And it has the unique ability to transform natural resources into formulated products and materials that provide better solutions, differentiation and innovation to both cus-tomers and consumers.
Better solutions create additional growth by substituting other materials, such as glass, stones, metals, ceramics, paper, rubber, natural textiles or leather. Differ-entiation and innovation trigger growth by enabling new products, solutions and applications, such as new forms of mobility, zero-energy housing, precision farming, 3D printing, computing power, touch screens, and OLED displays. This, coupled with the demographic development of the middle class, accounts for the strong growth in the industry.
Recycling, resource-efficient production, and material-efficient precision applica-tions will reduce the specific and absolute demand for virgin chemicals and materials, but despite these negative volume demand effects we anticipate that the chemical industry will continue its upward trend
and grow in excess of 4.5 percent p.a., well ahead of its supplier and customer industries. Consequently, we are seeing increasing investment in global chemical capacity and new process technology to transform natural resources directly into chemicals, avoiding the stagnating refinery value chain step.
Unlike high tech and other industries witnessing above-average growth, the chemical industry has also been enjoying considerable profitability due to high entry barriers such as physical dependencies (pipelines, economies of scope, transport and storage access), favorable access to infrastructure and resources (energy, feedstock, raw materials, skilled labor, capital), regulatory protection (license to operate, product approval and registration, transparency of origin, regulatory compli-ance, tariffs, taxes and duties), and high switching costs (single source situations, requalification costs, exclusive distribution agreements).
At the same time, the industry has been very stable due to high barriers to exit, examples being non-transferable assets, high redundancy, and clean-up and discon-tinuation costs. This has been true in spite of several structural step changes from Chemistry 1.0 to now 4.0 in the industry’s over 150-year-long history.

Business Transformation in the Chemical Industry | Are you ready?
05
Fig. 1 – Value chain in the chemical industry (schematic)
Source: IHS, CEFIC, Deloitte
Natural ResourcesMetals & Mining· Minerals· Metals· Coal
Customers & Consumers
• Rubber & Plastics • Processing• Automotive/Transportation• Agriculture• Food & Beverages• Pulp & Paper• White & Brown Goods
• Packaging• Building & Construction• Recreation & Sport• Medical Devices• Pharmaceuticals• Personal Care• Textiles
• Leather• Wood• Electrical & Electronics• Publishing & Printing• Furniture• Machinery & Equipment
Inorganics (11%)• Ammonia/Urea• Chlorine/Caustic/Hydrogen• Oxygen/Nitrogen/Argon• Sulfur• Acids /Lyes• Inorganic intermediates
Polymers & other materials (23%)• Plastics, compounds, masterbatches• Synthetic Rubbers & Fibers, Insulation• Battery materials, Nanomaterials• Pigments, Catalysts• Enzymes, Proteins, Biomaterials
Consumer Chemicals, Ingredients & Additives (37%)• Care Chemicals, Soaps, Detergents• Cosmetics• Adhesives & Sealants• Coatings, Paints, Inks & Dyes• Crop Protection• Food & Feed Ingredients• Leather, Textile, Pulp & Paper Chemicals• Construction Chemicals• Industrial & Institutional Hygiene• Oil & Gas, Coal, Mining Chemicals
Building Blocks (40%)
Chemicals, Ingredients, Additives & Materials (60%)
Organic Petrochemicals (29%)• Methanol (C1)• Ethanol (C2)• Olefins - Ethylene C2 - Propylene C3• Butadiene (C4)• BTX (C6-8)• Fats & Oils (C8–20)• Organic intermediates
Chemical industry (€3,347bn revenues in 2018)
Power & Utilities· Electricity· Steam· Water
Oil & Gas· Crude Oil· Natural Gas· New Fuels/Hydrogen· Biomass/Renewables
Feedstock Energy

06
The chemical industry going forward – mind the gapSince late 2018, we have observed slowing growth and diminishing profits. According to the European Chemical Industry Council, chemi-cal output in Europe is on course to grow by just 0.5 percent this year.
Is this a normal effect of the business cycle, as we have seen several times before? If so, we should not worry, just ride out the business cycle and introduce cost-cutting and restructuring measures as usual. Or is it more than that this time? We believe the latter is the case and have identified four key reasons why the current trend is a structural and fundamental issue.
not only in Asia, but also in the Middle East, Africa, and Central and South America. The logic is simple: product and process innovation is insufficient to support prof-itable growth. While western companies are switching portfolios and customers for the highest price and margin, Chinese and Indian chemical companies are building segment leadership positions, growing their market share, and forging long-term relationships in regions of high growth. Western chemical companies are growing almost exclusively through acquisitions and higher priced value adding services, whereas Asian chemical companies are capturing the full organic growth potential of the industry. Many of the fast-growing incumbents are national players, fulfilling different strategic objectives compared to value-maximizing western chemical com-panies. Up to now, the western strategies have worked very well, but going forward we anticipate that these companies will lose impact in the different sectors and will
ultimately no longer be credible players in selected segments of the chemical industry. We can already observe that western companies have been able to maximize profits and net working capital, but have failed to grow organically and gain market share. This phenomenon is likely to accelerate as demand in India and Africa increases. And if there are no major innova-tion breakthroughs for western players, the situation promises to get a lot worse.
National players/incumbent nations capture the growth China has become the driving force in the global chemical industry in recent years. At present, China accounts for 36 percent of the global chemical industry, but its share is expected to grow to about 50 percent by 2030. China currently employs more than 8.8 million people in the chemical industry, which is more than five times the number of employees in EU28 and NAFTA together. It also invests 3–4 times more in assets and 20–40 percent more in R&D than NAFTA and EU28. Also it has improved its cost competiveness by 2–3 percent every year compared with its global competitors. China is the growth engine of the chemical industry, far more so than the U.S. and Middle East with their energy and feed-stock advantages. The climate-driven fossil fuel discussion will further benefit China. Whereas western companies focus on prof-itability and value add, producers in China and increasingly India are taking market share and capturing the industry’s growth,

Business Transformation in the Chemical Industry | Are you ready?
07
Fig. 2 – Geographical overview of chemicals turnover 2007–2018Turnover Chemicals industry 2018 [€bn] 100 percent = €3,347bn (excluding €1,261bn pharma turnover)
* e.g., 2018 €173bn, thereof €128bn other Europe, €24bn Africa and €21bn Australia/Oceania
Rest of World*
World
+75%
1,909
3,347
2007 2018
CAGR 5.2%
NAFTA
LATAM
+18%
448530
2007 2018
CAGR 1.5%
+66%
104 173
2007 2018
CAGR 4.7%
+27%
93 118
2007 2018
CAGR 2.2%
EU 28
+8%
524 565
2007 2018
CAGR 0.7%
Rest of Asia
+67%
458
763
2007 2018
CAGR 4.7%
China
+325%282
1,198
2007 2018
CAGR 14.1%
08
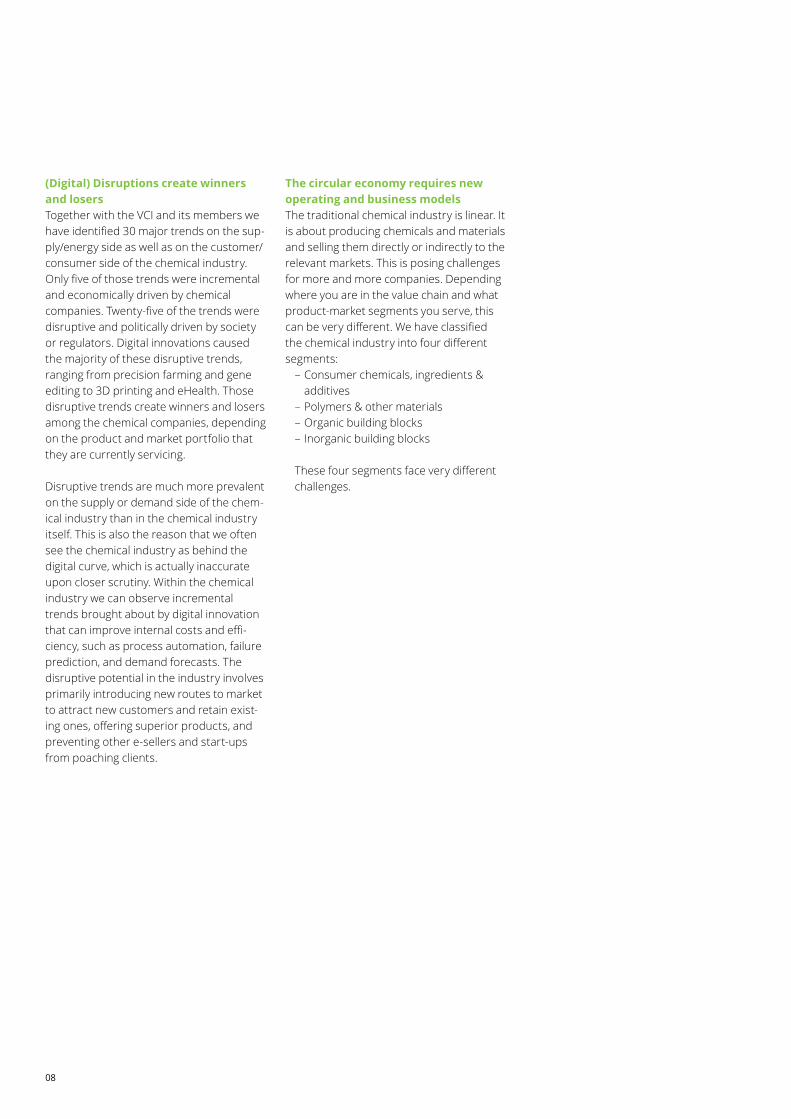
(Digital) Disruptions create winners and losers Together with the VCI and its members we have identified 30 major trends on the sup-ply/energy side as well as on the customer/consumer side of the chemical industry. Only five of those trends were incremental and economically driven by chemical companies. Twenty-five of the trends were disruptive and politically driven by society or regulators. Digital innovations caused the majority of these disruptive trends, ranging from precision farming and gene editing to 3D printing and eHealth. Those disruptive trends create winners and losers among the chemical companies, depending on the product and market portfolio that they are currently servicing. Disruptive trends are much more prevalent on the supply or demand side of the chem-ical industry than in the chemical industry itself. This is also the reason that we often see the chemical industry as behind the digital curve, which is actually inaccurate upon closer scrutiny. Within the chemical industry we can observe incremental trends brought about by digital innovation that can improve internal costs and effi-ciency, such as process automation, failure prediction, and demand forecasts. The disruptive potential in the industry involves primarily introducing new routes to market to attract new customers and retain exist-ing ones, offering superior products, and preventing other e-sellers and start-ups from poaching clients.
The circular economy requires new operating and business models The traditional chemical industry is linear. It is about producing chemicals and materials and selling them directly or indirectly to the relevant markets. This is posing challenges for more and more companies. Depending where you are in the value chain and what product-market segments you serve, this can be very different. We have classified the chemical industry into four different segments:
– Consumer chemicals, ingredients & additives
– Polymers & other materials – Organic building blocks – Inorganic building blocks
These four segments face very different challenges.

Business Transformation in the Chemical Industry | Are you ready?
09
Fig. 3 – Challenges and issues of the chemical industry 2018
Chemical Industry 2018 Critical Issues & Actions for each Segment (schematic)
Consumer Chemicals, Ingredients & Additives Re(Design) products to allow for superior performance in applications, but also safe handling and low harm for the environment
Polymers & other materials Re(Design) products for superior properties as well as resource and energy efficiency, also avoiding waste and closing material flows, across all sectors and applications
Building Blocks Produce Building Blocks resource and energy efficiently, using renewable energy
Organic Building Blocks Additionally use bio- or waste-based feedstocks or green hydrogen power-to-product routes instead of fossil hydrocarbon raw materials
Inorganic Building Blocks Additionally explore energy-chemicals sector convergence synergies
Emission[mtonsCO2e]
0%
20%
40%
60%
80%
100%
Production[Mmt]
Turnover[€bn]
1,800 1,485 3,347
10%
45%
28%
29%
34%
35%23%
11%
24%38%
10% 13%
Source: IHS, CEFIC, Deloitte

10
Societal and regulatory requirements challenging the license to operate Society and regulators are increasingly challenging the license to operate on grounds of accidents, overdue inspections, resident concerns, noise or emissions into soil, water, and air. At the same time, they look at unwanted side effects during the product lifecycle, for example the issue of ocean pollution caused by single-use plas-tics. Regulators reacted quickly in banning the production of single-use plastics and the export of plastic waste. However, the impact of the regulator on operations is not a Western European phenomenon, but a global issue. Take, for example, the Chinese government, which is currently in the process of closing down thousands of the country's chemical sites and companies that do not comply with antidumping and/or environmental standards. This is having a real impact, which we can observe, for instance, in the significant reduction in supply security for certain agro and pharma fine chemical precursors. A similar challenge comes from less predictable duties, tariffs, and taxes, which have a direct impact on the competitiveness and existence of local production serving inter-national markets.
Unfortunately, the DNA that has made the chemical industry so successful throughout its history and into the present is also the biggest obstacle to overcoming these four strategic-structural challenges and winning the future. Entry and exit barriers are becoming a hurdle to adapting quickly to the new challenges. Moreover, the culture and ways of working that made the chemical industry strong in the past are not the right ingredients for successfully leveraging opportunities and mitigating risks in the future. And finally, the industry is not attractive for the digital talent we so urgently need to succeed in the future.
Transformation of the chemical industry and its business and/or operating model is vital if we want to mitigate the downsides and capture the upsides.

Business Transformation in the Chemical Industry | Are you ready?
11

12
Business transformation in the chemical industry
It is important to note, however, that the chemical industry is not homogeneous, which is why the impact of the four strate-gic-structural challenges outlined earlier varies considerably based on product and market segment as well as country/location. External challenges can range from weak to strong, depending for instance on whether you are a midsized coatings manufacturer, a large fertilizer company or a technology- driven wind blade producer and whether your operations are in the U.S., China or Germany. Furthermore, those challenges might become relevant immediately or only over the longer term.
We recommend determining how signifi-cant the challenge is for all product market segments in their major countries/regions and when you can expect to first encoun-ter the challenge.
In parallel, we recommend evaluating your specific competitive position and internal fitness to master those chal-lenges. For this we analyze market share, relative cost position, financial and oper-ational performance, cash generation, asset and organizational effectiveness as well as workforce profile and skills,
especially with regard to keeping pace with digital trends.
The combination of external strategic- structural challenges (y-axis) and compet-itive position and internal fitness (x-axis) creates four business transformation archetypes for individual businesses:
Fig. 4 – Overview transformation archetypes
Competitive Position and Internal Fitness
Are you acting from a position of strength or weakness?
How fast do you see your business environment changing?
External Strategic-Structural Challenges
Transformation archetypes
· Market share and relative cost position· Financial & operational performance· Cash generation· Asset & organizational effectiveness· Workforce profile & skills
· Impact of (digital) disruption· Organic growth potential against incumbents· Circular economy needs· License-to-operate risks
Exte
rnal
Str
ateg
ic-
Stru
ctur
al C
halle
nges
Competitive Position and Internal Fitness
Transform the coreUnlock short-term
performance improvements and transform core operating
model
1Explore the edge
Continuously evolve the current business model and
explore new opportunities at theedge of the organization
3
Reinvent the coreStop the bleeding and
develop a new and sustainable business model as soon
as possible
2Own the disruption
Proactively develop new business models and radically
shift resources to differentiating capabilities
4
wea
kst
rong
weak strong

Business Transformation in the Chemical Industry | Are you ready?
13
Businesses with a weak competitive position and low financial performance that are facing limited external challenges (quadrant #1) should focus on “Transform the core.” Short-term efficiency gains within procurement, supply chain or sales enable continuous improvement of the core operating model. The focus is on short-term cost reduction while maintaining the competitive position in existing markets.
As the level of external strategic-structural challenges increases (quadrant #2), the immediate need for transformation emerges. “Reinvent the core” focuses on reframing the current business and devel-oping new and sustainable operating mod-els. The focus is on unlocking short-term earnings and cash generation potential to stop the bleeding. Funding for entering new markets must be provided at the same time. This highly complex transformation requires full commitment.
By contrast, businesses with a strong com-petitive advantage that are facing limited challenges (quadrant #3) should challenge their operating model and “Explore the edge” by considering expanding their cur-rent business. The focus is on developing a sustainable innovation pipeline, improving efficiency, and securing market share with sufficient CAPEX.
Businesses with a strong competitive position and financial performance that are facing a high level of external challenges (quadrant #4) should proactively drive the transformation and save-to-transform. Investing into digital technologies and technology infrastructure is done in order to make operations more efficient and effective and to enable new and more agile business models to prosper, especially in digitally disrupted markets. In contrast to the previous category, it is the technology factor here that sets their business apart from the competition.
Doing this intellectual exercise is useful, as it will help you get a fresh idea of the challenges facing your individual businesses given their current position and your readiness to seize opportunities and mitigate the risks. How-ever, only concrete actions that strike at the heart of your operating model will really help you to improve.
14

Business Transformation in the Chemical Industry | Are you ready?
15
Typically, companies will need a set of consistent actions to balance profitability against value growth for the next busi-ness cycle. The aim of these actions is to enhance efficiency, foster structural change, and drive innovation into your business over the next business cycle.
Realizing business transformation success is more than defining a set of actions. Not all operations and business models are the same, and different strategies and costs drive results in different ways. In the end, there is no perfect portfolio of actions or investments. An efficiently managed port-folio is one that balances short-term and long-term objectives.
The transformation of the predominant operating model in the chemical industry will create additional and sustainable value.
16
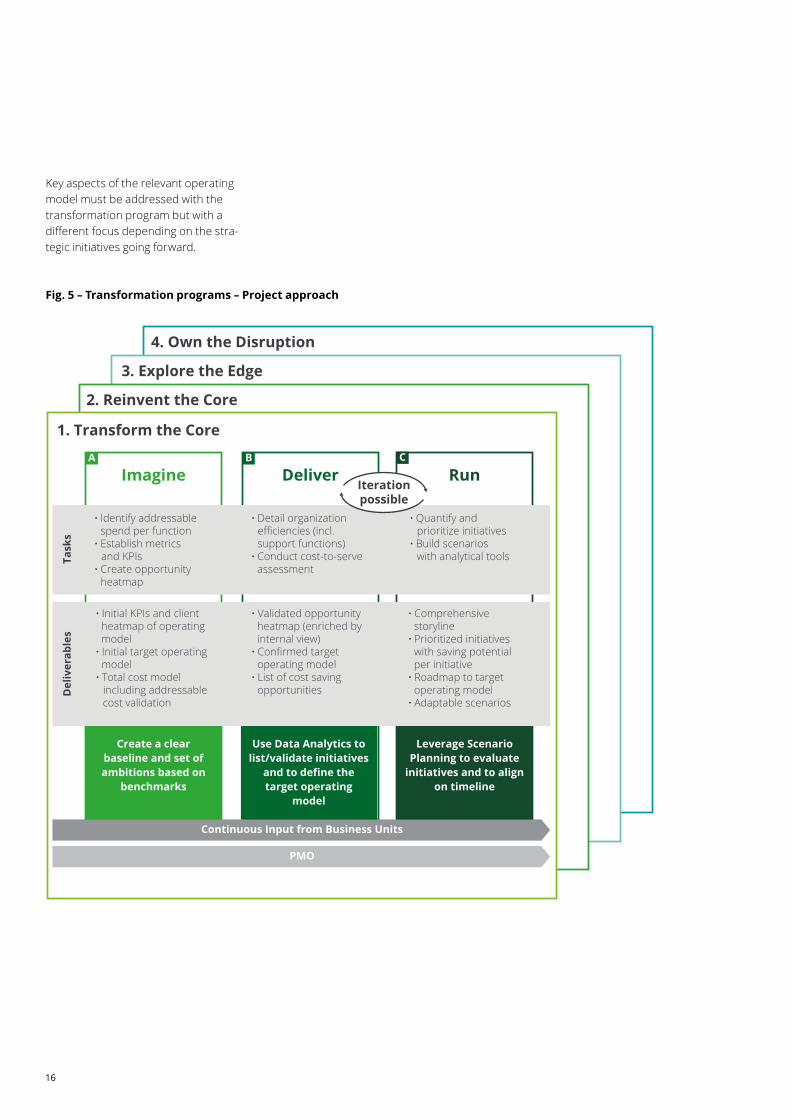
Fig. 5 – Transformation programs – Project approach
Key aspects of the relevant operating model must be addressed with the transformation program but with a different focus depending on the stra-tegic initiatives going forward.
1. Transform the Core
2. Reinvent the Core
3. Explore the Edge
4. Own the Disruption
ImagineA
DeliverB
RunC
Continuous Input from Business Units
PMO
Create a clear baseline and set of ambitions based on
benchmarks
Use Data Analytics to list/validate initiatives
and to define the target operating
model
Leverage Scenario Planning to evaluate
initiatives and to align on timeline
· Initial KPIs and client heatmap of operating model· Initial target operating model· Total cost model including addressable cost validation
· Validated opportunity heatmap (enriched by internal view)· Confirmed target operating model· List of cost saving opportunities
· Comprehensive storyline· Prioritized initiatives with saving potential per initiative· Roadmap to target operating model· Adaptable scenarios
Del
iver
able
s
· Identify addressable spend per function· Establish metrics and KPIs· Create opportunity heatmap
· Detail organization efficiencies (incl. support functions)· Conduct cost-to-serve assessment
· Quantify and prioritize initiatives· Build scenarios with analytical toolsTa
sks
Iterationpossible
Business Transformation in the Chemical Industry | Are you ready?
17
Deloitte – The partner for a successful business transformation
During a business transformation, you need a variety of capabilities and suport. At the beginning, you can build on Deloitte’s broad expertise in similar tasks with peers, suppliers, and customers in the relevant regions, as well as on our digital expertise. It is essential to first assess your strategic-structural challenges, com-petitive position, and operating/financial performance. This will allow us to shape the specific ambitions for your business trans-formation and determine where action is required.
In a series of workshops, we will define your business transformation roadmap by selecting the right combination of actions and estimating how much they are likely to contribute to profitability and growth. We will also assist with leadership alignment and organizational readiness.
Actions on portfolios, partnerships, investments, innovation, routes to market, and supply chains often require not only a strategic-commercial view, but also a tax, regulatory/legal, financial, audit/assurance, operational, technological, IT, digital, and, very importantly, a local/regional view. If the actions involve a strategic partner or
an acquisition or divestiture, Deloitte can provide M&A services from identification to integration. If they require rerouting or a footprint change, Deloitte offers tax, tariff, duty, supply chain, and transfer pricing expertise. When it comes to technology, Deloitte has digital and IT competence teams that will tailor their services to the client's need.
Every successful transformation requires ongoing monitoring to ensure your busi-ness benefits from full implementation and unlocks its full potential. Thanks to the clear KPIs we define, we will create full transparency for your transformation project, measure its overall financial impact and demonstrate its full potential.

18
Duane Dickson Partner Oil, Gas & Chemicals Leader USTel: (+1) 203 905 [email protected]
Dr. Wolfgang Falter PartnerOil, Gas & Chemicals Leader Central Europe Tel: +49 (0)211 8772 [email protected]
Dr. Hendrik Engelhardt DirectorBusiness TransformationTel: +49 (0)89 29036 [email protected]
Contact

Business Transformation in the Chemical Industry | Are you ready?
19
This communication contains general information only not suitable for addressing the particular circumstances of any individual case and is not intended to be used as a basis for commercial decisions or decisions of any other kind. None of Deloitte GmbH Wirtschaftsprüfungsgesellschaft or Deloitte Touche Tohmatsu Limited, its member firms, or their related entities (collectively, the “Deloitte network”) is, by means of this communication, rendering professional advice or services. No entity in the Deloitte network shall be responsible for any loss whatsoever sustained by any person who relies on this communication.
Deloitte refers to one or more of Deloitte Touche Tohmatsu Limited, a UK private company limited by guarantee (“DTTL”), its network of member firms, and their related entities. DTTL and each of its member firms are legally separate and independent entities. DTTL (also referred to as “Deloitte Global”) does not provide services to clients. Please see www.deloitte.com/de/UeberUns for a more detailed description of DTTL and its member firms.
Deloitte provides audit, risk advisory, tax, financial advisory and consulting services to public and private clients spanning multiple industries; legal advisory services in Germany are provided by Deloitte Legal. With a globally connected network of member firms in more than 150 countries, Deloitte brings world-class capabilities and high-quality service to clients, delivering the insights they need to address their most complex business challenges. Deloitte’s approximately 286,000 professionals are committed to making an impact that matters.
Issue 12/2019