business valuation in divorce
TRANSCRIPT
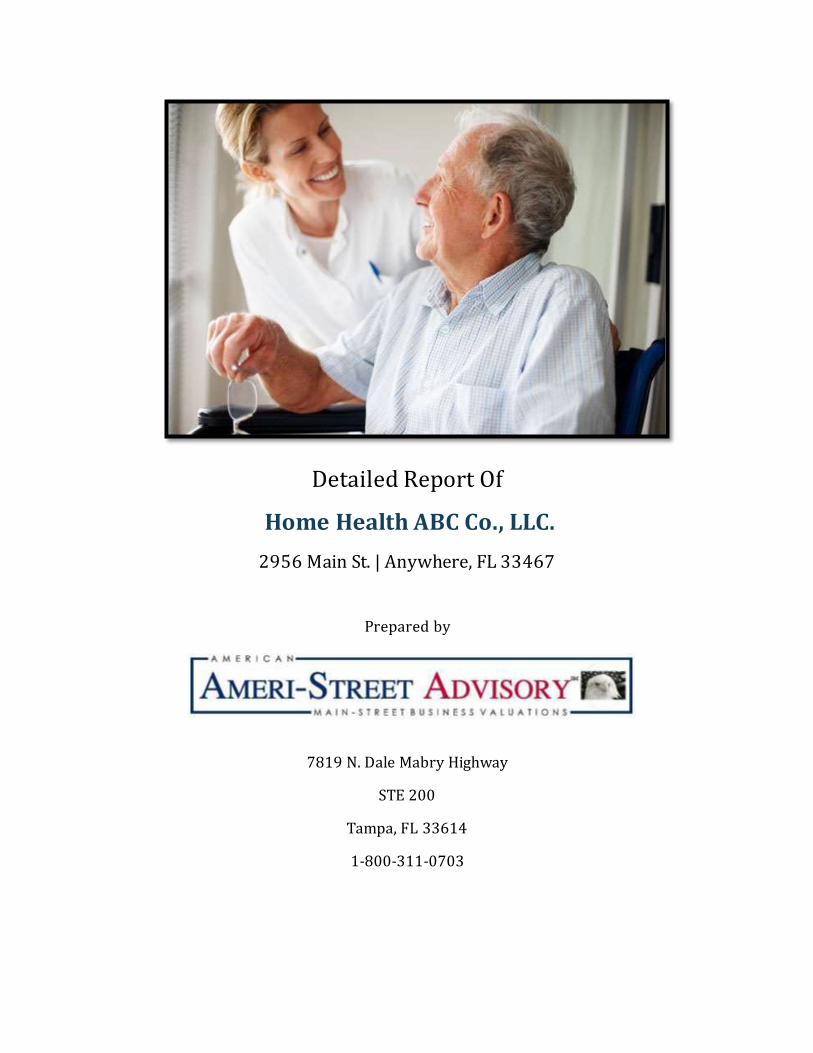
Detailed Report Of
Home Health ABC Co., LLC.
2956 Main St. | Anywhere, FL 33467
Prepared by
7819 N. Dale Mabry Highway
STE 200
Tampa, FL 33614
1-800-311-0703
- 2 - | P a g e
LETTER OF TRANSMITTAL
Report Date- 5/19/2014
Home Health ABC Co., LLC 2956 Main St. Anywhere, FL 33467
Regarding: Home Health ABC Co., LLC
Dear Mr. John Smith (Manager):
We have performed a valuation engagement, as that term is defined in the Statement on Standards for Valuation Services (SSVS) of the American Institute of Certified Public Accountants (AICPA), of one hundred percent (100%) controlling interest in Home Health ABC Co., LLC, herein known as the Subject Company or Company, as of the valuation date:
12/31/2012
This valuation was performed solely to assist our client in the matter of divorce proceedings; Intended user(s) of the valuation: owners of the Company and agents. The resulting estimate of value should not be used for any other purpose or by any other party for any purpose. This engagement was conducted in accordance with the SSVS. The estimate of value that results from the engagement is expressed as a conclusion of value.
Any other restrictions or limitations, hypothetical conditions, references to specialist used, disclosure of subsequent events, applications of jurisdictional exception, or any other information the valuation analyst deemed useful to enable user(s) of the report to understand the work performed shall be detailed in the Introduction section of this report.
Based on our analysis, as described in this detailed report, the estimate of value of one hundred percent (100%) controlling interest in the Company as of the valuation date was (rounded):
$802,657 (Personal Goodwill Carved Out)
$1,104,501 (Personal Goodwill Included)
This conclusion is subject to the Statement of Assumptions and Limiting Conditions section found in this report. We have no obligation to update this report or our conclusion of value for information that comes to our attention after the date of this report.
Salvatore B. Urso
President
Ameri-Street Advisory, Inc.
- 3 - | P a g e
CONTENTS
LETTER OF TRANSMITTAL ......................................................................................................................................... - 2 -
INTRODUCTION................................................................................................................................................................. - 5 -
PERSONAL GOODWILL CARVE-OUT ...................................................................................................................... - 8 -
ASSETS & LIABILITIES ALLOCATION (USING THE INCOME APPROACH) ...................................... - 11 -
FINANCIAL STATEMENT/INFORMATION ANALYSIS ................................................................................. - 12 -
HISTO RICAL INCOME & EXPENSES SUMMARY ...................................................................................................... - 12 -
SELLER’S DISCRETIO NARY EARNINGS CALCULATIO N ........................................................................................ - 13 -
NO RMALIZED, RECAST INCO ME & EXPENSE GRAPHS ......................................................................................... - 14 -
Income Graph......................................................................................................................................................... - 14 -
Gross Profit and SDE Margins Graph.............................................................................................................. - 15 -
Tax Return Front Page Expenses Graph ......................................................................................................... - 16 -
Tax Return Schedule A Graph ........................................................................................................................... - 17 -
DETERMINING THE EXPECTED MULTIPLE & CAP RATE......................................................................... - 19 -
THE CO MPARABLES (CO MPS) .................................................................................................................................... - 20 -
List of Comparables (Comps).............................................................................................................................. - 21 -
Graphic of Comparable Business & Subject Company................................................................................. - 22 -
ENTERPRISE RISK FACTO RS....................................................................................................................................... - 23 -
Goodwill (Personal vs. Business) Risk Factors............................................................................................... - 24 -
Sales Stability Risk Factors ................................................................................................................................. - 25 -
Other risk Factors ................................................................................................................................................. - 26 -
EFFECT O F RISK FACTORS ON CO MPANY VALUE ................................................................................................. - 27 -
RECONCILIATION OF CONCLUSION OF VALUE (SANITY CHECK) ....................................................... - 28 -
CAPITALIZED EARNINGS ............................................................................................................................................. - 29 -
NET MARGINS................................................................................................................................................................ - 30 -
BEFO RE-TAX-CASH FLOW.......................................................................................................................................... - 31 -
DEBT-S ERVICE RATIOS ............................................................................................................................................... - 32 -
FIRM PROFILE ................................................................................................................................................................. - 33 -
OUR MISSION ................................................................................................................................................................. - 33 -
ANALYST & PRINCIPAL PRO FILES ............................................................................................................................ - 34 -
- 4 - | P a g e
Francesco Urso, Principal................................................................................................................................... - 34 -
Salvatore B. Urso, Principal................................................................................................................................ - 35 -
William Burnham, Principal............................................................................................................................... - 36 -
Christopher Henderson, Principal..................................................................................................................... - 36 -
STATEMENT OF ASSUMPTIONS & LIMITING CONDITIONS ................................................................... - 37 -
INTERNATIONAL GLOSSARY OF BUSINESS VALUATION TERMS........................................................ - 39 -
GLOSSARY OF ADDITIONAL TERMS.................................................................................................................... - 46 -
BACKUP DATA................................................................................................................................................................. - 49 -
BALANCE SHEET AS O F DECEMBER 31, 2012 ......................................................................................................... - 49 -
ABBREVIATED TAX RETURN FO R 2012 .................................................................................................................... - 50 -
ABBREVIATED TAX RETURN FO R 2011 .................................................................................................................... - 51 -
ABBREVIATED TAX RETURN FO R 2010 .................................................................................................................... - 52 -
ABBREVIATED TAX RETURN FO R 2009 .................................................................................................................... - 53 -
NORMALIZED OWNER & FAMILY MEMBER SALARIES & WAGES .................................................. - 54 -

- 5 - | P a g e
INTRODUCTION
Type of Report: Detailed Report. As defined by SSVS.
The Subject Company description: Home Health Agency.
History of the Subject: John and Jane Smith started the business in 2006 and have operated
the business continuously since that time.
Prior Sale of Interest in the Subject: None.
Discounts1. If applicable the following Discounts were applied. Note that if both discounts are
applied, they are applied in a multiplicative manner, not additive.
Discount for Lack of Control2 (DLOC). This is sometimes referred to as Minority Interest Discount (MID). A discount was not was applied since the ownership interest being valued and owned by the client or user(s) is ownership sufficient to liquidate, merge, etc. If the analyst chose to apply this discount, it would have been applied to the Operating Assets prior the Discount for Lack of Marketability, DLOM (if applicable; see next section), i.e., additive.
1 Discounts only apply to the operating assets (tangible and intangible), not to the nonoperation assets and liabilities.
2 A control owner enjoys valuable prerogatives of ownership that a minority owner does not, including the
ability to appoint management, determine management compensation & prerequisites, set policy and change the course of the business, acquire and liquidate assets, award contracts, make acquisitions, liquidate, dissolve, sell or recapitalize the company, etc.
1. 100% Ownership
2. Ownership sufficient to liquidate, merge, etc. 3. 51% operating control
4. 50% -50% ownership (10% MID) 5. Less than 50%, but the largest block of s tock ownership (15% MID) 6. Less than 50%, but with swing vote powers (20% MID) 7. Less than 50%, but with cumulative voting powers (25% MID) 8. Pure minority (30% MID)
Minority Interest
Control Interest
- 6 - | P a g e
Discount for Lack of Marketability (DLOM). In this case, a DLOM was not applied when the Income Approach was considered. Based on the analyst’s experience in selling small, privately held companies, certain factors will limit the marketability of a company, e.g.,
location (small town vs. large city); niche companies requiring a non-common skill from the Buyer base. If the analyst chose to apply this discount, it would have been applied to the Operating Assets after the DLOC discount (if applicable), i.e., additive.
Restrictions and Limitations: None. (see SSVS Para 19).
Hypothetical Conditions: None. [see SSVS paragraph 22]
References to specialist used: None. [see SSVS Para 20]
Subsequent events: None to our knowledge as of the report date. [see Para 43 of SSVS]
Goodwill Allocation: In some cases, depending on the purpose and premise of the valuation,
as well as local state laws, it becomes necessary to bifurcate the Goodwill into Personal
Goodwill and Enterprise Goodwill. We refer to the separation and exclusion of the Personal (aka Professional) Goodwill as the “PGW carve-out.” In this case, the PGW is carved out; see section below “Personal Goodwill Carve-out” for details of the calculation.
Sources of Information:
The source of the financial information was corporate tax returns (2009 – 2012) and
balance sheet (as of 12/31/2012), which were all provided by the client or their advisors. See Backup Data section in this report.
The source of the non-financial information was
Telephone initial interview held on 8/1/2013.
The analyst did not tour the facility.
Company attendees of initial interview:
John Smith, Manager of Company
Standard of Value, Premise of Value, Approach, and Methods used:
In rendering a conclusion of value the analyst estimated fair market value on the premise of in continued use, as a Going Concern. The analyst considered four standard valuation approaches, namely- Income Approach, Asset Approach, Cost Approach, and Market Approach .
Ultimately, the analyst determined that the income approach yielded the highest value.
Furthermore, the method used within the chosen approach was the capitalization of Seller's Discretionary Earnings (SDE).

- 7 - | P a g e
The calculation of values
Conclusion of Value Equation (100% Controlling Interest & No Discounts)3
Value1= Operating Assets + Non-Operating Assets – Total Liabilities
$1,104,501 = $1,160,685 + $545,880 - ($602,064)
Conclusion of Value (after DLOC & DLOM applied and after PGW carved out)
Value2 = (Operating Assets – PGW4) x (1-MID) x (1-DLOM) + Non-Operating Assets – Total Liabilities
$802,656.78 = ( $1,160,685 - $301,844 ) x (1 - 0% ) x (1 - 0% ) + $545,880 + ($602,064)
Our Conclusion of Value is that One Hundred Percent (100%) controlling interest prior to any
discounts for control or lack of marketability is $1,104,501, where the Fair Market Value of the
Operating Assets component would be $1,160,685, which is composed of $154,538 (Tangible
Assets) plus $704,303 (Intangible Asset: Business or Enterprise Goodwill) plus $301,844
(Intangible Asset: Personal or Professional Goodwill), all based on the valuation performed
herein. Furthermore, the Non-Operating Assets are $545,880 and Total Liabilities are $602,064.
The 100% controlling, non-discounted interest in the Operating Assets was derived by using the
income approach, where the historical Weighted Seller’s Discretionary Earnings5 (wSDE) of
$363,261 was multiplied by the Sale-Price-to-Earnings Multiple (SP/SDE) of 3.2; see the sections
below called Seller’s Discretionary Earnings (SDE) and Determining the Expected Multiple and CAP
Rate.
The historical period considered was from FY2009 through FY2012.
Rationale for the Future Benefit Stream: Since revenue and SDE for FY09 were significantly lower
than the subsequent years , it was not considered in the wSDE calculations. Thus, equal weights
were applied to the respective SDE values for FY 12, FY11 and FY10 in order to estimate the
Future Benefit Stream.
3 See table in section called Assets & Liabilities Included (Operating & Non-Operating) for a summary of all operating and non-operating tangible assets and liabilities before minority interest discount is applied (if
applicable).
4 Personal or Professional Goodwill.
5 Seller’s Discretionary Earnings (SDE) is used as the basis for the value of this company. It represents the
net earnings before interest, income taxes, depreciation, amortization, owner perks, and elimination of all non-recurring income and expenses. It also assumes there is only one full -time working owner. Weighted SDE or wSDE takes into consideration multiple years’ performance.
- 8 - | P a g e
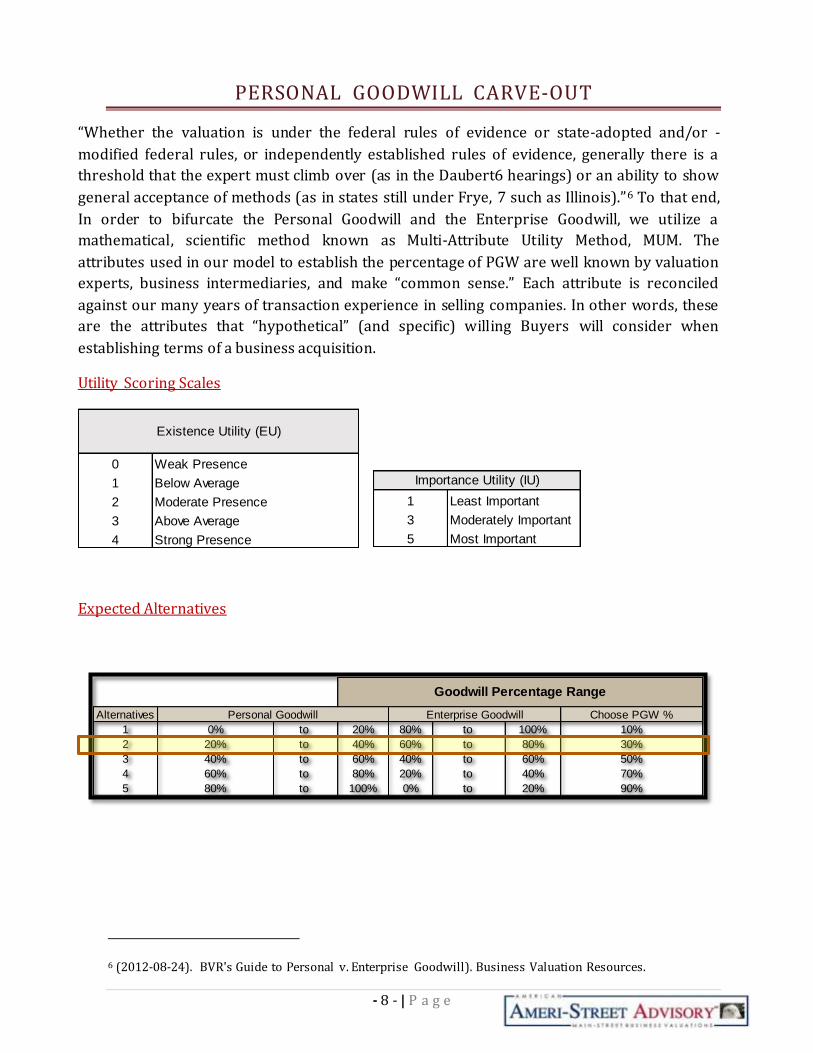
PERSONAL GOODWILL CARVE-OUT
“Whether the valuation is under the federal rules of evidence or state-adopted and/or -
modified federal rules, or independently established rules of evidence, generally there is a
threshold that the expert must climb over (as in the Daubert6 hearings) or an ability to show
general acceptance of methods (as in states still under Frye, 7 such as Illinois).”6 To that end,
In order to bifurcate the Personal Goodwill and the Enterprise Goodwill, we utilize a
mathematical, scientific method known as Multi-Attribute Utility Method, MUM. The
attributes used in our model to establish the percentage of PGW are well known by valuation
experts, business intermediaries, and make “common sense.” Each attribute is reconciled
against our many years of transaction experience in selling companies. In other words, these
are the attributes that “hypothetical” (and specific) willing Buyers will consider when
establishing terms of a business acquisition.
Utility Scoring Scales
Expected Alternatives
6 (2012-08-24). BVR's Guide to Personal v. Enterprise Goodwill). Business Valuation Resources.
0 Weak Presence
1 Below Average
2 Moderate Presence
3
4
Above Average
Strong Presence
Existence Utility (EU)
1 Least Important
3 Moderately Important
5 Most Important
Importance Utility (IU)
Alternatives Choose PGW %
1 0% to 20% 80% to 100% 10%
2 20% to 40% 60% to 80% 30%
3 40% to 60% 40% to 60% 50%
4 60% to 80% 20% to 40% 70%
5 80% to 100% 0% to 20% 90%
Goodwill Percentage Range
Personal Goodwill Enterprise Goodwill
- 9 - | P a g e
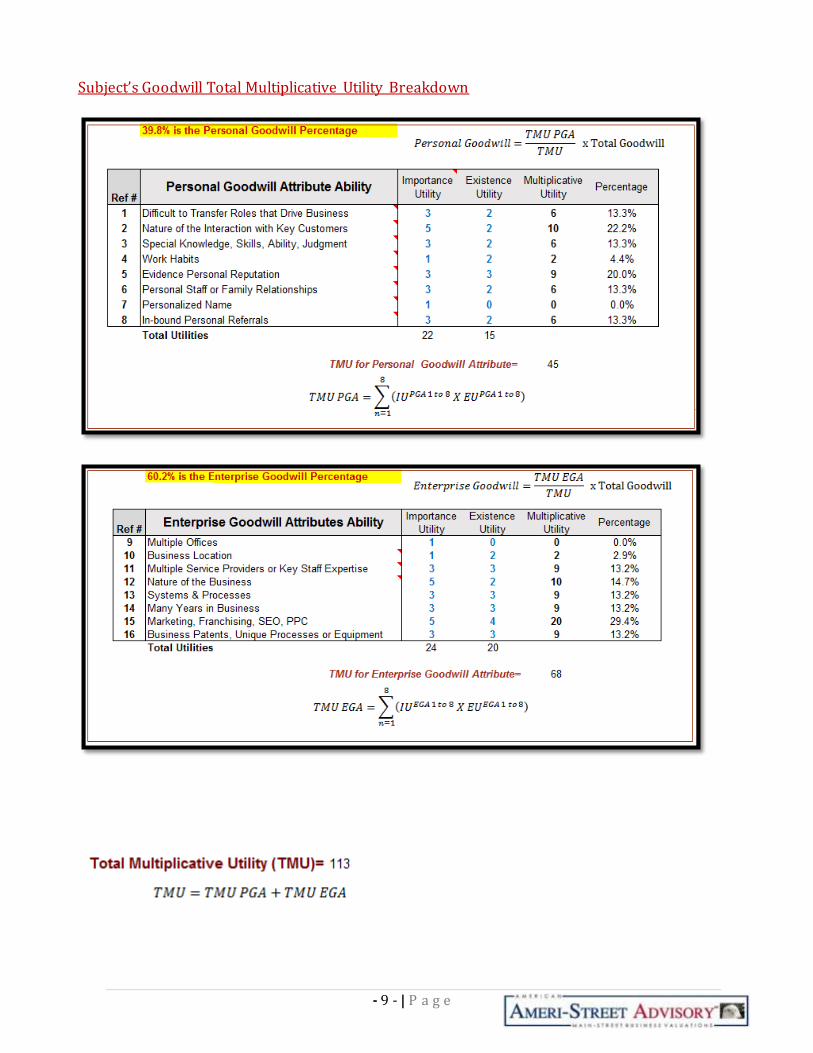
Subject’s Goodwill Total Multiplicative Utility Breakdown
- 10 - | P a g e
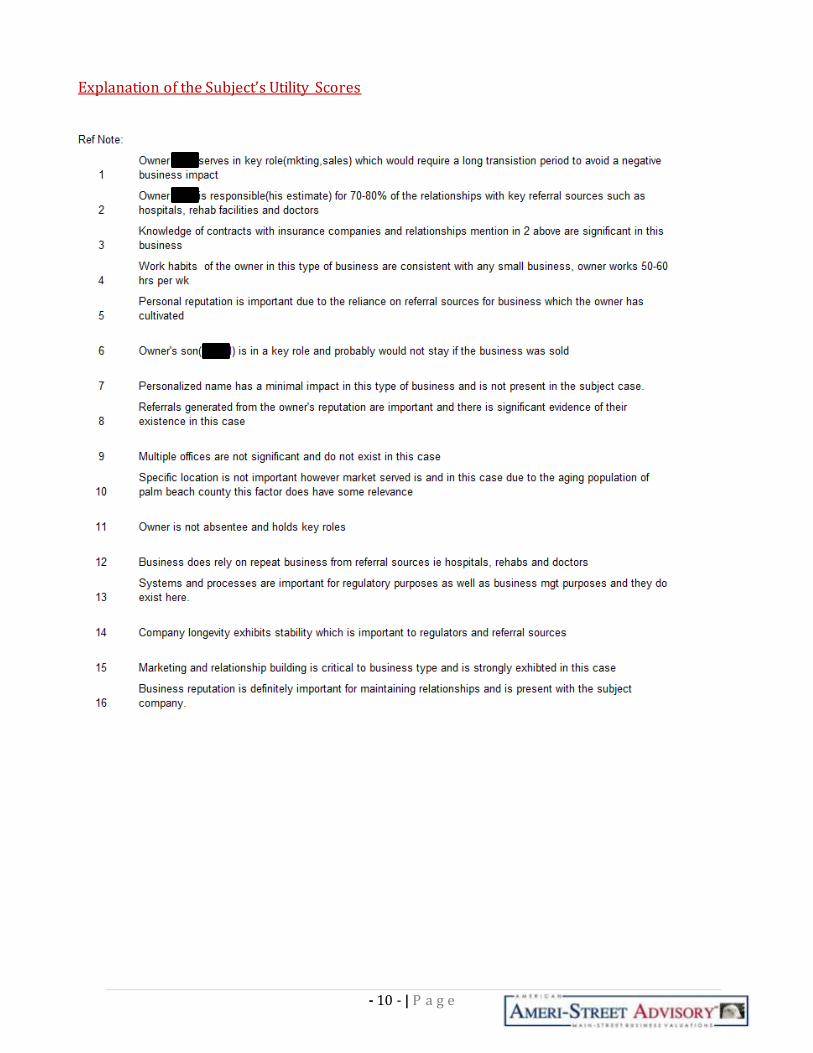
Explanation of the Subject’s Utility Scores
- 11 - | P a g e
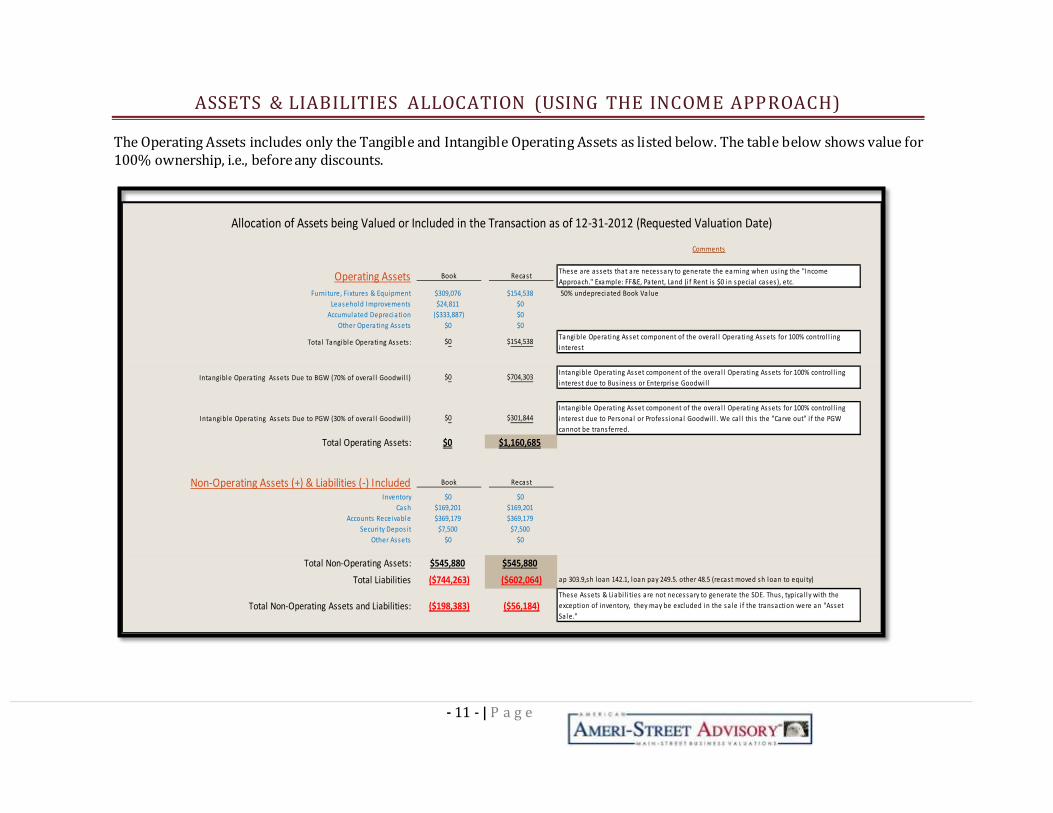
ASSETS & LIABILITIES ALLOCATION (USING THE INCOME APPROACH)
The Operating Assets includes only the Tangible and Intangible Operating Assets as listed below. The table below shows value for 100% ownership, i.e., before any discounts.
Comments
Book RecastThese are assets that are necessary to generate the earning when us ing the "Income
Approach." Example: FF&E, Patent, Land (i f Rent i s $0 in specia l cases), etc.
Furniture, Fixtures & Equipment $309,076 $154,538 50% undepreciated Book Value
Leasehold Improvements $24,811 $0
Accumulated Depreciation ($333,887) $0
Other Operating Assets $0 $0
Total Tangible Operating Assets : $0 $154,538Tangible Operating Asset component of the overa l l Operating Assets for 100% control l ing
interest
Intangible Operating Assets Due to BGW (70% of overa l l Goodwi l l ) $0 $704,303Intangible Operating Asset component of the overa l l Operating Assets for 100% control l ing
interest due to Bus iness or Enterprise Goodwi l l
Intangible Operating Assets Due to PGW (30% of overa l l Goodwi l l ) $0 $301,844Intangible Operating Asset component of the overa l l Operating Assets for 100% control l ing
interest due to Personal or Profess ional Goodwi l l . We ca l l this the "Carve out" i f the PGW
cannot be transferred.
Total Operating Assets: $0 $1,160,685
Book Recast
Inventory $0 $0
Cash $169,201 $169,201
Accounts Receivable $369,179 $369,179
Securi ty Depos it $7,500 $7,500
Other Assets $0 $0
Total Non-Operating Assets: $545,880 $545,880
Total Liabilities ($744,263) ($602,064) ap 303.9,sh loan 142.1, loan pay 249.5. other 48.5 (recast moved sh loan to equity)
Total Non-Operating Assets and Liabilities: ($198,383) ($56,184)These Assets & Liabi l i ties are not necessary to generate the SDE. Thus , typica l ly with the
exception of inventory, they may be excluded in the sa le i f the transaction were an "Asset
Sa le."
Allocation of Assets being Valued or Included in the Transaction as of 12-31-2012 (Requested Valuation Date)
Operating Assets
Non-Operating Assets (+) & Liabilities (-) Included
- 12 - | P a g e
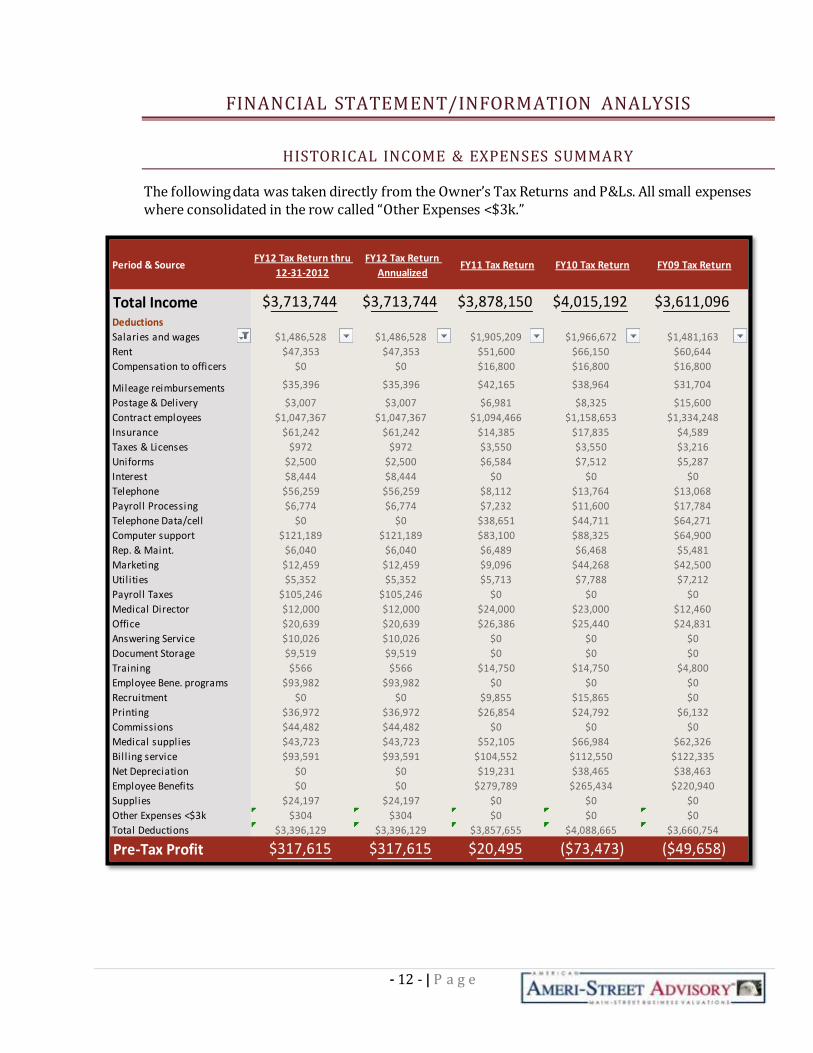
FINANCIAL STATEMENT/INFORMATION ANALYSIS
HISTORICAL INCOME & EXPENSES SUMMARY
The following data was taken directly from the Owner’s Tax Returns and P&Ls. All small expenses where consolidated in the row called “Other Expenses <$3k.”
Period & SourceFY12 Tax Return thru
12-31-2012
FY12 Tax Return
AnnualizedFY11 Tax Return FY10 Tax Return FY09 Tax Return
Total Income $3,713,744 $3,713,744 $3,878,150 $4,015,192 $3,611,096Deductions
Salaries and wages $1,486,528 $1,486,528 $1,905,209 $1,966,672 $1,481,163
Rent $47,353 $47,353 $51,600 $66,150 $60,644
Compensation to officers $0 $0 $16,800 $16,800 $16,800
Mileage reimbursements $35,396 $35,396 $42,165 $38,964 $31,704
Postage & Delivery $3,007 $3,007 $6,981 $8,325 $15,600
Contract employees $1,047,367 $1,047,367 $1,094,466 $1,158,653 $1,334,248
Insurance $61,242 $61,242 $14,385 $17,835 $4,589
Taxes & Licenses $972 $972 $3,550 $3,550 $3,216
Uniforms $2,500 $2,500 $6,584 $7,512 $5,287
Interest $8,444 $8,444 $0 $0 $0
Telephone $56,259 $56,259 $8,112 $13,764 $13,068
Payroll Processing $6,774 $6,774 $7,232 $11,600 $17,784
Telephone Data/cell $0 $0 $38,651 $44,711 $64,271
Computer support $121,189 $121,189 $83,100 $88,325 $64,900
Rep. & Maint. $6,040 $6,040 $6,489 $6,468 $5,481
Marketing $12,459 $12,459 $9,096 $44,268 $42,500
Utilities $5,352 $5,352 $5,713 $7,788 $7,212
Payroll Taxes $105,246 $105,246 $0 $0 $0
Medical Director $12,000 $12,000 $24,000 $23,000 $12,460
Office $20,639 $20,639 $26,386 $25,440 $24,831
Answering Service $10,026 $10,026 $0 $0 $0
Document Storage $9,519 $9,519 $0 $0 $0
Training $566 $566 $14,750 $14,750 $4,800
Employee Bene. programs $93,982 $93,982 $0 $0 $0
Recruitment $0 $0 $9,855 $15,865 $0
Printing $36,972 $36,972 $26,854 $24,792 $6,132
Commissions $44,482 $44,482 $0 $0 $0
Medical supplies $43,723 $43,723 $52,105 $66,984 $62,326
Bill ing service $93,591 $93,591 $104,552 $112,550 $122,335
Net Depreciation $0 $0 $19,231 $38,465 $38,463
Employee Benefits $0 $0 $279,789 $265,434 $220,940
Supplies $24,197 $24,197 $0 $0 $0
Other Expenses <$3k $304 $304 $0 $0 $0
Total Deductions $3,396,129 $3,396,129 $3,857,655 $4,088,665 $3,660,754
Pre-Tax Profit $317,615 $317,615 $20,495 ($73,473) ($49,658)

- 13 - | P a g e
SELLER’S DISCRETIONARY EARNINGS CALCULATION
The income approach using the Seller’s Discretionary Earnings (SDE) is used to value this company. SDE represents the net earnings before interest, income taxes, depreciation and amortization. In addition, it includes all owner perks, discretionary expenses, and elimination of all non-recurring income and expenses. SDE is normalized to only one full-time working owner equivalent (FTE) who works 40 to 50 hours each week. Each of these expenses is “Added-Back” to the Pre-Tax Profit shown above in the Historical Income Summary section in order to calculate the Seller’s Discretionary Earnings, SDE. After all the “Add-backs” are applied, the results are the Recast, Normalized SDE, which are shown at the bottom of the following Table.
What’s more, all normalized income and expenses are shown in the graphs that follow in the Normalized,
Recast, Income & Expenses Graphs section. The graphs provide a high-level, visual perspective of the Company’s historical income and expenses trends from year to year.
Pre-Tax ProfitFY12 Tax Return
thru 12-31-2012FY11 Tax Return FY10 Tax Return FY09 Tax Return Explanation
Unadjusted Pretax Profit $317,615 $20,495 ($73,473) ($49,658)
Add-Backs
Salaries and wages ($30,246) $78,000 $60,776 $66,846Added Back 100% of Fred's and Linda's W2; treat as 1
FTE owner/operator; FY12 ( aslo moved $105,246 from
Other ded)
Interest $8,444 $0 $0 $0 Interest
Net Depreciation $0 $19,231 $38,465 $38,463 Depreciation
Employee Benefits $0 $279,789 $265,434 $220,940 Owner Benefit
Payroll Taxes $105,246 $0 $0 $0 Moved to "Salaries & Wages"
Total Add-Backs $83,444 $377,020 $364,675 $326,249
SDE through 12-31-2012 $401,059
Normalized SDE (Annual) $401,059 $397,515 $291,202 $276,591

- 14 - | P a g e
NORMALIZED, RECAST INCOME & EXPENSE GRAPHS
INCOME GRAPH
Source SDE
FY12 Tax Return 401,059.00$ Lowest SDE= 291,202.00$
FY11 Tax Return 397,515.00$ Avg. SDE= 363,258.67$ wSDE= $363,259
FY10 Tax Return 291,202.00$ H ighest SDE= 401,059.00$ Average= $363,259
Median= $397,515
FY09 Tax Return 276,591.00$ W eighted Avg 365,577.60$
40% FY12 Tax Return Largest % Δ SDE= 36.6% from FY10 Tax Return to FY11 Tax Return
30% FY11 Tax Return Largest % Δ Gross= 11.2% from FY09 Tax Return to FY10 Tax Return
20% FY10 Tax Return Average % Δ SDE= 14.3%
10% FY09 Tax Return Average % Δ Gross= 6.3%
WeightswSDE is weighted and/or projected
SDE for next year based on
historical performance, Seller
feedback, and our opinion.
Weighted SDE NotesOwner's Benefits (SDE):
Net profit
Salary for 1 FTE owner
Interest (debt free)
Depreciation
Amortization
Non-recurring expenses or income
Discretionary expenses
Owner perks
- 15 - | P a g e
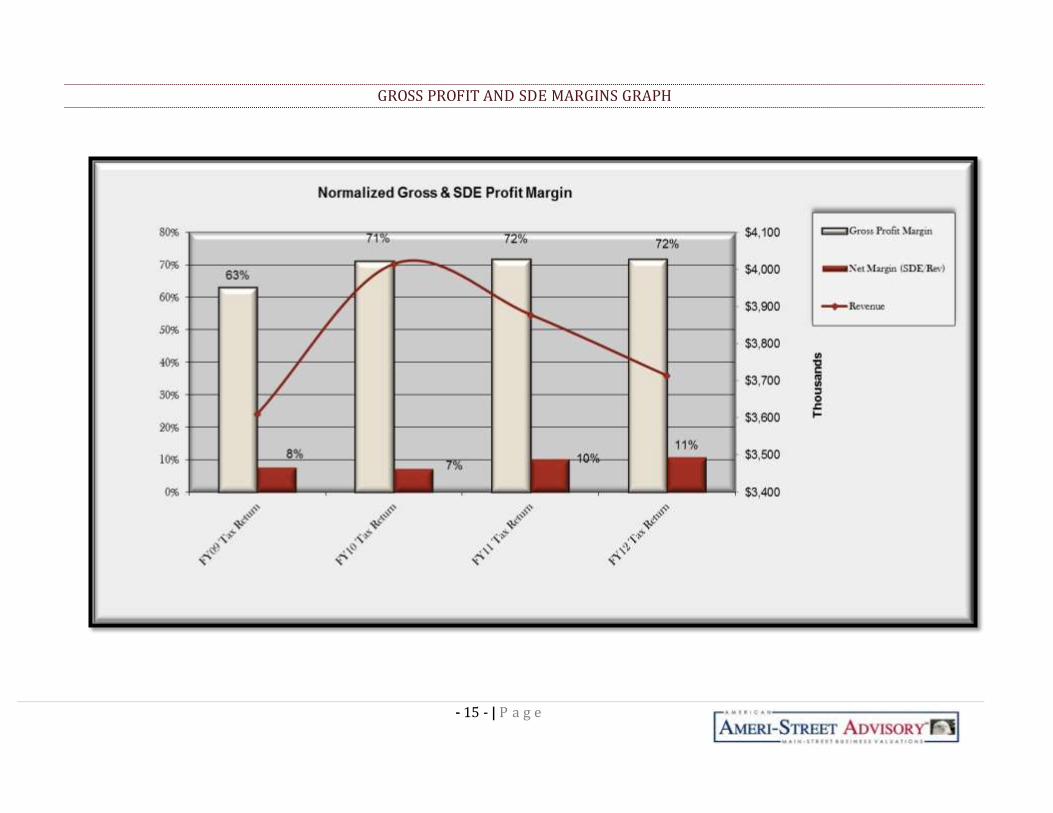
GROSS PROFIT AND SDE MARGINS GRAPH
- 16 - | P a g e
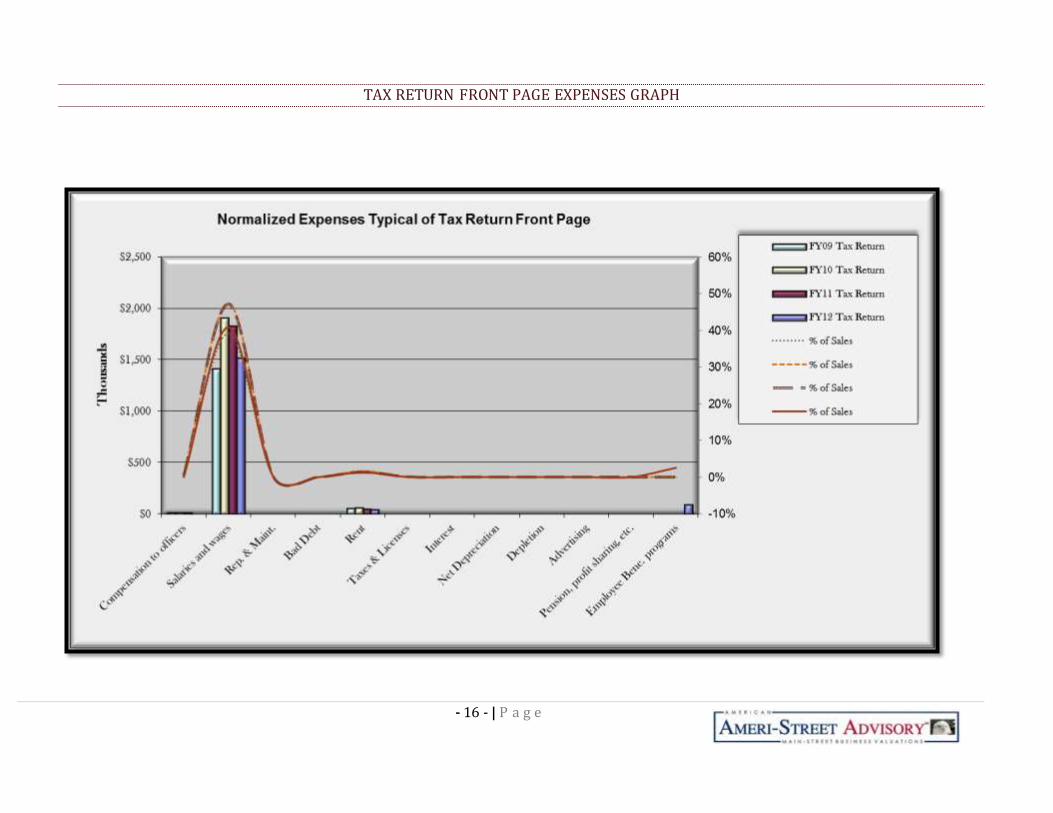
TAX RETURN FRONT PAGE EXPENSES GRAPH

- 17 - | P a g e
TAX RETURN SCHEDULE A GRAPH
-5%
0%
5%
10%
15%
20%
25%
30%
35%
40%
$-
$200
$400
$600
$800
$1,000
$1,200
$1,400
$1,600
Th
ou
san
ds
Normalized Schedule A
Cost of Goods Sold
FY09 Tax Return
FY10 Tax Return
FY11 Tax Return
FY12 Tax Return
% of Sales
% of Sales
% of Sales
% of Sales
- 18 - | P a g e
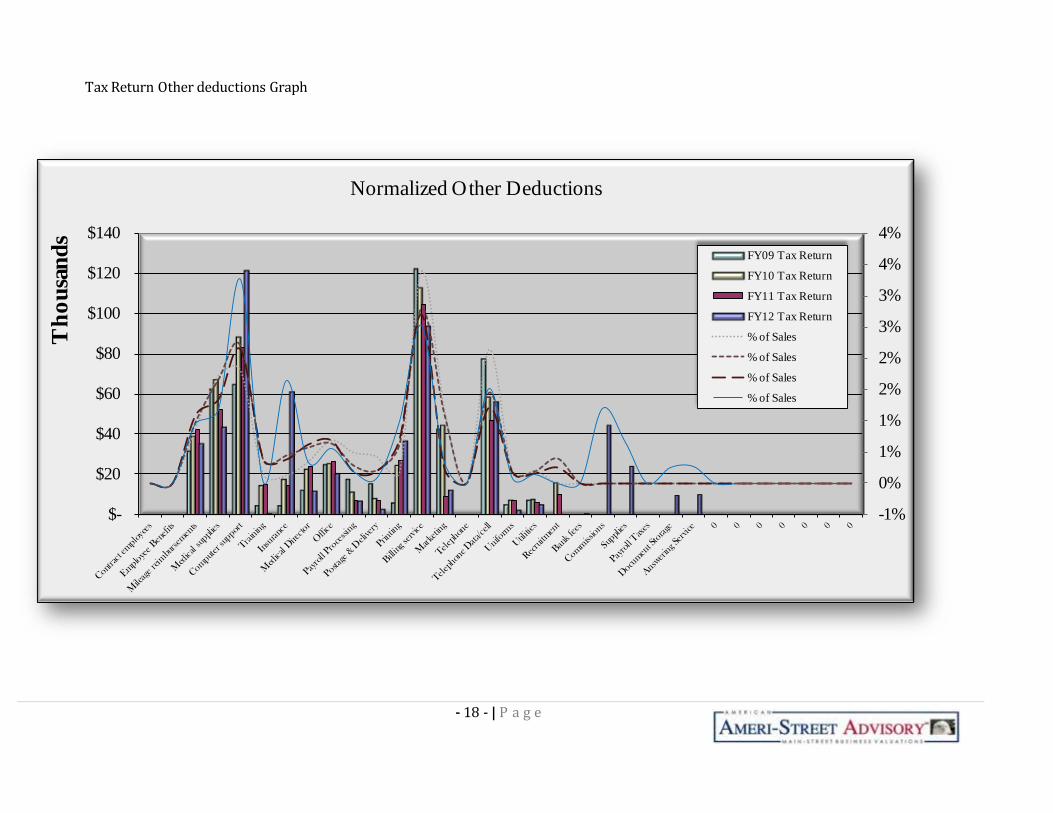
Tax Return Other deductions Graph
-1%
0%
1%
1%
2%
2%
3%
3%
4%
4%
$-
$20
$40
$60
$80
$100
$120
$140
Th
ou
san
ds
Normalized Other Deductions
FY09 Tax Return
FY10 Tax Return
FY11 Tax Return
FY12 Tax Return
% of Sales
% of Sales
% of Sales
% of Sales

- 19 - | P a g e
DETERMINING THE EXPECTED MULTIPLE & CAP RATE
To assess the risk for a business buyer we calculate an expected return on investment that we call
Expected CAP Rate. It is reflective of the return on investment a business Buyer would expect to
achieve if we capitalize the Company's SDE; it is a figure of merit to measure Risk for an investor. The
Expected Cap Rate depends on A) the type of company we are valuing and B) the risks within the
subject Company we are valuing.
Our "build-up" method to calculate the Expected CAP Rate starts by first choosing a Range of SP/SDE
Multiples taken from sales transactions of “similar” companies (“Comps”) to the Subject Company. For
example, if we are valuing a medical practice, then we will use Comps of medical practices that sold in
the past ten years. This is done by using transactional data from actual, similar sold businesses
(Comps) from BizComps database (Note: CAP Rate is the inverse of SP/SDE multiples). Thus, the
"Range" (floor and ceiling) is set by the Comps shown below in List of Comparables (Comps) section.
In our case we chose our comps using the criteria listed below in “The Comparables (Comps)” Section.
For our valuation of the Company, we found 18 records where the lowest SP/SDE Multiple was 1.17
(highest CAP Rate 85%) and Highest SP/SDE Multiple was 4.85 (Lowest CAP Rate 21%).
- 20 - | P a g e
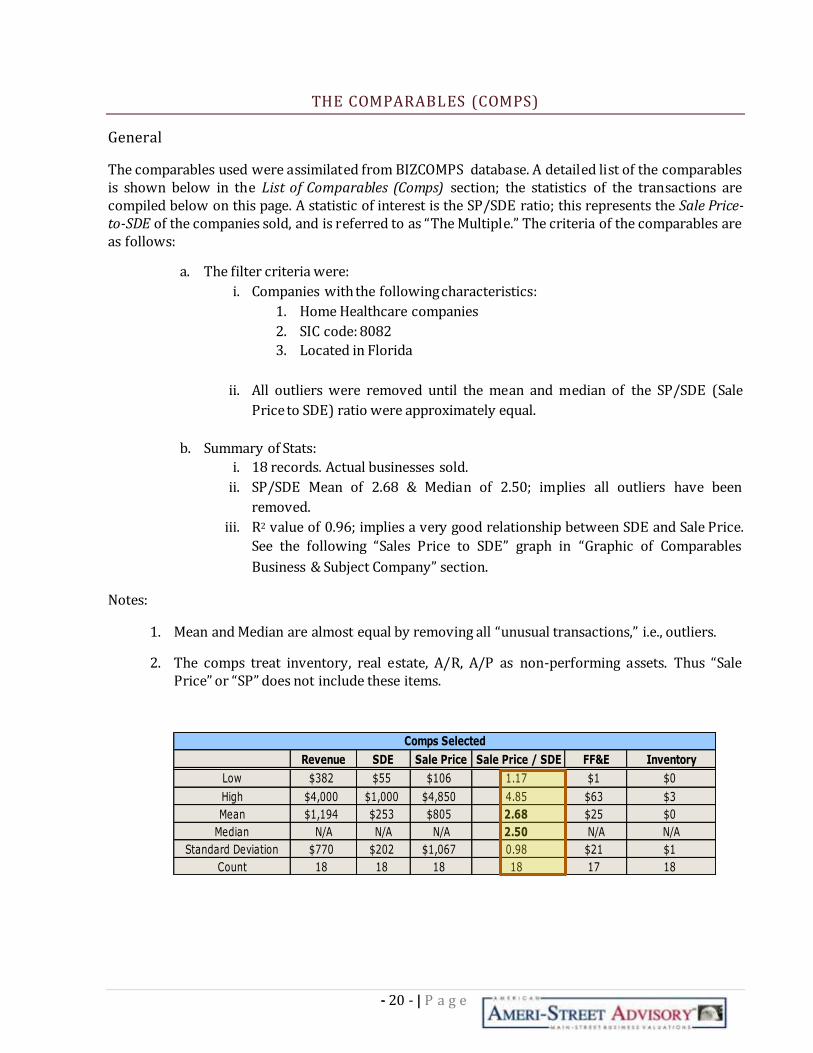
THE COMPARABLES (COMPS)
General
The comparables used were assimilated from BIZCOMPS database. A detailed list of the comparables is shown below in the List of Comparables (Comps) section; the statistics of the transactions are compiled below on this page. A statistic of interest is the SP/SDE ratio; this represents the Sale Price-to-SDE of the companies sold, and is referred to as “The Multiple.” The criteria of the comparables are as follows:
a. The filter criteria were:
i. Companies with the following characteristics:
1. Home Healthcare companies
2. SIC code: 8082
3. Located in Florida
ii. All outliers were removed until the mean and median of the SP/SDE (Sale
Price to SDE) ratio were approximately equal.
b. Summary of Stats:
i. 18 records. Actual businesses sold.
ii. SP/SDE Mean of 2.68 & Median of 2.50; implies all outliers have been
removed.
iii. R2 value of 0.96; implies a very good relationship between SDE and Sale Price.
See the following “Sales Price to SDE” graph in “Graphic of Comparables
Business & Subject Company” section.
Notes:
1. Mean and Median are almost equal by removing all “unusual transactions,” i.e., outliers.
2. The comps treat inventory, real estate, A/R, A/P as non-performing assets. Thus “Sale Price” or “SP” does not include these items.
Revenue SDE Sale Price Sale Price / SDE FF&E Inventory
Low $382 $55 $106 1.17 $1 $0
High $4,000 $1,000 $4,850 4.85 $63 $3
Mean $1,194 $253 $805 2.68 $25 $0
Median N/A N/A N/A 2.50 N/A N/A
Standard Deviation $770 $202 $1,067 0.98 $21 $1
Count 18 18 18 18 17 18
Comps Selected

- 21 - | P a g e
LIST OF COMPARABLES (COMPS)
SIC NAICS Business Description Revenue SDE Inventory FF&E Rent/RevenueFranchise RoyaltyEmployeesAsking Price Price Price / Revenue Price / SDE Down Pmt Terms Days on Mkt Sale Date Location State Census Region Census Division Other Area
8082 621610 Home Health Care 1,514 312 0 35 1.8% No 11 900 900 0.59 2.88 55% 10/16/2009 Florida FL South South Atlantic East
8082 621610 Home Health Care 952 131 0 15 2.0% No 4 300 260 0.27 1.98 81% 398 2/19/2009 Florida FL South South Atlantic East
8082 621610 Home Health Care 1,250 306 0 50 No 4 FT / 40 PT 1,500 1,310 1.05 4.28 23% 5 Yrs @ 7% 45 9/30/2008 Florida FL South South Atlantic East
8082 621610 Home Health Care 1,475 306 0 50 No 13 FT / 25 PT 1,125 935 0.63 3.06 10% 20 Yrs @ 9% 225 9/30/2008 Florida FL South South Atlantic East
8082 621610 Home Health Care 808 243 0 1 2.0% No 1 675 515 0.64 2.12 100% 9/19/2008 Florida FL South South Atlantic East
8082 621610 Home Health Care 1,238 251 0 5 2.9% No 1 FT / 35 PT 595 585 0.47 2.33 100% 627 7/1/2008 Florida FL South South Atlantic East
8082 621610 Home Health Care 382 55 0 10 4.0% Y-5% 37 165 106 0.28 1.93 100% 119 6/26/2008 Florida FL South South Atlantic East
8082 621610 Home Health Care 716 285 0 63 No 7 800 800 1.12 2.81 13% SBA 17 Yrs 120 5/31/2008 Florida FL South South Atlantic East
8082 621610 Home Health Care 925 135 1 20 0.8% No 4 FT / 57 PT 375 360 0.39 2.67 100% 177 4/1/2008 Florida FL South South Atlantic East
8082 621610 Home Health Care 684 168 3 7 1.5% No 2 FT / 30 PT 246 197 0.29 1.17 100% 94 7/3/2006 Florida FL South South Atlantic East
8082 621610 Home Health Care 1,595 253 0 20 No 9 850 800 0.50 3.16 100% 491 12/12/2005 Florida FL South South Atlantic East
8082 621610 Home Health Care 1,064 116 0 20 1.1% No 3 450 350 0.33 3.02 50% 5 Yrs @ 8% 59 6/2/2003 Florida FL South South Atlantic East
8082 621610 Home Health Care 1,147 245 2 No 2 450 420 0.37 1.71 90% 1.5 Yrs @ 7% 136 10/31/2012 Florida FL South South Atlantic East
8082 621610 Home Health Care 1,168 278 0 3 No 7 PT 1,290 1,170 1.00 4.21 4% 12/16/2013 Florida FL South South Atlantic East
8082 621610 Home Health Care 664 105 1 55 9.8% Y-6% 1 FT / 5 PT 275 225 0.34 2.14 16% 9/30/2013 Florida FL South South Atlantic East
8082 621610 Home Health Care 1,017 194 0 5 No 3 350 335 0.33 1.73 100% 150 10/31/2010 Florida FL South South Atlantic East
8082 621610 Home Health Care 900 175 0 10 4.0% Y-5% 35 395 375 0.42 2.14 20% 15 Yrs @ 6% 300 10/31/2010 Tampa, FL FL South South Atlantic East
8082 621610 Home Health Care 4,000 1,000 0 50 1.0% No 22 5,000 4,850 1.21 4.85 100% 305 8/1/2010 Florida FL South South Atlantic East
Subject Business Transaction Location
“Multiple” SDE Sale Price
- 22 - | P a g e
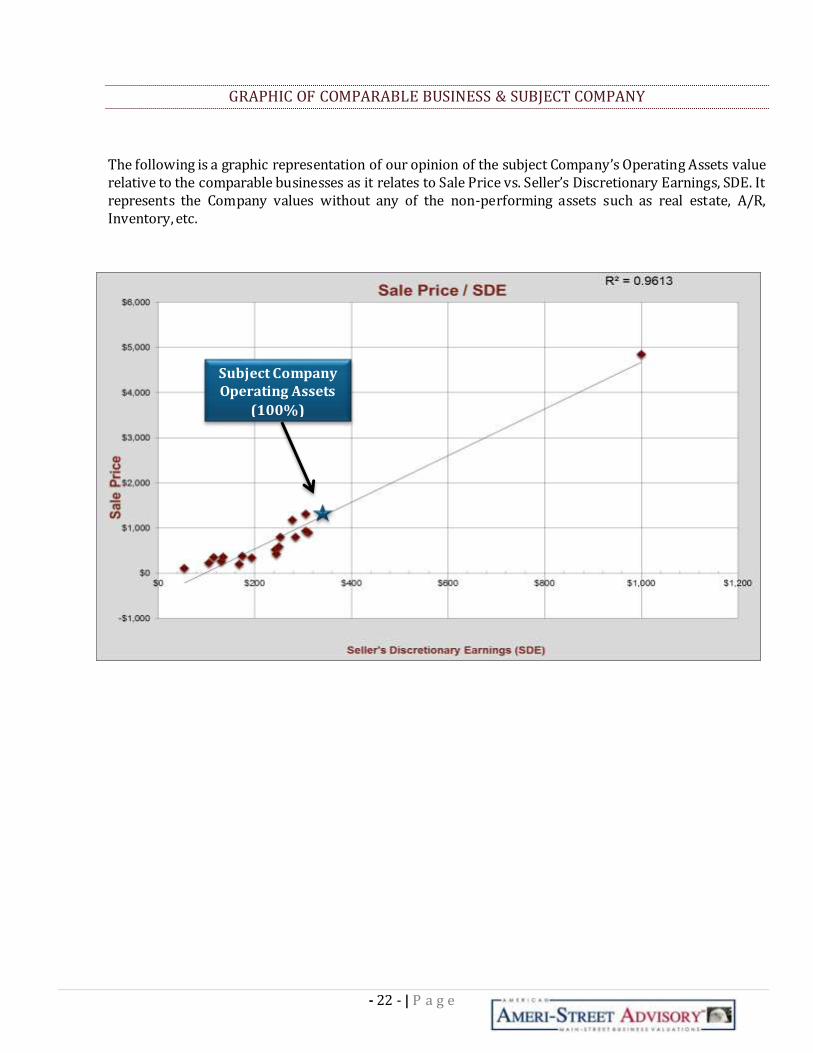
GRAPHIC OF COMPARABLE BUSINESS & SUBJECT COMPANY
The following is a graphic representation of our opinion of the subject Company’s Operating Assets value relative to the comparable businesses as it relates to Sale Price vs. Seller’s Discretionary Earnings, SDE. It represents the Company values without any of the non-performing assets such as real estate, A/R, Inventory, etc.
Subject Company Operating Assets
(100%)
- 23 - | P a g e
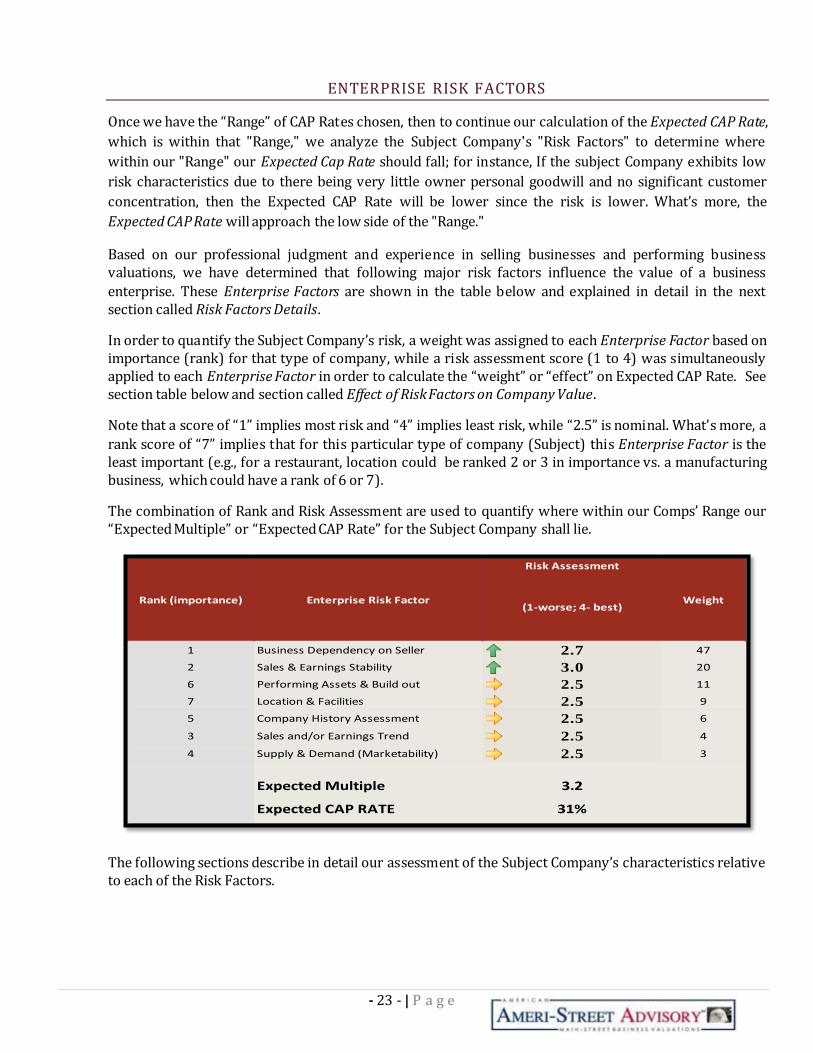
ENTERPRISE RISK FACTORS
Once we have the “Range” of CAP Rates chosen, then to continue our calculation of the Expected CAP Rate,
which is within that "Range," we analyze the Subject Company's "Risk Factors" to determine where
within our "Range" our Expected Cap Rate should fall; for instance, If the subject Company exhibits low
risk characteristics due to there being very little owner personal goodwill and no significant customer
concentration, then the Expected CAP Rate will be lower since the risk is lower. What’s more, the
Expected CAP Rate will approach the low side of the "Range."
Based on our professional judgment and experience in selling businesses and performing business valuations, we have determined that following major risk factors influence the value of a business
enterprise. These Enterprise Factors are shown in the table below and explained in detail in the next section called Risk Factors Details.
In order to quantify the Subject Company’s risk, a weight was assigned to each Enterprise Factor based on importance (rank) for that type of company, while a risk assessment score (1 to 4) was simultaneously applied to each Enterprise Factor in order to calculate the “weight” or “effect” on Expected CAP Rate. See section table below and section called Effect of Risk Factors on Company Value.
Note that a score of “1” implies most risk and “4” implies least risk, while “2.5” is nominal. What’s more, a
rank score of “7” implies that for this particular type of company (Subject) this Enterprise Factor is the least important (e.g., for a restaurant, location could be ranked 2 or 3 in importance vs. a manufacturing business, which could have a rank of 6 or 7).
The combination of Rank and Risk Assessment are used to quantify where within our Comps’ Range our “Expected Multiple” or “Expected CAP Rate” for the Subject Company shall lie.
The following sections describe in detail our assessment of the Subject Company’s characteristics relative to each of the Risk Factors.
Risk Assessment
(1-worse; 4- best)
1 Business Dependency on Seller 2.7 47
2 Sales & Earnings Stability 3.0 20
6 Performing Assets & Build out 2.5 11
7 Location & Facilities 2.5 9
5 Company History Assessment 2.5 6
3 Sales and/or Earnings Trend 2.5 4
4 Supply & Demand (Marketability) 2.5 3
Expected Multiple 3.2
Expected CAP RATE 31%
Rank (importance) Enterprise Risk Factor Weight
- 24 - | P a g e
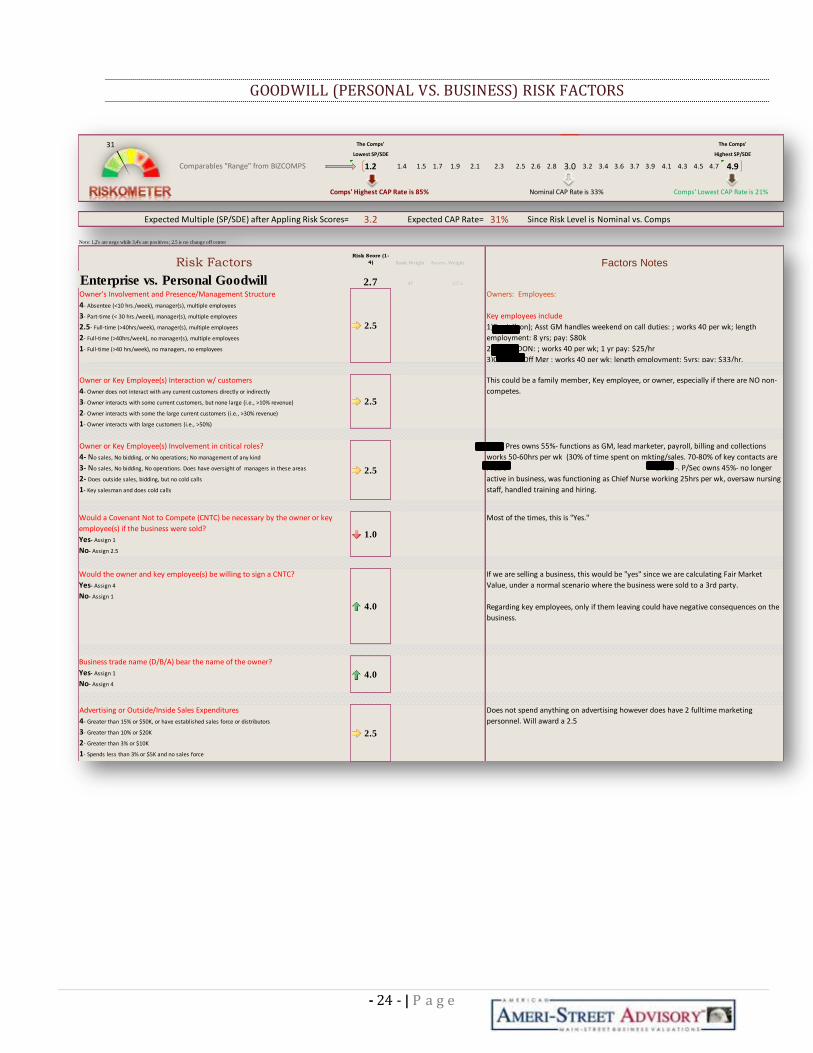
GOODWILL (PERSONAL VS. BUSINESS) RISK FACTORS
The Comps' The Comps'
Lowest SP/SDE Highest SP/SDE
Comparables "Range" from BIZCOMPS 1.2 1.4 1.5 1.7 1.9 2.1 2.3 2.5 2.6 2.8 3.0 3.2 3.4 3.6 3.7 3.9 4.1 4.3 4.5 4.7 4.9 1 1.2 1.3 1.5 1.6 1.8 1.9 2.1 2.2 2.4 2.5 2.7 2.8 3.0 3.1 3.3 3.4 3.6 3.7 3.9 4
Expected Multiple (SP/SDE) after Appling Risk Scores= 3.2 31%
Note: 1,2's are negs while 3,4's are positives; 2.5 is no change off center
Risk FactorsRisk Score (1-
4)
Enterprise vs. Personal Goodwill 2.7Owner's Involvement and Presence/Management Structure
4- Absentee (<10 hrs./week), manager(s), multiple employees
3- Part-time (< 30 hrs./week), manager(s), multiple employees
2.5- Full-time (>40hrs/week), manager(s), multiple employees
2- Full-time (>40hrs/week), no manager(s), multiple employees
1- Full-time (>40 hrs/week), no managers, no employees
2.5
Owner or Key Employee(s) Interaction w/ customers
4- Owner does not interact with any current customers directly or indirectly
3- Owner interacts with some current customers, but none large (i.e., >10% revenue)
2- Owner interacts with some the large current customers (i.e., >30% revenue)
1- Owner interacts with large customers (i.e., >50%)
2.5
Owner or Key Employee(s) Involvement in critical roles?
4- No sales, No bidding, or No operations; No management of any kind
3- No sales, No bidding, No operations. Does have oversight of managers in these areas
2- Does outside sales, bidding, but no cold calls
1- Key salesman and does cold calls
2.5
Would a Covenant Not to Compete (CNTC) be necessary by the owner or key
employee(s) if the business were sold?
Yes- Assign 1
No- Assign 2.5
1.0
Would the owner and key employee(s) be willing to sign a CNTC?
Yes- Assign 4
No- Assign 1
4.0
Business trade name (D/B/A) bear the name of the owner?
Yes- Assign 1
No- Assign 4
4.0
Advertising or Outside/Inside Sales Expenditures
4- Greater than 15% or $50K, or have established sales force or distributors
3- Greater than 10% or $20K
2- Greater than 3% or $10K
1- Spends less than 3% or $5K and no sales force
2.5
Nominal CAP Rate is 33%
Expected CAP Rate= Since Risk Level is
Assess. Weight
127.6
Rank Weight Factors Notes
Owners: Employees:
Key employees include
1)Daniel(son); Asst GM handles weekend on call duties: ; works 40 per wk; length
employment: 8 yrs; pay: $80k
2) Zaida; DON: ; works 40 per wk; 1 yr pay: $25/hr
3)Carmen; Off Mgr ; works 40 per wk; length employment: 5yrs; pay: $33/hr.
Fred- Pres owns 55%- functions as GM, lead marketer, payroll, billing and collections
works 50-60hrs per wk (30% of time spent on mkting/sales. 70-80% of key contacts are
Fred's Linda -. P/Sec owns 45%- no longer
active in business, was functioning as Chief Nurse working 25hrs per wk, oversaw nursing
staff, handled training and hiring.
Does not spend anything on advertising however does have 2 fulltime marketing
personnel. Will award a 2.5
This could be a family member, Key employee, or owner, especially if there are NO non-
competes.
Most of the times, this is "Yes."
If we are selling a business, this would be "yes" since we are calculating Fair Market
Value, under a normal scenario where the business were sold to a 3rd party.
Regarding key employees, only if them leaving could have negative consequences on the
business.
47
Nominal vs. Comps
Comps' Highest CAP Rate is 85% Comps' Lowest CAP Rate is 21%
31
- 25 - | P a g e
SALES STABILITY RISK FACTORS
2 Sales & Earnings Stability 3.0Number of unique, unrelated customers annually?
4- Thousands
3- Hundreds
2- Tens
1- Less than 19
2.5
Note: Pick Comps first; then make all "common denominators" equal to 2.5
Customer/Supplier/Sales Person Concentration
4- Virtually no concentration
3- Some Concentration
2- Moderate Concentration
1- High Concentration
2.5
How much of the revenue is recurring?
4- At least 50%
3- At least 25%
2- less than 10%
1- None
2.5
How many years have sales or earnings been within +/- 15%?
4- Four Years
3- Three Years
2- Two Years
1- Not in past 4 years
4.0
The Company's dividend or growth capacity (per IRS RR 59-60)
4- Company has had the capacity for 4 of the past 4 years AND Trending UP
3- Company has had the capacity for 3 of the past 4 years AND Trending UP
2- Company has had the capacity for 2 of the past 4 years OR downward trend
1- Company has not had the capacity in the past 4 years OR Significant downward trend
4.0
Market Stability
4- Very stable & expect no long-term slowdown
3- Very stable now, but not sure in long-term
2- Unsure based on current economic indications
1- Unsure based on current economy
2.5
Weights
(1-7)
This is the amount of funds (net income) remaining to meet all demands in support of
future growth (e.g., working capital, capital expenditures). The measure known as "net
cash flow to equity" is often considered a proxy for "dividend paying capacity" in regards
to RR 59-60 as it represents the cash flow available to equity holders, i.e., potential
dividends.
Market appears to be stable however as Carecentrics continues to expand its
marketshare of insurance administration business there could be a negative impact on
the subject business. For this reason we believe a 2.5 is justified.
See sales & Earnings Graph; 2009 through 2012.
60.020
N/A since we are using same comp
N/A since we are using same comps….. Mostly recurring, but since the Comps are
wholesalers and distributors, a 2.5 shall be awarded.
Thousands of end user clients however business is generated through relationships with
referral sources and insurance companies. These probably number less than 100.
- 26 - | P a g e
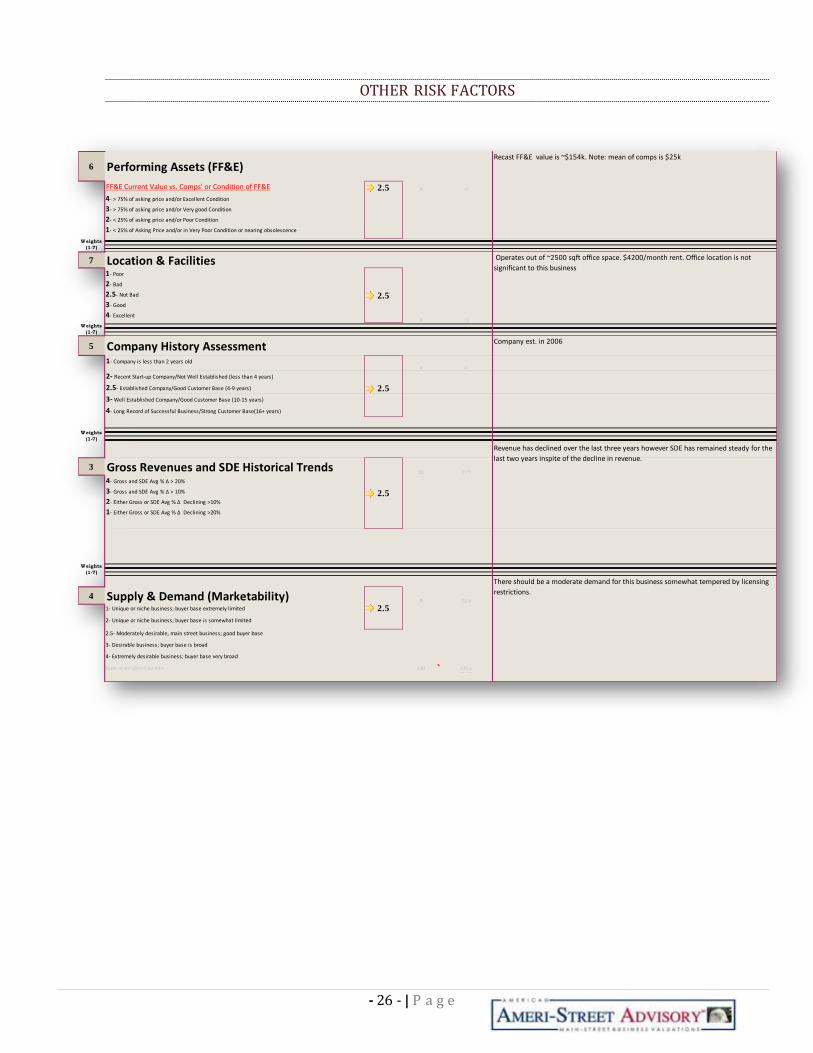
OTHER RISK FACTORS
6 Performing Assets (FF&E)
FF&E Current Value vs. Comps' or Condition of FF&E 2.5
4- > 75% of asking price and/or Excellent Condition
3- > 75% of asking price and/or Very good Condition
2- < 25% of asking price and/or Poor Condition
1- < 25% of Asking Price and/or in Very Poor Condition or nearing obsolescence
Weights
(1-7)
7 Location & Facilities
1- Poor
2- Bad
2.5- Not Bad
3- Good
4- Excellent
2.5
Weights
(1-7)
5 Company History Assessment
1- Company is less than 2 years old
2- Recent Start-up Company/Not Well Established (less than 4 years)
2.5- Established Company/Good Customer Base (4-9 years)
3- Well Established Company/Good Customer Base (10-15 years)
4- Long Record of Successful Business/Strong Customer Base(16+ years)
Weights
(1-7)
3 Gross Revenues and SDE Historical Trends4- Gross and SDE Avg % Δ > 20%
3- Gross and SDE Avg % Δ > 10%
2- Either Gross or SDE Avg % Δ Declining >10%
1- Either Gross or SDE Avg % Δ Declining >20%
Weights
(1-7)
4 Supply & Demand (Marketability)1- Unique or niche business; buyer base extremely limited
2- Unique or niche business; buyer base is somewhat limited
2.5- Moderately desirable, main street business; good buyer base
3- Desirable business; buyer base is broad
4- Extremely desirable business; buyer base very broad
Sum of weighted factors
Medium Business Factor (Weighted)
Company est. in 2006
10
2.5
2.5
100
15
27.5
9
2.5
7.5
11
22.5
270.12.701
Recast FF&E value is ~$154k. Note: mean of comps is $25k
Operates out of ~2500 sqft office space. $4200/month rent. Office location is not
significant to this business
Revenue has declined over the last three years however SDE has remained steady for the
last two years inspite of the decline in revenue.
There should be a moderate demand for this business somewhat tempered by licensing
restrictions.
4
6
3
- 27 - | P a g e
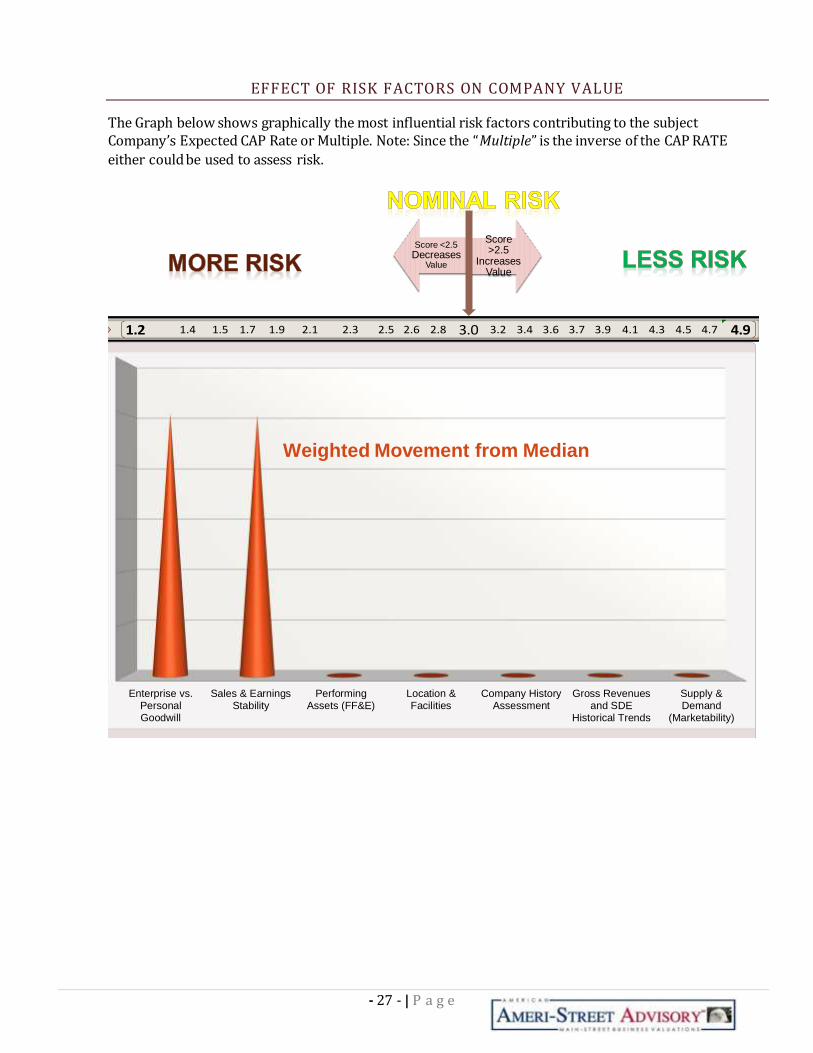
EFFECT OF RISK FACTORS ON COMPANY VALUE
The Graph below shows graphically the most influential risk factors contributing to the subject Company’s Expected CAP Rate or Multiple. Note: Since the “Multiple” is the inverse of the CAP RATE
either could be used to assess risk.
Enterprise vs.PersonalGoodwill
Sales & EarningsStability
PerformingAssets (FF&E)
Location &Facilities
Company HistoryAssessment
Gross Revenuesand SDE
Historical Trends
Supply &Demand
(Marketability)
Weighted Movement from Median
Score <2.5
DecreasesValue
Score >2.5
Increases Value
1.2 1.4 1.5 1.7 1.9 2.1 2.3 2.5 2.6 2.8 3.0 3.2 3.4 3.6 3.7 3.9 4.1 4.3 4.5 4.7 4.9

- 28 - | P a g e
RECONCILIATION OF CONCLUSION OF VALUE (SANITY CHECK)
To best reconcile our conclusion of value against reality, we shall consider some of the typical calculations
that may be performed by hypothetical Buyers and Lenders in an actual business acquisition.
The two most common scenarios for a business acquisition are the following:
1. An unleveraged acquisition; this is where a Buyer buys the business without financing.
2. A leveraged acquisition; this is where a Buyer would secure financing from a third party lender or
through the Seller via a Seller-Held Note.
Thus in order to reconcile our business valuation against these two real-life circumstances, the following
“pressure points” are analyzed, namely- Historical Capitalized Earnings, Historical Net Margins, Before-
Tax Cash Flow using historical SDE, and Debt Service Ratios a lender would consider. In addition,
Personal Goodwill and Customer Concentration also could become very influential.
Regardless of the valuation, it is these “pressure points” that directly impact a Buyer and Lender’s final
decision.
For the Subject Company, the most significant pressure points appear to be:
1. The owner is the “face of the business,” and has 70-80% of key referral source relationships.
2. CAP RATE in 2010.
3. Margins from 2009 through 2012, particularly 2010 at 7%.
See more details below.

- 29 - | P a g e
CAPITALIZED EARNINGS
With any investment of any kind, investors will base their decisions whether to invest, and how much to
invest, on the risk level and their personal involvement necessary to manage that investment. For
instance, if an investor has $1 Million to invest, but she does not want work and wants to assume minimal
risk, then a CD or Bond may be the best investment, but the ROI will be very low, probably 2% or 3%. If,
however, the investor would like a better return on her $1 Million as she is willing to assume a more risk
and be more involved (but not 40 to 50 hours per week), she may consider buying investment property,
where she could expect 6% to 12% ROI, i.e., CAP Rate. Finally, if the investor expects an even higher ROI,
she may consider buying a business, where the risk is much higher, as would be her required
involvement in the management of the “investment.” This is where the “Expected CAP Rate” comes in; it is
the ROI that is “expected” for the high level of risk and involvement inherent to businesses. What’s more,
since the risk is so much higher than a CD, bond, or investment property, the “Expected CAP Rate” is
much higher, e.g., 20% to 200%, depending on the type of company and internal risks within the
Company.
Below we compare the historical Subject Company’s performance against our Expected CAP Rate.
Notes:
1. At the Subject Company’s Operating Assets value of $1,160,685 the 2010 CAP Rate drops to 25%
still above the low end of our Comps’ range of 21%.
- 30 - | P a g e
NET MARGINS
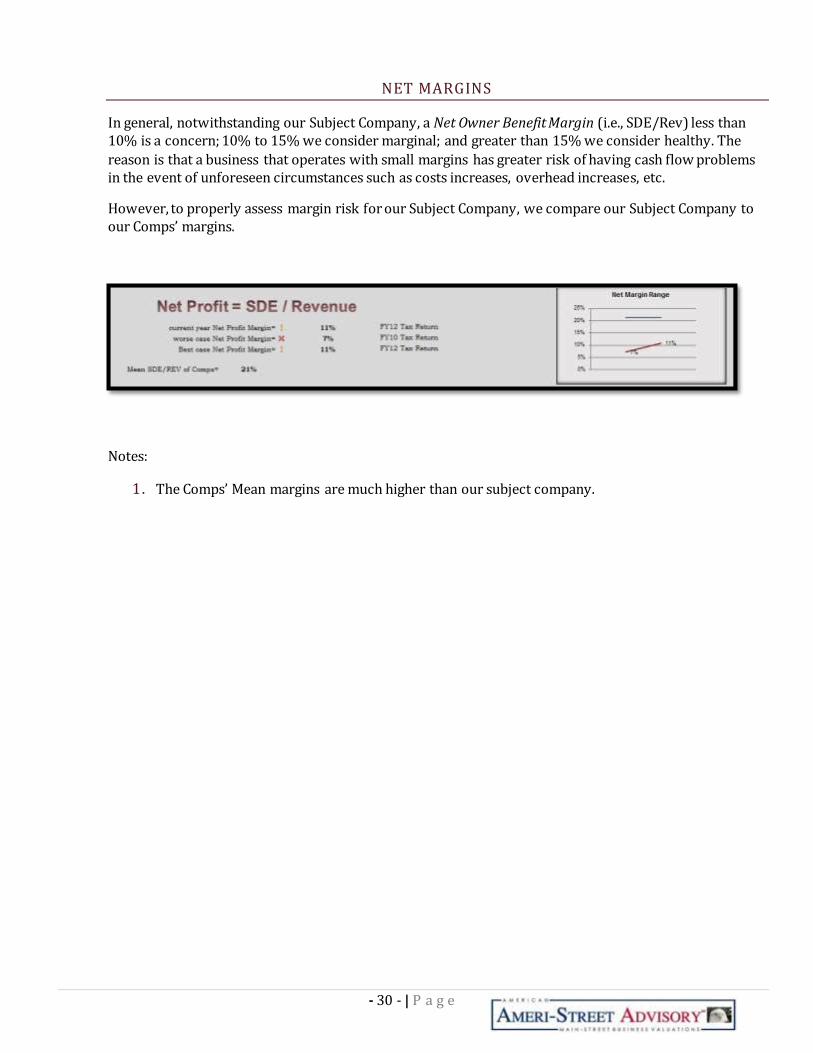
In general, notwithstanding our Subject Company, a Net Owner Benefit Margin (i.e., SDE/Rev) less than 10% is a concern; 10% to 15% we consider marginal; and greater than 15% we consider healthy. The
reason is that a business that operates with small margins has greater risk of having cash flow problems in the event of unforeseen circumstances such as costs increases, overhead increases, etc.
However, to properly assess margin risk for our Subject Company, we compare our Subject Company to our Comps’ margins.
Notes:
1. The Comps’ Mean margins are much higher than our subject company.
- 31 - | P a g e
BEFORE-TAX-CASH FLOW
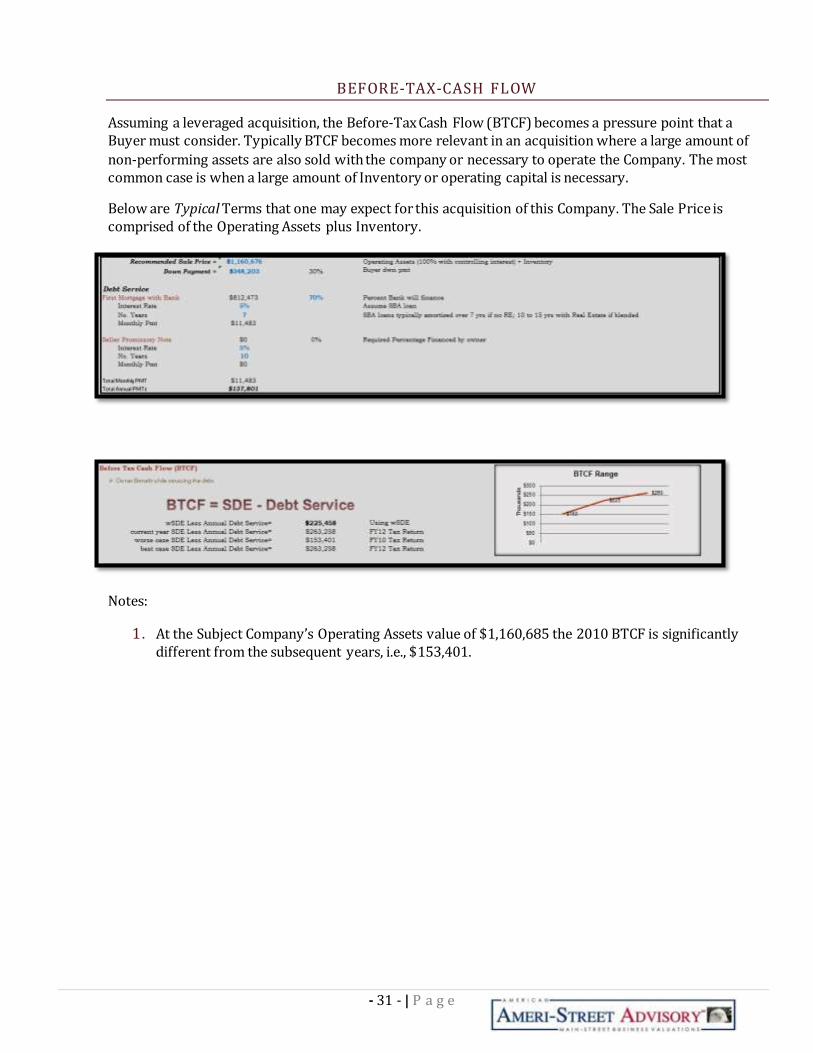
Assuming a leveraged acquisition, the Before-Tax Cash Flow (BTCF) becomes a pressure point that a Buyer must consider. Typically BTCF becomes more relevant in an acquisition where a large amount of
non-performing assets are also sold with the company or necessary to operate the Company. The most common case is when a large amount of Inventory or operating capital is necessary.
Below are Typical Terms that one may expect for this acquisition of this Company. The Sale Price is comprised of the Operating Assets plus Inventory.
Notes:
1. At the Subject Company’s Operating Assets value of $1,160,685 the 2010 BTCF is significantly different from the subsequent years, i.e., $153,401.
- 32 - | P a g e
DEBT-SERVICE RATIOS
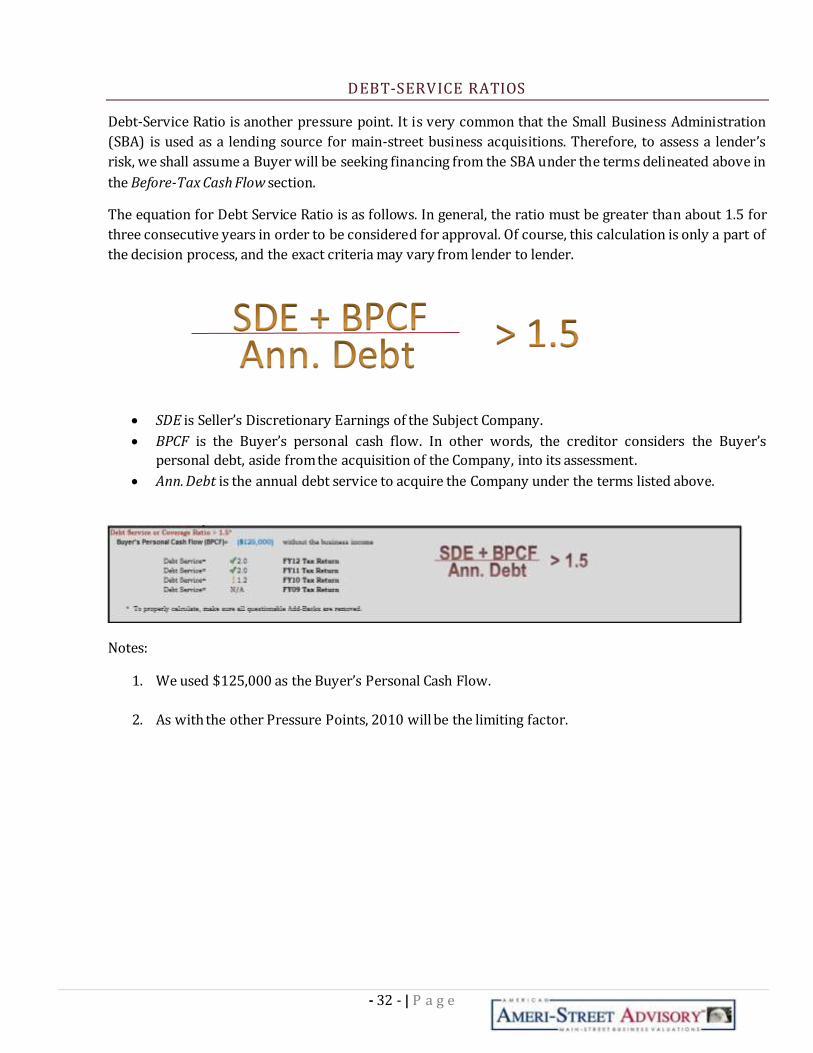
Debt-Service Ratio is another pressure point. It is very common that the Small Business Administration
(SBA) is used as a lending source for main-street business acquisitions. Therefore, to assess a lender’s
risk, we shall assume a Buyer will be seeking financing from the SBA under the terms delineated above in
the Before-Tax Cash Flow section.
The equation for Debt Service Ratio is as follows. In general, the ratio must be greater than about 1.5 for
three consecutive years in order to be considered for approval. Of course, this calculation is only a part of
the decision process, and the exact criteria may vary from lender to lender.
SDE is Seller’s Discretionary Earnings of the Subject Company.
BPCF is the Buyer’s personal cash flow. In other words, the creditor considers the Buyer’s
personal debt, aside from the acquisition of the Company, into its assessment.
Ann. Debt is the annual debt service to acquire the Company under the terms listed above.
Notes:
1. We used $125,000 as the Buyer’s Personal Cash Flow.
2. As with the other Pressure Points, 2010 will be the limiting factor.

- 33 - | P a g e
FIRM PROFILE
OUR MISSION
Ameri-Street Advisory SM (ASA) was founded to serve a specific market. Our mission is to provide affordable, comprehensive, AICPA compliant business valuations for small, privately held, American main-street businesses.
The fact is that most companies that provide business valuations:
Are too expensive. Most valuation costs exceed $5,000.
ASA’s fees are a fraction of the cost. We can make our services affordable by using our proprietary, internally developed tools and by maintaining control of our overhead expenses.
Do not have practical experience in selling companies; thus do not have the true
wherewithal and experience to assess “Fair Market Value” as it relates to main-street businesses. ASA was founded by experienced M&A and business intermediaries with extensive
practical experience in actually selling and operating companies. When calculating fair market value, our analysts utilize their practical experiences in order to more accurately assess risk and hence properly capitalize the business earnings.
Only use templates and generic reports which are not completely applicable to small
companies.
ASA’s deliverable is 100% in compliance with the American Institute of Certified
Public Accounts (AICPA) Statement on Standards for Valuation Services (SSVS).
Because ASA was founded by business intermediaries with real-life experiences and strong financial backgrounds, we have the ability to accurately quantify real-life business characteristics in order to properly assess risk and hence value.

- 34 - | P a g e
ANALYST & PRINCIPAL PROFILES
FRANCESCO URSO, PRINCIPAL
Franc is a certified public accountant in Florida with over 20 years of experience in business consulting and operations and buying and selling businesses. Franc began his business career when he co-founded a real estate investment group that purchased, managed and sold commercial real estate and retail property. Franc has a Master’s Degree from the University of Florida in Accounting and a Bachelor’s Degree in Accounting and Engineering from the University of South Florida.
After graduating from University of Florida, Franc joined the Tampa office of Price Waterhouse where he serviced clients in the manufacturing, real estate, retail and financial services industries. His clients included both large and small companies like Thrucomm, Lykes Brothers, Walter Industries, World Access, Nobility Homes, Sun Hydraulics, Pinnacle Towers, Prudential Florida Realty, Bay Transportation, Lehigh Acres, Celotex, Health Plan Services, Harvard Industries and Disney. His primary responsibilities included auditing his client's books and records and performing due diligence for acquisitions. Franc was also involved in the IPO of Sun Hydraulics.
Franc became Controller for Thrucomm, Inc., an early-stage high-growth telecommunications company, located in St. Petersburg, Florida. While at Thrucomm, Franc was successful in raising $6.5 million in bridge financing and $5 million in leasing financing; completed a private placement of $15 million in Senior Preferred Stock; and raised $70 million in capital from private equities market. Franc was also responsible for day-to-day activities of the accounting department and completing special projects for the executive team.
Franc then joined Gulf Atlantic Capital, an investment banking firm, located in Tampa, Florida, where he helped clients sell their middle market companies. While at Gulf Atlantic, Franc was integral in selling the following businesses:
$45 million wallboard manufacturer, located in Birmingham, Alabama
$6 million apparel machinery manufacturer, located in Atlanta, Georgia
$100 million auto parts distributor, located in Dallas, Texas and Tampa, Florida
$50 million 50-chain restaurant franchisee, located in Scottsdale, Arizona
$15 million specialty wire manufacturer, located in New York, New York
$80 million go-cart manufacturer, located in Ft. Wayne, Indiana

- 35 - | P a g e
SALVATORE B. URSO, PRINCIPAL
Salvatore Urso founded Ameri-Street Advisory (ASA) in 2010. ASA is a spin-off of Florida Business Acquisitions, a business brokerage firm in Tampa, FL
established in 2006. See FloridaBizAcq.com.
He, along with his brother Francesco Urso, CPA, developed a proprietary methodology that incorporates key, standard valuation techniques and fundamental concepts that are commonly used by valuation experts and M&A firms to sell and value companies. The system incorporates mathematical
calculations that are used to quantify real-life characteristics into the “build-up” of the risk model and Fair Market Value of main-street businesses.
Over the past eight years, Mr. Urso has personally interviewed over 600 business owners, performed over 300 business valuations, and sold over 40 companies; he has over 20 years of experience in business, sales, and marketing, which has rendered him very adept and effective at selling and valuating companies.
While obtaining practical experience in the sale of businesses, local attorneys and business owners began employing Mr. Urso to provide business valuations for various uses- namely, bankruptcy, divorce, partner disputes, business mergers and acquisitions. CPAs, lenders, and attorneys often refer their clients to Mr. Urso and his firm. Recently, Mr. Urso has been called upon to testify as an expert witness in divorce and bankruptcy cases.
Aside from Ameri-Street Advisory and Florida Business Acquisitions, Mr. Urso co-founded two family businesses and is a managing member in the Tampa based Comfort Keepers home health agency. He has personally started, bought, managed and sold investment properties and businesses for two decades. His fundamental recipe is to combine integrity, honesty, experience and attention to detail, so all sides experience a win-win business transaction.

- 36 - | P a g e
WILLIAM BURNHAM, PRINCIPAL
Bill Burnham is a lifelong resident of the Tampa Bay area. He is a graduate of the University of South Florida where he majored in Accounting. He obtained his
MBA from The Florida Institute of Technology in 1983. Bill has 25 years of experience working with Fortune 500 companies, nearly twenty of those years in management positions. During that time he managed over 200 employees and spent time in accounting, finance, manufacturing, production control and strategic planning. He managed government contract budgets in excess of 50
million dollars and operating budgets of more than 25 million dollars. He prepared analysis for potential acquisitions, proposals for government contracts and conducted companywide training programs on several different topics. Bill’s experience includes successfully integrating the manufacturing operations of acquired companies into existing operations on two separate occasions. He also led the implementation of a new MRP system which was completed six months ahead of schedule. Complementing his large company background, Bill also has many years of experience as a small business owner. In his own business Bill tripled his sales, achieved twenty percent profit margins and retained ninety eight percent of his customers in his first four years in business. Bill combines this diverse background of experience with a passion for small businesses and an overarching commitment to honesty to make him uniquely qualified as an associate with Ameri-Street Advisory.
CHRISTOPHER HENDERSON, PRINCIPAL
Chris graduated from the University of Georgia with an MS in artificial intelligence and a BS in computer science. He has lived in the Orlando area since 1997. He has more than fifteen years of business experience including large-scale project management, budgeting, financial analysis, staffing, business acquisition, customer relationship management, and technical oversight. He has also owned and managed personal real estate investments for over 15 years. After working for years in a large corporate environment with companies such
as Lockheed Martin, TRW, Northrop Grumman, Boeing, and SAIC, he founded his own company, which was consistently one of the top performers of its type nationally. Organized from the outset for eventual sale, this business sold within weeks for full asking price.
While selling his own company, Chris became fascinated by the workings of the business brokerage industry and realized it would be a good fit for his analytical, organizational, and communication skills. He was recruited to join the firm not only for these professional skills, but also because of his integrity and personal attributes.
- 37 - | P a g e
STATEMENT OF ASSUMPTIONS & LIMITING CONDITIONS
1. The conclusion of value arrived at herein is valid only for the stated purpose as of the date of the valuation.
2. Financial statements and other related information provided by the Subject Company or its representatives, in the course of this engagement, have been accepted without any verification as fully and correctly reflecting the enterprise’s business conditions and operating results for the respective periods, except as specifically noted herein. our Firm has not audited, reviewed, or compiled the financial information provided to us and, accordingly; we express no audit opinion or any other form of assurance on this information.
3. Public information and industry and statistical information have been obtained from sources
we believe to be reliable. However, we make no representation as to the accuracy or completeness of such information and have performed no procedures to corroborate the information.
4. We do not provide assurance on the achievability of the results forecasted by the Subject Company because events and circumstances frequently do not occur as expected; differences between actual and expected results may be material; and achievement of the forecasted results is dependent on actions, plans, and assumptions of management.
5. The conclusion of value arrived at herein is based on the assumption that the current level of management expertise and effectiveness would continue to be maintained, and that the character and integrity of the enterprise through any sale, reorganization, exchange, or diminution of the owners’ participation would not be materially- or significantly changed.
6. This report and the conclusion of value arrived at herein are for the exclusive use of our client for the sole and specific purposes as noted herein- They may not be used for any other purpose or by any other party for any purpose. Furthermore the report and conclusion of value are not intended by the author and should not be construed by the reader to be investment advice in any manner whatsoever. The conclusion of value represents the considered opinion of our Firm, based on information furnished to them by the Subject Company and other sources.
7. Neither all nor any part of the contents of this report especially the conclusion of value: the identity of any valuation specialist(s), or the firm with which such valuation specialists are connected or any reference to any of their professional designations) should be disseminated to the public through advertising, media, public relations, news media, sales media, mail, direct transmittal, or any other means of communication without the prior written consent and approval of our Firm.
8. Future services regarding the subject matter of this report, including, but not limited to testimony or attendance in court, shall not be required of our Firm unless previous
arrangements have been made in writing.
9. Our Firm is not an environmental consultant or auditor, and it takes no responsibility for any actual or potential environmental liabilities. Any person entitled to rely on this report, wishing to know whether such liabilities exist, or the scope and their effect on the value of the property, is encouraged to obtain a professional environmental assessment. Our Firm does not conduct or provide environmental assessments and has not performed one for the subject property.
- 38 - | P a g e
10. Our Firm has not determined independently whether the Subject Company is subject to any present or future liability relating to environmental matters (including, but not limited to CERCLA/Superfund liability) nor the scope of any such liabilities. our Firm’s valuation takes no
such liabilities into account, except as they have been reported to our Firm by the Subject Company or by an environmental consultant working for the Subject Company, and then only to the extent that the liability was reported to us in an actual or estimated dollar amount. Such matters, if any, are noted in the report. To the extent such information has been reported to us, our Firm has relied on it without verification and offers no warranty or representation as to its accuracy or completeness.
11. Our Firm has not made a specific compliance survey or analysis of the subject property to determine whether it is subject to, or in compliance with, the American Disabilities Act of 1990, and this valuation does not consider the effect if any, of noncompliance.
12. The conclusion of value (or the calculated value) in this report deviates from the Statement on Standards for Valuation Services as a result of published governmental, judicial, or accounting authority.
13. No change of any item in this appraisal report shall be made by anyone other than our Firm, and we shall have no responsibility for any such unauthorized change.
14. Unless otherwise stated, no effort has been made to determine the possible effect, if any, on the subject business due to future Federal, state, or local legislation, including any environmental or ecological matters or interpretations thereof.
15. If prospective financial information approved by management has been used in our work, we have not examined or compiled the prospective financial information and therefore, do not express an audit opinion or any other form of assurance on the prospective financial information or the related assumptions. Events and circumstances frequently do not occur as expected and there will usually be differences between prospective financial information and actual results, and those differences may be material.
16. We have conducted interviews with the current management of the Subject Company concerning the past, present, and prospective operating results of the company.
17. Except as noted, we have relied on the representations of the owners, management, and other third parties concerning the value and useful condition of all equipment, real estate, investments used in the business, and any other assets or liabilities, except as specifically stated to the contrary in this report. We have not attempted to confirm whether or not all assets of the business are free and clear of liens and encumbrances or that the entity has good title to all
assets.
18. The analyst(s) involved in the preparation of this Conclusion of Value or a Calculated Value has (have) no financial interest or contemplated financial interest in the subject of this report.

- 39 - | P a g e
INTERNATIONAL GLOSSARY OF BUSINESS VALUATION TERMS
To enhance and sustain the quality of business valuations for the benefit of the profession and its clientele, the below identified societies and organizations have adopted the definitions for the terms included in this glossary7.
Adjusted Book Value Method—a method within the asset approach whereby all assets and liabilities (including off-balance sheet: intangible: and contingent) are adjusted to their fair market values. (NOTE: In Canada on a going concern basis)
Adjusted Net Asset Method- see Adjusted Book Value Method.
Appraisal- see Valuation.
Appraisal Approach- see Valuation Approach.
Appraisal Date- see Valuation Date.
Appraisal Method- see Valuation Method.
Appraisal Procedure- see Valuation Procedure.
Arbitrage Pricing Theory- a multivariate model for estimating the cost of equity capital, which incorporates several systematic risk factors.
Asset (Asset-Based) Approach—a general way of determining a value indication of a business: business ownership interest: or security using one or more methods based on the value of the assets net of liabilities.
Beta- a measure of systematic risk of a stock; the tendency of a stock’s price to correlate with changes in a specific index.
Blockage Discount—an amount or percentage deducted from the current market price of a publicly traded stock to reflect the decrease in the per share value of a block of stock that is of a size that could not be sold in a reasonable period of time given normal trading volume.
Book Value-see Net Book Value.
Business- see Business Enterprise.
Business Enterprise—a commercial, industrial, service, or investment entity (or a combination thereof) pursuing an economic activity.
Business Risk—the degree of uncertainty of realizing expected future returns of the business resulting from factors other than financial leverage. See Financial Risk.
Business Valuation—the act or process of determining the value of a business enterprise or ownership interest therein.
7 Reproduced verbatim from the International Glossary of Business Valuation Terms (the Glossary)

- 40 - | P a g e
Capital Asset Pricing Model (CÅPM)—a model in which the cost of capital for any stock or portfolio of stocks equals a risk-free rate plus a risk premium that is proportionate to the systematic risk of the stock or portfolio.
Capitalization—a conversion of a single period of economic benefits into value.
Capitalization Factor—any multiple or divisor used to convert anticipated economic benefits of a single period into value.
Capitalization of Earnings Method—a method within the income approach whereby economic benefits for a representative single period are converted to value through division by a capitalization rate.
Capitalization Rate—any divisor usually expressed as a percentage) used to convert anticipated economic benefits of a single period into value.
Capital Structure—the composition of the invested capital of a business enterprise; the mix of debt and equity financing.
Cash Flow—cash that is generated over a period of time by an asset, group of assets, or business enterprise. It may be used in a general sense to encompass various levels of specifically defined cash flows. When the term is used, it should be supplemented by a qualifier (for example, “discretionary” or “operating”) and a specific definition in the given valuation context.
Common Size Statements—financial statements in which each line is expressed as a percentage of the total. On the balance sheet: each line item is shown as a percentage of total assets, and on the income statement, each item is expressed as a percentage of sales.
Control—the power to direct the management and policies of a business enterprise.
Control Premium—an amount or a percentage by which the prorata value of a controlling interest exceeds the pro rata value of a non-controlling interest in a business enterprise to reflect the power of control.
Cost Approach—a general v of determining a value indication of an individual asset by quantifying the amount of money required to replace the future service capability of that asset.
Cost of Capital—the expected rate of return that the market requires in order to attract funds to
a particular investment.
Debt-Free—ire discourage the use of this term. See Invested Capital.
Discount for Lack of Control—an amount or percentage deducted from the pro rata share of value of 100% of an equity interest in a business to reflect the absence of some or all of the powers of control.
Discount for Lack of Marketability—an amount or percentage deducted from the value of an ownership interest to reflect the relative absence of marketability.
Discount for Lack of Voting Rights—an amount or percentage deducted from the per share value of a minority interest voting share to reflect the absence of voting rights.
Discount Rate—a rate of return used to convert a future monetary sum into present value.
- 41 - | P a g e
Discounted Cash Flow Method—a method within the income approach whereby the present value of future expected net cash flows is calculated using a discount rate.
Discounted Future Earnings Method—a method within the income approach whereby the present value of future expected economic benefits is calculated using a discount rate.
Economic Benefits—inflows such as revenues, net income, net cash flows. etc.
Economic Life—the period of time over which property may generate economic benefits.
Effective Date—see Valuation Date.
Enterprise—see Business Enterprise.
Equity—the owner’s interest in property after deduction of all liabilities.
Equity Net Cash Flows—those cash flows available to pay out to equity holders (in the form of dividends) after funding operations of the business enterprise, making necessary capital investments, and increasing or decreasing debt financing.
Equity Risk Premium—a rate of return added to a risk-free rate to reflect the additional risk of equity instruments over risk free instruments (a component of the cost of equity capital or equity discount rate).
Excess Earnings—that amount of anticipated economic benefits that exceeds an appropriate rate of return on the value of a selected asset base (often net tangible assets) used to generate those anticipated economic benefits.
Excess Earnings Method—a specific way of determining a value indication of a business, business ownership interest, or security determined as the sum of a) the value of the assets derived by capitalizing excess earnings and b) the value of the selected asset base. Also frequently used to value intangible assets. See Excess Earnings.
Fair Market Value—the price, expressed in terms of cash equivalents, at which property would change hands between a hypothetical willing and able buyer and a hypothetical willing and able seller, acting at arms-length in an open and unrestricted market, when neither is under compulsion to buy or sell and when both have reasonable knowledge of the relevant facts. (NOTE: In Canada, the term “price” should be replaced with the term “highest price”.)
Fairness Opinion—an opinion as to whether or not the consideration in a transaction is fair from a financial point of view.
Financial Risk—the degree of uncertainty of realizing expected future returns of the business resulting from financial leverage. See Business Risk.
Forced Liquidation Value—liquidation value, at which the asset or assets are sold as quickly as possible, such as at an auction.
Free Cash Flow—we discourage the use of this term. See Net Cash Flow.
Going Concern—an ongoing operating business enterprise.
Going Concern Value—the value of a business enterprise that is expected to continue to operate into the future. The intangible elements of Going Concern Value result from factors such as

- 42 - | P a g e
having a trained work force, an operational plant, and the necessary licenses, systems, and procedures in place.
Goodwill—that intangible asset arising as a result of name, reputation, customer loyalty, location, products, and similar factors not separately identified.
Goodwill Value—the value attributable to goodwill.
Guideline Public Company Method- a method within the market approach whereby market multiples are derived from market prices of stocks of companies that are engaged in the same or similar lines of business and that are actively traded on a free and open market.
Income (Income-Based) Approach—a general way of determining a value indication of a business, business ownership interest, security, or intangible asset using one or more methods that convert anticipated economic benefits into a present single amount.
Intangible Assets—nonphysical assets such as franchises, trademarks, patents, copyrights, goodwill, equities, mineral rights, securities, and contracts (as distinguished from physical assets) that grant rights and privileges and have value for the Internal Rate of Return—a discount rate at which the present value of the future cash flows of the investment equals the cost of the investment.
Intrinsic Value—the value that an investor considers, on the basis of an evaluation or available facts, to be the “true” or “real” value that will become the market value when other investors reach the same conclusion. When the term applies to options, it is the difference between the exercise price and strike price of an option and the market value of the underlying security.
Invested Capital—the sum 0f equity and debt in a business enterprise. Debt is typically (a) all interest-bearing debt or (b) long-term, interest-bearing debt. When the term is used, it should be supplemented by a specific definition in the given valuation context.
Invested Capital Net Cash Flows—those cash flows available to pay out to equity holders (in the form of dividends) and debt investors (in the form of principal and interest) after funding operations of the business enterprise and making necessary capital investments.
Investment Risk—the degree of uncertainty as to the realization of expected returns.
Investment Value—the value to a particular investor based on individual investment requirements and expectations. (NOTE: in Canada the term used is “Value to the Owner”)
Key Person Discount—an amount or percentage deducted from the value of an ownership interest to reflect the reduction in value resulting from the actual or potential loss of a key person in a business enterprise
Levered Beta—the beta reflecting a capital structure that includes debt.
Limited Appraisal—the act or process of determining the value of a business, business ownership interest security or intangible asset with limitations in analyses, procedures, or scope.
Liquidity—the ability to quickly convert property to cash or pay a liability.
Liquidation Value—the net amount that would be realized if the business is terminated and the assets are sold piecemeal. Liquidation can be either “orderly” or “forced.”

- 43 - | P a g e
Majority Control—the degree of control provided by a majority position.
Majority Interest—an ownership interest greater than 50% of the voting interest in a business enterprise.
Market (Market-Based) Approach—a general way of determining a value indication of a business, business ownership interest, security, or intangible asset by using one or more methods that compare the subject to similar businesses, business ownership interests, securities, or intangible assets that have been sold.
Market Capitalization of Equity—the share price of a publicly traded stock multiplied by the number of shares outstanding.
Market Capitalization of Invested Capital—the market capitalization of equity plus the market value of the debt component of invested capital.
Market Multiple—the market value of a company’s stock or invested capital divided by a company measure (such as economic benefits, number of customers).
Marketability—the ability to quickly convert property to cash at minimal cost.
Marketability Discount—see Discount for Lack of Marketability.
Merger and Acquisition Method—a method within the market approach whereby pricing multiples are derived from transactions of significant interests in companies engaged in the same or similar lines of business.
Mid-Year Discounting—a convention used in the Discounted Future Earnings Method that reflects economic benefits being generated at midyear approximating the effect of economic benefits being generated evenly throughout the year.
Minority Discount—a discount for lack of control applicable to a minority interest.
Minority Interest—an ownership interest less than 50% of the voting interest in a business enterprise.
Multiple—the inverse of the capitalization rate Net Book Value—with respect to a business enterprise, the difference between total assets (net of accumulated depreciation, depletion, and amortization) and total liabilities as they appear on the balance sheet (synonymous with Shareholder’s Equity. With respect to a specific asset, the capitalized cost less accumulated amortization or depreciation as it appears on the books of account of the business enterprise.
Net Cash Flows—when the term is used, it should be supplemented by a qualifier. See Equity Net Cash Flows and Invested Capital Net Cash Flows.
Net Present Value—the value, as of a specified date, of future cash inflows less all cash outflows (including the cost of investment) calculated using an appropriate discount rate.
Net Tangible Asset Value—the value of the business enterprise’s tangible assets (excluding excess assets and non-operating assets) minus the value of its liabilities.
Non-operating Assets—assets not necessary to ongoing operations of the business enterprise. (NOTE: in Canada, the term used is “Redundant Assets”)
- 44 - | P a g e
Normalized Earnings—economic benefits adjusted for nonrecurring, noneconomic, or other unusual items to eliminate anomalies and/or facilitate comparisons.
Normalized Financial Statements—financial statements adjusted for non-operating assets and liabilities and/or for nonrecurring, noneconomic: or other unusual items to eliminate anomalies and/or facilitate comparisons.
Orderly Liquidation Value—liquidation value at which the asset or assets are sold over a reasonable period of time to maximize proceeds received.
Premise of Value—an assumption regarding the most likely set of transactional circumstances that may be applicable to the subject valuation; for example, going concern, liquidation.
Present Value—the value, as of a specified date, of future economic benefits and/or proceeds from sale, calculated using an appropriate discount rate.
Portfolio Discount—an amount or percentage deducted from the value of a business enterprise to reflect the fact that it owns dissimilar operations or assets that do not fit well together.
Price/Earnings 1%Iultiple—the price of a share of stock divided by its earnings per share.
Rate of Return—an amount of income loss) and/or change in value realized or anticipated on
an investment, expressed as a percentage of that investment.
Redundant Assets—see Non-operating Assets.
Report Date—the date conclusions are transmitted to the client.
Replacement Cost New—the current cost of a similar new property having the nearest equivalent utility to the property being valued.
Reproduction Cost New—the current cost of an identical new property.
Required Rate of Return—the minimum rate of return acceptable by investors before they will commit money to an investment at a given level of risk.
Residual Value—the value as of the end of the discrete projection period in a discounted future earnings model.
Return on Equity—the amount, expressed as a percentage, earned on a company’s common equity for a given period.
Return on Investment—See Return on Invested Capital and Return on Equity.
Return on Invested Capital—the amount, expressed as a percentage, earned on a company’s total capital for a given period.
Risk-Free Rate—the rate of return available in the market on an investment free of default risk.
Risk Premium—a rate of return added to a risk-free rate to reflect risk.
Rule of Thumb—a mathematical formula developed from the relationship between price and
certain variables based on experience, observation, hearsay; or a combination of these; usually industry specific.
- 45 - | P a g e
Special Interest Purchasers—acquirers who believe they can enjoy post-acquisition economies of scale, synergies, or strategic advantages by combining the acquired business interest with their own.
Standard of Value—the identification of the type of value being utilized in a specific engagement; for example, fair market value, fair value, investment value.
Sustaining Capital Reinvestment—the periodic capital outlay required to maintain operations at existing levels, net of the tax shield available from such outlays.
Systematic Risk—the risk that is common to all risky securities and cannot be eliminated through diversification. The measure of systematic risk in stocks is the beta coefficient.
Tangible Assets—physical assets (such as cash, accounts receivable, inventory, property, plant and equipment, etc.).
Terminal Value—See Residual Values.
Transaction Method—See Merger and Acquisition Method.
Unlevered Beta—the beta reflecting a capital structure without debt.
Unsystematic Risk—the risk specific to an individual security that can be avoided through diversification.
Valuation—the act or process of determining the value of a business, business ownership interest, security or intangible asset.
Valuation Approach—a general way of determining a value indication of a business, business ownership interest, security, or intangible asset using one or more valuation methods.
Valuation Date-the specific point in time as of which the valuator’s opinion of value applies (also referred to as “Effective Date” or “Appraisal Date”).
Valuation Method—within approaches, a specific way to determine value.
Valuation Procedure—the act, manner, and technique of performing the steps of an appraisal method.
Valuation Ratio—a fraction in which a value or price serves as the numerator and financial, operating, or physical data serve as the denominator.
Value to the Owner—see Investment Value.
Voting Control—de jure control of a business enterprise.
Weighted Average Cost of Capital (WÆCC)—the cost of capital (discount rate) determined by the weighted average, at market value, of the cost of all financing sources in the business enterprise’s capital structure.
- 46 - | P a g e
GLOSSARY OF ADDITIONAL TERMS
Assumptions and Limiting Conditions. Parameters and boundaries under which a valuation is performed, as agreed upon by the valuation analyst and the client or as acknowledged or understood by the valuation analyst and the client as being due to existing circumstances. An example is the acceptance, without further verification by the valuation analyst from the client of the client’s financial statements and related information.
Business Ownership Interest. A designated share in the ownership of a business (business enterprise).
Calculated Value. An estimate as to the value of a business, business ownership interest, security, or intangible asset, arrived at by applying valuation procedures agreed upon with the client and using professional judgment as to the value or range of values based on those procedures.
Calculation Engagement. An engagement to estimate value wherein the valuation analyst and the client agree on the specific valuation approaches and valuation methods that the valuation analyst will use and the extent of valuation procedures the valuation analyst will perform to estimate the value of a subject interest. A calculation engagement generally does not include all of the valuation procedures required for a valuation engagement. If a valuation engagement had
been performed, the results might have been different. The valuation analyst expresses the results of the calculation engagement as a calculated value, which may be either a single amount or a range.
Capital or Contribution- Asset Charge. A fair return on an entity’s contributory assets, which are tangible and intangible assets used in the production of income or cash flow associated with an intangible asset being valued. In this context, income or cash flow refers to an applicable measure of income or cash flow; such as net income, or operating cash flow- before taxes and capital expenditures. A capital charge may be expressed as a percentage return on an economic rent associated with, or a profit split related to, the contributory assets.
Capitalization of Benefits Method. A method within the income approach whereby expected future benefits (for example, earnings or cash flow) for a representative single period are converted to value through division by a capitalization rate.
Comparable Profits Method. A method of determining the value of intangible assets by comparing the profits of the subject entity with those of similar uncontrolled companies that have the same or similar complement of intangible assets as the subject company.
Comparable Uncontrolled Transaction Method. A method of determining the value of intangible assets by comparing the subject transaction to similar transactions in the market place made between independent (uncontrolled) parties.
Conclusion of Value. An estimate of the value of a business, business ownership interest, security, or intangible asset, arrived at by applying the valuation procedures appropriate for a valuation engagement and using professional judgment as to the value or range of values based on those procedures.
- 47 - | P a g e
Control Adjustment. A valuation adjustment to financial statements to reflect the effect of a controlling interest in a business. An example would be an adjustment to owners’ compensation that is in excess of market compensation.
Engagement to Estimate Value. An engagement, or any part of an engagement (for example, a tax, litigation, or acquisition-related engagement), that involves determining the value of a business, business ownership interest, security, or intangible asset. Also known as valuation service.
Excess Operating Assets. Operating assets in excess of those needed for the normal operation of a business.
Fair Value. In valuation applications, there are two commonly used definitions for fair value:
(1) For financial reporting purposes only; the price that would be received to sell an asset or paid to transfer a liability in an orderly transaction between market participants at the measurement date. Source: Financial Accounting Standards Board Accounting Standards Codification glossary.
(2) For state legal matters only, some states have laws that use the term fair cake in shareholder and partner matters. For state legal matters only; therefore: the term may be defined by statute or case law in the particular jurisdiction.
Guideline Company Transactions Method. A method within the market approach whereby market multiples are derived from the sales of entire companies engaged in the same or similar lines of business.
Hypothetical Condition. That which is or may be contrary to what exists, but is supposed for the purpose of analysis.
Incremental Income. Additional income or cash flow attributable to an entity’s ownership or operation of an intangible asset being valued: as determined by a comparison of the entity’s income or cash flow with the intangible asset to the entity’s income or cash flow without the intangible asset. In this context, income or cash flow refers to an applicable measure of income or cash flow; such as license royalty income or operating cash flow before taxes and capital
expenditures.
Normalization. See Normalized Earnings in Appendix “International Glossary of Business Valuation Terms.”
Pre-adjustment Value. The value arrived at prior to the application: if appropriate, of valuation discounts or premiums.
Profit Split Income. With respect to the valuation of an intangible asset of an entity, a percentage allocation of the entity’s income or cash flow whereby (1) a split (or percentage) is allocated to the subject intangible and (2) the remainder is allocated to all of the entity’s tangible and other intangible assets. In this context, income or cash flow refers to an applicable measure of income or cash flow, such as net income or operating cash flow before taxes and capital expenditures.
Relief from Royalty Method. A valuation method used to value certain intangible assets (for
example, trademarks and trade names based on the premise that the only value that a purchaser of the assets receives is the exemption from paying a royalty for its use. Application
- 48 - | P a g e
of this method usually involves estimating the fair market value of an intangible asset by quantifying the present value of the stream of market-derived royalty payments that the owner of the intangible asset is exempted from or “relieved” from paving.
Residual Income. For an entity that owns or operates an intangible asset being valued, the portion of the entity’s income or cash flow remaining after subtracting a capital charge on all of the entity’s tangible and other intangible assets. Income or cash flows can refer to any appropriate measure of income or cash flaw, such as net income or operating cash flow before taxes and capital expenditures.
Security. A certificate evidencing ownership or the rights to owner ship in a business
enterprise that (1) is represented by an instrument or by a book record or contractual agreement, (2) is of a type commonly dealt in on securities exchanges or markets or, when represented by an instrument, is commonly recognized in any area in which it is issued or dealt in as a medium for investment, and (3) either one of a class or series or, by its terms, is divisible into a class or series of shares, participations, interests, rights, or interest-bearing obligations.
Subject Interest. A business, business ownership interest, security or intangible asset that is the subject of a valuation engagement
Subsequent Event. An event that occurs subsequent to the valuation date.
Valuation Analyst. A member of our Firm who performs an engagement to estimate value that culminates in the expression of a conclusion of value or a calculated value.
Valuation Assumptions. Statements or inputs utilized in the performance of an engagement to estimate value that serve as a basis for the application of particular valuation methods.
Valuation Engagement. An engagement to estimate value in which a valuation analyst determines an estimate of the value of a subject interest by performing appropriate valuation procedures, as outlined in the AICPA Statement on Standards for Valuation Services, and is free to apply the valuation approaches and methods he or she deems appropriate in the circumstances. The valuation analyst expresses the results of the valuation engagement as a conclusion of value, which may be either a single amount or a range.
Valuation Service. See Engagement to Estimate Value.

- 49 - | P a g e
BACKUP DATA
BALANCE SHEET AS OF DECEMBER 31, 2012

- 50 - | P a g e
ABBREVIATED TAX RETURN FOR 2012

- 51 - | P a g e
ABBREVIATED TAX RETURN FOR 2011

- 52 - | P a g e
ABBREVIATED TAX RETURN FOR 2010

- 53 - | P a g e
ABBREVIATED TAX RETURN FOR 2009
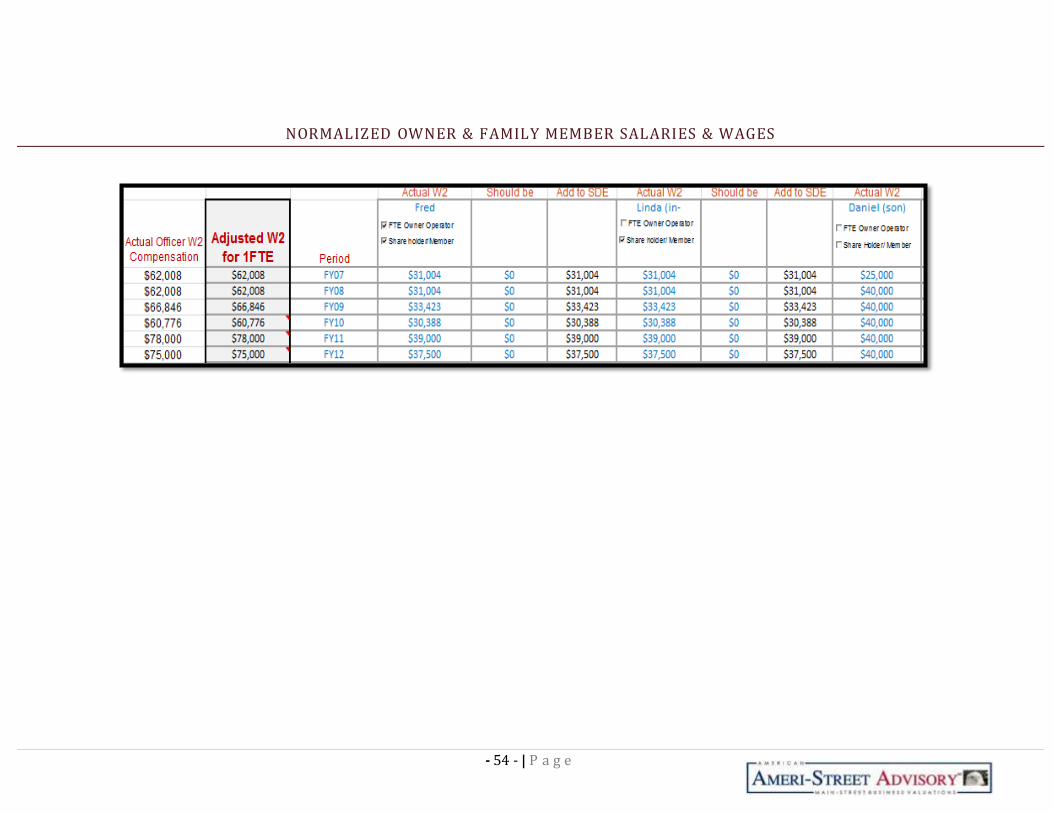
- 54 - | P a g e
NORMALIZED OWNER & FAMILY MEMBER SALARIES & WAGES