buy digital strength - hdfc securities - 2qfy18 - hdfc sec... · remains zensar’s key strength....
TRANSCRIPT

RESULTS REVIEW 2QFY18 07 NOV 2017
Zensar Technologies BUY
HDFC securities Institutional Research is also available on Bloomberg HSLB <GO>& Thomson Reuters
Digital strength Zensar delivered a fine performance in 2Q. Revenue stood at USD 118.6mn (+3.8%, +3.3% CC), in-line with our estimate of USD 118.0mn. Growth was led by AMS (83% of rev, +5.8% QoQ), offset by weakness in IMS (-5.2% QoQ). IMS restructuring is taking longer-than-expected, and will be completed by FY18E. EBITDA margin expansion of 151bps at 11.8% (vs. estimate of 9.9%), despite a wage hike (-150 bps impact) and IMS weakness, was a positive surprise. Digital (36.8% of rev, +5.5% QoQ and 35.3% YoY) remains Zensar’s key strength. The deal size in Digital (BFSI and Retail) is increasing, and more than ~50% of new deal wins are in the Digital. Zensar’s growth will be below the industry average in FY18E owing to changes in clients’ preferences, issue with Oracle ATG (bottomed out in 2Q), and IMS restructuring (Product and MVS). Revenue growth will revive in FY19/20E, and EBITDA margin will recover gradually to 13.1/14.0% in FY18/19E. We maintain our positive view owing to Zenzar’s Digital/SMAC capabilities (well-penetrated within
the Top-20 clients), and a robust Digital deal pipeline. We build 7.5/14.5% revenue/EPS CAGR over FY17-20E. Maintain a BUY with a TP of Rs 930 based on 13x Sep-19 EPS.
Highlights of the quarter BFSI and Retail strong: BFSI (19.2%) and Retail
(28.9%) grew 6.0/6.0% QoQ respectively. Manufacturing (48.7%) bounced back strongly (+3.8% QoQ), led by traction in Top-5 clients (+5.0% QoQ). IMS revenue declined 5.2% QoQ, led by IMS services (-3.9%) and IMS maintenance (-7.8% QoQ).
Digital projects are initially onsite-heavy, and off-shoring, efficiencies and automation will lead to gradual margin expansion. The size of Digital deals is in the range of USD 0.5-5mn TCV.
Near-term outlook: Growth will be led by Digital ramp-up, Retail, BFSI and recovery in IMS. Margins will recover gradually in 2HFY18. The stock has underperformed in the last one year (-12%), and factored in most negatives.
Financial Summary (Consolidated) YE March (Rs bn) 2QFY18 2QFY17 YoY (%) 1QFY18 QoQ (%) FY16 FY17 FY18E FY19E FY20E Net Sales 7.64 7.79 (1.8) 7.38 3.6 29.78 30.73 31.09 33.98 37.03 EBITDA 0.90 1.11 (18.9) 0.76 18.9 4.40 3.85 3.78 4.47 5.17 APAT 0.63 0.69 (9.1) 0.47 32.8 3.06 2.31 2.46 2.92 3.46 Diluted EPS (Rs) 13.8 15.1 (9.1) 10.4 32.8 68.1 51.6 55.5 65.7 77.5 P/E (x) 11.8 15.5 14.4 12.2 10.3 EV / EBITDA (x) 7.6 8.4 8.2 6.5 5.2 RoE (%) 24.9 16.7 15.7 16.4 17.0 Source: Company, HDFC sec Inst Research
INDUSTRY IT
CMP (as on 07 Nov 2017) Rs 846
Target Price Rs 930 Nifty 10,350
Sensex 33,371
KEY STOCK DATA
Bloomberg ZENT IN
No. of Shares (mn) 45
MCap (Rs bn) / ($ mn) 38/584
6m avg traded value (Rs mn) 21
STOCK PERFORMANCE (%)
52 Week high / low Rs 1,030/732
3M 6M 12M
Absolute (%) 6.9 (4.7) (12.4)
Relative (%) 3.5 (16.4) (33.9)
SHAREHOLDING PATTERN (%)
Promoters 48.93
FIs & Local MFs 2.49
FPIs 14.97
Public & Others 33.61 Source : BSE Amit Chandra [email protected] +91-22-6171-7345
Apurva Prasad [email protected] +91-22-6171-7327

ZENSAR TECHNOLOGIES : RESULTS REVIEW 2QFY18
Page | 2
Quarterly Consolidated Financials Snapshot Particulars (Rs bn) 2QFY18 2QFY17 YoY (%) 1QFY18 QoQ (%) Net Sales US$ mn 118.6 116.0 2.2 114.3 3.8 Net Sales 7.64 7.79 (1.8) 7.38 3.6 Cost of Revenue 5.43 5.46 (0.6) 5.33 1.8 SG&A 1.31 1.21 8.2 1.29 1.9 EBITDA 0.90 1.11 (18.9) 0.76 18.9 Depreciation 0.17 0.12 45.4 0.18 (5.5) EBIT 0.73 0.99 (26.5) 0.58 26.5 Interest 0.05 0.02 181.1 0.06 (11.3) Exchange Gain/(Loss) 0.15 -0.01 NM 0.12 NM Other income 0.04 0.03 59.0 0.07 (35.3) PBT 0.87 0.99 (12.4) 0.71 22.9 Tax 0.23 0.28 (18.2) 0.23 0.4 Minority Interest 0.02 0.02 (36.4) 0.01 73.6 RPAT 0.63 0.69 (9.1) 0.47 32.8 EO Items (Adj For Tax) 0.00 0.00 NM 0.00 NM APAT 0.63 0.69 (9.1) 0.47 32.8 Source: Company, HDFC sec Inst Research Margin Analysis MARGIN ANALYSIS % 2QFY18 2QFY17 YoY (%) 1QFY18 QoQ (%) Employee Expenses % Net Sales 71.1 70.2 89 72.3 (123) SG&A Expenses % Net Sales 17.1 15.6 158 17.4 (28) Gross Margin % 28.9 29.8 (89) 27.7 123 EBITDA Margin (%) 11.8 14.3 (247) 10.3 151 EBIT Margin (%) 9.6 12.8 (320) 7.8 173 Tax Rate (%) 26.2 28.1 (189) 32.1 (587) APAT Margin (%) 8.2 8.8 (66) 6.4 180 Source: Company, HDFC sec Inst Research
USD revenue growth was fuelled by Digital, and 50% of the incremental revenue came from this space Digital commerce has picked up after several quarters of weakness in Oracle ATG EBITDA% recovered strongly, despite a salary hike, IMS restructuring, led by higher utilisation (+270 bps), and operational efficiencies. Wage hike impact was USD 1.9-2 mn (-150 bps QoQ) PAT recovered to Rs 625mn, led by margin expansion and lower ETR ETR will be in the range of 28-29%for FY18-19E
ZENSAR TECHNOLOGIES : RESULTS REVIEW 2QFY18
Page | 3
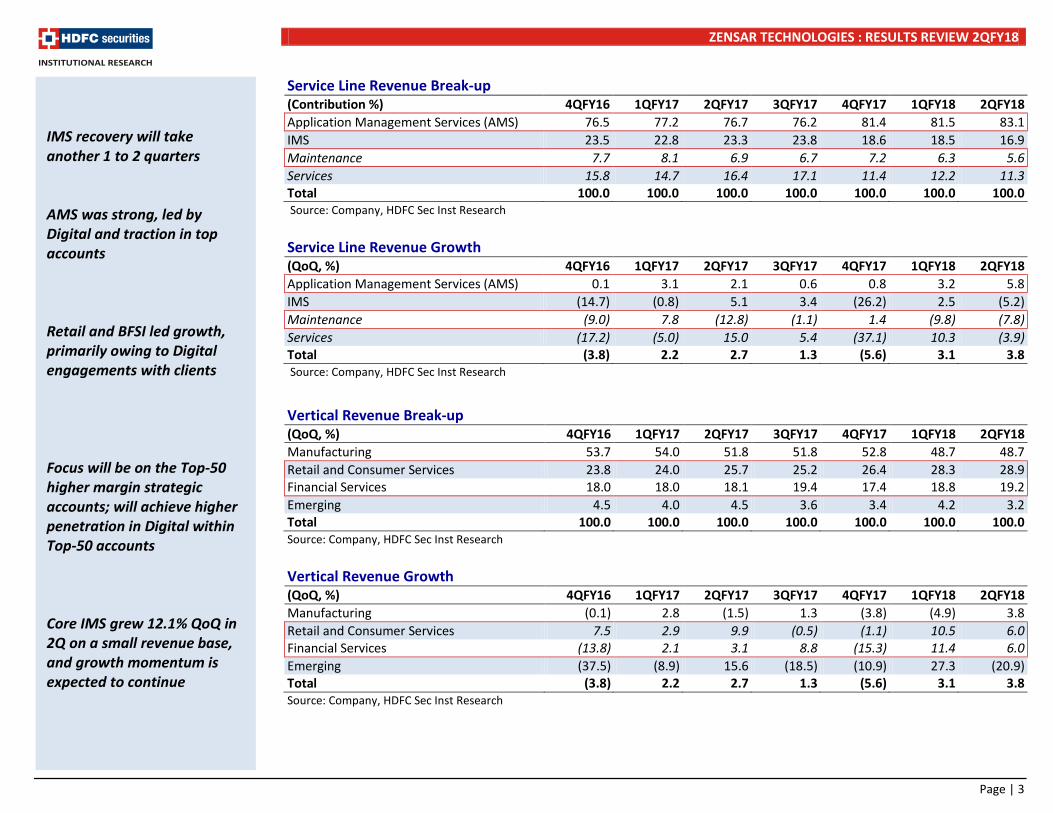
Service Line Revenue Break-up (Contribution %) 4QFY16 1QFY17 2QFY17 3QFY17 4QFY17 1QFY18 2QFY18 Application Management Services (AMS) 76.5 77.2 76.7 76.2 81.4 81.5 83.1 IMS 23.5 22.8 23.3 23.8 18.6 18.5 16.9 Maintenance 7.7 8.1 6.9 6.7 7.2 6.3 5.6 Services 15.8 14.7 16.4 17.1 11.4 12.2 11.3 Total 100.0 100.0 100.0 100.0 100.0 100.0 100.0 Source: Company, HDFC Sec Inst Research Service Line Revenue Growth (QoQ, %) 4QFY16 1QFY17 2QFY17 3QFY17 4QFY17 1QFY18 2QFY18 Application Management Services (AMS) 0.1 3.1 2.1 0.6 0.8 3.2 5.8 IMS (14.7) (0.8) 5.1 3.4 (26.2) 2.5 (5.2) Maintenance (9.0) 7.8 (12.8) (1.1) 1.4 (9.8) (7.8) Services (17.2) (5.0) 15.0 5.4 (37.1) 10.3 (3.9) Total (3.8) 2.2 2.7 1.3 (5.6) 3.1 3.8 Source: Company, HDFC Sec Inst Research
Vertical Revenue Break-up (QoQ, %) 4QFY16 1QFY17 2QFY17 3QFY17 4QFY17 1QFY18 2QFY18 Manufacturing 53.7 54.0 51.8 51.8 52.8 48.7 48.7 Retail and Consumer Services 23.8 24.0 25.7 25.2 26.4 28.3 28.9 Financial Services 18.0 18.0 18.1 19.4 17.4 18.8 19.2 Emerging 4.5 4.0 4.5 3.6 3.4 4.2 3.2 Total 100.0 100.0 100.0 100.0 100.0 100.0 100.0 Source: Company, HDFC Sec Inst Research Vertical Revenue Growth (QoQ, %) 4QFY16 1QFY17 2QFY17 3QFY17 4QFY17 1QFY18 2QFY18 Manufacturing (0.1) 2.8 (1.5) 1.3 (3.8) (4.9) 3.8 Retail and Consumer Services 7.5 2.9 9.9 (0.5) (1.1) 10.5 6.0 Financial Services (13.8) 2.1 3.1 8.8 (15.3) 11.4 6.0 Emerging (37.5) (8.9) 15.6 (18.5) (10.9) 27.3 (20.9) Total (3.8) 2.2 2.7 1.3 (5.6) 3.1 3.8 Source: Company, HDFC Sec Inst Research
IMS recovery will take another 1 to 2 quarters AMS was strong, led by Digital and traction in top accounts Retail and BFSI led growth, primarily owing to Digital engagements with clients Focus will be on the Top-50 higher margin strategic accounts; will achieve higher penetration in Digital within Top-50 accounts Core IMS grew 12.1% QoQ in 2Q on a small revenue base, and growth momentum is expected to continue

ZENSAR TECHNOLOGIES : RESULTS REVIEW 2QFY18
Page | 4
Onsite: Offshore Revenue Break-up (QoQ, %) 4QFY16 1QFY17 2QFY17 3QFY17 4QFY17 1QFY18 2QFY18 Onsite 63.7 68.8 66.2 66.5 65.5 62.5 62.5 Offshore 36.3 31.2 33.8 33.5 34.5 37.5 37.5 Total 100.0 100.0 100.0 100.0 100.0 100.0 100.0 Source: Company, HDFC Sec Inst Research Onsite: Offshore Revenue Growth (QoQ, %) 4QFY16 1QFY17 2QFY17 3QFY17 4QFY17 1QFY18 2QFY18 Onsite (7.1) 10.4 (1.1) 1.7 (7.0) (1.7) 3.8 Offshore 2.8 (12.2) 11.2 0.5 (2.8) 12.0 3.8 Total (3.8) 2.2 2.7 1.3 (5.6) 3.1 3.8 Source: Company, HDFC Sec Inst Research
Project Type Revenue Break-up (QoQ, %) 4QFY16 1QFY17 2QFY17 3QFY17 4QFY17 1QFY18 2QFY18 Fixed Price 52.9 49.8 49.7 47.2 47.1 47.9 50.9 T&M 47.1 50.2 50.3 52.8 52.9 52.1 49.1 Total 100.0 100.0 100.0 100.0 100.0 100.0 100.0 Source: Company, HDFC Sec Inst Research Project Type Revenue Growth (QoQ, %) 4QFY16 1QFY17 2QFY17 3QFY17 4QFY17 1QFY18 2QFY18 Fixed Price (5.8) (3.7) 2.6 (3.9) (5.8) 4.8 10.3 T&M (1.4) 8.8 2.9 6.4 (5.4) 1.5 (2.2) Total (3.8) 2.2 2.7 1.3 (5.6) 3.1 3.8 Source: Company, HDFC Sec Inst Research
Onsite recovered owing to growth in manufacturing Digital deals are initially on-site heavy, off-shoring leads to margin expansion Over 50% of the revenue is expected to be from the Digital space in 3 years across Retail (Digital-heavy), Financial services and Hi-tech Fixed price contracts have increased, leading to higher margins in the quarter

ZENSAR TECHNOLOGIES : RESULTS REVIEW 2QFY18
Page | 5
Geographical Revenue Break-up (QoQ, %) 4QFY16 1QFY17 2QFY17 3QFY17 4QFY17 1QFY18 2QFY18 North Americas 77.7 74.9 75.1 74.4 73.8 74.4 72.0 Europe 10.5 10.5 9.9 12.0 13.8 13.8 14.2 Africa 7.2 8.0 8.6 9.3 9.0 9.5 9.9 RoW 4.7 6.6 6.4 4.3 3.5 2.3 3.9 Total 100.0 100.0 100.0 100.0 100.1 100.0 100.0 Source: Company, HDFC Sec Inst Research Geographical Revenue Growth (QoQ, %) 4QFY16 1QFY17 2QFY17 3QFY17 4QFY17 1QFY18 2QFY18 North Americas (2.4) (1.4) 2.9 0.4 (6.4) 3.9 0.4 Europe 2.0 2.3 (3.1) 22.8 8.5 3.1 6.8 Africa (8.0) 13.9 10.8 9.4 (8.7) 8.8 8.1 RoW (25.2) 43.6 0.1 (32.1) (23.2) (32.3) 75.9 Total (3.8) 2.2 2.7 1.3 (5.5) 3.0 3.8 Source: Company, HDFC Sec Inst Research
Client-wise Revenue Break-up (QoQ, %) 4QFY16 1QFY17 2QFY17 3QFY17 4QFY17 1QFY18 2QFY18 Top 5 clients 37.6 36.6 38.9 37.5 38.4 34.9 35.3 Top 10 clients 45.9 45.7 48.6 45.0 46.1 43.1 43.6 Source: Company, HDFC Sec Inst Research Client-wise Revenue Growth (QoQ, %) 4QFY16 1QFY17 2QFY17 3QFY17 4QFY17 1QFY18 2QFY18 Top 5 clients 3.3 (0.6) 9.4 (2.4) (3.4) (6.3) 5.0 Top 10 clients 2.8 1.7 9.3 (6.3) (3.3) (3.6) 5.0 Source: Company, HDFC Sec Inst Research
Geographically, Europe and Africa were strong because of Retail ad BFSI traction US will remain the key focus geography; heavy investments in SG&A are made in the US Top 5/10 accounts’ revenue was up 5.0/5.0% QoQ, after three quarters of decline

ZENSAR TECHNOLOGIES : RESULTS REVIEW 2QFY18
Page | 6
Headcount, Utilisation Data (Nos.) 4QFY16 1QFY17 2QFY17 3QFY17 4QFY17 1QFY18 2QFY18 Total headcount 8,256 8,238 8,316 8,564 8,524 8,567 8,414 Software Professionals 7,540 7,487 7,550 7,713 7,716 7,848 7,727 Sales 113 92 82 103 102 91 78 Support 603 659 684 748 706 628 609 Net additions 64 (18) 78 248 (40) 43 (153)
Utilisation (%) 81.0 79.8 80.1 79.5 79.2 83.2 85.9 Source: Company, HDFC Sec Inst Research
Key Assumptions Particulars FY16 FY17 FY18E FY19E FY20E Total Volume growth (%) 10.7 3.6 11.1 4.2 7.2 Total Pricing change (%) (5.0) (2.6) (5.6) 4.3 1.7 Total USD revenue growth (%) 4.6 0.5 4.8 8.7 9.0 USD/INR rate 65.1 67.1 64.7 65.0 65.0 EBITDA margin (%) 14.8 12.5 12.2 13.1 14.0 Source: Company, HDFC Sec Inst Research
Change In Estimates Particulars Earlier estimates Revised estimates % change FY18E Revenue (US$ mn) 483 479 (0.7) Revenue (Rs mn) 31,309 31,093 (0.7) EBITDA (Rs mn) 3,740 3,782 1.1 EBITDA margin (%) 11.9% 12.2% 22 bps EPS (Rs) 56.2 55.5 (1.2) FY19E Revenue (US$ mn) 525 521 (0.8) Revenue (Rs mn) 34,251 33,979 (0.8) EBITDA (Rs mn) 4,453 4,467 0.3 EBITDA margin (%) 13.0% 13.1% 15 bps EPS (Rs) 71.5 65.7 (8.1) Source: Company, HDFC Sec Inst Research
Utilisation increased 270 bps to 85.9%; target utilisation band for the company is between 83-86%.

ZENSAR TECHNOLOGIES : RESULTS REVIEW 2QFY18
Page | 7
Peer Valuations
Company Mcap CMP
Reco. TP EPS (Rs) P/E (x) RoE (%)
(Rs bn) (Rs) (Rs) FY17 FY18E FY19E FY20E FY17 FY18E FY19E FY20E FY17 FY18E FY19E FY20E L&T Infotech 139 815 BUY 890 56.9 59.7 65.5 71.4 14.3 13.7 12.4 11.4 36.9 29.6 27.8 26.3 Mphasis 134 693 BUY 750 38.8 41.3 47.1 53.3 17.9 16.8 14.7 13.0 13.4 13.8 16.1 16.8 Hexaware * 95 320 BUY 315 13.9 16.9 18.2 21.7 23.0 18.9 17.6 14.7 26.7 26.6 24.5 25.4 L&T Tech 87 860 NEU 805 41.8 40.7 49.2 56.9 20.6 21.1 17.5 15.1 33.3 25.1 25.3 24.6 Mindtree 82 487 NEU 465 24.9 24.2 32.1 40.8 19.6 20.1 15.2 11.9 16.8 18.1 20.7 23.8 Cyient 60 530 BUY 587 30.6 36.3 42.0 48.3 17.3 14.6 12.6 11.0 17.4 18.2 19.0 19.7 Tata Elxsi 54 865 NR 935 28.1 34.1 39.7 46.3 30.8 25.3 21.8 18.7 37.0 34.4 32.7 31.1 Persistent 52 649 BUY 715 38.8 41.0 46.1 55.5 16.7 15.8 14.1 11.7 17.0 16.3 16.3 17.5 eClerx 51 1,271 SELL 1,085 87.8 76.5 85.0 97.2 14.5 16.6 14.9 13.1 30.8 23.7 23.7 24.5 Zensar 38 846 BUY 930 51.6 55.5 65.7 77.5 15.5 14.4 12.2 10.8 16.7 15.7 16.4 17.0 KPIT Tech 31 157 NEU 140 11.1 11.9 13.2 15.1 14.1 13.1 11.9 10.4 14.8 14.3 14.2 14.7 Sonata 20 186 BUY 214 14.6 15.4 18.1 20.8 12.7 12.0 10.2 8.9 31.2 30.1 32.0 32.7
Source: HDFC sec Inst Research * YE Dec

ZENSAR TECHNOLOGIES : RESULTS REVIEW 2QFY18
Page | 8
Income Statement (Consolidated) YE March (Rs bn) FY16 FY17 FY18E FY19E FY20E Net Revenues (US $mn) 455 457 479 521 568 Growth (%) 4.6 0.5 4.8 8.7 9.0 Net Revenues (Rs mn) 29.78 30.73 31.09 33.98 37.03 Growth (%) 12.1 3.2 1.2 9.3 9.0 Personnel expenses 20.37 21.74 21.94 23.65 25.58 SG&A 5.01 5.13 5.37 5.86 6.28 EBITDA 4.40 3.85 3.78 4.47 5.17 EBITDA Margin (%) 14.8 12.5 12.2 13.1 14.0 EBITDA Growth (%) 12.3 (12.5) (1.8) 18.1 15.8 Depreciation 0.46 0.46 0.69 0.72 0.78 EBIT 3.95 3.39 3.10 3.75 4.39 Other Income (Including EO Items) 0.45 0.14 0.72 0.75 0.84 Interest 0.11 0.09 0.22 0.21 0.19 PBT 4.29 3.44 3.60 4.29 5.05 Tax (Incl Deferred) 1.17 1.06 1.02 1.24 1.46 Minority Interest 0.03 0.04 0.06 0.06 0.06 RPAT 3.09 2.34 2.52 2.98 3.52 EO (Loss) / Profit (Net Of Tax) 0.00 0.00 0.00 0.00 0.00 APAT 3.06 2.31 2.46 2.92 3.46 APAT Growth (%) 15.8 (24.7) 6.8 18.5 18.4 Adjusted EPS (Rs) 68.1 51.6 55.5 65.7 77.5 EPS Growth (%) 16.9 (24.2) 7.6 18.3 18.0
Source: Company, HDFC sec Inst Research
Balance Sheet (Consolidated) YE March (Rs bn) FY16 FY17 FY18E FY19E FY20E SOURCES OF FUNDS Share Capital - Equity 0.45 0.45 0.45 0.45 0.45 Reserves 12.18 14.31 16.24 18.52 21.22 Total Shareholders’ Funds 12.63 14.76 16.69 18.97 21.67 Minority Interest 0.04 0.07 0.13 0.19 0.26 Total Debt 1.48 1.32 1.32 1.32 1.32 Net Deferred Taxes -0.22 -0.17 -0.17 -0.17 -0.17 Long Term Provisions & Others 0.49 0.74 0.79 0.86 0.93 TOTAL SOURCES OF FUNDS 14.42 16.72 18.75 21.17 24.01 APPLICATION OF FUNDS Net Block 3.84 4.51 4.45 4.40 4.37 CWIP 0.00 0.01 0.01 0.01 0.01 Investments 0.38 1.11 1.11 1.11 1.11 LT Loans & Advances 0.37 0.44 0.48 0.53 0.57 Total Non-current Assets 4.59 6.07 6.05 6.05 6.06 Inventories 1.26 1.13 1.24 1.36 1.48 Debtors 5.40 5.33 5.54 6.05 6.59 Other Current Assets 3.35 3.61 3.73 4.08 4.44 Cash & Equivalents 3.85 4.76 6.24 8.04 10.21 Total Current Assets 13.86 14.82 16.76 19.53 22.73 Creditors 1.66 1.75 1.72 1.86 2.01 Other Current Liabilities & Provns 2.37 2.41 2.33 2.55 2.78 Total Current Liabilities 4.03 4.16 4.05 4.41 4.78 Net Current Assets 9.83 10.66 12.70 15.12 17.95 TOTAL APPLICATION OF FUNDS 14.42 16.72 18.75 21.17 24.01 Source: Company, HDFC sec Inst Research

ZENSAR TECHNOLOGIES : RESULTS REVIEW 2QFY18
Page | 9
Cash Flow Statement (Consolidated) YE March (Rs bn) FY16 FY17 FY18E FY19E FY20E Reported PBT 4.29 3.44 3.60 4.29 5.05 Non-operating & EO items 0.00 -0.12 -0.23 -0.27 -0.31 Interest expenses 0.11 0.09 0.22 0.21 0.19 Depreciation 0.45 0.46 0.69 0.72 0.78 Working Capital Change -1.22 0.27 -0.56 -0.59 -0.62 Tax Paid -1.05 -1.06 -1.02 -1.24 -1.46 OPERATING CASH FLOW ( a ) 2.59 3.08 2.69 3.12 3.61 Capex -0.42 -1.15 -0.62 -0.68 -0.74 Free cash flow (FCF) 2.16 1.94 2.07 2.44 2.87 Investments 0.01 -0.73 0.00 0.00 0.00 Non-operating Income 0.05 -0.27 0.23 0.27 0.31 INVESTING CASH FLOW ( b ) -0.37 -2.14 -0.39 -0.41 -0.43 Debt Issuance/(Repaid) -0.27 -0.16 0.00 0.00 0.00 Interest Expenses -0.11 -0.09 -0.22 -0.21 -0.19 FCFE 1.79 1.69 1.85 2.22 2.69 Share Capital Issuance 0.04 0.00 0.00 0.00 0.00 Dividend -0.97 -0.63 -0.59 -0.70 -0.82 FINANCING CASH FLOW ( c ) -1.30 -0.88 -0.81 -0.91 -1.01 NET CASH FLOW (a+b+c) 0.92 0.06 1.49 1.80 2.17 EO Items, Others 0.03 0.85 0.00 0.00 0.00 Closing Cash & Equivalents 3.85 4.76 6.24 8.04 10.21
Source: Company, HDFC sec Inst Research
Key Ratios (Consolidated) FY16 FY17 FY18E FY19E FY20E PROFITABILITY (%) GPM 31.6 29.2 29.4 30.4 30.9 EBITDA Margin 14.8 12.5 12.2 13.1 14.0 APAT Margin 10.3 7.5 7.9 8.6 9.3 RoE 24.9 16.7 15.7 16.4 17.0 RoIC (or Core RoCE) 22.4 18.1 16.0 18.4 20.5 RoCE 17.6 12.0 12.0 12.7 13.2 EFFICIENCY Tax Rate (%) 27.3 30.9 28.4 29.0 29.0 Fixed Asset Turnover (x) 4.2 3.8 3.5 3.6 3.6 Debtors (days) 66 63 65 65 65 Payables (days) 24 24 23 23 23 Cash Conversion Cycle (days) 43 40 42 42 42 Debt/EBITDA (x) 0.3 0.3 0.3 0.3 0.3 Net D/E (x) (0.2) (0.2) (0.3) (0.4) (0.4) Interest Coverage (x) 41 44 17 21 28 PER SHARE DATA (Rs) EPS 68.1 51.6 55.5 65.7 77.5 CEPS 78.1 61.8 70.6 81.5 94.6 Dividend 14 14 13 15 18 Book Value 278 325 367 418 477 VALUATION P/E(x) 11.8 15.5 14.4 12.2 10.3 P/BV(x) 2.9 2.5 2.2 1.9 1.7 EV/EBITDA(x) 7.6 8.4 8.2 6.5 5.2 EV/Revenues(x) 1.1 1.1 1.0 0.9 0.7 OCF/EV (%) 7.7 9.5 8.7 10.7 13.4 FCF/EV(%) 6.5 6.0 6.7 8.3 10.6 FCFE/MktCap (%) 5.0 4.7 5.1 6.2 7.5 Dividend Yield (%) 1.8 1.8 1.6 1.9 2.3
Source: Company, HDFC sec Inst Research
ZENSAR TECHNOLOGIES : RESULTS REVIEW 2QFY18
Page | 10
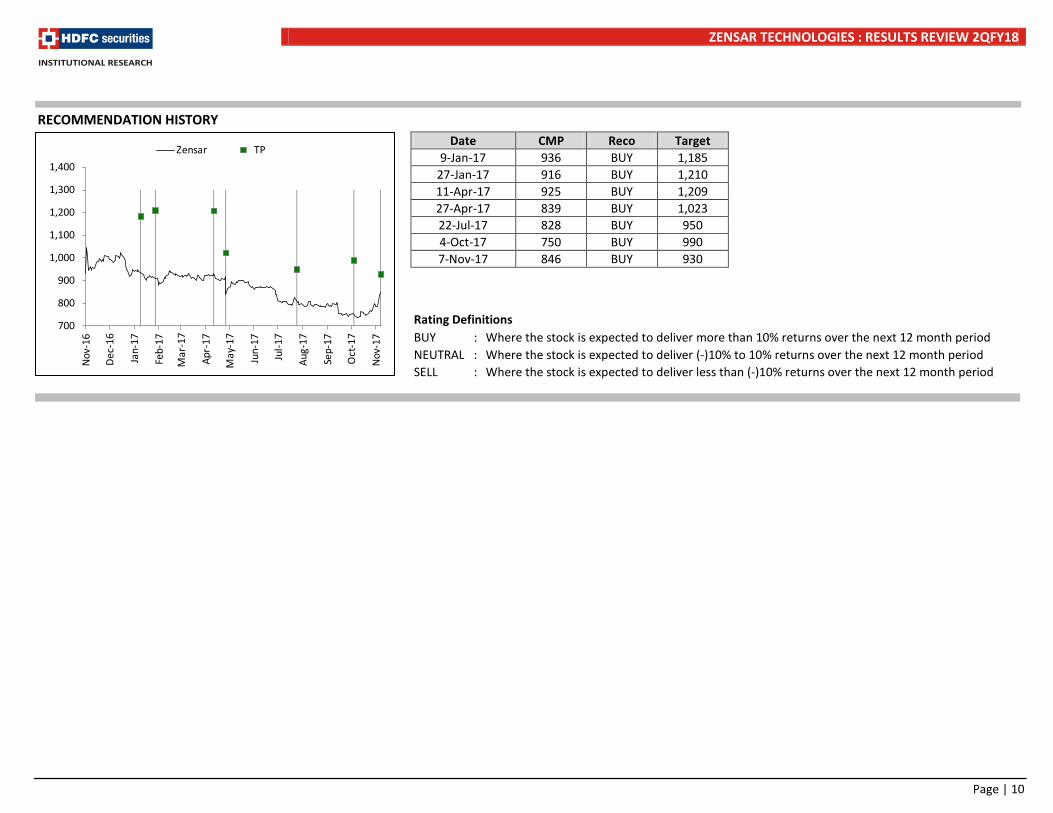
Rating Definitions BUY : Where the stock is expected to deliver more than 10% returns over the next 12 month period NEUTRAL : Where the stock is expected to deliver (-)10% to 10% returns over the next 12 month period SELL : Where the stock is expected to deliver less than (-)10% returns over the next 12 month period
Date CMP Reco Target 9-Jan-17 936 BUY 1,185
27-Jan-17 916 BUY 1,210 11-Apr-17 925 BUY 1,209 27-Apr-17 839 BUY 1,023 22-Jul-17 828 BUY 950 4-Oct-17 750 BUY 990 7-Nov-17 846 BUY 930
700
800
900
1,000
1,100
1,200
1,300
1,400
Nov-
16
Dec-
16
Jan-
17
Feb-
17
Mar
-17
Apr-
17
May
-17
Jun-
17
Jul-1
7
Aug-
17
Sep-
17
Oct
-17
Nov-
17
Zensar TP
RECOMMENDATION HISTORY

ZENSAR TECHNOLOGIES : RESULTS REVIEW 2QFY18
Page | 11
Disclosure: We, Amit Chandra, MBA & Apurva Prasad, MBA, authors and the names subscribed to this report, hereby certify that all of the views expressed in this research report accurately reflect our views about the subject issuer(s) or securities. HSL has no material adverse disciplinary history as on the date of publication of this report. We also certify that no part of our compensation was, is, or will be directly or indirectly related to the specific recommendation(s) or view(s) in this report. Research Analyst or his/her relative or HDFC Securities Ltd. does not have any financial interest in the subject company. Also Research Analyst or his relative or HDFC Securities Ltd. or its Associate may have beneficial ownership of 1% or more in the subject company at the end of the month immediately preceding the date of publication of the Research Report. Further Research Analyst or his relative or HDFC Securities Ltd. or its associate does not have any material conflict of interest. Any holding in stock –No HDFC Securities Limited (HSL) is a SEBI Registered Research Analyst having registration no. INH000002475. Disclaimer: This report has been prepared by HDFC Securities Ltd and is meant for sole use by the recipient and not for circulation. The information and opinions contained herein have been compiled or arrived at, based upon information obtained in good faith from sources believed to be reliable. Such information has not been independently verified and no guaranty, representation of warranty, express or implied, is made as to its accuracy, completeness or correctness. All such information and opinions are subject to change without notice. This document is for information purposes only. Descriptions of any company or companies or their securities mentioned herein are not intended to be complete and this document is not, and should not be construed as an offer or solicitation of an offer, to buy or sell any securities or other financial instruments. This report is not directed to, or intended for display, downloading, printing, reproducing or for distribution to or use by, any person or entity who is a citizen or resident or located in any locality, state, country or other jurisdiction where such distribution, publication, reproduction, availability or use would be contrary to law or regulation or what would subject HSL or its affiliates to any registration or licensing requirement within such jurisdiction. If this report is inadvertently send or has reached any individual in such country, especially, USA, the same may be ignored and brought to the attention of the sender. This document may not be reproduced, distributed or published for any purposes without prior written approval of HSL. Foreign currencies denominated securities, wherever mentioned, are subject to exchange rate fluctuations, which could have an adverse effect on their value or price, or the income derived from them. In addition, investors in securities such as ADRs, the values of which are influenced by foreign currencies effectively assume currency risk. It should not be considered to be taken as an offer to sell or a solicitation to buy any security. HSL may from time to time solicit from, or perform broking, or other services for, any company mentioned in this mail and/or its attachments. HSL and its affiliated company(ies), their directors and employees may; (a) from time to time, have a long or short position in, and buy or sell the securities of the company(ies) mentioned herein or (b) be engaged in any other transaction involving such securities and earn brokerage or other compensation or act as a market maker in the financial instruments of the company(ies) discussed herein or act as an advisor or lender/borrower to such company(ies) or may have any other potential conflict of interests with respect to any recommendation and other related information and opinions. HSL, its directors, analysts or employees do not take any responsibility, financial or otherwise, of the losses or the damages sustained due to the investments made or any action taken on basis of this report, including but not restricted to, fluctuation in the prices of shares and bonds, changes in the currency rates, diminution in the NAVs, reduction in the dividend or income, etc. HSL and other group companies, its directors, associates, employees may have various positions in any of the stocks, securities and financial instruments dealt in the report, or may make sell or purchase or other deals in these securities from time to time or may deal in other securities of the companies / organizations described in this report. HSL or its associates might have managed or co-managed public offering of securities for the subject company or might have been mandated by the subject company for any other assignment in the past twelve months. HSL or its associates might have received any compensation from the companies mentioned in the report during the period preceding twelve months from t date of this report for services in respect of managing or co-managing public offerings, corporate finance, investment banking or merchant banking, brokerage services or other advisory service in a merger or specific transaction in the normal course of business. HSL or its analysts did not receive any compensation or other benefits from the companies mentioned in the report or third party in connection with preparation of the research report. Accordingly, neither HSL nor Research Analysts have any material conflict of interest at the time of publication of this report. Compensation of our Research Analysts is not based on any specific merchant banking, investment banking or brokerage service transactions. HSL may have issued other reports that are inconsistent with and reach different conclusion from the information presented in this report. Research entity has not been engaged in market making activity for the subject company. Research analyst has not served as an officer, director or employee of the subject company. We have not received any compensation/benefits from the subject company or third party in connection with the Research Report. HDFC securities Limited, I Think Techno Campus, Building - B, "Alpha", Office Floor 8, Near Kanjurmarg Station, Opp. Crompton Greaves, Kanjurmarg (East), Mumbai 400 042 Phone: (022) 3075 3400 Fax: (022) 2496 5066 Compliance Officer: Binkle R. Oza Email: [email protected] Phone: (022) 3045 3600 HDFC Securities Limited, SEBI Reg. No.: NSE-INB/F/E 231109431, BSE-INB/F 011109437, AMFI Reg. No. ARN: 13549, PFRDA Reg. No. POP: 04102015, IRDA Corporate Agent License No.: HDF 2806925/HDF C000222657, SEBI Research Analyst Reg. No.: INH000002475, CIN - U67120MH2000PLC152193 Mutual Funds Investments are subject to market risk. Please read the offer and scheme related documents carefully before investing.

ZENSAR TECHNOLOGIES : RESULTS REVIEW 2QFY18
Page | 12
HDFC securities Institutional Equities Unit No. 1602, 16th Floor, Tower A, Peninsula Business Park, Senapati Bapat Marg, Lower Parel, Mumbai - 400 013 Board : +91-22-6171 7330 www.hdfcsec.com