bvmf presentation - july 2011
TRANSCRIPT
7/30/2019 BVMF Presentation - July 2011
http://slidepdf.com/reader/full/bvmf-presentation-july-2011 1/51
July 2011
7/30/2019 BVMF Presentation - July 2011
http://slidepdf.com/reader/full/bvmf-presentation-july-2011 2/51
Forward Looking Statements
This presentation may contain certain statements that express the management’s expectations, beliefs and assumptions
about future events or results. Such statements are not historical fact, being based on currently available competitive,
financial and economic data, and on current projections about the industries BM&FBovespa works in.
The verbs “anticipate,” “believe,” “estimate,” “expect,” “forecast,” “plan,” “predict,” “project,” “target” and other similarverbs are intended to identify these forward-looking statements, which involve risks and uncertainties that could cause
actual results to differ materially from those projected in this presentation and do not guarantee any future BM&FBovespa
performance.
The factors that might affect performance include, but are not limited to: ( i) market acceptance of BM&FBOVESPA services;
(ii) volatility related to (a) the Brazilian economy and securities markets and (b) the highly-competitive industries
BM&FBovespa operates in; (iii) changes in (a) domestic and foreign legislation and taxation and (b) government policies
related to the financial and securities markets; (iv) increasing competition from new entrants to the Brazilian markets; (v)ability to keep up with rapid changes in technological environment, including the implementation of enhanced functionality
demanded by BM&FBovespa customers; (vi) ability to maintain an ongoing process for introducing competitive new
products and services, while maintaining the competitiveness of existing ones; (vii) ability to attract new customers in
domestic and foreign jurisdictions; (viii) ability to expand the offer of BM&FBovespa products in foreign jurisdictions.
All forward-looking statements in this presentation are based on information and data available as of the date they were
made, and BM&FBovespa undertakes no obligation to update them in light of new information or future development.
This presentation does not constitute an offer to sell or the solicitation of an offer to buy any securities, nor shall there be
any sale of securities where such offer or sale would be unlawful prior to registration or qualification under the securities
law. No offering shall be made except by means of a prospectus meeting the requirements of the Brazilian Securities
Commission CVM Instruction 400 of 2003, as amended.
2
7/30/2019 BVMF Presentation - July 2011
http://slidepdf.com/reader/full/bvmf-presentation-july-2011 3/51
BVMF STOCK PRICE Recent Performance
3
7/30/2019 BVMF Presentation - July 2011
http://slidepdf.com/reader/full/bvmf-presentation-july-2011 4/51
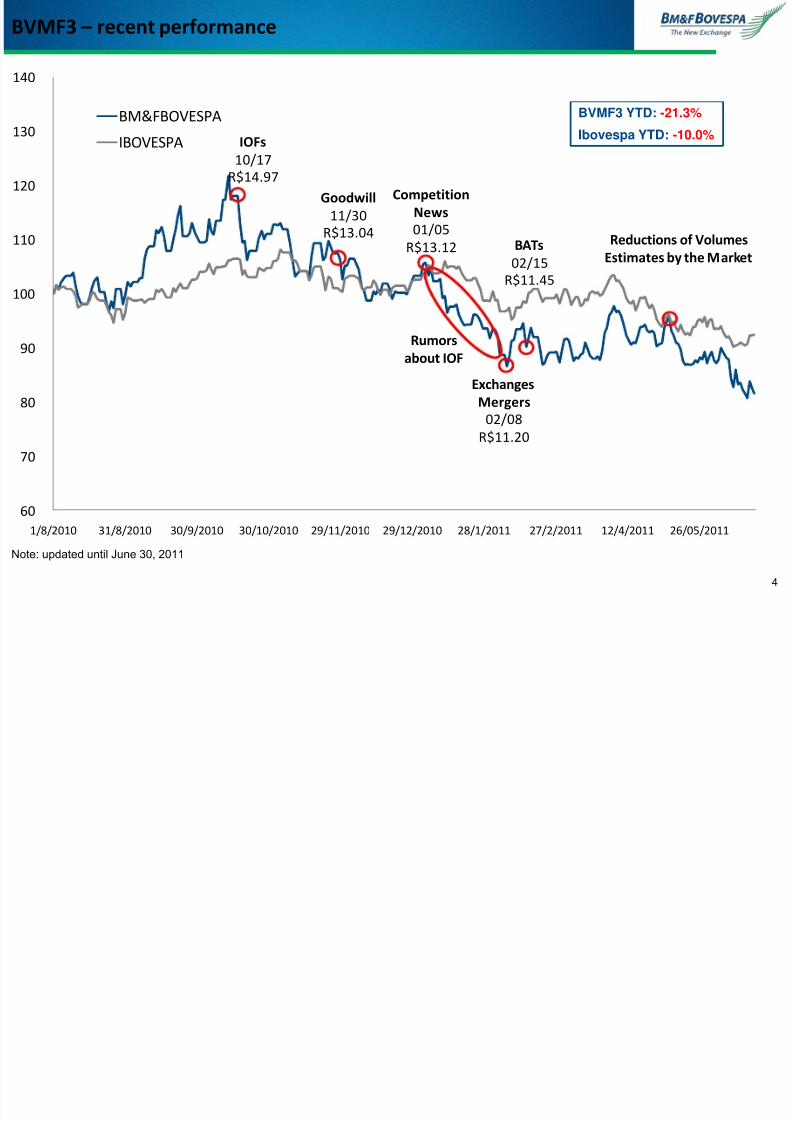
IOFs10/17
R$14.97
Goodwill
11/30R$13.04
Competition
News
01/05
R$13.12
Rumors
about IOF
Exchanges
Mergers
02/08R$11.20
BATs
02/15
R$11.45
Reductions of Volumes
Estimates by the Market
60
70
80
90
100
110
120
130
140
1/8/2010 31/8/2010 30/9/2010 30/10/2010 29/11/2010 29/12/2010 28/1/2011 27/2/2011 12/4/2011 26/05/2011
BM&FBOVESPA
IBOVESPA
BVMF3 – recent performance
Note: updated until June 30, 2011
BVMF3 YTD: -21.3%
Ibovespa YTD: -10.0%
4
7/30/2019 BVMF Presentation - July 2011
http://slidepdf.com/reader/full/bvmf-presentation-july-2011 5/51
Possible CompetitionImportant considerations
EASING REGULATION IS NOT EXPECTED
Main requirements: pre-trade controls, self-regulatory (SRO), off exchange trades are not permitted
(internalization of orders and OTC), CCP for stocks trading, post-trading at the beneficial owner level Competition in other exchanges was intensified after easing regulation
THE EXCHANGE FEES (TRADING AND POST-TRADING) ARE PAID BY THE FINAL INVESTOR
Differently from USA and Europe, the final investors is the one who pays the exchange fees
Brokers couldn’t increase their share in the all-in trading cost pie in case of reduction on the exchange fees
STOCKS TRADING ALL-IN COST IN BVMF IS COMPETITIVE
Despite the misleading perception, all-in cost in BVMF is competitive compared to other markets
Comparing only the trading fees among exchanges is misleading. BVMF provides higher portion of servicesthan the peers
IT INFRASTRUCTURE MOVING TO STATE OF THE ART There is no gap of IT infrastructure (BRL500 million CAPEX budget for 2010-11)
Increasing participation of HFT via Co-location (moving to sub millisecond latency)
RECENT BM&FBOVESPA INITIATIVES (REBALANCING OF FEES)
Shift between trading and post-trading fees
5

7/30/2019 BVMF Presentation - July 2011
http://slidepdf.com/reader/full/bvmf-presentation-july-2011 6/51
BRAZILIAN MARKET OPPORTUNITIES
6
7/30/2019 BVMF Presentation - July 2011
http://slidepdf.com/reader/full/bvmf-presentation-july-2011 7/51
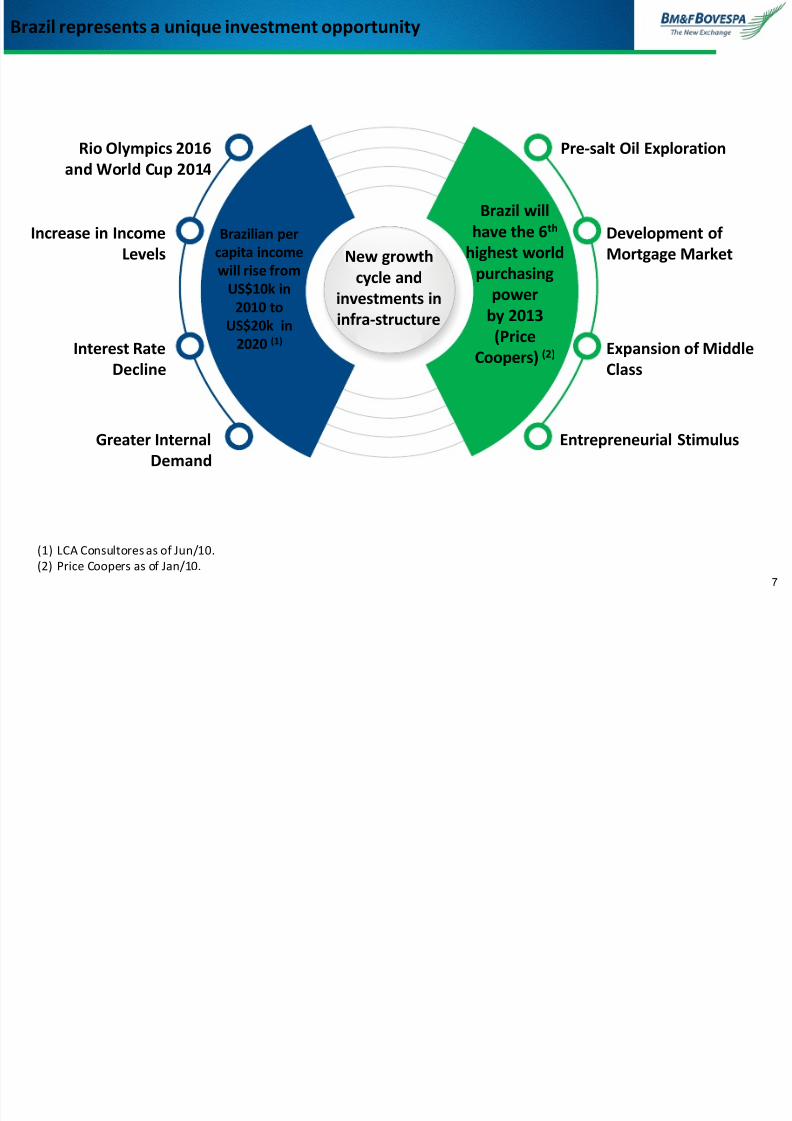
Brazil represents a unique investment opportunity
New growth
cycle andinvestments in
infra-structure
Pre-salt Oil Exploration
Development of
Mortgage Market
Expansion of Middle
Class
Entrepreneurial StimulusGreater Internal
Demand
Rio Olympics 2016
and World Cup 2014
Increase in Income
Levels
Interest Rate
Decline
Brazil will
have the 6th
highest world
purchasingpower
by 2013
(Price
Coopers) (2)
Brazilian per
capita income
will rise fromUS$10k in
2010 to
US$20k in
2020 (1)
(1) LCA Consultores as of Jun/10.(2) Price Coopers as of Jan/10.
7

7/30/2019 BVMF Presentation - July 2011
http://slidepdf.com/reader/full/bvmf-presentation-july-2011 8/51
J a n - 0 5
J u l - 0 5
J a n - 0 6
J u l - 0 6
J a n - 0 7
J u l - 0 7
J a n - 0 8
J u l - 0 8
J a n - 0 9
J u l - 0 9
J a n - 1 0
J u l - 1 0
J a n - 1 1
Source: ABRAPP, WFE and BM&FBOVESPA8
Equity Market (BOVESPA Segment)Low penetration in the Brazilian market
Clients base: huge potential in retail and pension funds segments
Number of custody accounts (thousands)
128.6
Jun’11
632.4
Pension funds portfolioLow penetration of equity and
derivatives in the main investors’portfolios
Stable and “low” interest rateenvironment encourage more
exposure in equities
Recent growth in the number of retail investors, but still low
compared to other markets
Listed Companies
Low number of listed companies compared to othercountries
Lack of important economic sectors in the exchange,for instance: oil & gas, infrastructure, retail, IT andpharmaceutical,
Investment cycle may bring new companies andsectors to the exchange
Currently, SMEs are not able to raise money throughequity easily
Dec’10 Listed Companies (27th in the World)
6,586
5,095
3,741 3,566 3,476 3,3452,966
1,999 1,798
379
India USA Canada Japan China / HK Spain London Australia Korea Brazil
27.7%
30.9%72.3%
69.1%
2002 2010
% in Securities Fixed Income and Others
BRL168.5 billion
BRL501.5 billion
7/30/2019 BVMF Presentation - July 2011
http://slidepdf.com/reader/full/bvmf-presentation-july-2011 9/519
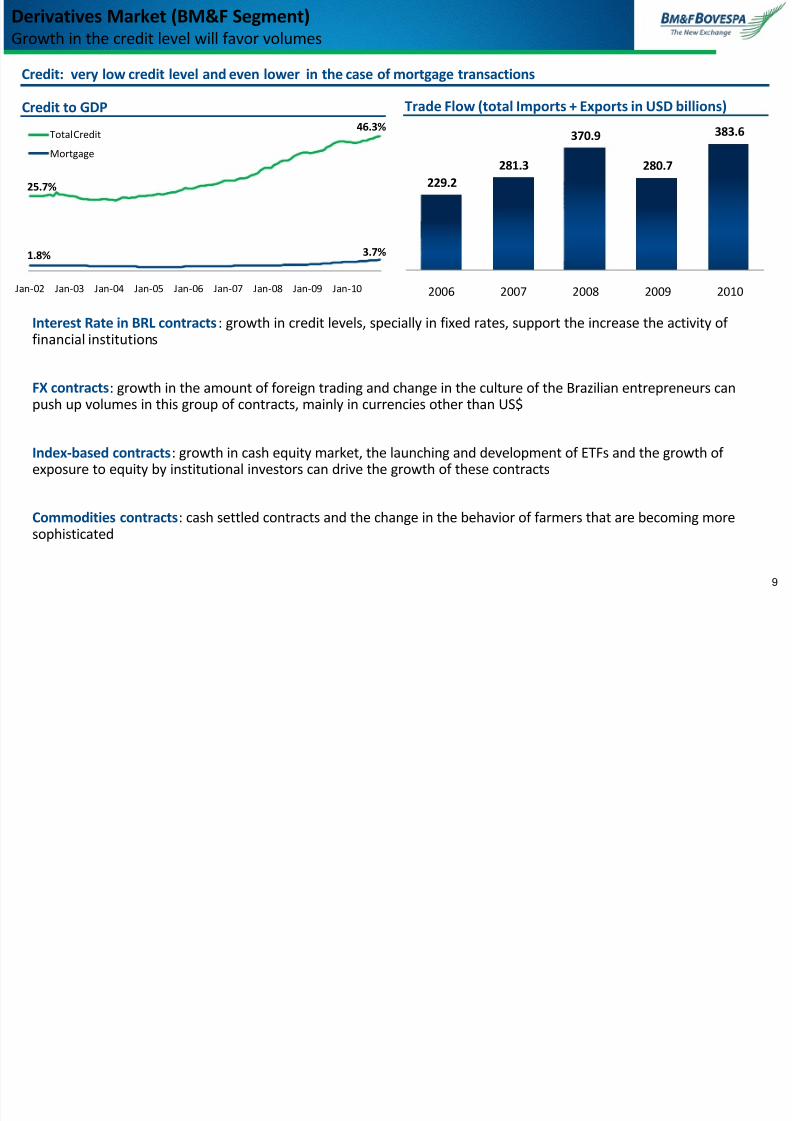
Derivatives Market (BM&F Segment)Growth in the credit level will favor volumes
Credit: very low credit level and even lower in the case of mortgage transactions
Credit to GDP
Interest Rate in BRL contracts: growth in credit levels, specially in fixed rates, support the increase the activity of financial institutions
FX contracts: growth in the amount of foreign trading and change in the culture of the Brazilian entrepreneurs canpush up volumes in this group of contracts, mainly in currencies other than US$
Index-based contracts: growth in cash equity market, the launching and development of ETFs and the growth of exposure to equity by institutional investors can drive the growth of these contracts
Commodities contracts: cash settled contracts and the change in the behavior of farmers that are becoming moresophisticated
Trade Flow (total Imports + Exports in USD billions)
25.7%
46.3%
1.8% 3.7%
Jan-02 Jan-03 Jan-04 Jan-05 Jan-06 Jan-07 Jan-08 Jan-09 Jan-10
Total CreditMortgage
229.2
281.3
370.9
280.7
383.6
2006 2007 2008 2009 2010

7/30/2019 BVMF Presentation - July 2011
http://slidepdf.com/reader/full/bvmf-presentation-july-2011 10/51
MAIN INITIATIVES
10
h f d
7/30/2019 BVMF Presentation - July 2011
http://slidepdf.com/reader/full/bvmf-presentation-july-2011 11/51
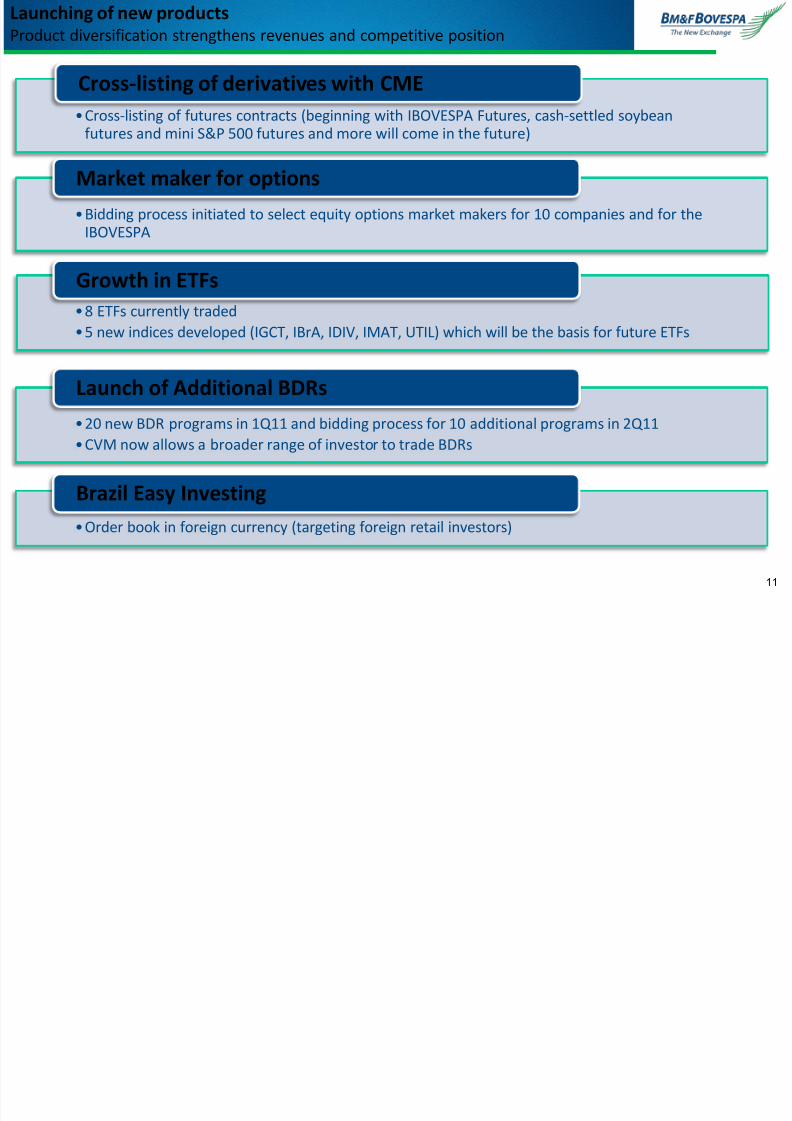
Launching of new productsProduct diversification strengthens revenues and competitive position
•8 ETFs currently traded
•5 new indices developed (IGCT, IBrA, IDIV, IMAT, UTIL) which will be the basis for future ETFs
Growth in ETFs
•Bidding process initiated to select equity options market makers for 10 companies and for theIBOVESPA
Market maker for options
•Cross-listing of futures contracts (beginning with IBOVESPA Futures, cash-settled soybean
futures and mini S&P 500 futures and more will come in the future)
Cross-listing of derivatives with CME
•20 new BDR programs in 1Q11 and bidding process for 10 additional programs in 2Q11
•CVM now allows a broader range of investor to trade BDRs
Launch of Additional BDRs
•Order book in foreign currency (targeting foreign retail investors)
Brazil Easy Investing
11

7/30/2019 BVMF Presentation - July 2011
http://slidepdf.com/reader/full/bvmf-presentation-july-2011 12/51
Retail Investors: less than 0.5% of the population invest
in stocks Marketing campaign that will be released in mass
medias (wanna be a shareholder?) and educationalprograms
HFT: unexplored market by these group of investors
IT developments, pricing policy and sales force
Foreign Investors: a high number of investors are not inBrazil yet
Strengthening the sales force, quotes in other
currencies and DMA
12
Institutional key drivers to attract new investors to the market
New Participants:
Listed Companies: around 400 companies not properly reflect the diversity of BrazilianEconomy
Developing a listing segment for SMEs and educational initiatives for entrepreneurs
7/30/2019 BVMF Presentation - July 2011
http://slidepdf.com/reader/full/bvmf-presentation-july-2011 13/51
Excellence in IT Solutions and Post-Trading Services
13
Market Access
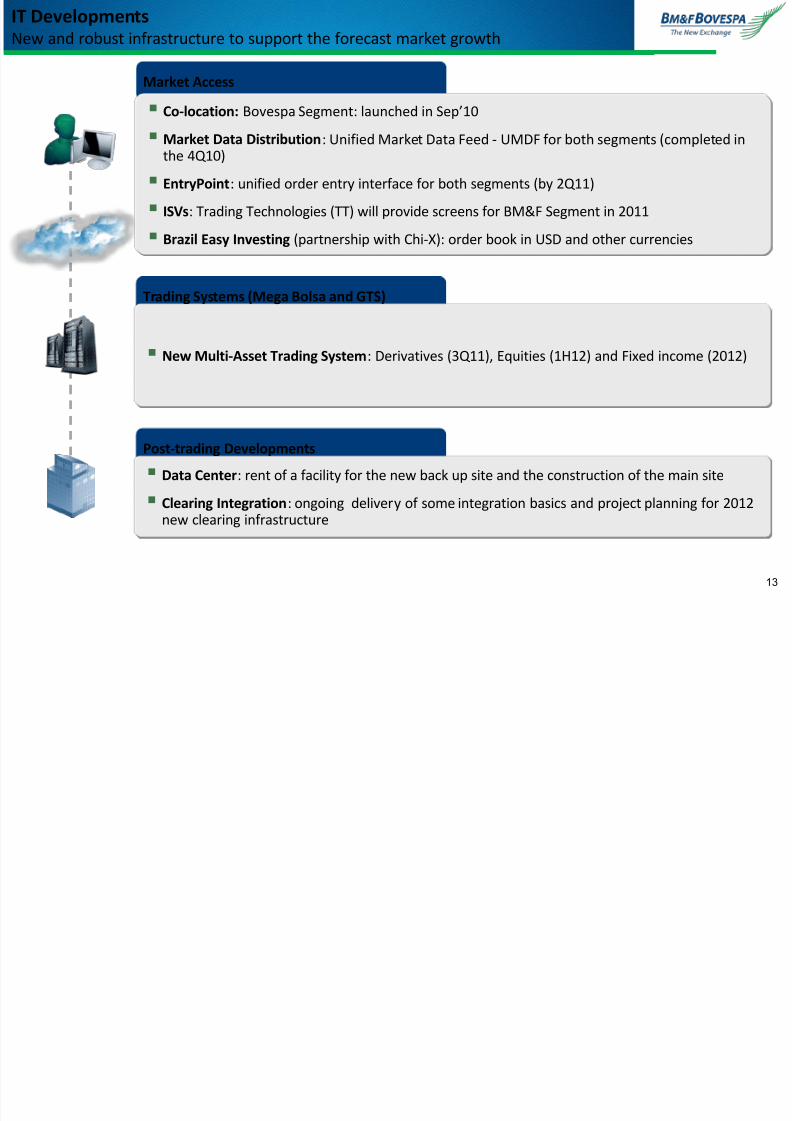
Co-location: Bovespa Segment: launched in Sep’10
Market Data Distribution: Unified Market Data Feed - UMDF for both segments (completed inthe 4Q10)
EntryPoint: unified order entry interface for both segments (by 2Q11)
ISVs: Trading Technologies (TT) will provide screens for BM&F Segment in 2011
Brazil Easy Investing (partnership with Chi-X): order book in USD and other currencies
Trading Systems (Mega Bolsa and GTS)
New Multi-Asset Trading System: Derivatives (3Q11), Equities (1H12) and Fixed income (2012)
Post-trading Developments
Data Center: rent of a facility for the new back up site and the construction of the main site
Clearing Integration: ongoing delivery of some integration basics and project planning for 2012new clearing infrastructure
IT DevelopmentsNew and robust infrastructure to support the forecast market growth
7/30/2019 BVMF Presentation - July 2011
http://slidepdf.com/reader/full/bvmf-presentation-july-2011 14/51
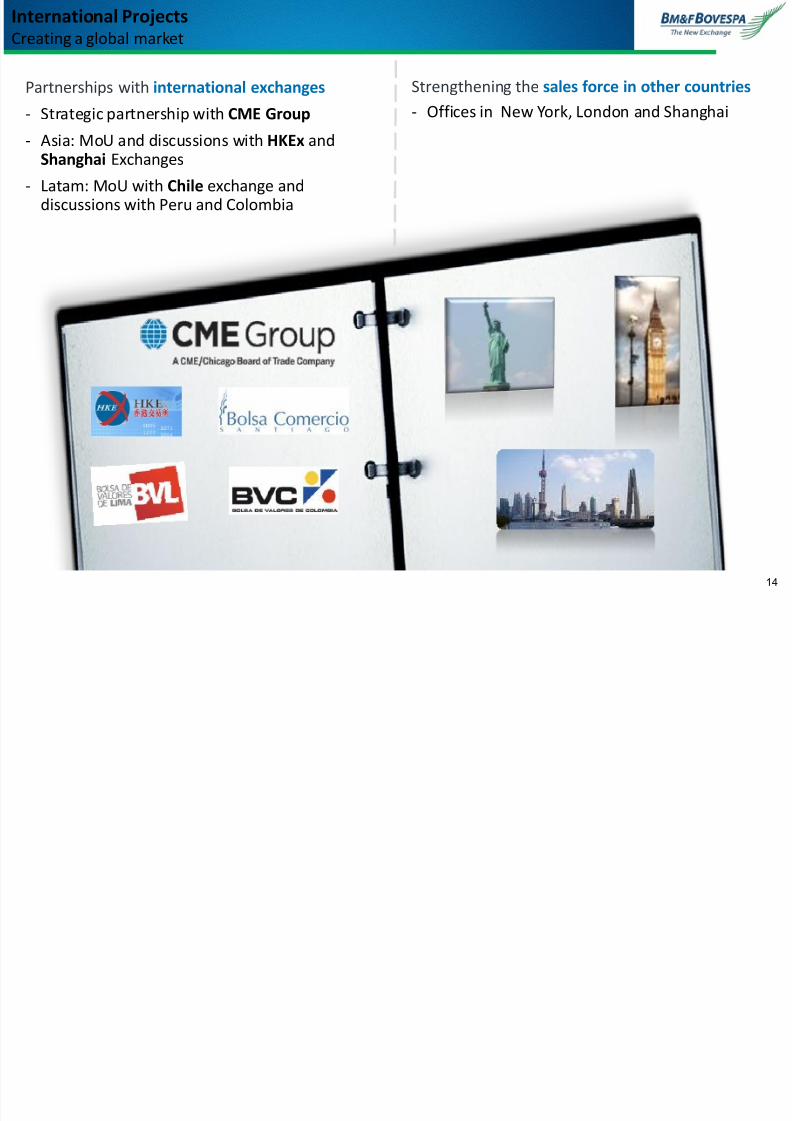
Strengthening the sales force in other countries
- Offices in New York, London and Shanghai
Partnerships with international exchanges
- Strategic partnership with CME Group
- Asia: MoU and discussions with HKEx andShanghai Exchanges
- Latam: MoU with Chile exchange anddiscussions with Peru and Colombia
International ProjectsCreating a global market
14

7/30/2019 BVMF Presentation - July 2011
http://slidepdf.com/reader/full/bvmf-presentation-july-2011 15/51
BUSINESS MODEL AND REGULATORY
FRAMEWORK
15
i k l il d i h
7/30/2019 BVMF Presentation - July 2011
http://slidepdf.com/reader/full/bvmf-presentation-july-2011 16/51
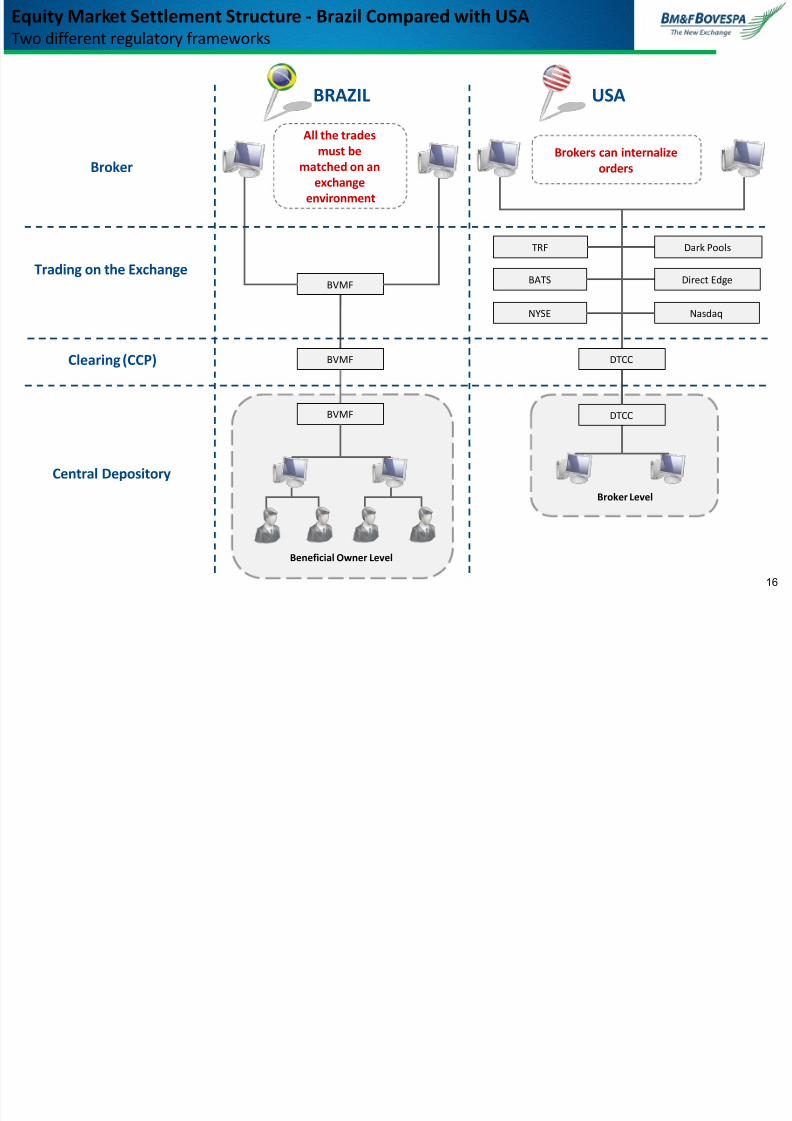
BRAZIL USA
BVMF
BVMF
BVMF
DTCC
DTCC
NYSE Nasdaq
BATS Direct Edge
TRF Dark Pools
Beneficial Owner Level
Broker Level
All the tradesmust be
matched on an
exchange
environment
Brokers can internalize
orders
Central Depository
Clearing (CCP)
Trading on the Exchange
Broker
Equity Market Settlement Structure - Brazil Compared with USATwo different regulatory frameworks
16
7/30/2019 BVMF Presentation - July 2011
http://slidepdf.com/reader/full/bvmf-presentation-july-2011 17/51
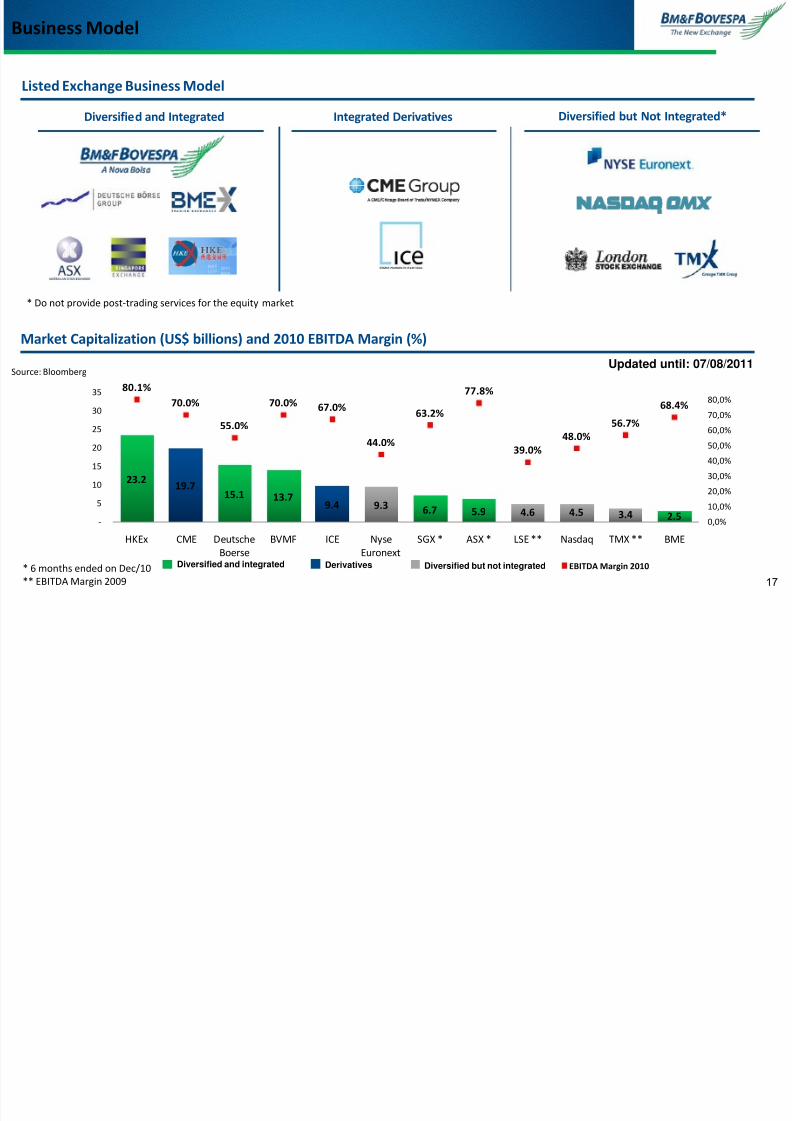
Updated until: 07/08/2011
Market Capitalization (US$ billions) and 2010 EBITDA Margin (%)
Listed Exchange Business Model
Diversified and Integrated Integrated Derivatives Diversified but Not Integrated*
* Do not provide post-trading services for the equity market
Diversified and integrated Derivatives Diversified but not integrated
Business Model
17
Source: Bloomberg
* 6 months ended on Dec/10
** EBITDA Margin 2009
23.219.7
15.1 13.79.4 9.3 6.7 5.9 4.6 4.5 3.4 2.5
80.1%
70.0%
55.0%
70.0% 67.0%
44.0%
63.2%
77.8%
39.0%
48.0%
56.7%
68.4%
0,0%
10,0%
20,0%
30,0%
40,0%
50,0%
60,0%70,0%
80,0%
-
5
10
15
20
25
30
35
HKEx CME Deutsche
Boerse
BVMF ICE Nyse
Euronext
SGX * ASX * LSE ** Nasdaq TMX ** BME
EBITDA Margin 2010
B ili M k t R l t F k
7/30/2019 BVMF Presentation - July 2011
http://slidepdf.com/reader/full/bvmf-presentation-july-2011 18/51
Brokers &
investors
Trading
Pos-Trading
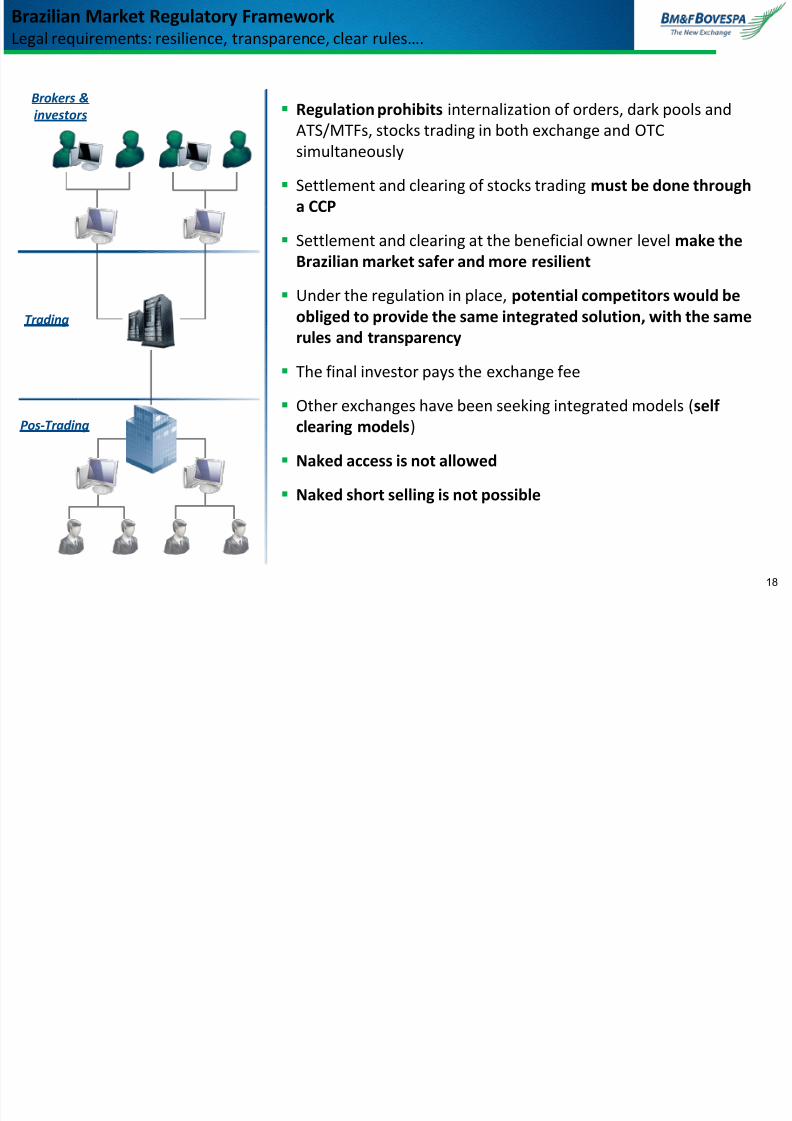
Regulation prohibits internalization of orders, dark pools and
ATS/MTFs, stocks trading in both exchange and OTC
simultaneously
Settlement and clearing of stocks trading must be done through
a CCP
Settlement and clearing at the beneficial owner level make the
Brazilian market safer and more resilient
Under the regulation in place, potential competitors would be
obliged to provide the same integrated solution, with the same
rules and transparency
The final investor pays the exchange fee
Other exchanges have been seeking integrated models (self
clearing models)
Naked access is not allowed
Naked short selling is not possible
18
Brazilian Market Regulatory FrameworkLegal requirements: resilience, transparence, clear rules….
BM&FBOVESPA C titi St th
7/30/2019 BVMF Presentation - July 2011
http://slidepdf.com/reader/full/bvmf-presentation-july-2011 19/5119
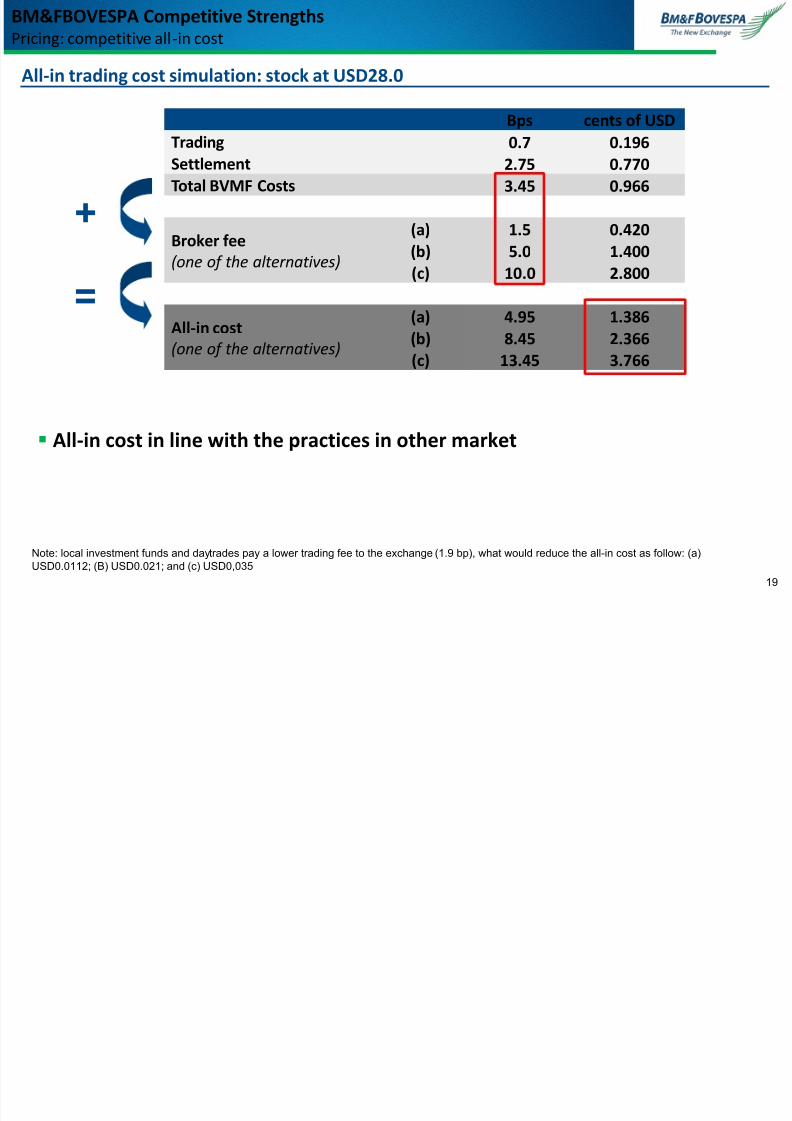
BM&FBOVESPA Competitive StrengthsPricing: competitive all-in cost
Bps cents of USD
Trading 0.7 0.196Settlement 2.75 0.770
Total BVMF Costs 3.45 0.966
Broker fee
(one of the alternatives)
(a) 1.5 0.420
(b) 5.0 1.400
(c) 10.0 2.800
All-in cost
(one of the alternatives)
(a) 4.95 1.386
(b) 8.45 2.366
(c) 13.45 3.766
All-in trading cost simulation: stock at USD28.0
All-in cost in line with the practices in other market
Note: local investment funds and daytrades pay a lower trading fee to the exchange (1.9 bp), what would reduce the all-in cost as follow: (a)USD0.0112; (B) USD0.021; and (c) USD0,035
+
=
7/30/2019 BVMF Presentation - July 2011
http://slidepdf.com/reader/full/bvmf-presentation-july-2011 20/51
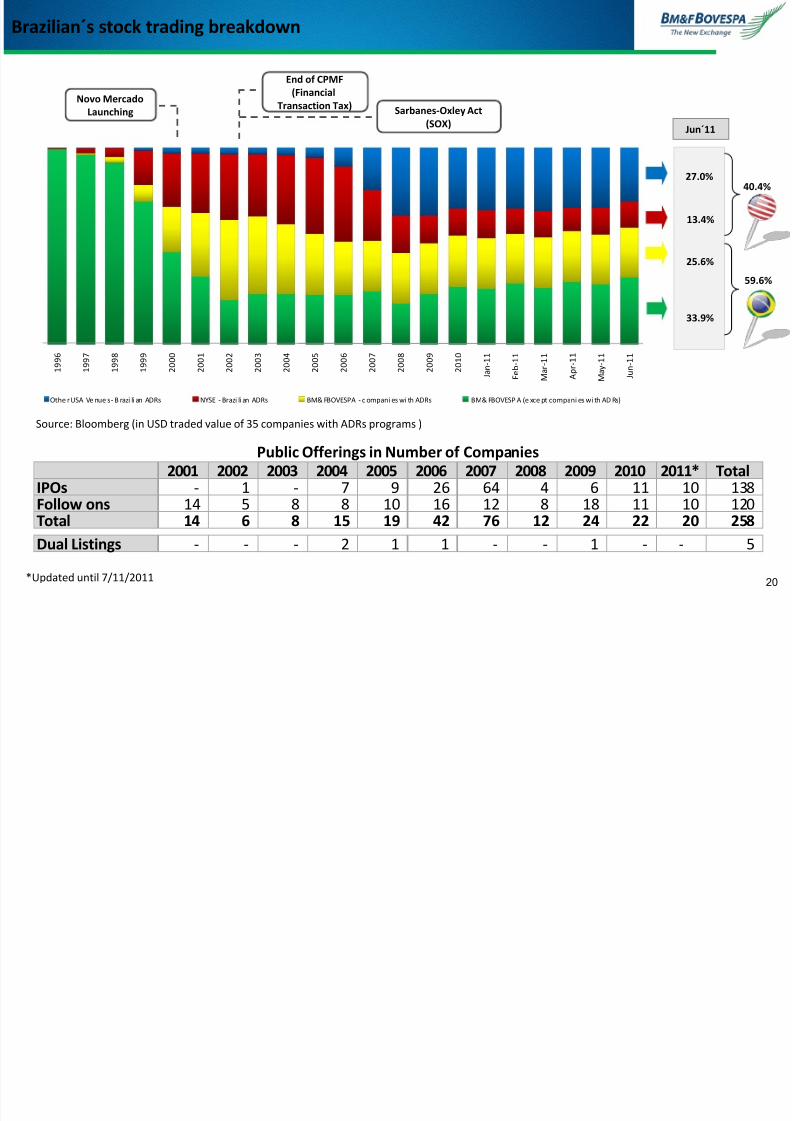
33.9%
25.6%
13.4%
27.0%
Jun´11
Source: Bloomberg (in USD traded value of 35 companies with ADRs programs )
End of CPMF
(Financial
Transaction Tax) Sarbanes-Oxley Act
(SOX)
*Updated until 7/11/2011
40.4%
59.6%
Novo Mercado
Launching
20
Brazilian´s stock trading breakdown
1 9 9 6
1 9 9 7
1 9 9 8
1 9 9 9
2 0 0 0
2 0 0 1
2 0 0 2
2 0 0 3
2 0 0 4
2 0 0 5
2 0 0 6
2 0 0 7
2 0 0 8
2 0 0 9
2 0 1 0
J a n - 1 1
F e b - 1 1
M a r - 1 1
A p r - 1 1
M a y - 1 1
J u n - 1 1
Othe r USA Ve nue s - B razi li an ADRs NYSE - Brazi li an ADRs BM& FBOVESPA - c ompani es wi th ADRs BM& FBOVESP A (e xce pt compani es wi th AD Rs)
2001 2002 2003 2004 2005 2006 2007 2008 2009 2010 2011* TotalIPOs - 1 - 7 9 26 64 4 6 11 10 138 Follow ons 14 5 8 8 10 16 12 8 18 11 10 120 Total 14 6 8 15 19 42 76 12 24 22 20 258
Dual Listings - - - 2 1 1 - - 1 - - 5
Public Offerings in Number of Companies

7/30/2019 BVMF Presentation - July 2011
http://slidepdf.com/reader/full/bvmf-presentation-july-2011 21/51
OPERATIONAL HIGHLIGHTS
21
7/30/2019 BVMF Presentation - July 2011
http://slidepdf.com/reader/full/bvmf-presentation-july-2011 22/51
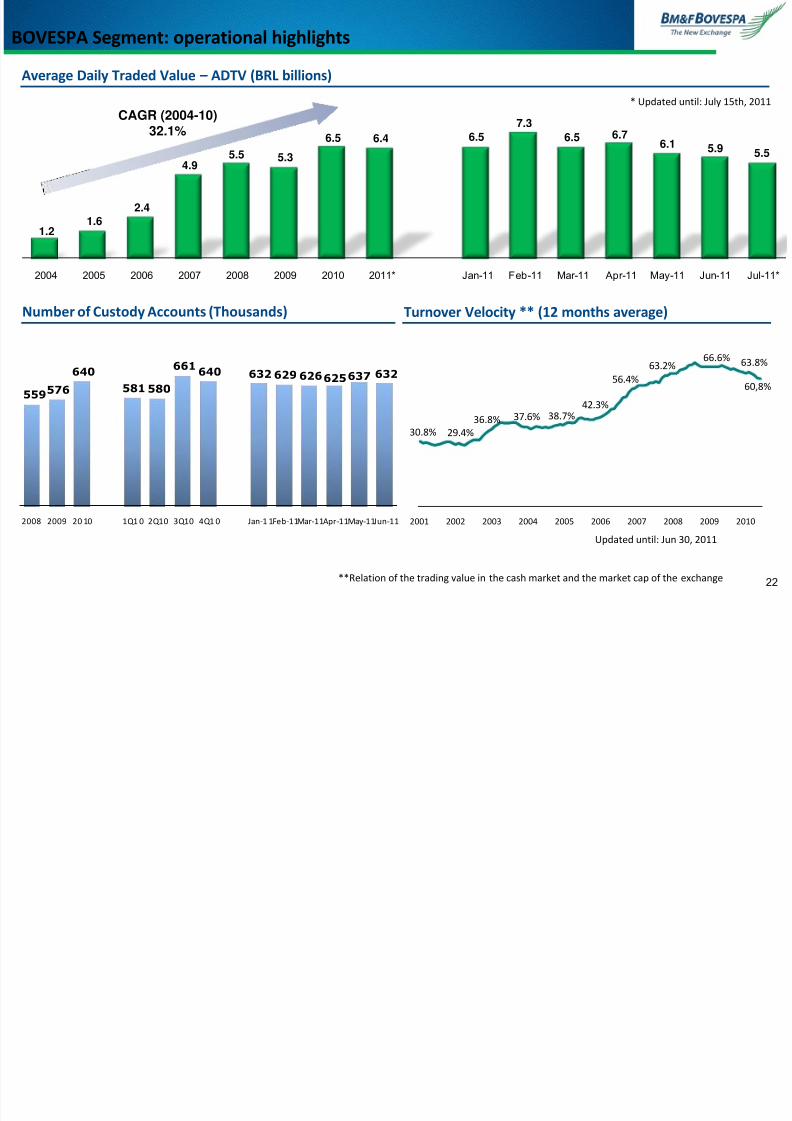
1.21.6
2.4
4.9
5.5 5.3
6.5 6.46.5
7.3
6.5
6.7
6.1 5.95.5
2004 2005 2006 2007 2008 2009 2010 2011* Jan-11 Feb-11 Mar-11 Apr-11 May-11 Jun-11 Jul-11*
**Relation of the trading value in the cash market and the market cap of the exchange
Updated until: Jun 30, 2011
22
BOVESPA Segment: operational highlights
Average Daily Traded Value – ADTV (BRL billions)
Number of Custody Accounts (Thousands) Turnover Velocity ** (12 months average)
CAGR (2004-10)32.1%
559576
640
581580
661640 632629626625637
632
2008 2009 20 10 1Q1 0 2Q10 3Q10 4Q1 0 Jan-1 1Feb-11Mar-11Apr-11May-11Jun-11
30.8% 29.4%36.8% 37.6% 38.7%
42.3%
56.4%
63.2%66.6% 63.8%
60,8%
2001 2002 2003 2004 2005 2006 2007 2008 2009 2010
* Updated until: July 15th, 2011
7/30/2019 BVMF Presentation - July 2011
http://slidepdf.com/reader/full/bvmf-presentation-july-2011 23/51
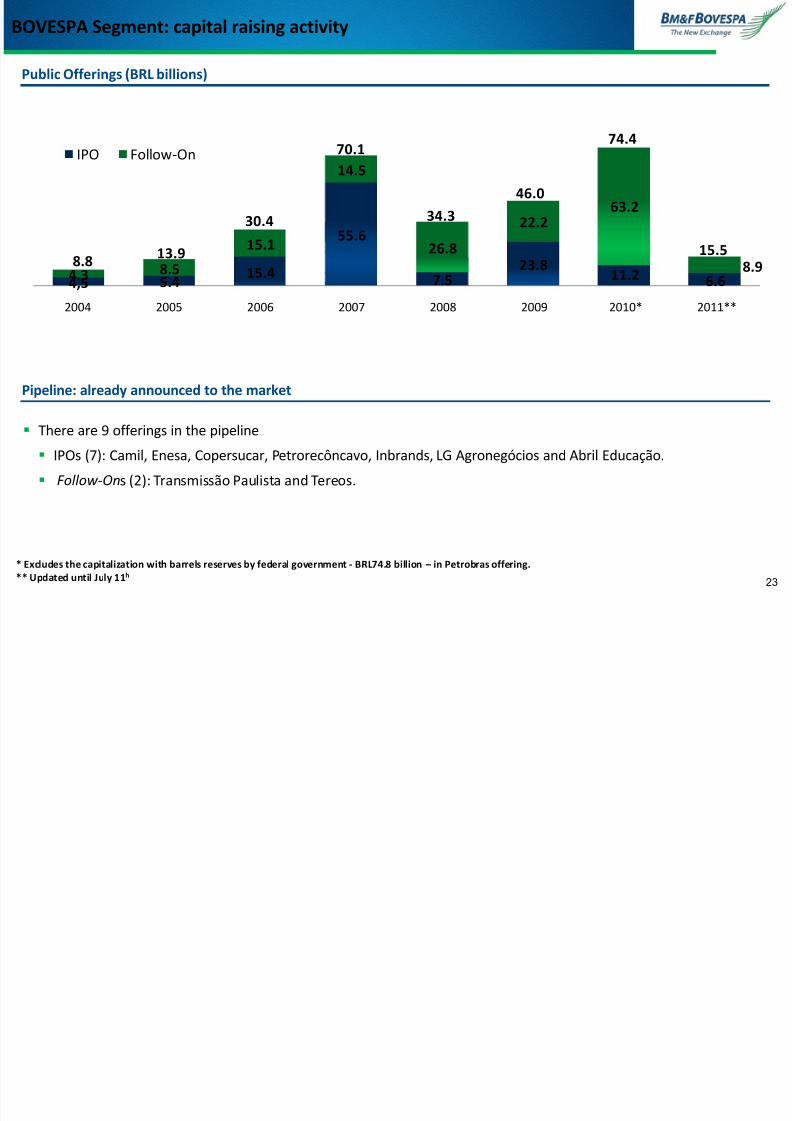
BOVESPA Segment: capital raising activity
There are 9 offerings in the pipeline
IPOs (7): Camil, Enesa, Copersucar, Petrorecôncavo, Inbrands, LG Agronegócios and Abril Educação.
Follow-Ons (2): Transmissão Paulista and Tereos.
23
* Excludes the capitalization with barrels reserves by federal government - BRL74.8 billion – in Petrobras offering.
** Updated until July 11h
Public Offerings (BRL billions)
Pipeline: already announced to the market
4,5 5.4 15.4
55.6
7.5
23.8
11.2 6.64.38.5
15.1
14.5
26.8
22.263.2
8.9
2004 2005 2006 2007 2008 2009 2010* 2011**
IPO Follow-On
8.813.9
30.4
70.1
34.3
46.0
74.4
15.5
BOVESPA Segment
7/30/2019 BVMF Presentation - July 2011
http://slidepdf.com/reader/full/bvmf-presentation-july-2011 24/51
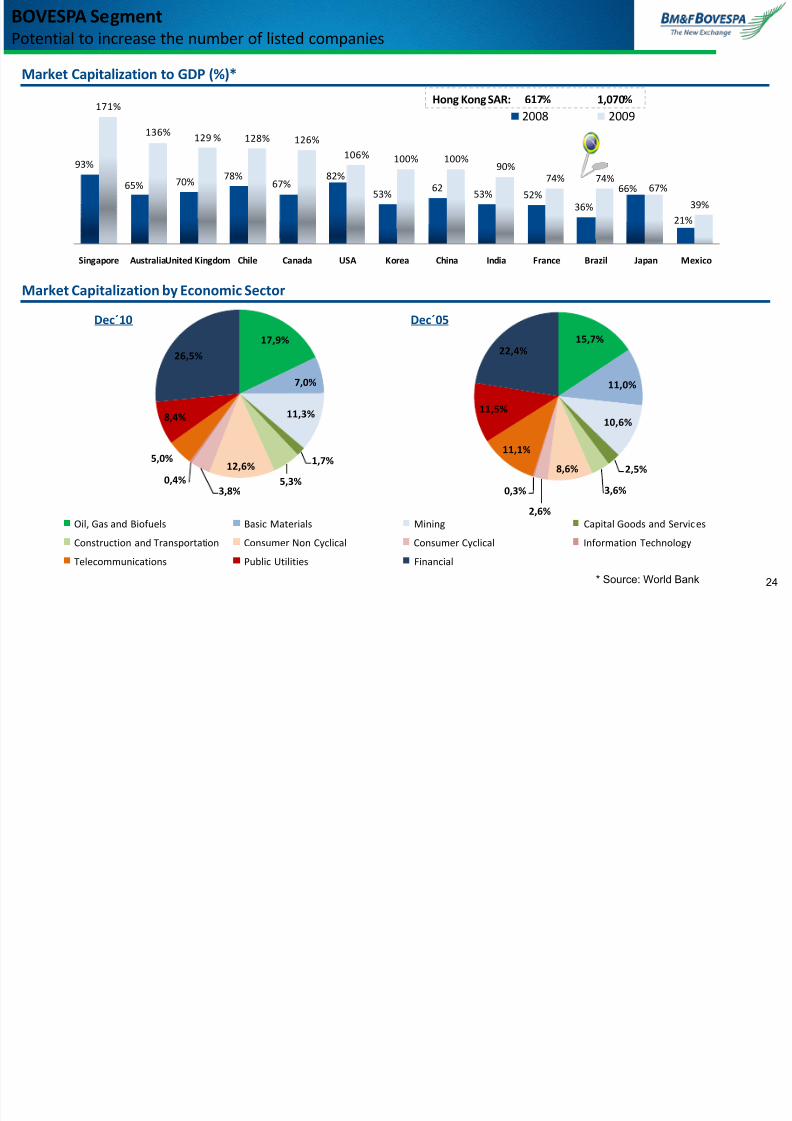
17,9%
7,0%
11,3%
1,7%
5,3%
12,6%
3,8%0,4%
5,0%
8,4%
26,5%
Oil, Gas and Biofuels Basic Materials Mining Capital Goods and Services
Construction and Transportation Consumer Non Cyclical Consumer Cyclical Information Technology
Telecommunications Public Utilities Financial
15,7%
11,0%
10,6%
2,5%
3,6%
8,6%
2,6%
0,3%
11,1%
11,5%
22,4%
Dec´10 Dec´05
Market Capitalization to GDP (%)*
Market Capitalization by Economic Sector
BOVESPA SegmentPotential to increase the number of listed companies
93%
65% 70%78%
67%82%
53%62
53% 52%36%
66%
21%
171%
136%
129 % 128% 126%106% 100% 100%
90%74% 74%
67%
39%
Singapore AustraliaUnited Kingdom Chile Canada USA Korea China India France Brazil Japan Mexico
2008 2009
Hong Kong SAR: 617% 1,070%
* Source: World Bank 24
7/30/2019 BVMF Presentation - July 2011
http://slidepdf.com/reader/full/bvmf-presentation-july-2011 25/51
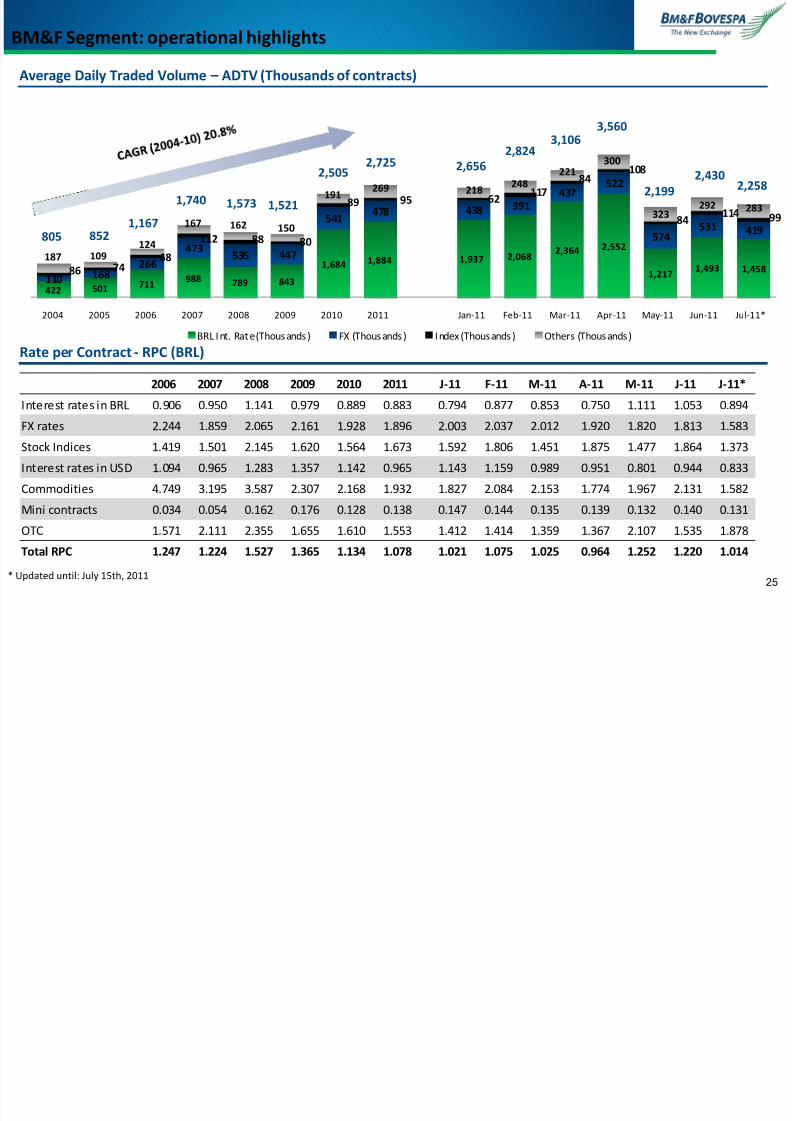
422 501 711 988 789 843
1,684 1,884 1,937 2,0682,364 2,552
1,2171,493 1,458
110 168
266
473535 447
541478 438 391
437522
574531 419
86 7468
112 88 80
89 95 62117
84108
84114 99
187 109124
167 162 150
191269 218
248221
300
323292 283
2004 2005 2006 2007 2008 2009 2010 2011 Jan-11 Feb-11 Mar-11 Apr-11 May-11 Jun-11 Jul-11*
BRL Int. Rate (Thousands) FX (Thousands) Index (Thousands) Others (Thousands)
* Updated until: July 15th, 201125
BM&F Segment: operational highlights
805 8521,167
1,740 1,573 1,521
2,5052,725
Average Daily Traded Volume – ADTV (Thousands of contracts)
Rate per Contract - RPC (BRL)
2,6562,824 3,106
3,560
2,199
2,4302,258
2006 2007 2008 2009 2010 2011 J-11 F-11 M-11 A-11 M-11 J-11 J-11*
Interest rates in BRL 0.906 0.950 1.141 0.979 0.889 0.883 0.794 0.877 0.853 0.750 1.111 1.053 0.894
FX rates 2.244 1.859 2.065 2.161 1.928 1.896 2.003 2.037 2.012 1.920 1.820 1.813 1.583
Stock Indices 1.419 1.501 2.145 1.620 1.564 1.673 1.592 1.806 1.451 1.875 1.477 1.864 1.373
Interest rates in USD 1.094 0.965 1.283 1.357 1.142 0.965 1.143 1.159 0.989 0.951 0.801 0.944 0.833
Commodities 4.749 3.195 3.587 2.307 2.168 1.932 1.827 2.084 2.153 1.774 1.967 2.131 1.582
Mini contracts 0.034 0.054 0.162 0.176 0.128 0.138 0.147 0.144 0.135 0.139 0.132 0.140 0.131
OTC 1.571 2.111 2.355 1.655 1.610 1.553 1.412 1.414 1.359 1.367 2.107 1.535 1.878
Total RPC 1.247 1.224 1.527 1.365 1.134 1.078 1.021 1.075 1.025 0.964 1.252 1.220 1.014
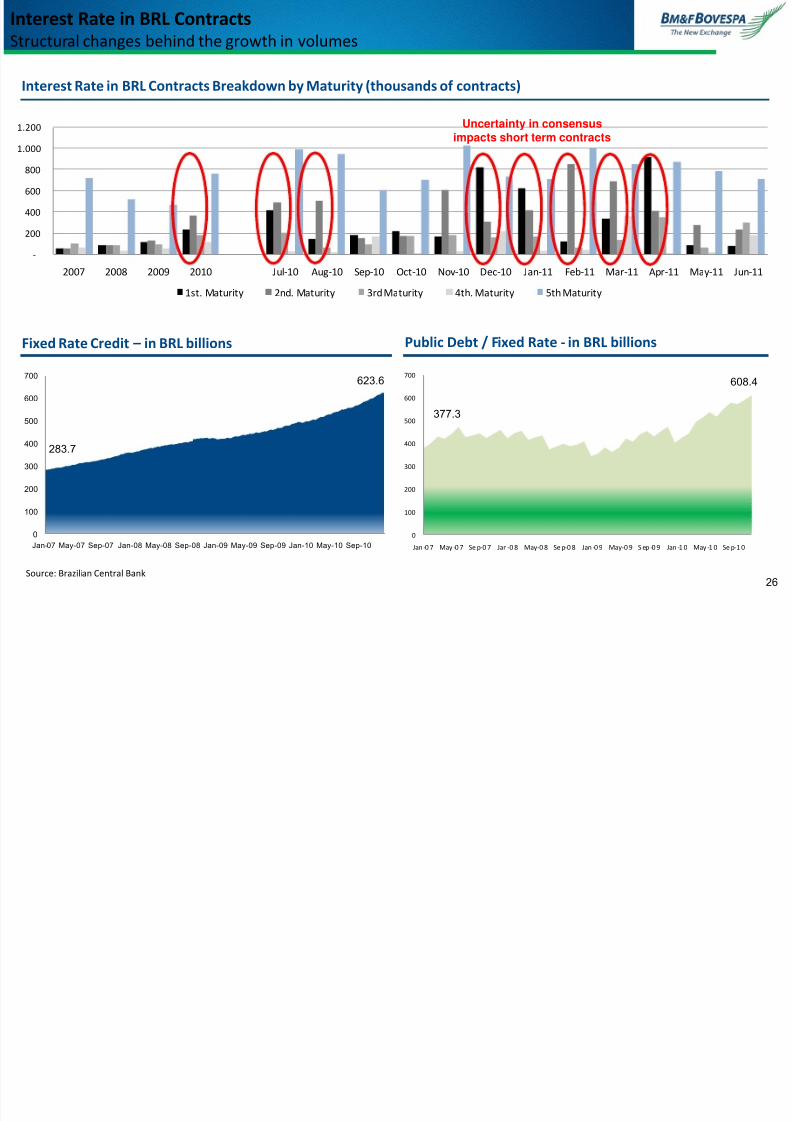
Interest Rate in BRL Contracts
7/30/2019 BVMF Presentation - July 2011
http://slidepdf.com/reader/full/bvmf-presentation-july-2011 26/51
-
200
400
600
800
1.000
1.200
2007 2008 2009 2010 Jul-10 Aug-10 Sep-10 Oct-10 Nov-10 Dec-10 Jan-11 Feb-11 Mar-11 Apr-11 May-11 Jun-11
1st. Maturity 2nd. Maturity 3rd Maturity 4th. Maturity 5th Maturity
26
Interest Rate in BRL ContractsStructural changes behind the growth in volumes
Interest Rate in BRL Contracts Breakdown by Maturity (thousands of contracts)
Uncertainty in consensus
impacts short term contracts
Fixed Rate Credit – in BRL billions Public Debt / Fixed Rate - in BRL billions
Source: Brazilian Central Bank
0
100
200
300
400
500
600
700
Jan-07 May-07 Sep-07 Jan-08 May-08 Sep-08 Jan-09 May-09 Sep-09 Jan-10 May-10 Sep-10
0
100
200
300
400
500
600
700
Jan -0 7 May -0 7 Se p-0 7 Jan-0 8 May-0 8 Se p-0 8 Jan -0 9 May-0 9 S ep -0 9 Jan -1 0 May -1 0 Se p-1 0
283.7
623.6
377.3
608.4
High Frequency Trading (HFT)
7/30/2019 BVMF Presentation - July 2011
http://slidepdf.com/reader/full/bvmf-presentation-july-2011 27/51
27
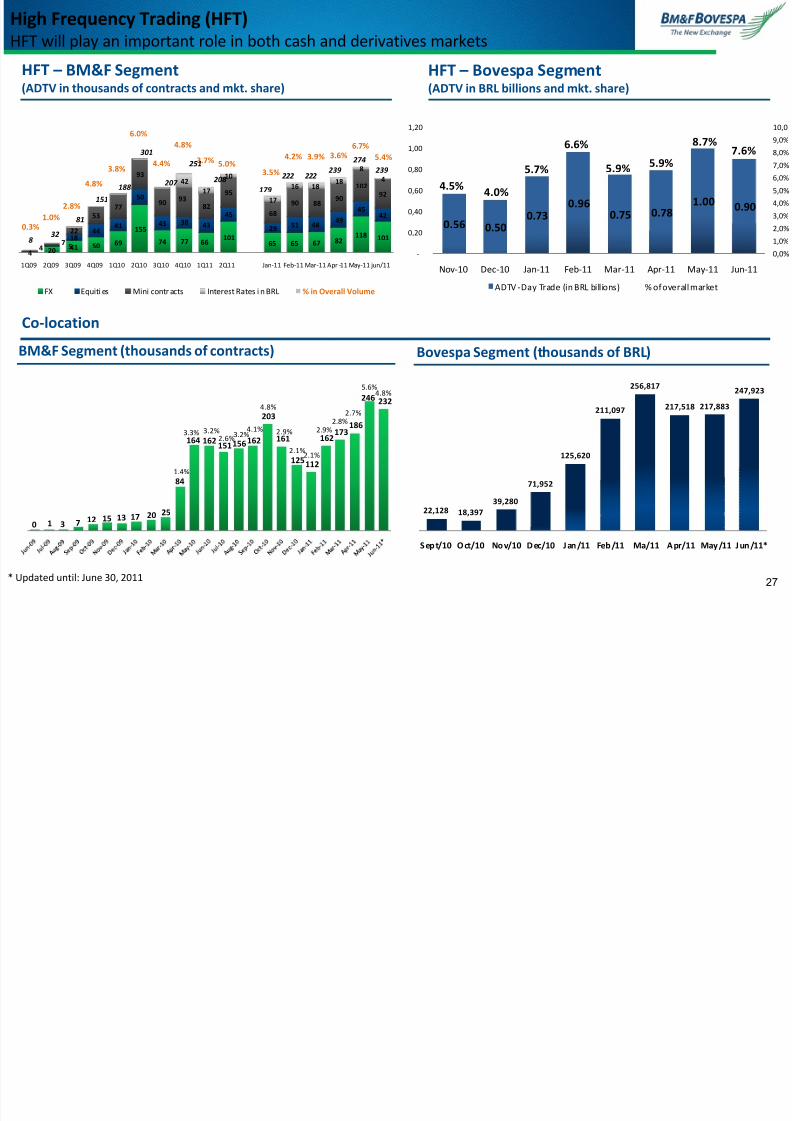
High Frequency Trading (HFT)HFT will play an important role in both cash and derivatives markets
HFT – BM&F Segment(ADTV in thousands of contracts and mkt. share)
HFT – Bovespa Segment(ADTV in BRL billions and mkt. share)
Co-location
BM&F Segment (thousands of contracts) Bovespa Segment (thousands of BRL)
* Updated until: June 30, 2011
22,128 18,397
39,280
71,952
125,620
211,097
256,817
217,518 217,883
247,923
S ept/10 O ct/10 Nov/10 Dec/10 Jan/11 Feb/11 Ma/11 A pr/11 May /11 Jun/11*
4 20 41 50 69
155
74 77 66101
65 65 67 82118 101
5
1844
41
50
43 38 43
45
2951 48
49
4542
47
22
53
77
93
9093
82
95
68
90 8890
10292
42
17
10
17
16 1818
8
4
0.3%1.0%
2.8%
4.8%
3.8%
6.0%
4.4%
4.8%
3.7% 5.0%3.5%
4.2% 3.9% 3.6%6.7%
5.4%
1Q09 2Q09 3Q09 4Q09 1Q10 2Q10 3Q10 4Q10 1Q11 2Q11 Jan-11 Feb-11 Mar-11 Apr -11 May-11 jun/11
FX Equiti es Mini contr acts Interest Rates i n BRL % in Overall Volume
8 32
81
151
188
301
207 208
251
179
222 222239
274
239
0 1 3 7 12 15 13 17 20 25
84
164 162151156162
203
161
125112
162173
186
246 232
3.2%
1.4%
3.3% 3.2%2.6%
4.1%
4.8%
2.9%
2.1%2.1%
2.9%2.8%
2.7%
5.6%4.8%
0.56 0.500.73
0.960.75 0.78
1.00 0.90
4.5%4.0%
5.7%
6.6%
5.9%5.9%
8.7% 7.6%
0,0%
1,0%
2,0%
3,0%
4,0%
5,0%
6,0%
7,0%
8,0%9,0%
10,0
-
0,20
0,40
0,60
0,80
1,00
1,20
Nov-10 Dec-10 Jan-11 Feb-11 Mar-11 Apr-11 May-11 Jun-11
ADTV -Day Trade (in BRL billions) % of overall market

7/30/2019 BVMF Presentation - July 2011
http://slidepdf.com/reader/full/bvmf-presentation-july-2011 28/51
28
Appendix
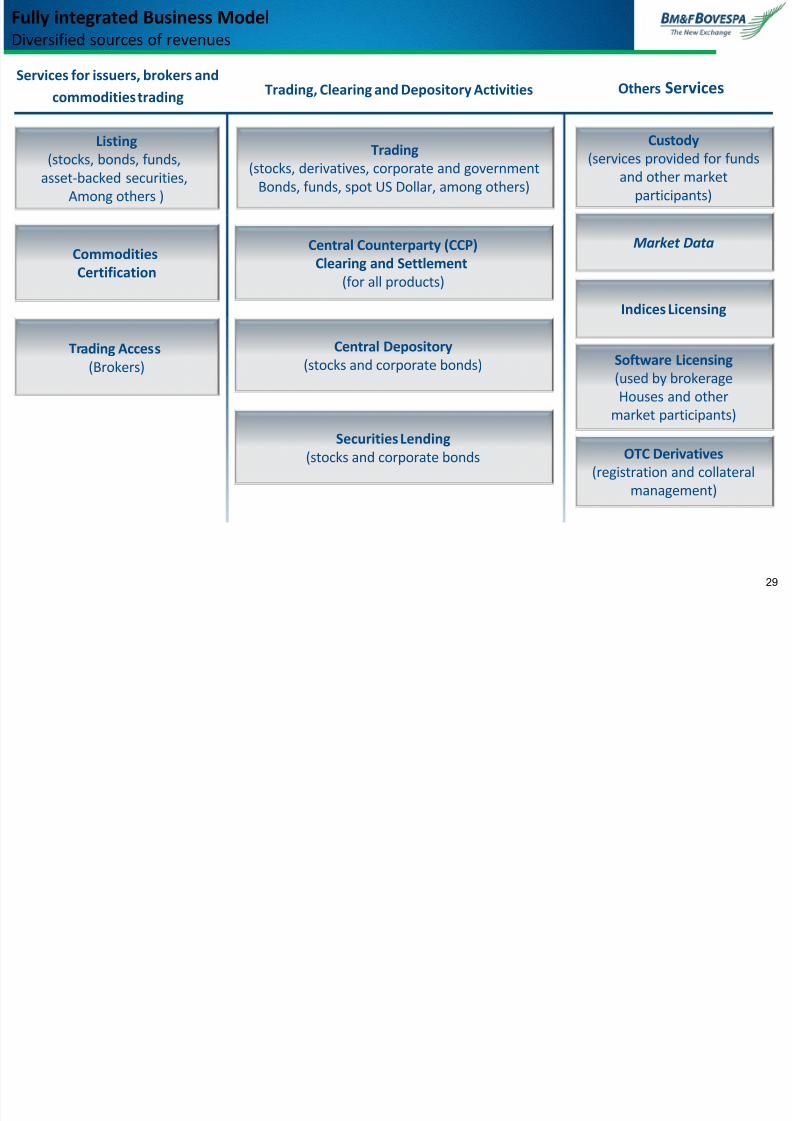
Fully integrated Business Model
7/30/2019 BVMF Presentation - July 2011
http://slidepdf.com/reader/full/bvmf-presentation-july-2011 29/51
Listing(stocks, bonds, funds,
asset-backed securities,
Among others )
Commodities
Certification
Trading
(stocks, derivatives, corporate and government
Bonds, funds, spot US Dollar, among others)
Central Counterparty (CCP)
Clearing and Settlement
(for all products)
Central Depository
(stocks and corporate bonds)
Securities Lending
(stocks and corporate bonds
Custody(services provided for funds
and other market
participants)
Market Data
Indices Licensing
Software Licensing
(used by brokerage
Houses and other
market participants)
OTC Derivatives
(registration and collateral
management)
Fully integrated Business ModelDiversified sources of revenues
Services for issuers, brokers and
commodities tradingTrading, Clearing and Depository Activities Others Services
29
Trading Access
(Brokers)
ll i l i d di i
7/30/2019 BVMF Presentation - July 2011
http://slidepdf.com/reader/full/bvmf-presentation-july-2011 30/51
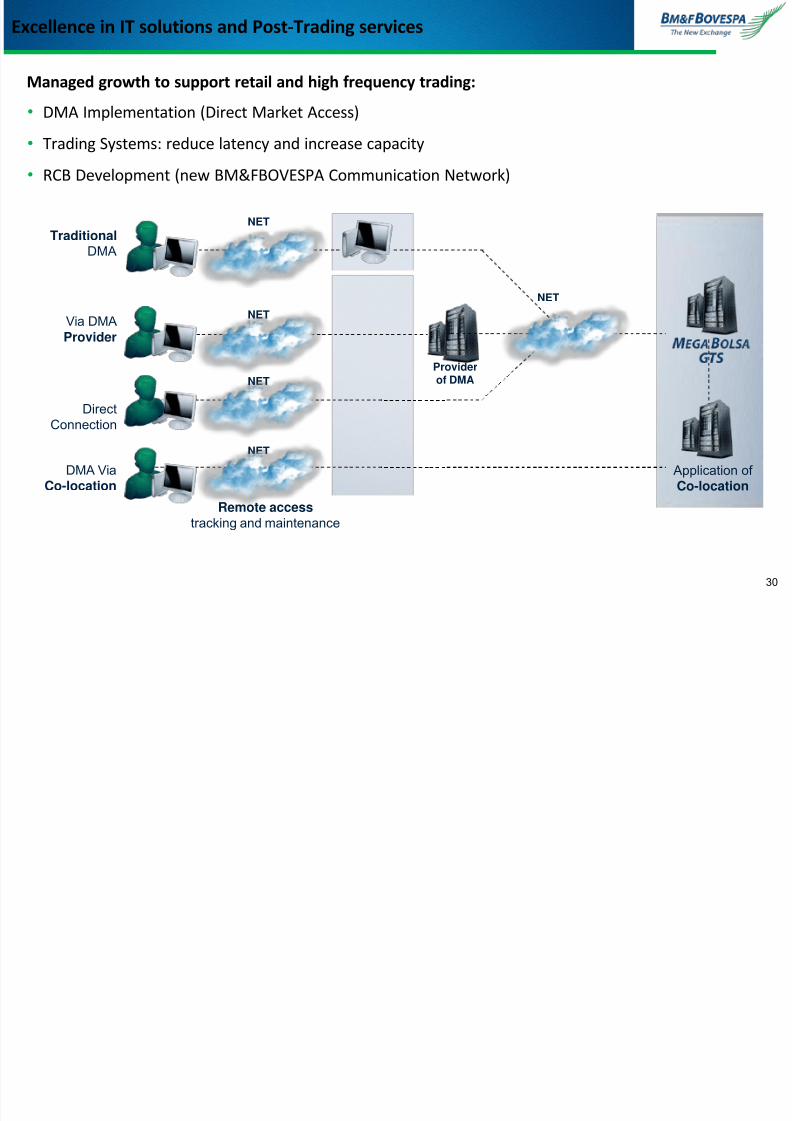
Managed growth to support retail and high frequency trading:
• DMA Implementation (Direct Market Access)
• Trading Systems: reduce latency and increase capacity
• RCB Development (new BM&FBOVESPA Communication Network)
DMA ViaCo-location
TraditionalDMA
Via DMAProvider
DirectConnection
NET
NET
NET
NET
Remote accesstracking and maintenance
Application of Co-location
NET
Providerof DMA
Excellence in IT solutions and Post-Trading services
30
BM&FBOVESPA Costs
7/30/2019 BVMF Presentation - July 2011
http://slidepdf.com/reader/full/bvmf-presentation-july-2011 31/51
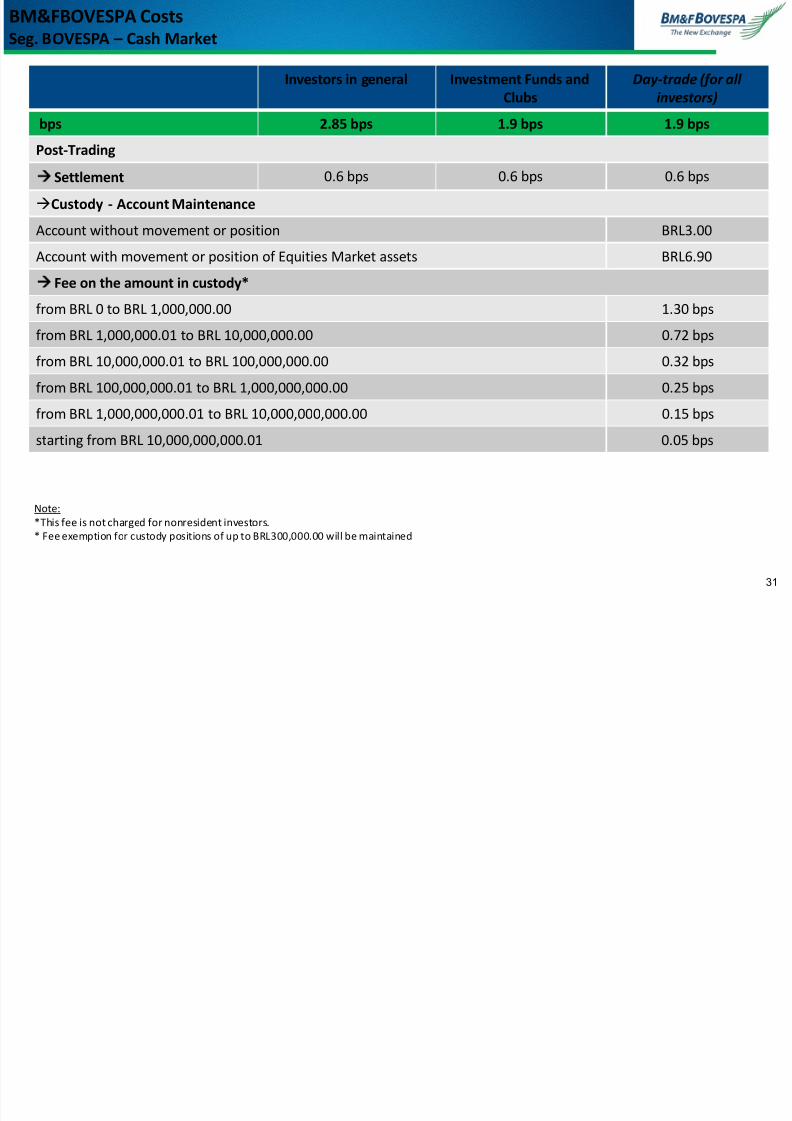
BM&FBOVESPA CostsSeg. BOVESPA – Cash Market
Investors in general Investment Funds and
Clubs
Day-trade (for all
investors)
bps 2.85 bps 1.9 bps 1.9 bps
Post-Trading
Settlement 0.6 bps 0.6 bps 0.6 bps
Custody - Account Maintenance
Account without movement or position BRL3.00
Account with movement or position of Equities Market assets BRL6.90
Fee on the amount in custody*
from BRL 0 to BRL 1,000,000.00 1.30 bps
from BRL 1,000,000.01 to BRL 10,000,000.00 0.72 bps
from BRL 10,000,000.01 to BRL 100,000,000.00 0.32 bps
from BRL 100,000,000.01 to BRL 1,000,000,000.00 0.25 bps
from BRL 1,000,000,000.01 to BRL 10,000,000,000.00 0.15 bpsstarting from BRL 10,000,000,000.01 0.05 bps
Note:
*This fee is not charged for nonresident investors.
* Fee exemption for custody positions of up to BRL300,000.00 will be maintained
31
N P d Pi li
High Frequency Trading - HFT
7/30/2019 BVMF Presentation - July 2011
http://slidepdf.com/reader/full/bvmf-presentation-july-2011 32/51
New Products Pipeline
32
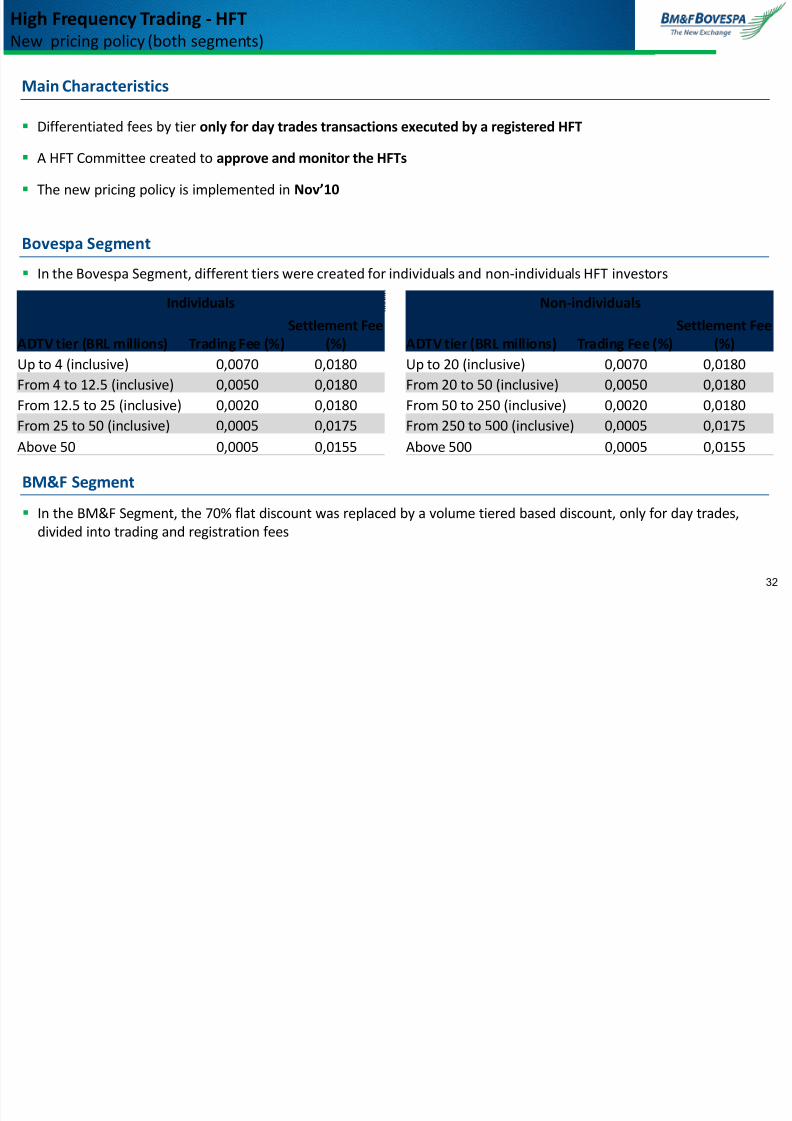
High Frequency Trading HFTNew pricing policy (both segments)
Main Characteristics
Differentiated fees by tier only for day trades transactions executed by a registered HFT
A HFT Committee created to approve and monitor the HFTs
The new pricing policy is implemented in Nov’10
Bovespa Segment
In the Bovespa Segment, different tiers were created for individuals and non-individuals HFT investors
BM&F Segment
In the BM&F Segment, the 70% flat discount was replaced by a volume tiered based discount, only for day trades,
divided into trading and registration fees
Individuals
ADTV tier (BRL millions) Trading Fee (%)
Settlement Fee
(%)
Up to 4 (inclusive) 0,0070 0,0180
From 4 to 12.5 (inclusive) 0,0050 0,0180
From 12.5 to 25 (inclusive) 0,0020 0,0180
From 25 to 50 (inclusive) 0,0005 0,0175
Above 50 0,0005 0,0155
Non-individuals
ADTV tier (BRL millions) Trading Fee (%)
Settlement Fee
(%)
Up to 20 (inclusive) 0,0070 0,0180
From 20 to 50 (inclusive) 0,0050 0,0180
From 50 to 250 (inclusive) 0,0020 0,0180
From 250 to 500 (inclusive) 0,0005 0,0175
Above 500 0,0005 0,0155
7/30/2019 BVMF Presentation - July 2011
http://slidepdf.com/reader/full/bvmf-presentation-july-2011 33/51
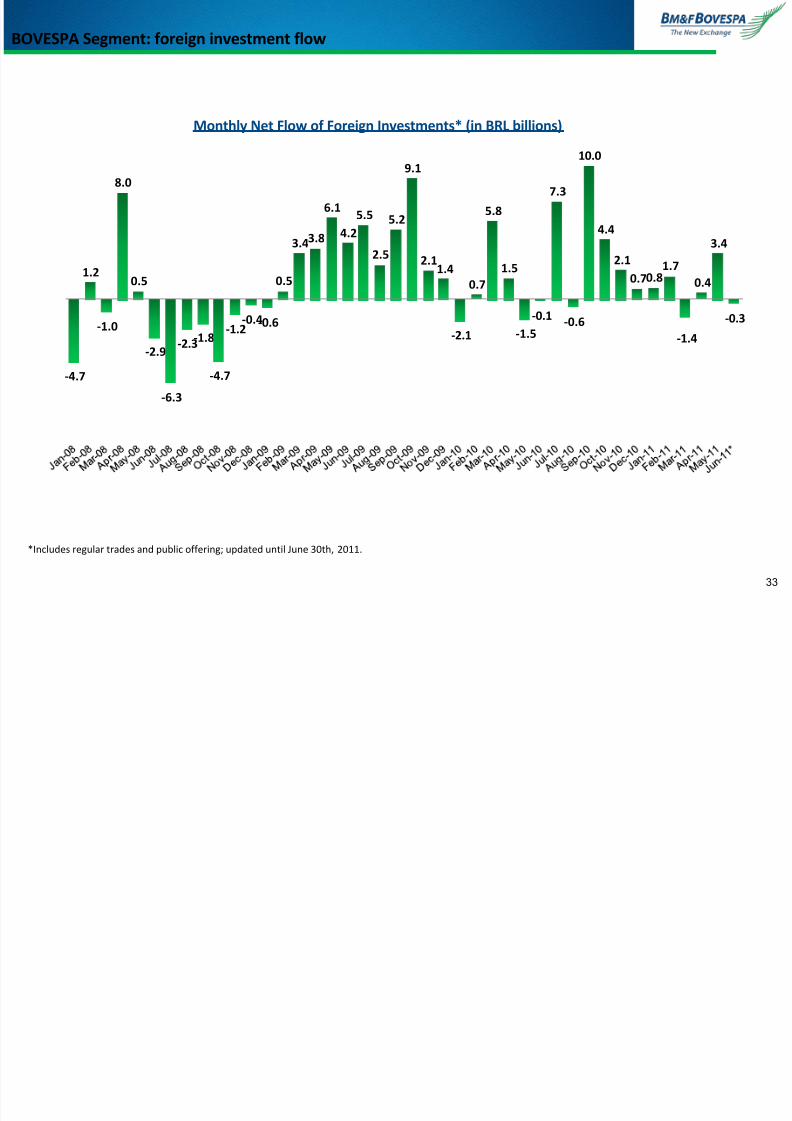
*Includes regular trades and public offering; updated until June 30th, 2011.
Monthly Net Flow of Foreign Investments* (in BRL billions)
BOVESPA Segment: foreign investment flow
33
-4.7
1.2
-1.0
8.0
0.5
-2.9
-6.3
-2.3-1.8
-4.7
-1.2-0.4-0.6
0.5
3.43.8
6.1
4.2
5.5
2.5
5.2
9.1
2.11.4
-2.1
0.7
5.8
1.5
-1.5
-0.1
7.3
-0.6
10.0
4.4
2.1
0.70.8
1.7
-1.4
0.4
3.4
-0.3
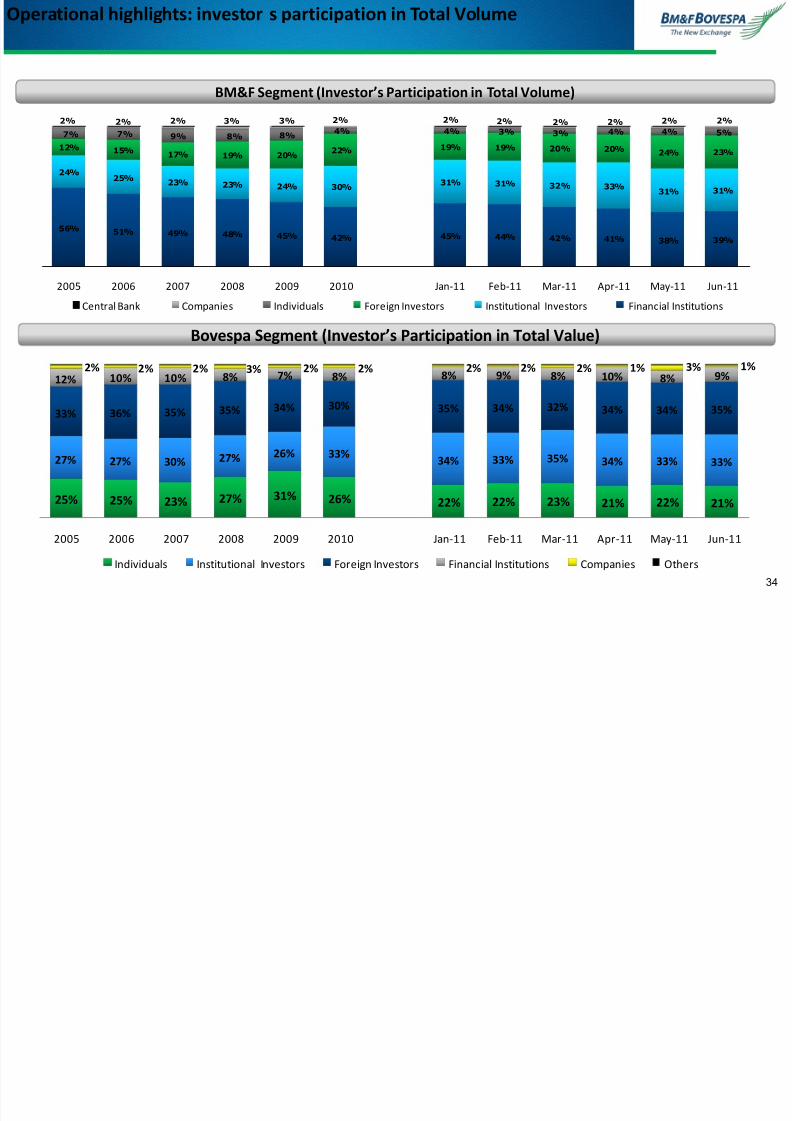
Operational highlights: investor s participation in Total Volume
7/30/2019 BVMF Presentation - July 2011
http://slidepdf.com/reader/full/bvmf-presentation-july-2011 34/51
BM&F Segment (Investor’s Participation in Total Volume)
Bovespa Segment (Investor’s Participation in Total Value)
p g g p p
34
56%51% 49% 48% 45% 42% 45% 44% 42% 41% 38% 39%
24%25%
23% 23% 24% 30%31% 31% 32% 33%
31% 31%
12% 15%17% 19% 20%
22%19% 19% 20% 20%
24% 23%
7% 7% 9% 8% 8%4% 4% 3% 3% 4% 4% 5%
2% 2% 2% 3% 3% 2% 2% 2% 2% 2% 2% 2%
2005 2006 2007 2008 2009 2010 Jan-11 Feb-11 Mar-11 Apr-11 May-11 Jun-11
Central Bank Companies Individuals Foreign Investors Institutional Investors Financial Institutions
25% 25% 23% 27% 31% 26% 22% 22% 23% 21% 22% 21%
27% 27% 30% 27% 26% 33%34% 33% 35% 34% 33% 33%
33%36% 35% 35% 34% 30% 35% 34% 32% 34% 34% 35%
12% 10% 10% 8% 7% 8% 8% 9% 8% 10% 8% 9%2% 2% 2% 3% 2% 2% 2% 2% 2% 1% 3% 1%
2005 2006 2007 2008 2009 2010 Jan-11 Feb-11 Mar-11 Apr-11 May-11 Jun-11
Individuals Institutional Investors Foreign Investors Financial Institutions Companies Others

7/30/2019 BVMF Presentation - July 2011
http://slidepdf.com/reader/full/bvmf-presentation-july-2011 35/51
SUSTAINABILITY
35
BM&FBOVESPA Sustainability Mission
7/30/2019 BVMF Presentation - July 2011
http://slidepdf.com/reader/full/bvmf-presentation-july-2011 36/51
BM&FBOVESPA’s Sustainability Mission“Support, promote and practice the concepts and actions towards economic,
social and environmental responsibility with the purpose of contributing to
sustainable development”
36
BM&FBOVESPA Sustainability Mission
Novo Valor BM&FBOVESPA
Program created in 2010 to guide sustainability actions of
BVMF.Goal
Induce and promote the sustainable development of theBM&FBOVESPA and the capital market, involving all audiences,including investors, companies and brokerages.
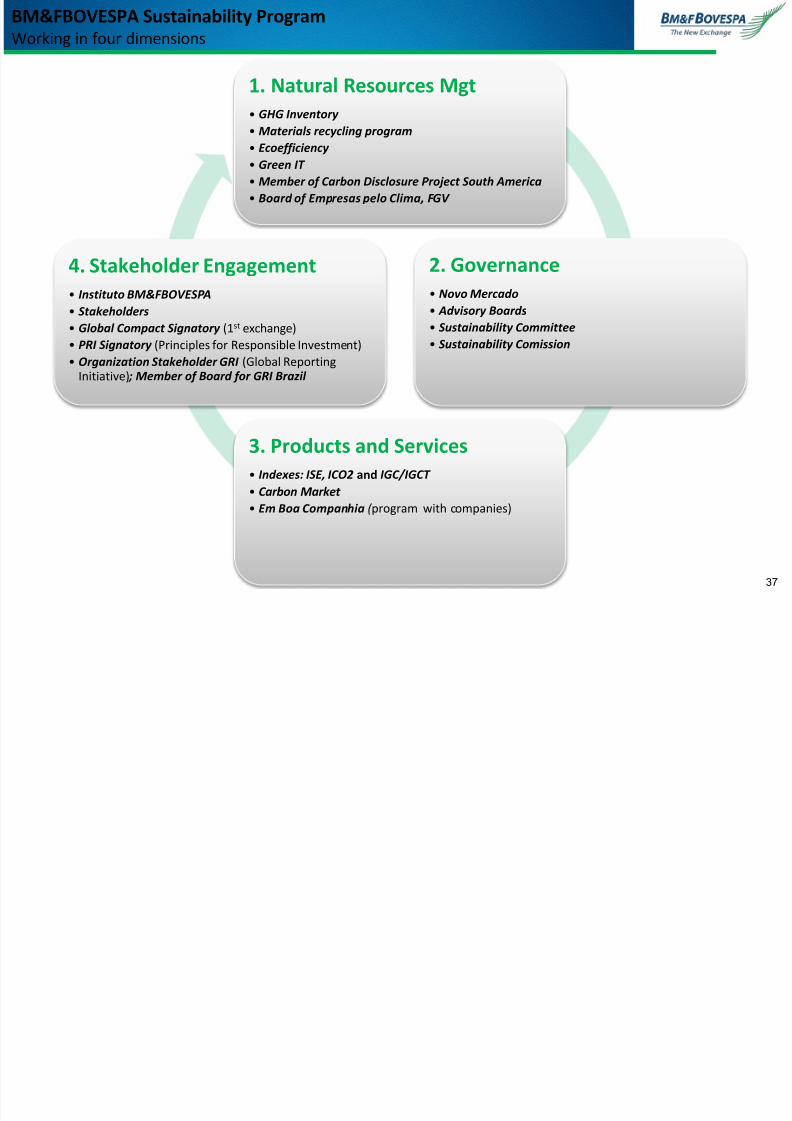
BM&FBOVESPA Sustainability Program
7/30/2019 BVMF Presentation - July 2011
http://slidepdf.com/reader/full/bvmf-presentation-july-2011 37/51
1. Natural Resources Mgt
• GHG Inventory
• Materials recycling program
• Ecoefficiency
• Green IT
• Member of Carbon Disclosure Project South America
• Board of Empresas pelo Clima, FGV
2. Governance
• Novo Mercado
• Advisory Boards
• Sustainability Committee
• Sustainability Comission
3. Products and Services
• Indexes: ISE, ICO2 and IGC/IGCT
• Carbon Market
• Em Boa Companhia ( program with companies)
4. Stakeholder Engagement
• Instituto BM&FBOVESPA
• Stakeholders
• Global Compact Signatory (1st exchange)
• PRI Signatory (Principles for Responsible Investment)
• Organization Stakeholder GRI (Global ReportingInitiative) ; Member of Board for GRI Brazil
y gWorking in four dimensions
37

7/30/2019 BVMF Presentation - July 2011
http://slidepdf.com/reader/full/bvmf-presentation-july-2011 38/51
1Q11 EARNINGS
38
1Q11 Highlights
7/30/2019 BVMF Presentation - July 2011
http://slidepdf.com/reader/full/bvmf-presentation-july-2011 39/51
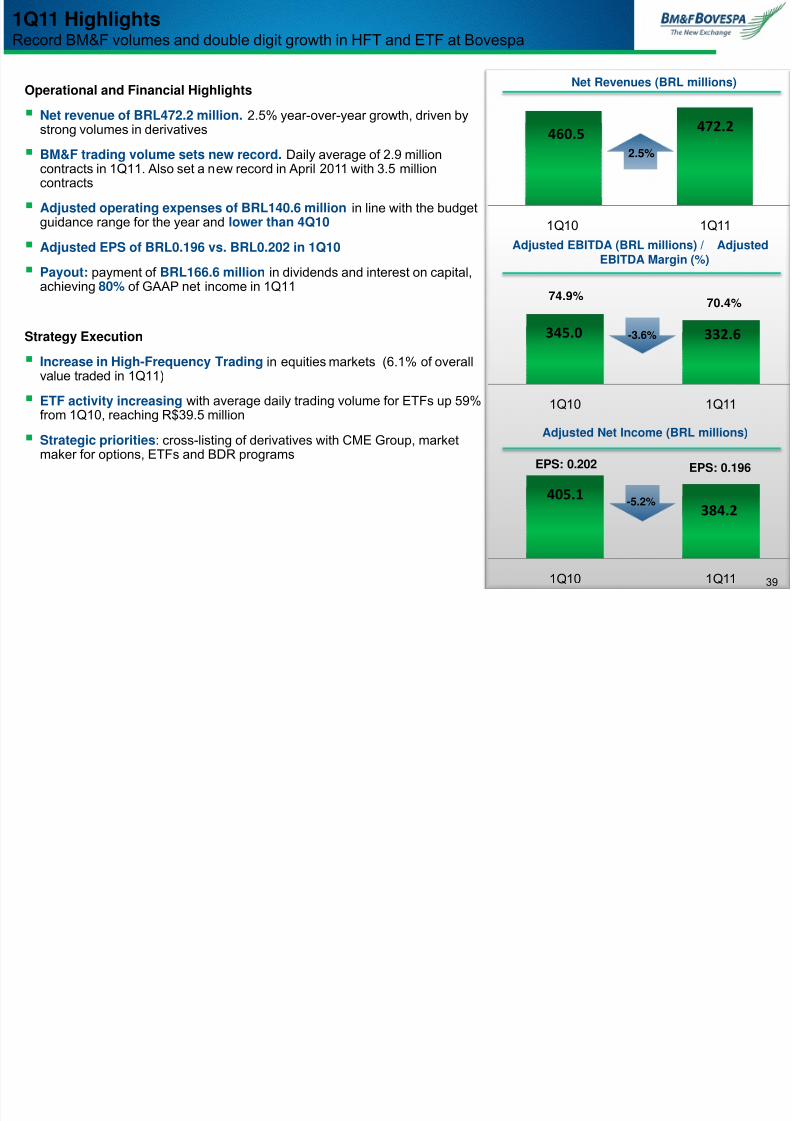
Operational and Financial Highlights
Net revenue of BRL472.2 million. 2.5% year-over-year growth, driven bystrong volumes in derivatives
BM&F trading volume sets new record. Daily average of 2.9 millioncontracts in 1Q11. Also set a new record in April 2011 with 3.5 millioncontracts
Adjusted operating expenses of BRL140.6 million in line with the budgetguidance range for the year and lower than 4Q10
Adjusted EPS of BRL0.196 vs. BRL0.202 in 1Q10
Payout: payment of BRL166.6 million in dividends and interest on capital,achieving 80% of GAAP net income in 1Q11
Strategy Execution
Increase in High-Frequency Trading in equities markets (6.1% of overallvalue traded in 1Q11)
ETF activity increasing with average daily trading volume for ETFs up 59%
from 1Q10, reaching R$39.5 million Strategic priorities: cross-listing of derivatives with CME Group, market
maker for options, ETFs and BDR programs
460.5472.2
1Q10 1Q11
345.0 332.6
1Q10 1Q11
405.1384.2
1Q10 1Q11
Net Revenues (BRL millions)
Adjusted EBITDA (BRL millions) / AdjustedEBITDA Margin (%)
Q g gRecord BM&F volumes and double digit growth in HFT and ETF at Bovespa
Adjusted Net Income (BRL millions)
-3.6%
2.5%
EPS: 0.202 EPS: 0.196
-5.2%
74.9%70.4%
39
Revenues – 1Q11 vs. 1Q10
7/30/2019 BVMF Presentation - July 2011
http://slidepdf.com/reader/full/bvmf-presentation-july-2011 40/51
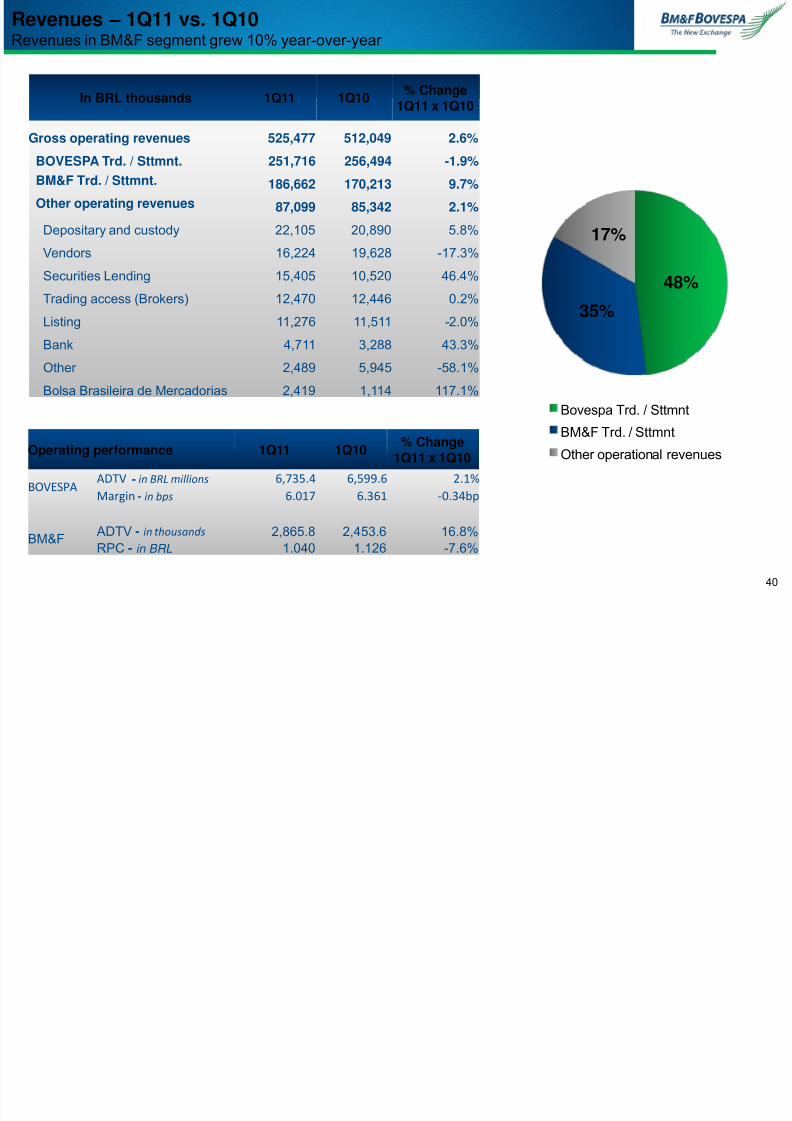
Revenues in BM&F segment grew 10% year-over-year
In BRL thousands 1Q11 1Q10% Change
1Q11 x 1Q10
Gross operating revenues 525,477 512,049 2.6%BOVESPA Trd. / Sttmnt. 251,716 256,494 -1.9%
BM&F Trd. / Sttmnt. 186,662 170,213 9.7%
Other operating revenues 87,099 85,342 2.1%
Depositary and custody 22,105 20,890 5.8%
Vendors 16,224 19,628 -17.3%
Securities Lending 15,405 10,520 46.4%Trading access (Brokers) 12,470 12,446 0.2%
Listing 11,276 11,511 -2.0%
Bank 4,711 3,288 43.3%
Other 2,489 5,945 -58.1%
Bolsa Brasileira de Mercadorias 2,419 1,114 117.1%
48%
35%
17%
Bovespa Trd. / Sttmnt
BM&F Trd. / Sttmnt
Other operational revenuesOperating performance 1Q11 1Q10% Change
1Q11 x 1Q10
BOVESPAADTV - in BRL millions 6,735.4 6,599.6 2.1%
Margin - in bps 6.017 6.361 -0.34bp
BM&F ADTV - in thousands 2,865.8 2,453.6 16.8%
RPC - in BRL 1.040 1.126 -7.6%
40
BOVESPA Segment Trends
7/30/2019 BVMF Presentation - July 2011
http://slidepdf.com/reader/full/bvmf-presentation-july-2011 41/51
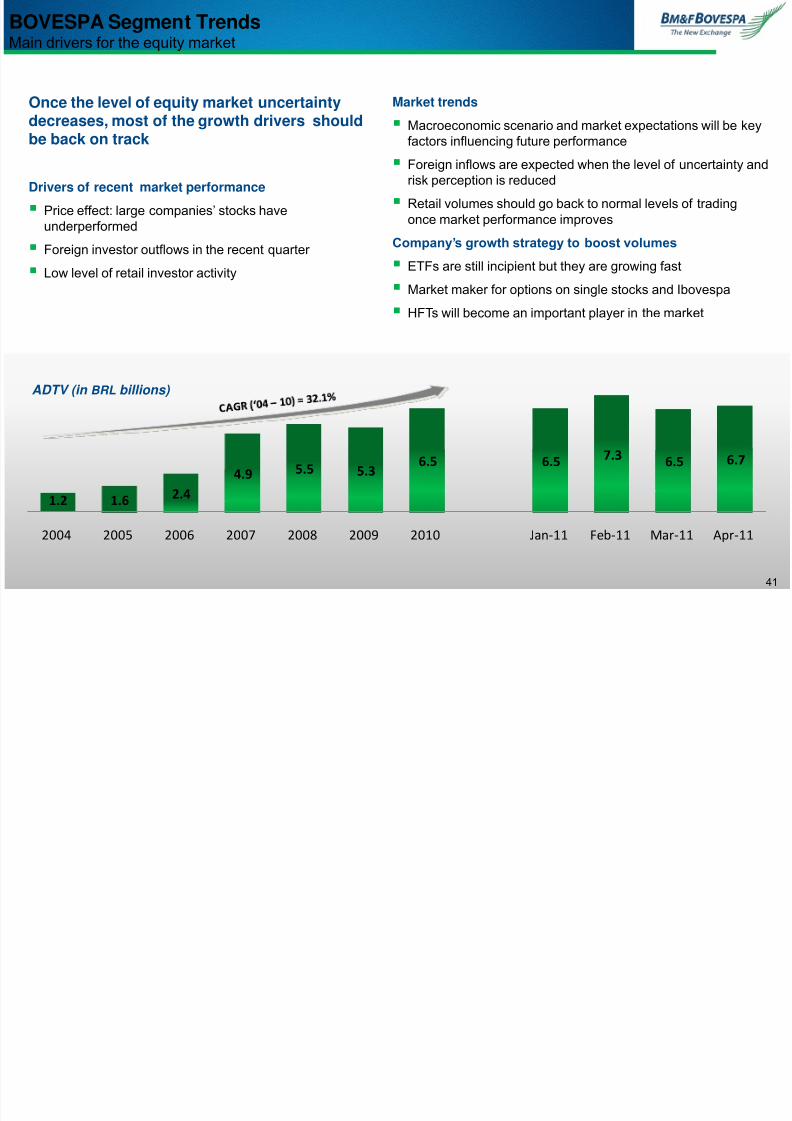
Once the level of equity market uncertaintydecreases, most of the growth drivers should
be back on track
Drivers of recent market performance
Price effect: large companies’ stocks have
underperformed
Foreign investor outflows in the recent quarter
Low level of retail investor activity
1.2 1.6 2.4
4.9 5.5 5.36.5 6.5 7.3 6.5 6.7
2004 2005 2006 2007 2008 2009 2010 Jan-11 Feb-11 Mar-11 Apr-11
BOVESPA Segment TrendsMain drivers for the equity market
Market trends
Macroeconomic scenario and market expectations will be key
factors influencing future performance Foreign inflows are expected when the level of uncertainty and
risk perception is reduced
Retail volumes should go back to normal levels of tradingonce market performance improves
Company’s growth strategy to boost volumes
ETFs are still incipient but they are growing fast
Market maker for options on single stocks and Ibovespa
HFTs will become an important player in the market
ADTV (in BRL billions)
41
BM&F Segment Trends
7/30/2019 BVMF Presentation - July 2011
http://slidepdf.com/reader/full/bvmf-presentation-july-2011 42/51
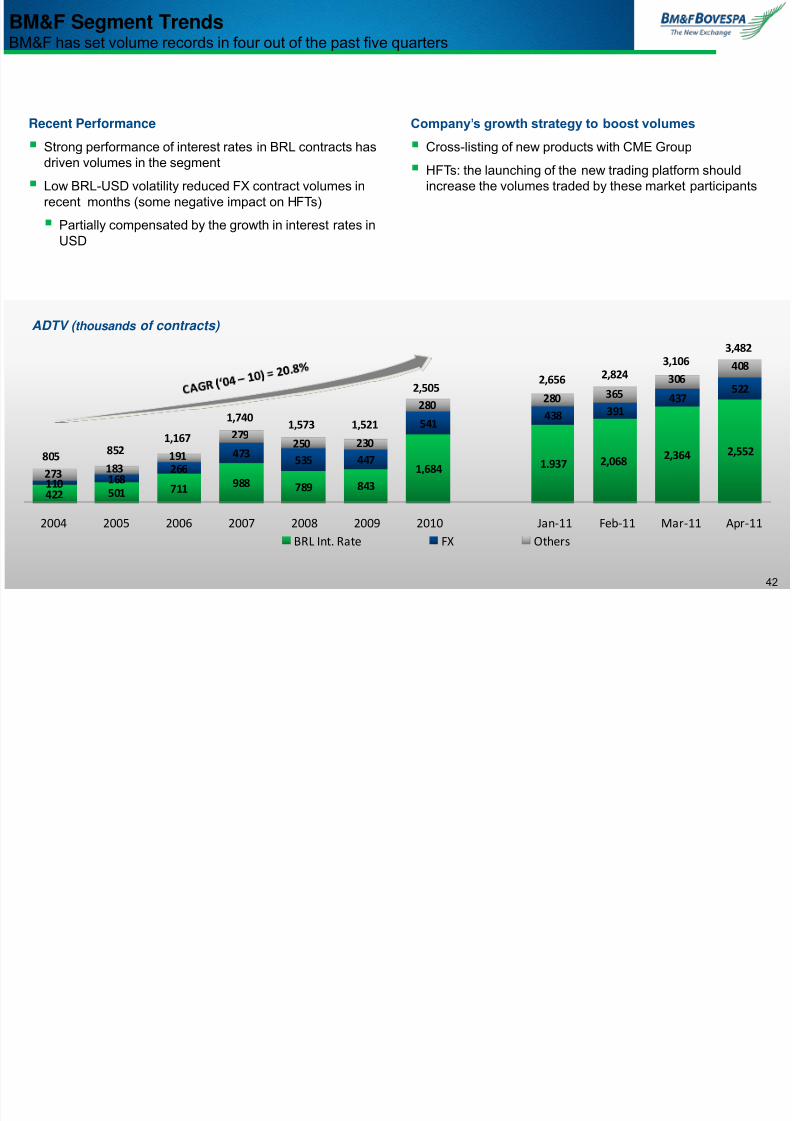
Recent Performance
Strong performance of interest rates in BRL contracts hasdriven volumes in the segment
Low BRL-USD volatility reduced FX contract volumes inrecent months (some negative impact on HFTs)
Partially compensated by the growth in interest rates inUSD
Company’s growth strategy to boost volumes
Cross-listing of new products with CME Group
HFTs: the launching of the new trading platform shouldincrease the volumes traded by these market participants
& Seg e t e dsBM&F has set volume records in four out of the past five quarters
ADTV ( thousands of contracts)
422 501 711988 789 843
1,684 1.937 2,0682,364 2,552
110 168266
473535 447
541 438
391437
522
273 183191
279250 230
280280 365
306408
2004 2005 2006 2007 2008 2009 2010 Jan-11 Feb-11 Mar-11 Apr-11
BRL Int. Rate FX Others
3,4823,106
2,8242,6562,505
1,5211,5731,7401,167
852805
42
Adjusted Operating Expenses Lower Than Previous Quarter
7/30/2019 BVMF Presentation - July 2011
http://slidepdf.com/reader/full/bvmf-presentation-july-2011 43/51
j p g pOPEX supports growth initiatives; in line with the management´s guidance
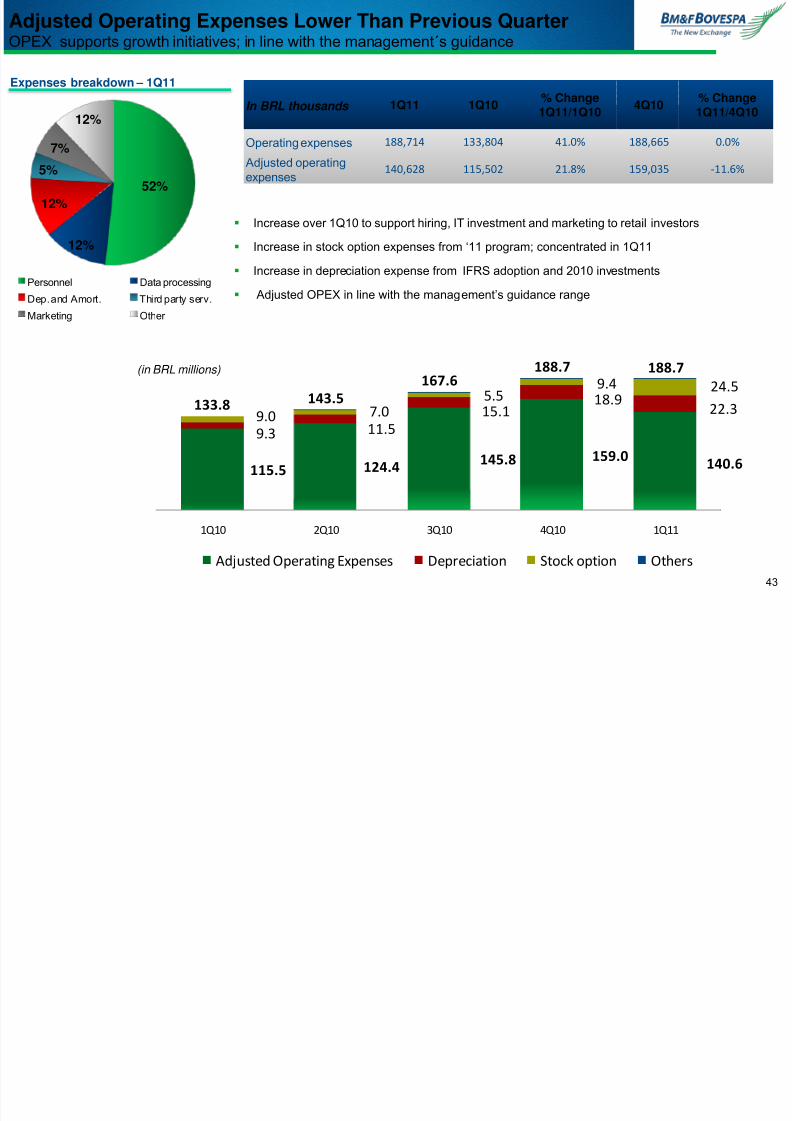
Expenses breakdown – 1Q11
52%
12%
12%
5%
7%
12%
Personnel Data processingDep. and Amort. Third party serv.
Marketing Other
Increase over 1Q10 to support hiring, IT investment and marketing to retail investors
Increase in stock option expenses from ‘11 program; concentrated in 1Q11
Increase in depreciation expense from IFRS adoption and 2010 investments
Adjusted OPEX in line with the management’s guidance range
(in BRL millions)
In BRL thousands 1Q11 1Q10% Change1Q11/1Q10
4Q10% Change1Q11/4Q10
Operating expenses 188,714 133,804 41.0% 188,665 0.0% Adjusted operatingexpenses
140,628 115,502 21.8% 159,035 -11.6%
115.5 124.4145.8 159.0
140.6
9.3 11.515.1
18.922.3
9.07.0
5.59.4 24.5
1Q10 2Q10 3Q10 4Q10 1Q11
Adjusted Operating Expenses Depreciation Stock option Others
133.8 143.5
167.6188.7 188.7
43
Strategic investments to enhance growthI i h d d k i h

7/30/2019 BVMF Presentation - July 2011
http://slidepdf.com/reader/full/bvmf-presentation-july-2011 44/51
54.7 57.4 66.280.9 72.9
9.0 7.05.5
9.4 24.5
1Q10 2Q10 3Q10 4Q10 1Q11
Adj. PersonnelStock Options
5.39.9
15.811.4 13.4
1Q10 2Q10 3Q10 4Q10 1Q11
Average: BRL13.6
Increase of 28.3% in the average headcount (particularly in IT and business development areas), in line with our growth strategy to strength the core business areas of the Company
Due to the recognition of the expenses of a new stock option program granted in 2011, the amount of stock option
expenses recognized in the 1Q11 rose to BRL24.5 million (most of this additional expense is concentrated in the1Q11). In 2010 there was no new program granted
Collective bargaining agreement: 6% annual salary increase (Aug. 2010)
Increases in headcount and marketing to support growth strategy
33.2%
151.3%
Programs to attract more retailinvestors to the market
Intensification of marketingactivities and strengthening of Financial Education campaigns
38.9%
AdjustedPersonnel
(1Q11 x 1Q10)
Marketing
(1Q11 x 1Q10)
Marketing and Promotion Expenses – R$ millions
Personnel Expenses (R$ millions)
9.9%
The 4Q10 was impacted byprofit-sharing distribution toemployees.
AdjustedPersonnel
(1Q11 x 4Q10)
59,6
30,9
2009 2010
Stock Option Expenses(R$ millions)
44
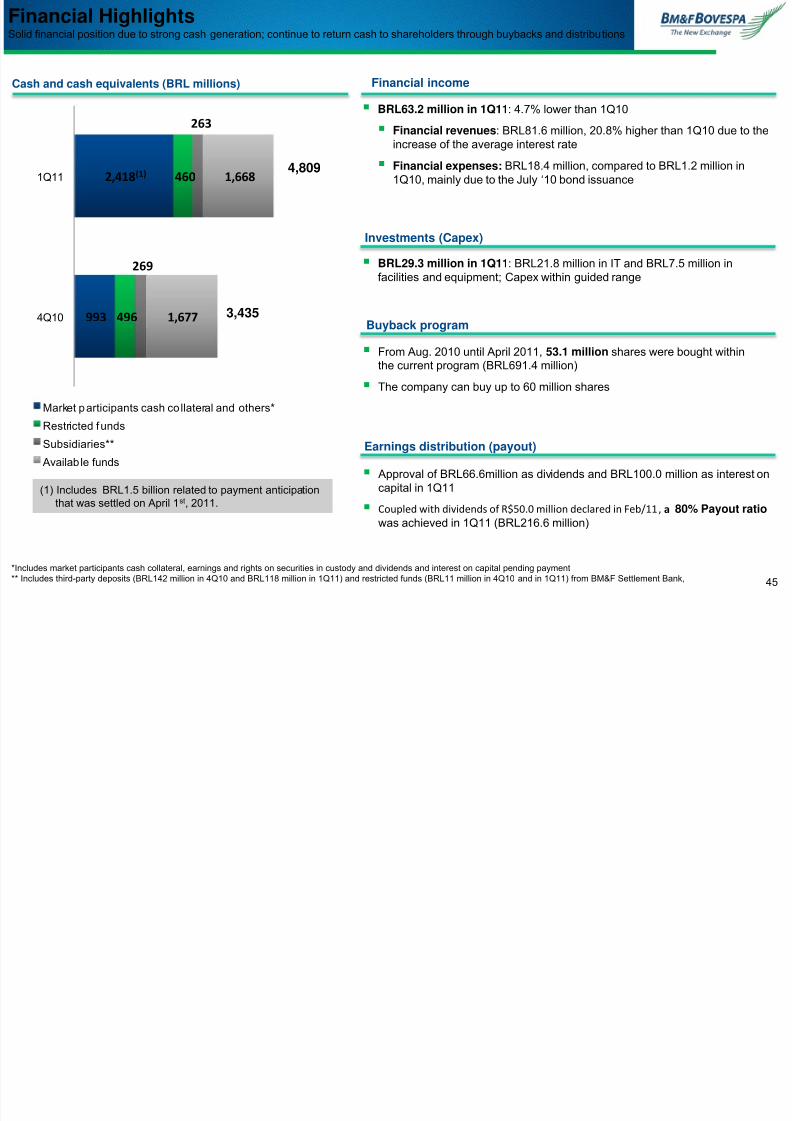
Financial HighlightsS lid fi i l iti d t t h ti ti t t h t h h ld th h b b k d di t ib ti
7/30/2019 BVMF Presentation - July 2011
http://slidepdf.com/reader/full/bvmf-presentation-july-2011 45/51
BRL29.3 million in 1Q11: BRL21.8 million in IT and BRL7.5 million in
facilities and equipment; Capex within guided range
3,435
4,809
*Includes market participants cash collateral, earnings and rights on securities in custody and dividends and interest on capital pending payment** Includes third-party deposits (BRL142 million in 4Q10 and BRL118 million in 1Q11) and restricted funds (BRL11 million in 4Q10 and in 1Q11) from BM&F Settlement Bank,
Solid financial position due to strong cash generation; continue to return cash to shareholders through buybacks and distributions
BRL63.2 million in 1Q11: 4.7% lower than 1Q10
Financial revenues: BRL81.6 million, 20.8% higher than 1Q10 due to the
increase of the average interest rate
Financial expenses: BRL18.4 million, compared to BRL1.2 million in1Q10, mainly due to the July ‘10 bond issuance
Investments (Capex)
From Aug. 2010 until April 2011, 53.1 million shares were bought withinthe current program (BRL691.4 million)
The company can buy up to 60 million shares
Buyback program
Approval of BRL66.6million as dividends and BRL100.0 million as interest oncapital in 1Q11
Coupled with dividends of R$50.0 million declared in Feb/11, a 80% Payout ratiowas achieved in 1Q11 (BRL216.6 million)
Earnings distribution (payout)
Cash and cash equivalents (BRL millions) Financial income
(1) Includes BRL1.5 billion related to payment anticipationthat was settled on April 1st, 2011.
993
2,418(1)
496
460
269
263
1,677
1,668
4Q10
1Q11
Market participants cash collateral and others*
Restricted funds
Subsidiaries**
Available funds
45
Income Statement Summary
7/30/2019 BVMF Presentation - July 2011
http://slidepdf.com/reader/full/bvmf-presentation-july-2011 46/51
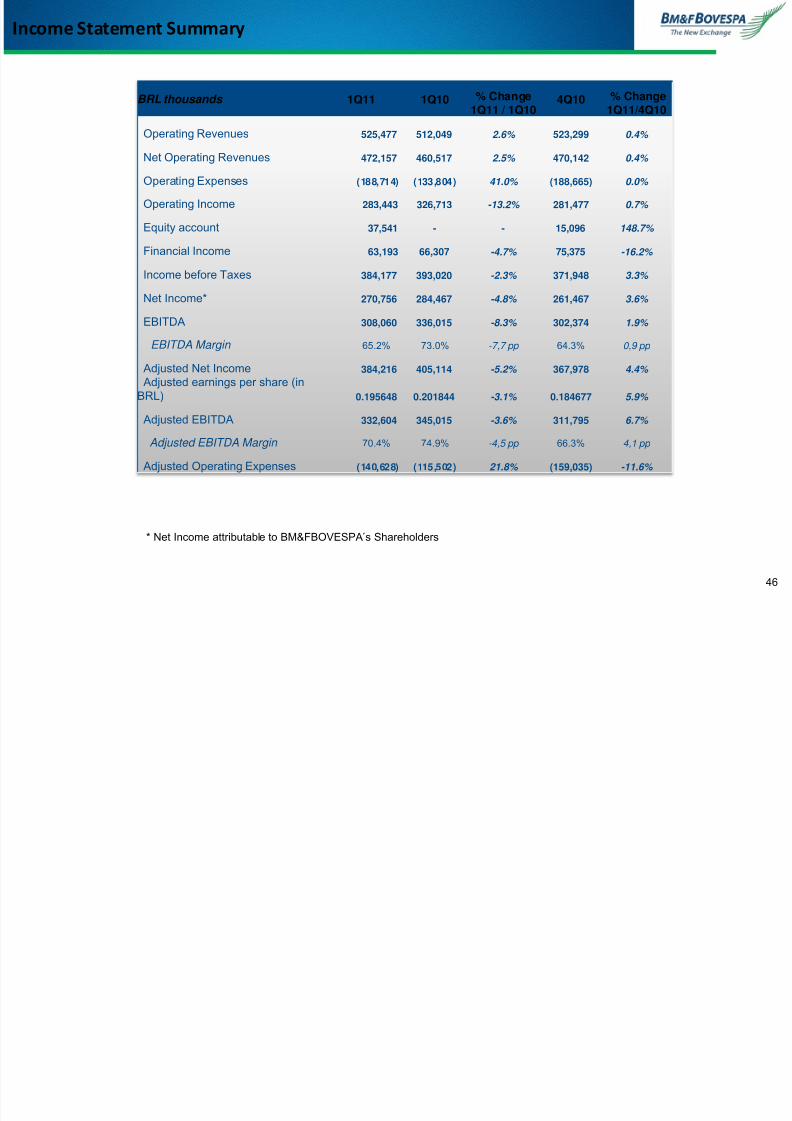
Income Statement Summary
BRL thousands 1Q11 1Q10 % Change1Q11 / 1Q10
4Q10 % Change1Q11/4Q10
Operating Revenues 525,477 512,049 2.6% 523,299 0.4%
Net Operating Revenues 472,157 460,517 2.5% 470,142 0.4%
Operating Expenses (188,714) (133,804) 41.0% (188,665) 0.0%
Operating Income 283,443 326,713 -13.2% 281,477 0.7%
Equity account 37,541 - - 15,096 148.7%
Financial Income 63,193 66,307 -4.7% 75,375 -16.2%
Income before Taxes 384,177 393,020 -2.3% 371,948 3.3%
Net Income* 270,756 284,467 -4.8% 261,467 3.6%
EBITDA 308,060 336,015 -8.3% 302,374 1.9%
EBITDA Margin 65.2% 73.0% -7,7 pp 64.3% 0,9 pp
Adjusted Net Income 384,216 405,114 -5.2% 367,978 4.4%
Adjusted earnings per share (inBRL) 0.195648 0.201844 -3.1% 0.184677 5.9%
Adjusted EBITDA 332,604 345,015 -3.6% 311,795 6.7%
Adjusted EBITDA Margin 70.4% 74.9% -4,5 pp 66.3% 4,1 pp
Adjusted Operating Expenses (140,628) (115,502) 21.8% (159,035) -11.6%
* Net Income attributable to BM&FBOVESPA´s Shareholders
46
Reconciliation of GAAP to Adjusted Net Income
7/30/2019 BVMF Presentation - July 2011
http://slidepdf.com/reader/full/bvmf-presentation-july-2011 47/51
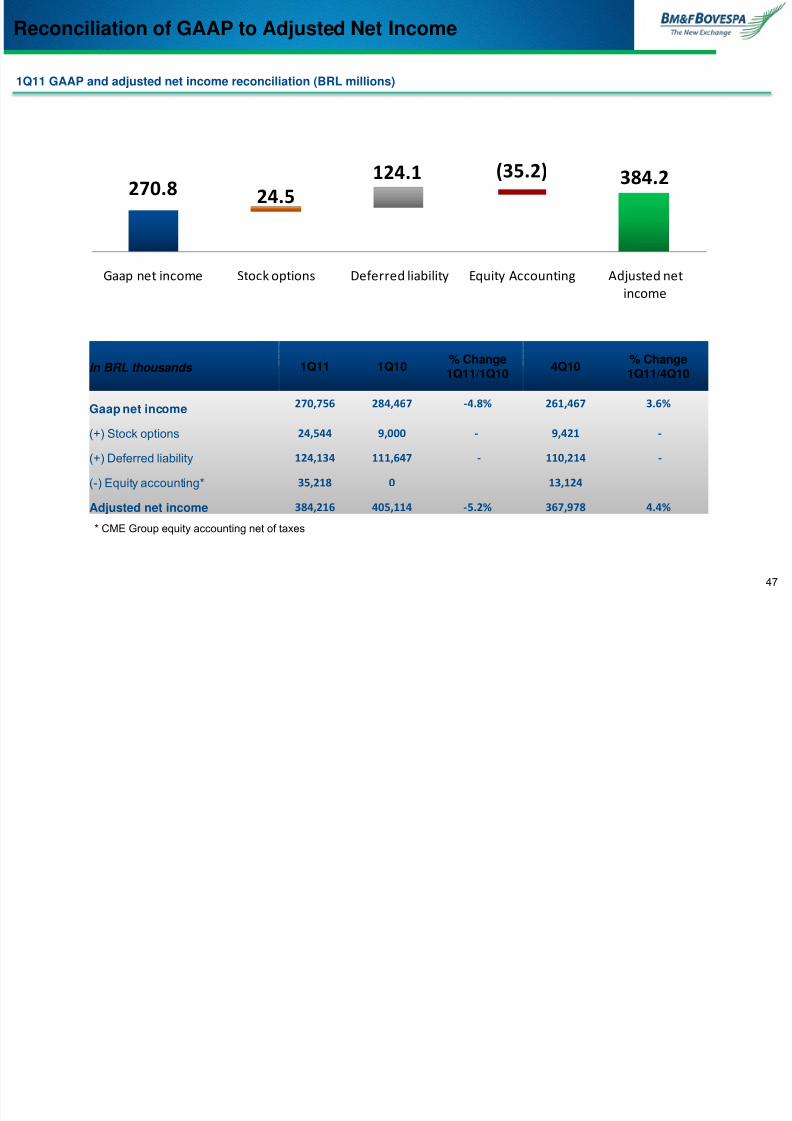
Reconciliation of GAAP to Adjusted Net Income
In BRL thousands 1Q11 1Q10% Change1Q11/1Q10
4Q10% Change1Q11/4Q10
Gaap net income 270,756 284,467 -4.8% 261,467 3.6%
(+) Stock options 24,544 9,000 - 9,421 -
(+) Deferred liability 124,134 111,647 - 110,214 -
(-) Equity accounting* 35,218 0 13,124
Adjusted net income 384,216 405,114 -5.2% 367,978 4.4%
1Q11 GAAP and adjusted net income reconciliation (BRL millions)
* CME Group equity accounting net of taxes
270.8(35.2) 384.2
24.5
124.1
Gaap net income Stock options Deferred liability Equity Accounting Adjusted net
income
47
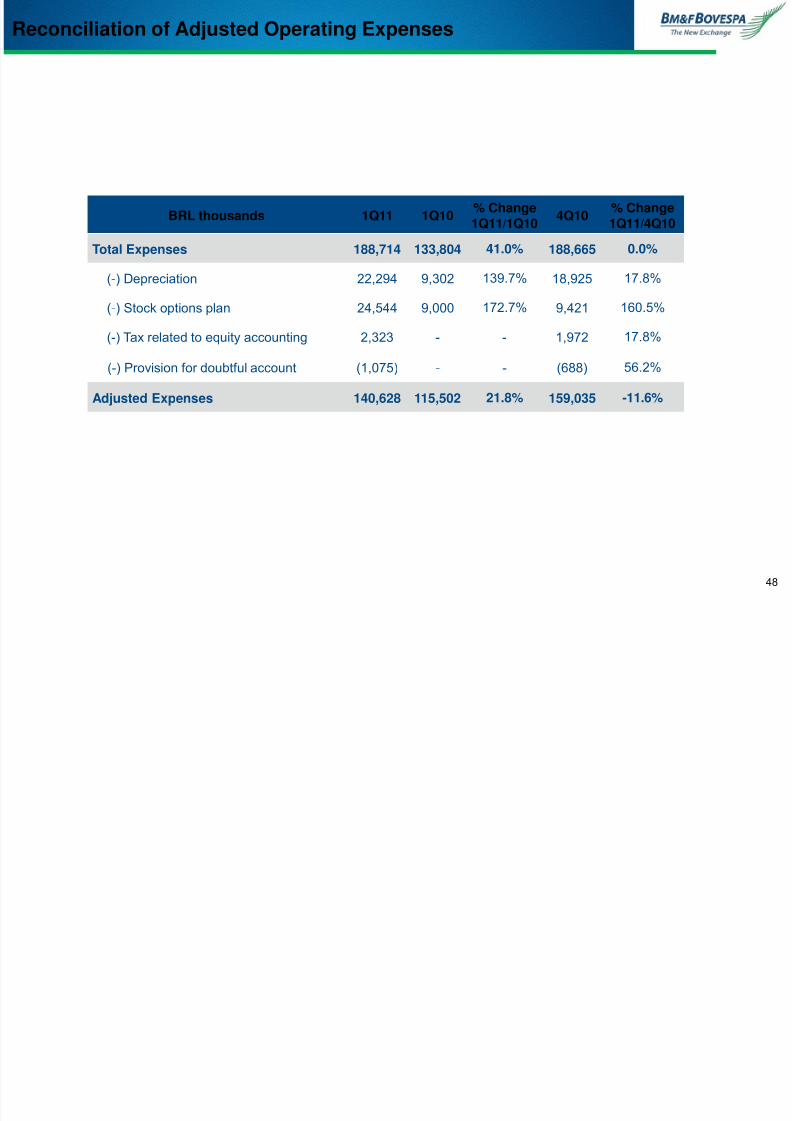
Reconciliation of Adjusted Operating Expenses
7/30/2019 BVMF Presentation - July 2011
http://slidepdf.com/reader/full/bvmf-presentation-july-2011 48/51
BRL thousands 1Q11 1Q10% Change1Q11/1Q10
4Q10% Change1Q11/4Q10
Total Expenses 188,714 133,804 41.0% 188,665 0.0%
(-) Depreciation 22,294 9,302 139.7% 18,925 17.8%
(-) Stock options plan 24,544 9,000 172.7% 9,421 160.5%
(-) Tax related to equity accounting 2,323 - - 1,972 17.8%
(-) Provision for doubtful account (1,075) - - (688) 56.2%
Adjusted Expenses 140,628 115,502 21.8% 159,035 -11.6%
Reconciliation of Adjusted Operating Expenses
48
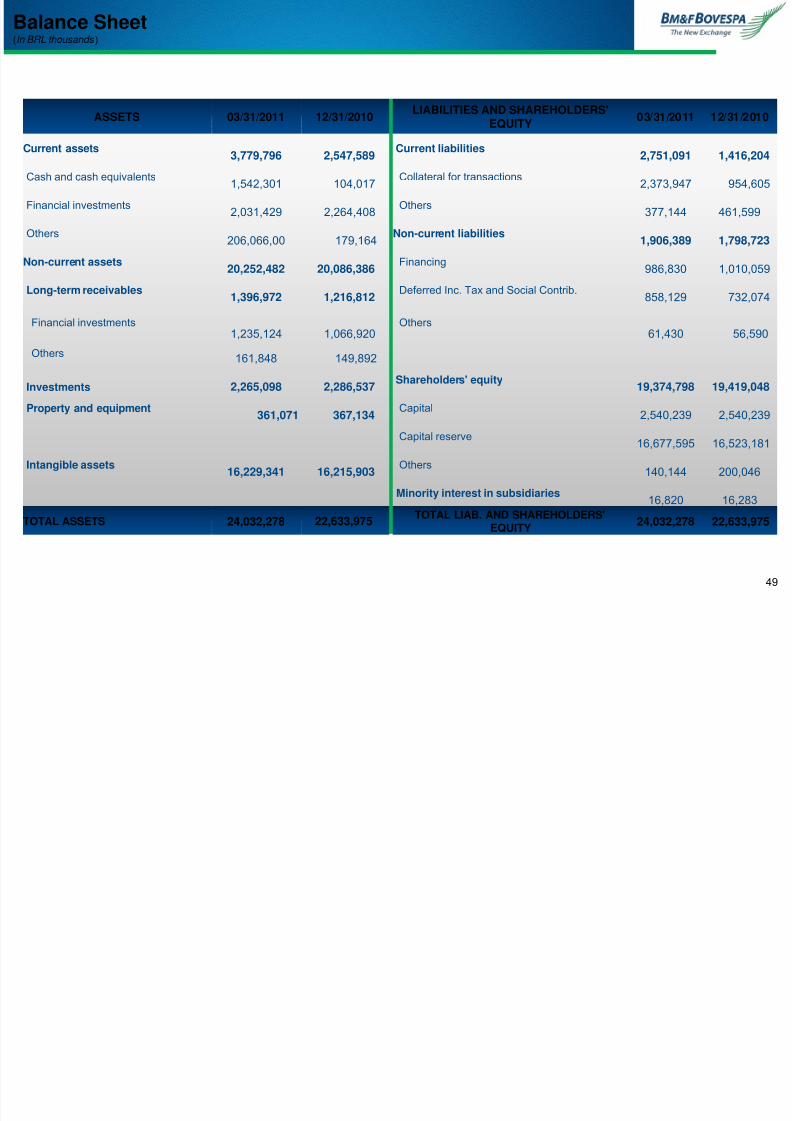
Balance Sheet
7/30/2019 BVMF Presentation - July 2011
http://slidepdf.com/reader/full/bvmf-presentation-july-2011 49/51
ASSETS 03/31/2011 12/31/2010LIABILITIES AND SHAREHOLDERS'
EQUITY03/31/2011 12/31/2010
Current assets 3,779,796 2,547,589 Current liabilities 2,751,091 1,416,204
Cash and cash equivalents1,542,301 104,017
Collateral for transactions2,373,947 954,605
Financial investments2,031,429 2,264,408
Others377,144 461,599
Others206,066,00 179,164
Non-current liabilities1,906,389 1,798,723
Non-current assets20,252,482 20,086,386
Financing986,830 1,010,059
Long-term receivables1,396,972 1,216,812
Deferred Inc. Tax and Social Contrib.858,129 732,074
Financial investments1,235,124 1,066,920
Others61,430 56,590
Others 161,848 149,892
Investments 2,265,098 2,286,537Shareholders' equity
19,374,798 19,419,048
Property and equipment361,071 367,134
Capital2,540,239 2,540,239
Capital reserve16,677,595 16,523,181
Intangible assets16,229,341 16,215,903
Others140,144 200,046
Minority interest in subsidiaries16,820 16,283
TOTAL ASSETS 24,032,278 22,633,975TOTAL LIAB. AND SHAREHOLDERS'
EQUITY24,032,278 22,633,975
(In BRL thousands )
49
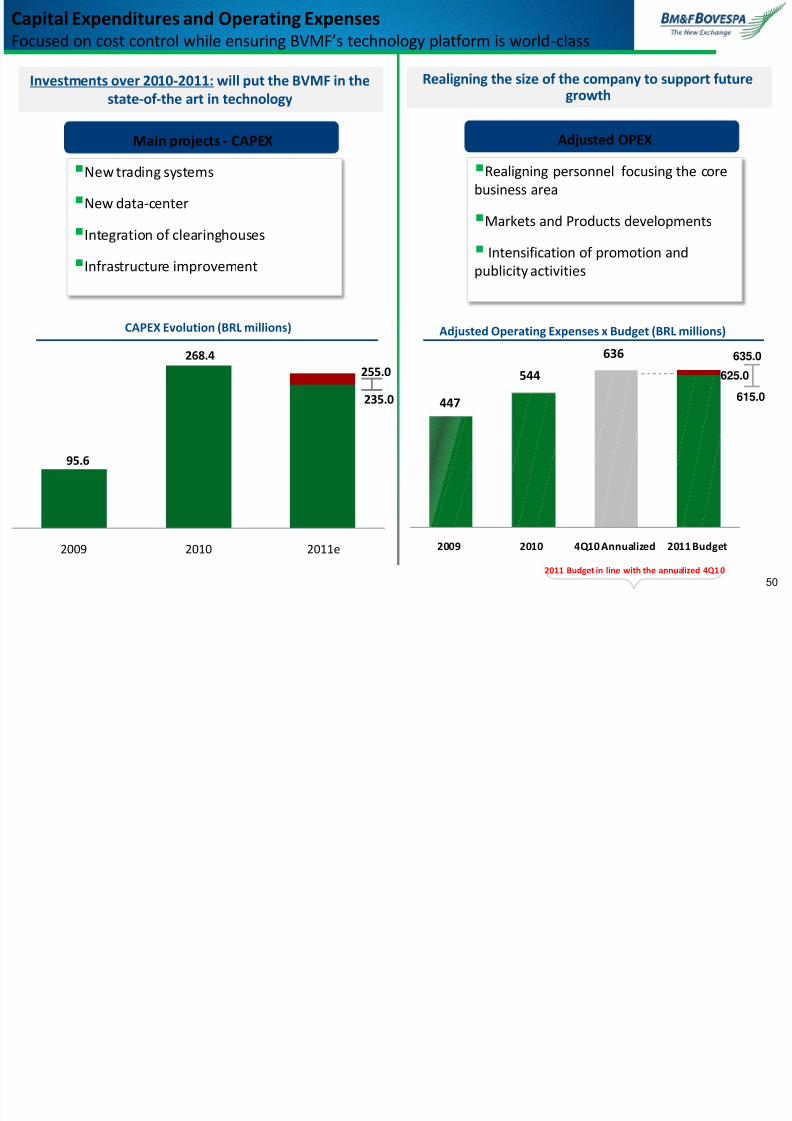
Capital Expenditures and Operating Expensesd l h l ’ h l l f ld l
7/30/2019 BVMF Presentation - July 2011
http://slidepdf.com/reader/full/bvmf-presentation-july-2011 50/51
447
544
636
2009 2010 4Q10 Annualized 2011 Budget
635.0
615.0
625.0
2011 Budget in line with the annualized 4Q10
95.6
268.4
2009 2010 2011e
235.0
255.0
Adjusted Operating Expenses x Budget (BRL millions)
Focused on cost control while ensuring BVMF’s technology platform is world-class
CAPEX Evolution (BRL millions)
Investments over 2010-2011: will put the BVMF in the
state-of-the art in technology
New trading systems
New data-center
Integration of clearinghouses
Infrastructure improvement
Main projects - CAPEX
Realigning the size of the company to support futuregrowth
Adjusted OPEX
Realigning personnel focusing the core
business area
Markets and Products developments
Intensification of promotion and
publicity activities
50
7/30/2019 BVMF Presentation - July 2011
http://slidepdf.com/reader/full/bvmf-presentation-july-2011 51/51