by eddie hunsinger and david howell, …laborstats.alaska.gov/trends/apr12art1.pdfby eddie hunsinger...
TRANSCRIPT

4 ALASKA ECONOMIC TRENDS APRIL 2012
By EDDIE HUNSINGER and DAVID HOWELL, Demographers; and ERIC SANDBERG, Research Analyst
Historic Events and Population ChangeAlaska, 1947 to 20111
Alaska’s Highly Migratory Population Annual moves to, from, and across the state
1950 1955 1960 1965 1970 1975 1980 1985 1990 1995 2000 2005 2010
0
10,000
20,000
30,000
40,000
-10,000
-20,000
Natural increase (births minus deaths) Net migration
Korean War
Pipeline constructionOil boom
Oil bustPipeline
completion
Base closures
VietnamWar
1989-91Recovery
End of WWII
Great Recession
Source: Alaska Department of Labor and Workforce Development, Research and Analysis Section
Alaska has one of the highest rates of population turnover in the nation — there are always large numbers of people mov-
ing in and out, regardless of whether the overall population is growing or shrinking.
Depending on the year and data source, between 5 and 7 percent of Alaska’s population enters or leaves the state each year. These large fl ows in and out, or “gross migration,” tend to be fairly stable and predictable.
While gross migration fl ows explain how the makeup of the population changes, “net migra-tion” measures the effect on the total population count — just one effect of moves.
Net migration — the number who move in minus those who move out — is much more volatile, and it’s important to remember it’s just at the surface of the much larger and more consistent in-and-out migration fl ows. Even during the years
that Alaska has a net migration loss, more than 30,000 people still arrive here each year.
A history of major swings
A number of major economic events over the past century have caused large numbers of people to move in, out, and across Alaska. (See Exhibit 1.)
Through the 1940s and 1950s, the state’s popula-tion boomed due to military buildups for World War II and the Cold War. A large proportion of the new residents were young GIs who would either stay in the state or return with their families.
Alaska’s population at statehood in 1959 was just a third of what it is today. Then in 1968, oil discovery at Prudhoe Bay and con-struction of the Trans-Alaska Oil Pipe-line brought in tens of thousands of workers, followed by large net losses after the pipeline’s completion.
New oil revenue in the early 1980s brought another period of dramatic growth through net migration, followed by big losses when oil prices dropped. Since the early 1990s, these fl uctua-tions have been less dramatic.
No perfect data source
Migration data come from three main sources, each with its own strengths and weaknesses. This means each source is an indicator of migration, but none provides a complete system to track it.
Population change is made up of three components: migration, births, and deaths. Of these, migration is the most complex and volatile.

5APRIL 2012 ALASKA ECONOMIC TRENDS
Large Movements In, OutIRS data, 2000 to 2010 2
Note: These data only cover state-to-state migration for those included on IRS tax forms.Sources: IRS Tax Statistics; and Alaska Department of Labor and Workforce Development, Research and Analysis Section
2000
-2001
2001
-2002
2002
-2003
2003
-2004
2004
-2005
2005
-2006
2006
-2007
2007
-2008
2008
-2009
2009
-2010
0
5,000
10,000
15,000
20,000
25,000
30,000
35,000
40,000
In-migrationOut-migration
Yearly Migration to Alaska by StateIRS data, 2000 to 2010 3
• Data from Permanent Fund Dividend applications have broad in-state coverage and provide information on age and sex, but lag on new migrants from outside the state because they aren’t eligible for the PFD until they’ve lived in Alaska for one calendar year. Similar-ly, PFD data do not capture people who never live here long enough to qualify for a divi-dend. Younger workers are especially likely to be missed for that reason.
• Data based on Internal Revenue Service tax forms provide direct counts of migration between U.S. counties, boroughs, and census areas by comparing the mailing addresses of exemptions — that is, fi lers and their depen-dents — from year to year. However, the IRS data give no population characteristics except median income and those aged 65 or over, and
2,266
636
2,674
532
982
565
1,026571
7021,347
580
885
2,804
937
566
1,292
589
728
2,000 - 3,000
1,000 - 2,000
500 - 1,000
0 - 500
HI594
Sources: IRS Tax Statistics; and Alaska Department of Labor and Workforce Development, Research and Analysis Section

6 ALASKA ECONOMIC TRENDS APRIL 2012
Yearly Net Migration by Age PFD data, 2000 to 20105
Note: Adjusted for one-year delay in Permanent Fund Dividend eligibility.Source: Alaska Department of Labor and Workforce Development, Re-search and Analysis Section
Yearly Migration by Age and SexPFD data, 2000 to 20104
85+
80
75
70
65
60
55
50
45
40
35
30
25
20
15
10
5
Age
02505007501,000 0 250 500 750 1,000Males Females
2
To Alaska
From Alaska
Typical ageof high schoolgraduation
they are based on the address given on the form. The data cover about 85 percent of Alaska’s popula-tion, and the timing of the data release isn’t clear from year to year.
• Data from the U.S. Census Bureau’s American Community Survey provide more population char-acteristics than any other source, including age, sex, race, income, and education. However, the ACS is based on a small sample of the population and tends to have large margins of error. For most areas in Alaska, it’s only available in fi ve-year averages.
Migration to and from outside
Exhibit 2 shows Alaska’s IRS exemption-based annual gross migration to and from other states from 2000 to 2010. Note it only covers those on federal tax returns, and it doesn’t include international migration. The ACS shows that 6,500 people moved in from abroad each year on average from 2006 to 2010, netting around 1,000 to the state annually.
Overall, Alaska gets most of its new residents from states that are large and/or close. Exhibit 3 shows the states that sent the highest numbers of people to Alaska from 2000 to 2010, and this map wouldn’t change much if it refl ected individual years.
Large numbers of people move here from neighboring states such as Washington and California, and few come from small or faraway places like Maine and Nebraska. Distant states such as Texas and Florida have low rates of migration to Alaska, but because they have such large populations, the numbers of their residents who move here are substantial. If the map showed where in the U.S. people tend to go when they leave Alaska, the pat-tern would be similar.
Young people move more
It’s important to understand gross migration fl ows by age as well as across time and space. The pattern is fairly predictable, as some age groups are more likely to move than others.
As the PFD-based migration data in Exhibit 4 show, younger people are more likely to move than older people, and parents of young children are more likely to relocate than those with children in middle school or high school. When people reach college age, movement jumps substantially as many leave home for school, new jobs, or military service. The level of migration gener-ally peaks in the mid-20s as people settle down, and
5 10 15 20 25 30 35 40 45 50 55 60 65 70 75 80 85+
Typical ageof high schoolgraduation
Age
-300
-250
-200
-150
-100
-50
0
50
100
150
200
Net migration
Note: Adjusted for one-year delay in Permanent Fund Dividend eligibility.Source: Alaska Department of Labor and Workforce Development, Re-search and Analysis Section

7APRIL 2012 ALASKA ECONOMIC TRENDS
Alaska Population by Age and SexU.S. Census, 20107
Sources: U.S. Census Bureau; and Alaska Department of Labor and Workforce Development, Research and Analysis Section
85+
80
75
70
65
60
55
50
45
40
35
30
25
20
15
10
5
Age
02,0004,0006,0008,000 0 2,000 4,000 6,000 8,000Males Females
BabyBoom
EchoBoom
declines steadily thereafter.
The pattern of net migration by age is fairly stable from year to year, with net gains in younger years as children settle here with their parents, followed by a clear drop at college age when people leave for outside opportunities. There is a comparably dramatic increase for ages just past college, as many young adults seeking career opportunities settle here. (See Exhibit 5.) Although the pattern of net loss and then gain of those aged 18 to 20 is striking, it’s only a fraction of the more than 30,000 people in that age group. The state also consistently attracts more people between 21 and 35 than it loses.
A comparison of PFD data from year to year shows what proportion of residents are still in Alaska fi ve years after the typical high school graduation age of 18. Since 1995, the percentage of 18-year-old applicants who have remained in
Alaska or returned has increased from 67 to 72 percent. (See Exhibit 6.) Though that rise isn’t dramatic, this age group is undoubtedly affected
by opportunities in Alaska and the rest of the nation.
Past age 30, net migration gains steadily decrease and become net losses (See Exhibit 5.) The size of net losses among older people has been fairly stable, but this could soon change with the ag-ing of Alaska’s large “baby boomer” population — those born between 1946 and 1964 — and the relatively small pre-boomer population ahead of it. (See Exhibit 7.)
Losses at the highest ages are somewhat lower, partly because there are fewer people to affect the numbers at those ages, and partially because elderly peo-ple move less.
Most aren’t born here
Place of birth is an obvious and useful indicator of whether a person has ever moved, and these data are available from decennial censuses through 2000 and the U.S. Census Bureau’s American Community Survey for 2010.
As of 2010, 39 percent of Alaskans were born in the state. (See Exhibit 8). This is an increase from 31 percent in 1960, but
More 18-Year-Olds Stay or ReturnPercent in Alaska at age 23, 1995 to 2010 6
Note: Based on Alaska Permanent Fund Dividend data.Source: Alaska Department of Labor and Workforce Development, Re-search and Analysis Section
1995
1996
1997
1998
1999
2000
2001
2002
2003
2004
2005
2006
2007
2008
2009
2010
50%
55%
60%
65%
70%
75%
80%

8 ALASKA ECONOMIC TRENDS APRIL 2012
Born in Alaska 1960 to 20108 Movement To and From the Regions
Yearly PFD data, Alaska, 2000 to 20109
Source: Alaska Department of Labor and Workforce Development, Research and Analysis Section
19601970
19801990
20002010
5%10%15%20%25%30%35%40%45%50%
0
Into Alaska Out of Alaska0
5,000
10,000
15,000
20,000
25,000
30,000
35,000
40,000
45,000
NorthernSouthwestGulf CoastSoutheastInteriorAnchorage/Mat-Su
Sources: U.S. Census Bureau; and Alaska Department of Labor and Workforce Development, Research and Analysis Section
still much lower than the 59 percent for the nation as a whole in 2010. The only states with a smaller percentage born there were Arizona (38 percent), Florida (35 percent), and Nevada (24 percent).
Regional losses and gains
Between 2000 and 2010, approximately 55 per-cent of Alaska’s new and returning residents moved to the Anchorage/Matanuska-Susitna area, followed by 19 percent to the Interior, 10 percent to Southeast, and 10 percent to the Gulf Coast. The more remote regions, including Northern and Southwest, gained only slim shares of the state’s new or returning residents — around 5 percent combined. (See Exhibit 9.)
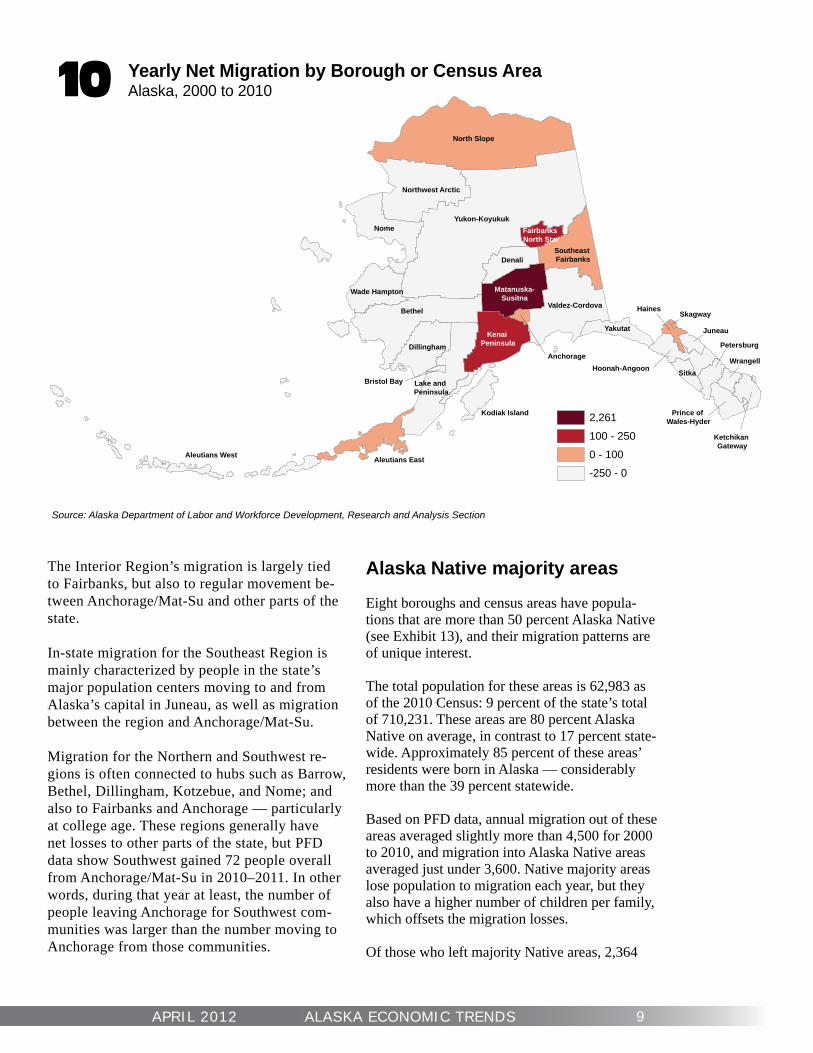
In terms of overall net migration across the state, the Matanuska-Susitna Borough gained the most on average, with more than 2,200 additional resi-dents per year. Mat-Su was followed by the Kenai Peninsula Borough and Fairbanks North Star Bor-ough, which each gained 250 people per year on average. (See Exhibit 10.) Military buildups and deployments have strongly affected Fairbanks’ population, especially over the past decade.
The state’s more rural areas have consistently lost population to migration over the past few decades. However, the Southwest and Northern regions have had higher-than-average natural increase — that is, births minus deaths — which has tended to make up for their migration losses. (See Exhibit 11.)
In Southeast, net migration losses led to some decline in the population between 2000 and 2010, but the region gained residents between 2010 and 2011.
Relocations within the state
Migration within Alaska often brings to mind the large numbers of people moving from villages to urban areas — particularly to Anchorage and Mat-Su — but that’s only part of the story. While Anchorage and Mat-Su attract migrants each year from rural areas, they also lose a large number of people to both rural and other areas of the state. (See Exhibit 12.)
PFD records show that between 2000 and 2010, the Anchorage/Mat-Su Region gained about 5,100 people per year from elsewhere in Alaska, but also lost about 3,700 each year.
As with state-to-state migration, a region’s size and location play an important role in these pat-terns. For example, the Anchorage/Mat-Su Re-gion — which has the most people moving in and out by far — holds more than half the state’s population, and is centrally located.
The Gulf Coast Region gained more than 500 residents each year since 2006, due in part to those who move to the Kenai Peninsula from neighboring Anchorage. Annual turnover be-tween the Gulf Coast and Anchorage/Mat-Su is also signifi cant.
9APRIL 2012 ALASKA ECONOMIC TRENDS
Yearly Net Migration by Borough or Census AreaAlaska, 2000 to 201010
Yukon-Koyukuk
North Slope
Bethel
Nome
Valdez-Cordova
Northwest Arctic
Denali
DillinghamKenai
Peninsula
Yakutat
Wade Hampton
Lake and Peninsula
Matanuska-Susitna
Southeast Fairbanks
Sitka
Aleutians East
Hoonah-Angoon
Kodiak Island
Petersburg
Juneau
Wrangell
Haines
Fairbanks North Star
Ketchikan Gateway
Prince of Wales-Hyder
Aleutians West
Anchorage
Bristol Bay
Skagway
2,261
100 - 250
0 - 100
-250 - 0
Source: Alaska Department of Labor and Workforce Development, Research and Analysis Section
The Interior Region’s migration is largely tied to Fairbanks, but also to regular movement be-tween Anchorage/Mat-Su and other parts of the state.
In-state migration for the Southeast Region is mainly characterized by people in the state’s major population centers moving to and from Alaska’s capital in Juneau, as well as migration between the region and Anchorage/Mat-Su.
Migration for the Northern and Southwest re-gions is often connected to hubs such as Barrow, Bethel, Dillingham, Kotzebue, and Nome; and also to Fairbanks and Anchorage — particularly at college age. These regions generally have net losses to other parts of the state, but PFD data show Southwest gained 72 people overall from Anchorage/Mat-Su in 2010–2011. In other words, during that year at least, the number of people leaving Anchorage for Southwest com-munities was larger than the number moving to Anchorage from those communities.
Alaska Native majority areas
Eight boroughs and census areas have popula-tions that are more than 50 percent Alaska Native (see Exhibit 13), and their migration patterns are of unique interest.
The total population for these areas is 62,983 as of the 2010 Census: 9 percent of the state’s total of 710,231. These areas are 80 percent Alaska Native on average, in contrast to 17 percent state-wide. Approximately 85 percent of these areas’ residents were born in Alaska — considerably more than the 39 percent statewide.
Based on PFD data, annual migration out of these areas averaged slightly more than 4,500 for 2000 to 2010, and migration into Alaska Native areas averaged just under 3,600. Native majority areas lose population to migration each year, but they also have a higher number of children per family, which offsets the migration losses.
Of those who left majority Native areas, 2,364

10 ALASKA ECONOMIC TRENDS APRIL 2012
Est
imat
eE
stim
ate
Est
imat
eE
stim
ate
Est
imat
eE
stim
ate
Est
imat
eE
stim
ate
Est
imat
eE
stim
ate
Cen
sus
Est
imat
eN
at in
crea
seN
et m
igra
tion
Pop
chan
geG
row
th ra
te
Are
a N
ame
Apr
il 20
00Ju
ly
2001
July
20
02Ju
ly
2003
July
20
04Ju
ly
2005
July
20
06Ju
ly
2007
July
20
08Ju
ly
2009
Apr
il 20
10Ju
ly
2011
2000
–20
1020
10–
2011
2000
–20
1020
10–
2011
2000
–20
1020
10–
2011
2000
–20
1020
10–
2011
Ala
ska
626,
932
632,
716
641,
729
649,
466
659,
653
667,
146
674,
583
680,
169
686,
818
697,
828
710,
231
722,
190
73,6
459,
845
9,65
42,
114
83,2
9911
,959
1.25
1.34
Anc
hora
ge /
Mat
-Su
Reg
ion
319,
605
326,
507
331,
975
340,
267
347,
904
352,
028
360,
060
362,
163
366,
562
375,
304
380,
821
387,
894
38,6
115,
213
22,6
051,
860
61,2
167,
073
1.75
1.47
A
ncho
rage
, Mun
icip
ality
260,
283
264,
600
267,
339
272,
304
276,
865
277,
157
281,
831
281,
151
282,
871
289,
230
291,
826
296,
197
31,5
474,
145
-422
631
,543
4,37
11.
141.
19
Mat
anus
ka-S
usitn
a B
orou
gh59
,322
61,9
0764
,636
67,9
6371
,039
74,8
7178
,229
81,0
1283
,691
86,0
7488
,995
91,6
977,
064
1,06
822
,609
1,63
429
,673
2,70
24.
002.
39
Gul
f Coa
st R
egio
n73
,799
73,7
9074
,576
75,7
3275
,129
75,4
0375
,196
76,1
2176
,973
77,7
4278
,628
80,0
225,
666
714
-837
680
4,82
91,
394
0.63
1.41
K
enai
Pen
insu
la B
orou
gh49
,691
50,1
9050
,879
51,7
4351
,616
51,7
3552
,025
52,9
0453
,669
54,6
3255
,400
56,3
693,
305
416
2,40
455
35,
709
969
1.09
1.39
K
odia
k Is
land
Bor
ough
13,9
1313
,517
13,5
5713
,691
13,4
1113
,491
13,2
2013
,399
13,6
2513
,616
13,5
9213
,870
1,61
620
8-1
,937
70-3
2127
8-0
.23
1.62
Va
ldez
-Cor
dova
Cen
sus
Are
a10
,195
10,0
8310
,140
10,2
9810
,102
10,1
779,
951
9,81
89,
679
9,49
49,
636
9,78
374
590
-1,3
0457
-559
147
-0.5
61.
21
Inte
rior R
egio
n97
,417
98,0
8999
,906
97,6
5210
1,55
510
4,39
110
4,91
910
9,33
611
0,47
311
0,75
211
2,02
411
2,17
013
,687
1,83
292
0-1
,686
14,6
0714
61.
390.
10
Den
ali B
orou
gh1,
893
1,88
91,
863
1,88
21,
806
1,76
91,
732
1,69
21,
717
1,78
81,
826
1,82
016
519
-232
-25
-67
-6-0
.36
-0.2
6
Fairb
anks
Nor
th S
tar B
orou
gh82
,840
83,8
7285
,860
83,7
1487
,555
90,3
8190
,953
95,3
5496
,423
96,6
3197
,581
97,6
1512
,449
1,64
92,
292
-1,6
1514
,741
341.
630.
03
Sou
thea
st F
airb
anks
CA
6,17
45,
847
5,83
65,
766
5,93
36,
199
6,40
96,
569
6,69
16,
743
7,02
97,
080
661
108
194
-57
855
511.
300.
58
Yuko
n-K
oyuk
uk C
ensu
s A
rea
6,51
06,
481
6,34
76,
290
6,26
16,
042
5,82
55,
721
5,64
25,
590
5,58
85,
655
412
56-1
,334
11-9
2267
-1.5
20.
95
Nor
ther
n R
egio
n**
23,7
8923
,616
23,8
0023
,843
23,8
7423
,665
23,6
5523
,548
23,5
3223
,685
26,4
4526
,965
4,34
659
8-1
,690
-78
2,65
652
01.
061.
56
Nom
e C
ensu
s A
rea
9,19
69,
260
9,33
59,
342
9,41
69,
448
9,52
19,
458
9,45
49,
492
9,49
29,
730
1,60
522
0-1
,309
1829
623
80.
321.
98
Nor
th S
lope
Bor
ough
**7,
385
7,22
17,
220
7,19
87,
098
6,85
76,
762
6,66
96,
633
6,74
99,
430
9,58
41,
328
162
717
-82,
045
154
2.43
1.30
N
orth
wes
t Arc
tic B
orou
gh7,
208
7,13
57,
245
7,30
37,
360
7,36
07,
372
7,42
17,
445
7,44
47,
523
7,65
11,
413
216
-1,0
98-8
831
512
80.
431.
35
Sou
thea
st R
egio
n73
,082
71,8
5372
,214
72,2
5071
,546
71,7
1271
,399
70,2
1970
,504
71,1
4171
,664
73,5
264,
962
653
-6,3
801,
209
-1,4
181,
862
-0.2
02.
05
Hai
nes
Bor
ough
2,39
22,
405
2,41
22,
391
2,34
32,
312
2,35
72,
387
2,46
42,
453
2,50
82,
620
4518
7194
116
112
0.47
3.49
H
oona
h-A
ngoo
n C
ensu
s A
rea
2,57
42,
426
2,32
92,
263
2,20
52,
225
2,17
72,
194
2,15
92,
166
2,15
02,
148
8116
-505
-18
-424
-2-1
.80
-0.0
7
June
au, C
ity a
nd B
orou
gh30
,711
30,4
8231
,047
31,3
6431
,213
31,3
4030
,943
30,3
5030
,554
30,9
4631
,275
32,2
902,
540
322
-1,9
7669
356
41,
015
0.18
2.55
K
etch
ikan
Gat
eway
Bor
ough
14,0
6713
,795
13,7
6413
,651
13,2
4213
,331
13,4
3913
,350
13,2
8713
,377
13,4
7713
,686
943
125
-1,5
3384
-590
209
-0.4
31.
23
Pet
ersb
urg
Cen
sus
Are
a4,
260
4,26
04,
191
4,11
54,
167
4,12
74,
056
3,99
33,
931
3,90
43,
815
3,95
111
332
-558
104
-445
136
-1.1
02.
80
Prin
ce o
f Wal
es-H
yder
CA
6,12
55,
804
5,67
95,
599
5,59
75,
546
5,53
55,
374
5,45
25,
525
5,55
95,
814
403
50-9
6920
5-5
6625
5-0
.97
3.59
S
itka,
City
and
Bor
ough
of
8,83
58,
737
8,81
28,
918
8,86
08,
990
9,04
38,
678
8,69
88,
730
8,88
18,
985
658
65-6
1239
4610
40.
050.
93
Ska
gway
, Mun
icip
ality
862
848
861
868
907
875
905
900
911
944
968
965
6311
43-1
410
6-3
1.16
-0.2
5
Wra
ngel
l, C
ity a
nd B
orou
gh2,
448
2,38
42,
369
2,34
92,
281
2,25
82,
232
2,31
62,
362
2,35
22,
369
2,41
179
10-1
5832
-79
42-0
.33
1.41
Ya
kuta
t, C
ity a
nd B
orou
gh80
871
275
073
273
170
871
267
768
674
466
265
637
4-1
83-1
0-1
46-6
-1.9
9-0
.73
Sou
thw
est R
egio
n39
,240
38,8
6139
,258
39,7
2239
,645
39,9
4739
,354
38,7
8238
,774
39,2
0440
,649
41,6
136,
373
835
-4,9
6412
91,
409
964
0.35
1.87
A
leut
ians
Eas
t Bor
ough
2,69
72,
553
2,73
22,
726
2,67
12,
677
2,61
32,
818
2,72
62,
908
3,14
13,
172
122
2132
210
444
311.
520.
79
Ale
utia
ns W
est C
ensu
s A
rea
5,46
55,
292
5,14
15,
430
5,37
05,
406
5,10
54,
711
4,66
94,
862
5,56
15,
546
251
24-1
55-3
996
-15
0.17
-0.2
2
Bet
hel C
ensu
s A
rea
16,0
4716
,066
16,4
3816
,640
16,7
3616
,915
16,8
3116
,542
16,6
2416
,725
17,0
1317
,548
3,34
144
0-2
,375
9596
653
50.
582.
48
Bris
tol B
ay B
orou
gh1,
258
1,17
71,
170
1,11
31,
114
1,19
31,
077
1,05
31,
050
995
997
1,03
567
10-3
2828
-261
38-2
.31
2.99
D
illin
gham
Cen
sus
Are
a4,
922
4,88
54,
911
4,89
44,
839
4,77
74,
787
4,75
84,
739
4,71
64,
847
4,94
765
395
-728
5-7
510
0-0
.15
1.63
La
ke a
nd P
enin
sula
Bor
ough
1,82
31,
739
1,65
01,
643
1,63
21,
647
1,58
91,
568
1,59
01,
597
1,63
11,
693
125
18-3
1744
-192
62-1
.11
2.98
W
ade
Ham
pton
Cen
sus
Are
a7,
028
7,14
97,
216
7,27
67,
283
7,33
27,
352
7,33
27,
376
7,40
17,
459
7,67
21,
814
227
-1,3
83-1
443
121
30.
602.
25
Not
e: In
terc
ensa
l 200
0-20
09, 2
010
Cen
sus,
and
pos
tcen
sal 2
011.
All
num
bers
are
bas
ed o
n 20
10 C
ensu
s ge
ogra
phy.
**Th
e la
rge
incr
ease
for 2
010
Cen
sus
Nor
th S
lope
Bor
ough
pop
ulat
ion
num
bers
is p
rimar
ily d
ue to
em
ploy
ees
at re
mot
e w
ork
site
s in
the
boro
ugh,
who
wer
e no
t cou
nted
in p
ast c
ensu
ses.
Sou
rces
: U.S
. Cen
sus
Bur
eau;
and
Ala
ska
Dep
artm
ent o
f Lab
or a
nd W
orkf
orce
Dev
elop
men
t, R
esea
rch
and
Ana
lysi
s S
ectio
n
Popu
latio
n by
Eco
nom
ic R
egio
n, B
orou
gh, a
nd C
ensu
s Ar
eaAl
aska
, 200
0 to
201
111

Anc
hora
geM
at-S
u Gul
f Coa
st
Nor
ther
n
Sou
thea
st
Sou
thw
est
Inte
rior
1,41
71,
652
1,192
868
945
574
455
685
183
155
619
381
116
174
47
24
57
51
63
45
158
147
252
249
62
46
153
87
Num
ber o
f Mig
rant
s
2510
0
200 50
0
700
800
1,00
01,
200
1,50
013
3 91
11APRIL 2012 ALASKA ECONOMIC TRENDS
Year
ly M
igra
tion
With
in th
e St
ate
PFD
dat
a, 2
000
to 2
010
12 Sou
rce:
Ala
ska
Dep
artm
ent o
f Lab
or a
nd W
orkf
orce
Dev
elop
men
t, R
esea
rch
and
Ana
lysi
s S
ectio
n

12 ALASKA ECONOMIC TRENDS APRIL 2012
Yukon-KoyukukCensus Area
North SlopeBorough
BethelCensus Area
NomeCensus Area
Northwest ArcticBorough
DillinghamCensus Area
Wade HamptonCensus Area
Lake and PeninsulaBorough
Matanuska-Susitna
86%
97%
75%
57%
86%
80%
78%
72%
Alaska Native Majority AreasAlaska, 201013
Source: Alaska Department of Labor and Workforce Development, Research and Analysis Section
per year went elsewhere in Alaska, and 2,163 left the state. (See Exhibit 14.)
Of those who moved to a majority Native area, 1,513 per year arrived from another part of Alaska, and 2,065 came from outside the state.
Within Alaska, most of these areas’ movements are to and from Anchorage, with much smaller but consistent numbers moving to and from Fair-banks, the Kenai Peninsula, and Mat-Su. Due to small numbers and fewer data sources, moves to and from outside of Alaska are harder to track, but other states with large numbers of Alaska Natives are Washington (12,485), Oregon (3,190), and Florida (1,115).
Gross migration by age and sex to and from these areas follows the overall pattern of high numbers at young ages, decreasing to high school age, then jumping sharply at age 18 with a gradual decline from the mid-20s on. Though men have higher overall rates of migration between Native major-ity areas and all other places, women have higher post-high school rates of relocation between Na-
Native Majority AreasYearly migration, 2000 to 201014
Note: Based on Permanent Fund Dividend dataSource: Alaska Department of Labor and Workforce Devel-opment, Research and Analysis Section
Out of Nativemajority areas
Into Nativemajority areas
0
500
1,000
1,500
2,000
2,500
3,000
3,500
4,000
4,500
5,000
2,163 2,065
2,364
1,513
Outside stateRest of Alaska
tive majority areas and Anchorage.
Of Alaskans in these areas who were 18 in 2005, 73 percent still lived in a Native majority area or had returned in 2010, and 12 percent lived else-

13APRIL 2012 ALASKA ECONOMIC TRENDS
where in Alaska. The remaining 15 percent didn’t apply for a PFD , so their status was unknown. Many had likely moved outside the state.
As with all areas, the reasons people migrate to and from majority Alaska Native areas are com-plex and varied. People at certain ages, particu-larly those looking to start a career or further their education, have a tendency to move more.
However, the overall net gains and losses are best understood through incentives. There is a rural-to-urban migration trend throughout the world be-cause people in remote locations have incentives to move to more populated areas with more job opportunities and amenities, and this holds true in Alaska.
Where to fi nd migration dataFor annual estimates of migration, including data from the Alaska Permanent Fund, Internal Revenue Service, and the American Community Survey, go to labor.alaska.gov/research. Click “Population and Census,” then select “Migration Data and Information.”