by jean c. lewis and frederick j. spitz - usgs · hydrogeology, ground-water quality, and the...
TRANSCRIPT

HYDROGEOLOGY, GROUND-WATER QUALITY, AND
THE POSSIBLE EFFECTS OF A HYPOTHETICAL RADIOACTIVE-WATER SPILL,
PLAINSBORO TOWNSHIP, NEW JERSEY
By Jean C. Lewis and Frederick J. Spitz
U.S. GEOLOGICAL SURVEY
Water-Resources Investigations Report 87-4092
Prepared in cooperation with the
UNITED STATES DEPARTMENT OF ENERGY
West Trenton, New Jersey 1987

DEPARTMENT OF THE INTERIOR
DONALD PAUL MODEL, Secretary
U.S. GEOLOGICAL SURVEY
Dallas L. Peck, Director
For additional information write to:
District ChiefU.S. Geological SurveyMountain View Office Park810 Bear Tavern RoadSuite 206West Trenton, New Jersey 08628
Copies of this report can be purchased from:
Open-File Services Section Western Distribution Branch U.S. Geological Survey Box 25425, Federal Center Denver, Colorado 80225

CONTENTS
Page
Abstract ............................................................. 1Introduction ......................................................... 1
Background ....................................................... 1Purpose and scope ................................................ 3Description of the study area .................................... 4Methods of investigation ......................................... 7
Test drilling ............................................... 7Aquifer testing ............................................. 7Infiltration-capacity measurements .......................... 7Streamflow measurements ..................................... 8Spill simulation............................................. 8Water-level measurements .................................... 10Water-quality sampling and analysis ......................... 10
Data for wells and corehole ...................................... 10Previous investigations .......................................... 10Acknowledgments .................................................. 10
Hydrogeology.......................................................... 17Hydrogeologic framework........................................... 17Hydrogeologic characteristics of bedrock and overburden........... 17Evapotranspiration................................................ 20Infiltration and flow through the unsaturated zone................ 23Ground-water/surface-water relations ............................. 24Recharge and discharge ........................................... 24Potentiometric surfaces and ground-water flow .................... 26
Ground-water quality ................................................. 30Background water quality ......................................... 30Water-quality monitoring program ................................. 33
Possible effects of a hypothetical radioactive-water spill ........... 33Potential flow paths of spilled water ............................ 33Fate of tritium in ground water .................................. 35
Summary and conclusions .............................................. 36References cited ..................................................... 39Glossary ............................................................. 42
ILLUSTRATIONS
Figure 1. Map of New Jersey showing location of study area .......... 22. Map of study area showing location of radioactive-waste
tanks, reactor building, and wells ........................ 53. Topographic map of study area ............................. 64. Map of area around simulated spill showing extent of
flooding and locations of infiltration-capacity measurements .............................................. 9
5. Geophysical logs of corehole CHa. Gamma-ray log ......................................... 14b. Electric log .......................................... 15c. Caliper log............................................ 16
6. Schematic representation of hydrogeologic framework andpotential flow paths of spilled water ..................... 18
7. Graphs of drawdown and recovery during aquifer test ....... 21
ill

ILLUSTRATIONS --Continued
Page
8. Map showing discharge rates along Bee Brook, October 1985 . 259. Hydrographs of wells R5B and TW6 with graph of
precipitation amounts, March-December 1986 ................ 2710. Hydrographs of wells TW5 and TW9, March-September 1986 .... 2811. Map of potentiometric surface of the bedrock aquifer,
October 30, 1986 .......................................... 29
TABLES
Table 1. Construction, altitude, and hydrogeologic data for wells ... 112. Interpretive hydrogeologic log of corehole CH .............. 123. Summary of aquifer-test drawdown data ---------------------- 194. Evaporation and potential evapotranspiration for the study
area ....................................................... 225. Summary of soil infiltration-capacity rates ................ 236. Water-quality data for wells in the study area ............. 31
IV

CONVERSION FACTORS
For use of readers who prefer to use metric (International System) units, rather than the inch-pound terms used in this report, the following conversion factors may be used:
Multiply inch-pound unit By To obtain metric unit
foot (ft) 0.3048 meter (m)foot squared per day (ft 2 /d) 0.09290 meter squared per day (m2 /d)cubic foot (ft 3 ) 28.32 liter (L)gallon (gal) 3.785 liter (L)gallon per minute (gal/min) 0.0630 liter per second (L/sec)inch (in.) 25.4 millimeter (mm)mile (mi) 1.609 kilometer (km)square mile (mi 2 ) 2.590 square kilometer (km2 )
v

HYDROGEOLOGY, GROUND-WATER QUALITY, ANDTHE POSSIBLE EFFECTS OF A HYPOTHETICAL RADIOACTIVE-WATER SPILL,
PLAINSBORO TOWNSHIP, NEW JERSEY
By Jean C. Lewis and Frederick J. Spitz
ABSTRACT
Princeton University, under contract to the U.S. Department of Energy, maintains a Tokamak fusion test reactor in New Jersey. The U.S. Geological Survey investigated ground-water flow and estimated the effects of a hypothetical spill of radioactive water at the site on the local ground- water system. The study included test drilling; aquifer testing; measurement of water levels, infiltration-capacity, and stream discharge; and a simulation of the hypothetical spill.
The Triassic Stockton Formation a water-supply aquifer composed primarily of jointed siltstone and sandstone--underlies the site. The aquifer is confined by overlying weathered bedrock and underlying unjointed rock. Weathered bedrock is overlain by unconsolidated, partially saturated material which ranges from 6 to 39 feet in thickness. Ground-water recharge is by lateral flow into the study area, stream leakage, and precipitation. Discharge is by pumpage, evapotranspiration, stream inflow, and lateral flow out of the study area. Transmissivity of the aquifer is about 1,740 feet squared per day, and the storage coefficient is about 0.0002. The average linear velocity of ground-water at the site ranges from 100 to 270 feet per year depending on location and time of year. The velocity over a large part of the site is controlled by on-site pumpage.
Ground-water samples were collected and analyzed for common ions, trace metals, and tritium. The analyses reported no concentrations of common ions or trace metals which exceeded the criteria for drinking-water standards recommended by the U.S. Environmental Protection Agency, except for some instances of moderately high concentrations of iron and manganese. However, moderately high concentrations of iron and manganese are common in ground water and surface water in the area and are not indicative of an on-site source of contamination. Tritium concentrations in the collected samples were also considered representative of background levels and were well below the maximum concentration permitted by the U.S. Environmental Protection Agency.
The fate of spilled radioactive water after a hypothetical accident would depend on the nature of the accident and weather. If the on-site pumpage continued after a spill, ground water leaving the site probably would have only minimal tritium concentrations, but stream water leaving the site could contain significant tritium concentrations.
INTRODUCTION
Background
Princeton University, under contract to the U.S. Department of Energy,maintains a Tokamak fusion test reactor at the James Forrestal Campus ofPrinceton University in Middlesex County, New Jersey (fig. 1). The reactor

PW
2 W
ate
r-q
uality
sa
mp
ling
si
te3
0
MIL
ES
i___i
30
K
ILO
ME
TE
RS
Fig
ure
1
.--L
ocati
on
o
f th
e
stu
dy
are
a.

is an experimental device which uses fusion energy rather than the fission energy used in conventional nuclear reactors. At present, the Tokamak fusion test reactor is being operated using only deuterium--a non- radioactive isotope of hydrogen. However, a more efficient fusion process uses deuterium and tritium--a radioactive isotope of hydrogen. Tritium has a half life of 12.33 years (Walker and others, 1977) and emits beta radiation. Plans indicate that tritium will be used in the reactor beginning in 1990.
Self-contained storage and circulation systems within the reactor building are designed to prevent the escape of any radioactive water within the building. However, in the event of such an escape, all of the radioactive water would be pumped from the building to three above-ground tanks outside the building. These tanks could then contain as much as 45,000 gallons of water with 25,000 curies (4.6 X 10 10 tritium units or 1.47 X 10 11 picoCuries per liter) of radioactivity. The three tanks are surrounded by a concrete containment structure consisting of a floor and 3- foot-high walls. This containment structure could hold the entire 45,000- gallon capacity of the tanks.
The probability of the tanks and the containment structure both breaking at a time when the tanks contained a significant amount of tritium is less than 1 in 1 million per year (J. D. Levine, Ebasco Services, Inc., written communication, 1987). However, there was a need to estimate the effect on ground water of that hypothetical, worst-case accident because the site overlies a water-supply aquifer. The aquifer (the Stockton Formation) is used by communities as near as Princeton Borough (fig. 1) for potable-water supply. The U.S. Geological Survey, in cooperation with the U.S. Department of Energy, investigated the ground-water system at the site and assessed the effects of a hypothetical radioactive-water spill on the aquifer.
Purpose and Scope
The purpose of this report is to describe the hydrogeology of the study area, to characterize ground-water quality, and to report the possible effects of a hypothetical spill of radioactive water from above-ground radioactive-waste tanks on ground water. Determination of the fate of spilled water which leaves the study area through surface-water bodies or the atmosphere was not an objective of this study.
This report discusses the methods and results of investigations conducted between March 1985 and December 1986. Hydrogeological investigations included well drilling, aquifer testing, water-level measurements, borehole geophysics, stream-discharge measurements, infiltration-capacity measurements, and a simulated spill using sodium bromide as a tracer. The hydrogeologic framework, recharge and discharge areas, ground-water flow rates, directions of ground-water flow, and hydraulic properties of the hydrogeologic units were determined. Background water quality was investigated in terms of common ions, trace metals, and tritium, and an on-going ground-water-quality monitoring program was begun. Infiltration capacity and evaporation rates were determined, but because the unsaturated zone within the study area is thin, no investigations were done to determine the hydraulic properties or the quality of the interstitial water within this zone.

Description of the Study Area
The study area (fig. 2) comprises a 0.3 square-mile area within James Forrestal Campus of Princeton University in Plainsboro Township, Middlesex County, New Jersey. It lies about 4,000 feet northwest of the Fall Line, which separates the Coastal Plain and Piedmont physiographic provinces (fig. 1) . In New Jersey, the Piedmont physiographic province consists entirely of the Newark Basin. The Newark Basin, along with several other Triassic and Jurassic basins in the eastern part of the United States, was formed as the result of infilling of a rift basin formed prior to continental breakup (Sanders, 1963). Sediments deposited in the basin formed sandstone, siltstone, mudstone, and shale. In some places within the Newark Basin, basaltic lava flows are interbedded with these rocks. After deposition and consolidation, the rocks were tilted and, in places, faulted and intruded with diabase dikes (Sanders, 1963). The Newark Basin rocks are part of the Newark Supergroup, which in New Jersey includes, in ascending order, the Stockton and Lockatong Formations, the Passaic Formation of Olsen (1980), the Feltville, Towaco, and Boonton Formations, and the interbedded Orange Mountain, Preakness, and Hook Mountain Basalts. The oldest of these formations, the Stockton Formation, underlies the study area.
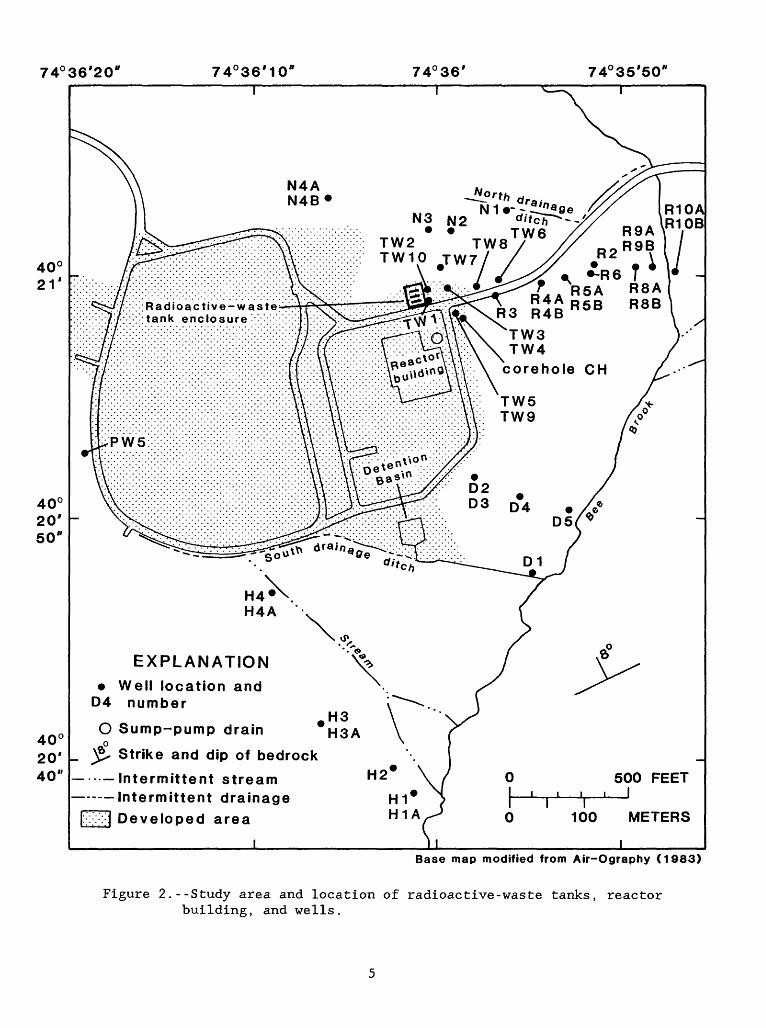
In the study area, the Stockton Formation consists of olive-gray, gray, and red siltstone, and fine- to medium-grained sandstone with minor amounts of shale and clay. Near-vertical joints are common. Some of the vertical joints are coated with secondary minerals. No large faults have been reported in or near the study area, and areal photographs do not reveal any faults. Bedrock strikes approximately 65 degrees northeast and dips approximately 8 degrees northwest. Strike and dip were estimated by determining the altitude of key strata in the study area using geophysical and geologic logs of wells TW1, TW4, TW6, TW7, TW8, TW9, TW10, and corehole CH (fig. 2).
The study area is characterized by a moderate climate and low topographic relief. Mean-monthly temperatures at Hightstown, New Jersey (fig. 1), the nearest temperature station, ranged from 30.4 degrees Fahrenheit in January to 74.4 degrees Fahrenheit in July during the period 1895 to 1984 (National Oceanic and Atmospheric Administration, 1985). Mean- monthly precipitation at Princeton, New Jersey (fig. 1), the nearest precipitation station, ranged from 3.11 inches in February to 4.89 inches in August during the period 1947 to 1984 (National Oceanic and Atmospheric Administration, 1985). Land-surface altitude within the study area ranges from about 71 to 110 feet. Figure 3 shows the topography of the undeveloped parts of the study area. No topographic data is available for the developed parts of the study area, except at the sites where wells were installed for this study.
Surface drainage from the study area is to Bee Brook and its tributaries. The only perennial tributary within the study area is the south drainage ditch (fig. 2). This ditch receives cooling-water blowdown from the reactor, storm-sewer water, and natural drainage. Bee Brook, after leaving the study area, flows into Devils Brook and the Millstone River (fig. 1) . The Millstone River flows under the Delaware and Raritan Canal (fig. 1) through a tunnel.
74°36'20' 74°36'10' 74°36 f 74°35'50 <l
40° 21'
40° 20' 50"
40° 20' 40"
R10A R10B
Radioactive-waste- tank enclosure R4B
TW3 TW4
corehole CH
EXPLANATION
Well location and D4 number
O Sump-pump drain
Strike and dip of bedrock
- Intermittent stream Intermittent drainage
xi-j Developed area
500 FEET
100 METERS
_LBase map modified from Air-Ography (1983)
Figure 2.--Study area and location of radioactive-waste tanks, reactor building, and wells.

74°36'20" 74°36'10" 74°36' 74°35'50'
Radioactive-waste tank enclosure
EXPLANATION
Altitude of land surface, / in feet above sea level Contour interval 2 feet. Datum is NGVD of 1929.
Area shown in figure 4
Intermittent stream
Intermittent drainage
500 FEET
METERS
Developed area
Topographic contour lines modified from A.D.R. Associates (1973)
Base map modified from Air-Ography (1983)
Figure 3.--Topographic map of study area.

Methods of Investigation
Test Drilling
Forty-one boreholes were drilled in the study area. Wells were installed in 40 of the boreholes. Figure 2 shows the location of each well and the borehole not finished as a well (referred to as "corehole CH"). Well PW5, also shown on figure 2, was installed in 1958 and was formerly used for water supply at the site. It is currently used only as a backup source of fire-fighting water. Wells TW1, TW2, TW3, TW4, TW5, TW6 , TW7, TW8, TW9, and TW10 were installed using air-rotary and hydraulic-rotary drilling methods. For all of those wells except TW3 and TW4, 4-inch- diameter steel casing was placed in 8 3/4-inch-diameter boreholes and set in place with a cement-bentonite seal. After the seal had set, the remaining depth was drilled with a 3 7/8-inch-diameter bit. Wells TW3 and TW4 were completed with 10 3/4-inch-diameter boreholes, 6-inch-diameter steel casings, and 5 7/8-inch-diameter open holes. Other construction data for each well and the corehole are presented in the section on data for wells and the corehole. The wells were developed with forced air until the water was clear and free of debris. Borehole-geophysical logs (natural gamma radiation, single-point resistance, spontaneous potential, and caliper) were obtained from each borehole prior to installing well casing.
Continuous cores were collected to a depth of 120 feet below land surface from corehole CH (fig. 2). A 2-inch-diameter, 10-foot long core barrel was used for rock coring, and a split-spoon sampler was used to core the overburden. Logs of the corehole are presented in the section on data for wells and the corehole.
Thirty wells were installed using a portable auger. Each well was constructed by augering a 3-inch borehole and installing 1/2-inch polyvinyl chloride (PVC) pipe to the intended depth of the well. The lower section of the PVC pipe was slotted to effect a screened interval, and the bottom was capped. Gravel was placed around the screen, and bentonite pellets were placed in the annular space to provide a seal.
Aquifer Testing
An aquifer test was conducted March 31 through April 8, 1986. Well TW3 was pumped at a constant rate of 100 gallons per minute for 100 hours. During pumping and recovery, water levels in wells TW1, TW2, TW3, TW4, TW5, TW6, TW7, TW8, TW9, TW10, selected augered wells, and PW5 were measured. All water-level measurements were made using a steel tape, except in the pumped well, where both an electric tape and a pressure transducer were used.
Infiltration-Capacity Measurements
Compact double-cap infiltrometers were used to estimate infiltration capacity in four representative areas downslope of the radioactive-waste tanks. The theory and use of double-cap infiltrometers have been described by Constantz (1983).
Streamflow Measurements
To delineate gaining and losing reaches of Bee Brook within the study area, discharge measurements were made at seven sites in the Brook and in its tributaries during October 1985. At most sites, a Parshall flume was used, but where streambed conditions did not allow measurement with a flume, a pygmy meter was used. For one small tributary, a visual estimation of flow was made.
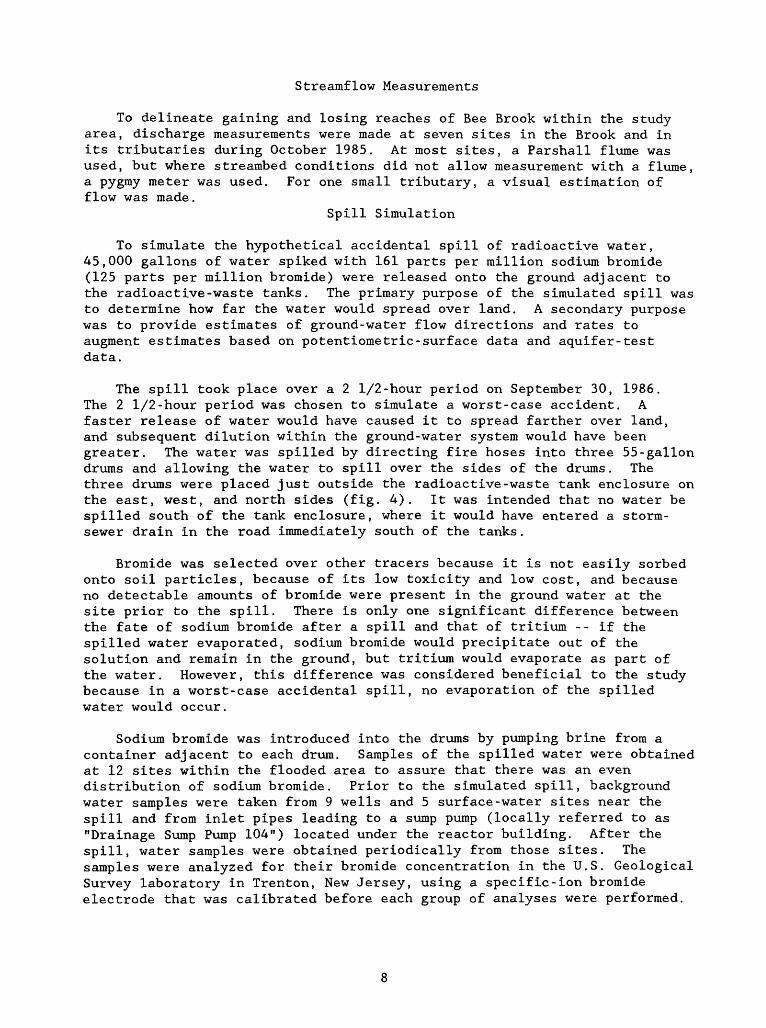
Spill Simulation
To simulate the hypothetical accidental spill of radioactive water, 45,000 gallons of water spiked with 161 parts per million sodium bromide (125 parts per million bromide) were released onto the ground adjacent to the radioactive-waste tanks. The primary purpose of the simulated spill was to determine how far the water would spread over land. A secondary purpose was to provide estimates of ground-water flow directions and rates to augment estimates based on potentiometrie-surface data and aquifer-test data.
The spill took place over a 2 1/2-hour period on September 30, 1986. The 2 1/2-hour period was chosen to simulate a worst-case accident. A faster release of water would have caused it to spread farther over land, and subsequent dilution within the ground-water system would have been greater. The water was spilled by directing fire hoses into three 55-gallon drums and allowing the water to spill over the sides of the drums. The three drums were placed just outside the radioactive-waste tank enclosure on the east, west, and north sides (fig. 4). It was intended that no water be spilled south of the tank enclosure, where it would have entered a storm- sewer drain in the road immediately south of the tanks.
Bromide was selected over other tracers because it is not easily sorbed onto soil particles, because of its low toxicity and low cost, and because no detectable amounts of bromide were present in the ground water at the site prior to the spill. There is only one significant difference between the fate of sodium bromide after a spill and that of tritium --if the spilled water evaporated, sodium bromide would precipitate out of the solution and remain in the ground, but tritium would evaporate as part of the water. However, this difference was considered beneficial to the study because in a worst-case accidental spill, no evaporation of the spilled water would occur.
Sodium bromide was introduced into the drums by pumping brine from a container adjacent to each drum. Samples of the spilled water were obtained at 12 sites within the flooded area to assure that there was an even distribution of sodium bromide. Prior to the simulated spill, background water samples were taken from 9 wells and 5 surface-water sites near the spill and from inlet pipes leading to a sump pump (locally referred to as "Drainage Sump Pump 104") located under the reactor building. After the spill, water samples were obtained periodically from those sites. The samples were analyzed for their bromide concentration in the U.S. Geological Survey laboratory in Trenton, New Jersey, using a specific-ion bromide electrode that was calibrated before each group of analyses were performed.

74°36'03'
74°36'00"
EXPLANATION
Well location and number
2J Infiltration measurement area and number
Figure 4.--Area around simulat-f>H infiltration-capa<4 °f and Wations of

Water-Level Measurements
Continuous water-level recorders were installed in well TW5 (60 feet deep) and TW9 (110 feet deep). Water levels in all other wells were measured manually at least twice monthly. A steel tape was used for all water-level measurements. Water-level data are on file at the U.S. Geological Survey office in West Trenton, New Jersey.
Water-Quality Sampling and Analysis
Wells TW1 and TW10 were sampled quarterly, and the samples were analyzed for their common-ion, trace-metal, and tritium concentrations. Common-ion and trace-metal analyses were performed by the U.S. Geological Survey Central Laboratory in Arvada, Colorado using methods described in Fishman and Friedman (1985). Quality-control procedures used at the laboratory include frequent analysis of blind samples, standards, and spiked samples. A full description of the Laboratory's quality-assurance procedures is documented in Friedman and Erdmann (1982). Quality assurance for tritium analyses has been maintained by splitting samples and sending them to both the Princeton Plasma Physics Laboratory and the University of Miami Tritium Laboratory for analysis.
Data for Wells and Corehole
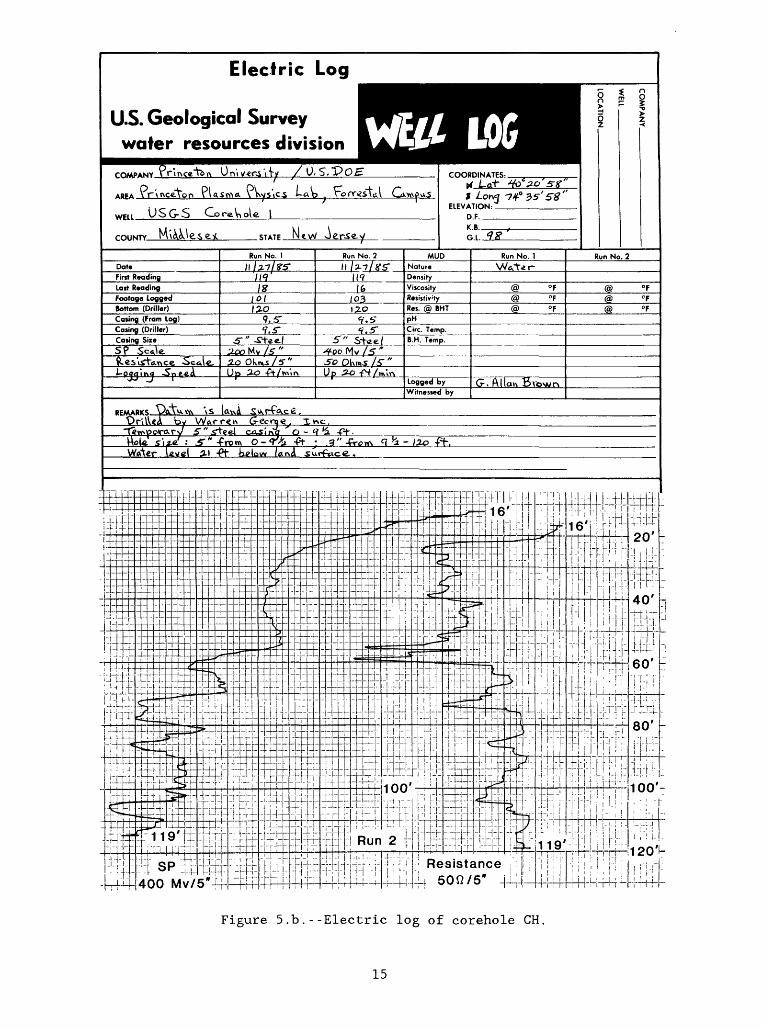
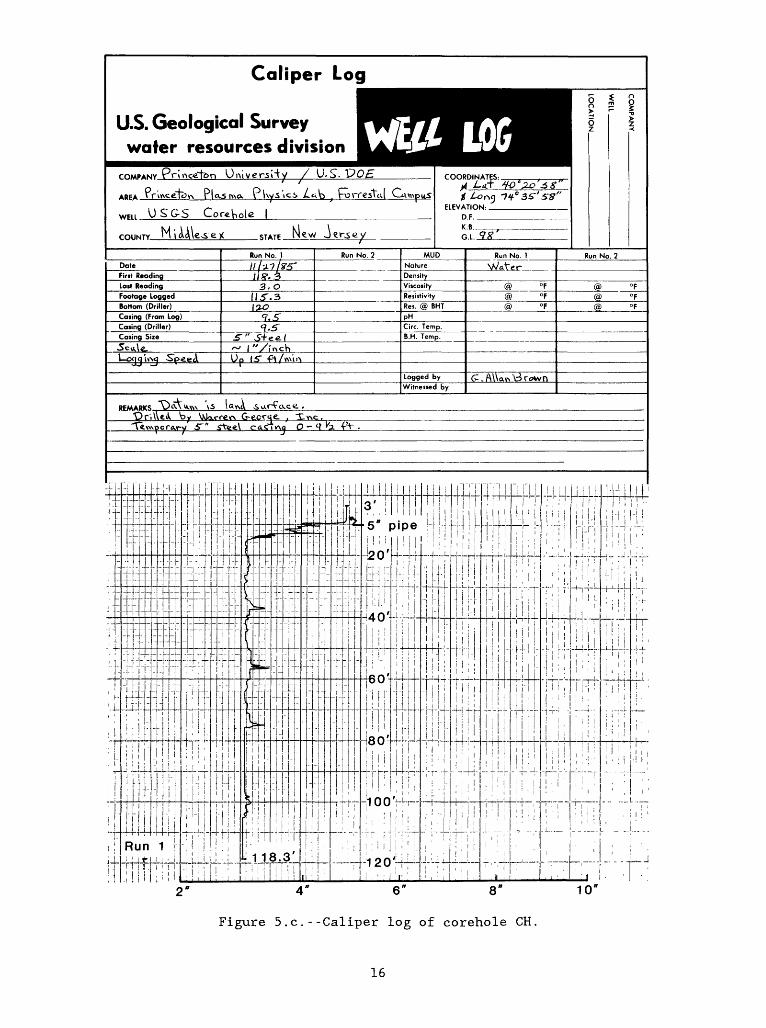
Table 1 lists construction, hydrogeologic, and altitude data for each well used for this study and for corehole CH. For the corehole, an interpretive hydrogeologic log is presented in table 2, and borehole- geophysical logs are presented in figures 5a-5c. Interpretive hydrogeologic logs and borehole-geophysical logs for the wells that were installed for this study are available at the U.S. Geological Survey office in West Trenton, New Jersey.
Previous Investigations
Only two studies have been done which focus on the study area. In 1976, Joseph S. Ward, Inc. reported on results of an investigation of soils and foundation conditions, which included the drilling of several boreholes in the area of the reactor building. Stencel (1985) reported on environmental monitoring conducted during 1984, which included results of chemical analyses of ground- and surface-water samples collected in and near the study area.
Several regional studies of the geology and hydrology of the Stockton Formation and other formations within the Newark Supergroup have been done. Barksdale and others (1943) reported on ground-water supplies of Middlesex County. Rima and others (1962) reported on the geology and hydrology of the Stockton Formation in Southeastern Pennsylvania. Vecchioli and others (1969) reported results of aquifer tests in the rocks formerly known as the Brunswick Formation at a site near Trenton, New Jersey.
Acknowledgments
The authors are grateful to personnel at the Department of Energy and the Princeton Plasma Physics Laboratory for their assistance throughout the
10

Table 1.-- Construction, altitude, and hydrogeologic data for wells.
[Altitude refers to distance above sea level; a dash indicates that water-level data were collected but are not reported because they are believed not to be representative of the potentiometric surface.]
Well number
CHD1D2D3D4
D5H1H1AH2H3
H3AH4H4AN1N2
N3N4AN4BPW2bPW3b
PW5dR2R3*eR4AR4B*
R5A*R5BR6RSAR8B*
R9AR9BR10AR10BTW1
TW2fTW3TW4TW5TW6
TW7TW8TW9TW10
LocationLati tude
402058402048402052402052402051
402050402039402039402040402042
402042402047402047402103402102
402102402103402103402043402045
402053402101402059402100402100
402100402100402100402101402101
402101402101402100402100402059
402100402100402100402058402100
402100402100402058402100
Longi - tude
743559743555743558743558743555
743553743601743601743602743606
743606743609743609743556743559
743601743606743606743650743648
743619743552743557743554743554
743553743553743552743549743549
743548743548743547743547743601
743601743559743559743559743557
743600743558743559743601
Altitude of land surface (feet)
9880.986.386.384.4
81.577.677.480.584.5
84.488.188.391.592.3
92.095.995.9115115
103.889.993.593.593.5
92.792.791.386.386.3
85.485.485.685.697.6
97.795.996.796.795.9
93.493.896.897.1
Open/screened interval (feet below land surface)
(Corehole -3.5- 5.04.3- 5.814.0- 17.016.0- 19.0
15.0- 18.04.7- 6.215.0- 18.03.7- 5.28.6- 10.1
16.5- 19.58.2- 9.713.2- 16.28.0- 9.58.1- 9.6
14.8- 16.38.0- 11.03.0- 6.0
?? -297?? -406
50 -27512.4- 13.98.8- 10.315.0- 18.09.0- 12.0
27.0- 30.020.0- 23.024.0- 27.025.0- 28.09.0- 12.0
39.0- 42.033.0- 36.028.0- 31.022.0- 25.031 - 60
31 - 6830 - 81100 -12020 - 6026 - 73
41 - 8530 - 7590 -110100 -125
I Water- level altitude (feet)
4/10/86 1
not completed79.6282.86N.I.N.I.
N.I.76.10N.I.
77.2682.01
N.I.86.95N.I.
84.2483.86
83.31N.I. aN.I.N.M. CN.M.
N.M.83.00
81.64
82.9982.9682.98
82.9883.0283.0783.0776.41
77.2276.4476.5876.3677.94
76.6776.6676.5576.67
0/30/86
as a well)78.64Dry79.5679.76
75.3872.8272.89Dry75.87
75.9180.9681.49DryDry
78.20N.I.N.I.N.M.N.M.
N.M.79.71
77.77Dry
79.7279.7279.97--
80.0080.0880.2080.2274.00
74.0574.0374.0674.0375.06
74.07N.M.
74.1274.09
Hydrogeologic unit
Weathered bedrockWeathered bedrockBedrock aquiferBedrock aquifer
Bedrock aquiferWeathered bedrockBedrock aquiferWeathered bedrockWeathered bedrock
Bedrock aquiferWeathered bedrockBedrock aquiferWeathered bedrockWeathered bedrock
Bedrock aquiferBedrock aquiferWeathered bedrockBedrock aquiferBedrock aquifer
Bedrock aquiferWeathered bedrockWeathered bedrockBedrock aquiferWeathered bedrock
Bedrock aquiferWeathered bedrockBedrock aquiferBedrock aquiferWeathered bedrock
Bedrock aquiferAlluviumBedrock aquiferAlluviumBedrock aquifer
Bedrock aquiferBedrock aquiferBedrock aquiferBedrock aquiferBedrock aquifer
Bedrock aquiferBedrock aquiferBedrock aquiferBedrock aquifer
Notes
a. "N.I." indicates that the well had not been installed at the time of measurement.b. This well is located outside the study area, at "B" site of the James Forrestal Campus,
about 4,700 feet west-southwest of the reactor building. It was installed prior to theU.S. Ge9logical Survey study.
c. "N.M." indicates that the well was not measured, d. Well installed prior to U.S. Geological Survey study, e. "*" indicates that this well is believed to be clogged or broken; anomalous water-level
data are common, f. Anomalous water-level data are common in this well and are probably due to a rainspout
located a few feet from the well site.
11

Table 2.--Interpretive hydrogeologic log of corehole CH.
Depth of bottom of cored interval
Thickness below land surface Hvdrogeologic unit and description____________(feet)________(feet)____
Overburden (Fill):
Silt, sand, and gravel, yellowish-brown;clayey. 2.0 2.0
Overburden (Weathered bedrock - Confining unit):
Sand, fine- to coarse-grained, dark yellowish- orange, grading to moderate yellowish-brown clayey silt and fine sand. 5.2 7.2
(No sample.) 1.8 9.0
Sandstone, grayish-orange, fine-grained,micaceous, weathered. Closely spacedhorizontal fractures. 3.0 12.0
Siltstone, yellowish-gray, clayey, veryweathered. 1.0 13.0
Sandstone, light olive-gray, very fine-to fine-grained, micaceous. Near-horizontalfractures spaced 1 to 8 inches apart, somewith oxidized surfaces. 7.0 20.0
Bedrock aquifer:
Same as overlying 7 feet, but with one near-vertical fracture with oxidized surface. 5.0 25.0
Sandstone, same as overlying 12 feet, butvery weathered, oxidized, and somewhatclayey. 1.0 26.0
Siltstone and fine-grained sandstone,grayish-red, micaceous. Horizontal fracturesspaced 0.5 to 27 inches apart; most haveoxidized surfaces. One near-verticalfracture with oxidized surface at 36 to37-foot depth. 29.0 55.0
12

Table 2.--Interpretive hvdrogeologic log of corehole CH--Continued.
Depth (below land surface) of bottom
Thickness of cored interval Hydrogeologic unit and description___________(feet)___(feet)______________
Bedrock aquifer--Continued:
Clay, pale reddish-brown. 2.0 57.0
Siltstone and fine-grained sandstone,grayish-red, clayey. Horizontal fracturesspaced 5 to 6 inches apart; one verticalfracture. 2.0 59.0
Clay, pale reddish-brown. 0.5 59.5
Sandstone, fine- to medium-grained, mottledgrayish-red and light gray, very micaceous.Horizontal fractures spaced 4 to 18 inchesapart; two near-vertical fractures. 8.0 67.5
Siltstone and fine-grained sandstone, lightgray, very micaceous. Three near-verticalfractures with white (clay?) coating.Horizontal fractures spaced 0.5 to 14 inchesapart. 16.5 84.0
Alternating layers of:Sandstone, fine- to medium-grained, light
gray, micaceous, and Siltstone and fine-grained sandstone,
grayish-red, micaceous.Horizontal fractures spaced 1 to 21 inches apart. 10.0 94.0
Sandstone, fine- to medium-grained, light gray, micaceous. Horizontal fractures spaced 2 to 25 inches apart; one near-vertical fracture at depth of 100 to 104 feet coated with white (clay?) mineral. 26.0 120.0
13

Gamma Ray Log
U.S. Geological Survey water resources division
9r'»nc£tor> OtWrsVfy / U.S. POE"
LOGWFII US G-S Corg.VicAe- \
COUNTY- MtAAV Mew ier.se)
COORDINATES:
ELEVATION: D.F._ K.B.__ G.l._i
? i i
Run No. 2 MUD Run No. 2Date NatureFirtt Reading 111.3- Deniity
Lo«t Reading 3..0 3..0 Vitcotiry @ @Footage Logged R«iiitiv ;ty
Bottom (Driller) Rei. @ BHT @Coring (From log) PHCoring (Driller) f.S'
Circ. T»mp.Coring Sixe
/fUll Scale.
B.H. Temp.
Time ConstantSensilivity
Logging tpeed UP >0 -ft/m'm Logged by G. Allan Pn>wnWitneiied by
REMARKS. pr'AVS" SJe«l
-Cf
100 200 300 COUNTS PER SECOND
400 500
Figure 5.a.--Gamma-ray log of corehole CH.
14
Electric Log
U.S. Geological Survey water resources division WEff LOG
S I i
COMPANY?r'mce"W /O. S.
ABFA \Vs'»ys»c.s
WFII USG-S CoreViole |
COUNTY. STATE N<w Jersey
COORDINATES: b^ Lett
$ELEVATION
D.F. K.B. G.L.
Run No. 1 Run No. 1 Run No. 1Date \\rj-ilxs' Nature
Firrt Reading Density
Last Reading Viscosity @Footage Logged JQI 103 Resistiv ;ty @ @Bottom (Driller) 1 2-0 Res. @ BHT @Casing (From Log) 9.5- PHCasing (Driller) Circ. Temp.Casing Size .5"' 5" /y
B.H. Temp.SP ^CO My IS 4-oc Mv /5"
3.0L-oc -Spfc-fcA Up Up
Logged byWitnessed by
REMARKS.Pr-.VU
cASJr\a O - <? 1HoU. O- ft
W«for Al -Pt- larxA
Resistance "!i!-U son/5"
Figure 5.b.--Electric log of corehole CH.
15
Caliper Log
U.S. Geological Survey water resources division
COMPANY Prince-fen UmversHy / US. VOE
AREA. Pr'vftcefovN ?U.smcv. P\\y.s\c.s /.dip ^ Forrestal
QS'GS Cor^V^oic |____________
New J gr^ay
Run No. 1 Run No. 2Date
Pint Reading
Last Reading 3.0Densit
Viscosity @ @ °F
Footage Logged Resistivity @Bottom (Driller) Res. @ BHT @Casing (From Log)
7.5"pH
Casing (Driller)9.5"
Circ. Temp.
Casing Size B.H. Temp.
Loqtj \\-\a -Sp^.6A Up IS"
Logged by
Witnessed by
0-qK»'^g.v\\pcr^yy 5T"
Figure 5.c.--Caliper log of corehole CH.
study. Charles Gentile of the Princeton Plasma Physics Laboratory provided supplies, equipment, and manpower to assist U.S. Geological Survey personnel on several occasions. Gregory Tompkins of the Emergency Services Unit, Princeton Plasma Physics Laboratory, provided personnel and equipment for use during the simulated spill.
HYDROGEOLOGY
Hydrogeologic Framework
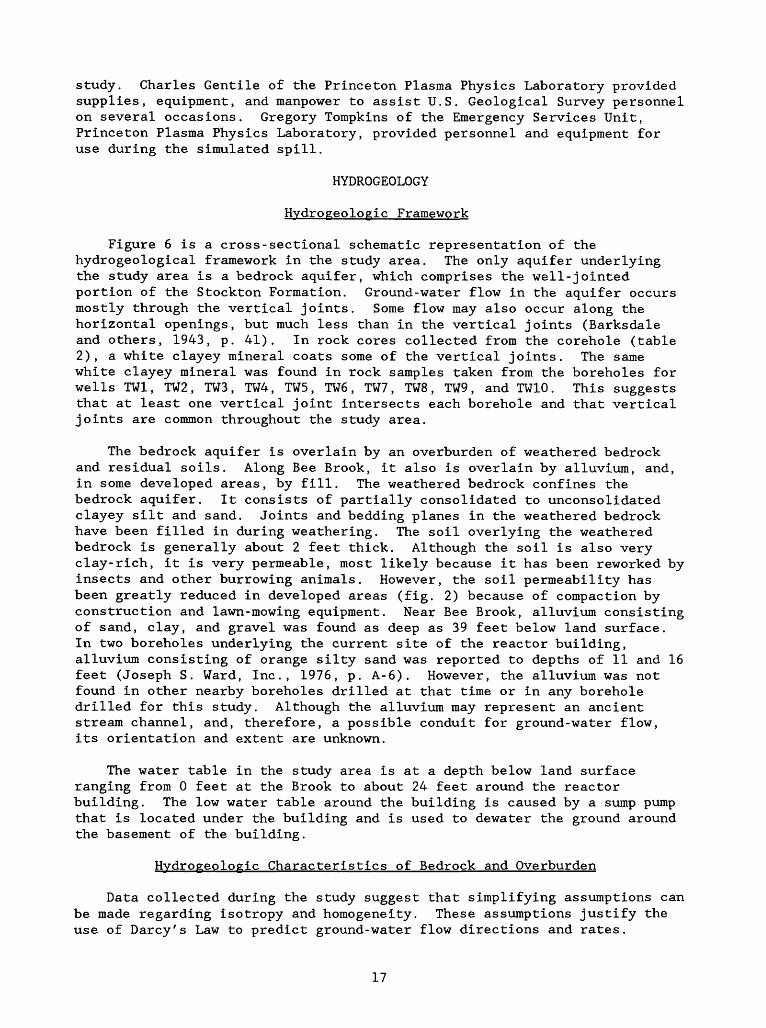
Figure 6 is a cross-sectional schematic representation of the hydrogeological framework in the study area. The only aquifer underlying the study area is a bedrock aquifer, which comprises the well-jointed portion of the Stockton Formation. Ground-water flow in the aquifer occurs mostly through the vertical joints. Some flow may also occur along the horizontal openings, but much less than in the vertical joints (Barksdale and others, 1943, p. 41). In rock cores collected from the corehole (table 2), a white clayey mineral coats some of the vertical joints. The same white clayey mineral was found in rock samples taken from the boreholes for wells TW1, TW2, TW3, TW4, TW5, TW6, TW7, TW8, TW9, and TW10. This suggests that at least one vertical joint intersects each borehole and that vertical joints are common throughout the study area.
The bedrock aquifer is overlain by an overburden of weathered bedrock and residual soils. Along Bee Brook, it also is overlain by alluvium, and, in some developed areas, by fill. The weathered bedrock confines the bedrock aquifer. It consists of partially consolidated to unconsolidated clayey silt and sand. Joints and bedding planes in the weathered bedrock have been filled in during weathering. The soil overlying the weathered bedrock is generally about 2 feet thick. Although the soil is also very clay-rich, it is very permeable, most likely because it has been reworked by insects and other burrowing animals. However, the soil permeability has been greatly reduced in developed areas (fig. 2) because of compaction by construction and lawn-mowing equipment. Near Bee Brook, alluvium consisting of sand, clay, and gravel was found as deep as 39 feet below land surface. In two boreholes underlying the current site of the reactor building, alluvium consisting of orange silty sand was reported to depths of 11 and 16 feet (Joseph S. Ward, Inc., 1976, p. A-6). However, the alluvium was not found in other nearby boreholes drilled at that time or in any borehole drilled for this study. Although the alluvium may represent an ancient stream channel, and, therefore, a possible conduit for ground-water flow, its orientation and extent are unknown.
The water table in the study area is at a depth below land surface ranging from 0 feet at the Brook to about 24 feet around the reactor building. The low water table around the building is caused by a sump pump that is located under the building and is used to dewater the ground around the basement of the building.
Hydrogeologic Characteristics of Bedrock and Overburden
Data collected during the study suggest that simplifying assumptions can be made regarding isotropy and homogeneity. These assumptions justify the use of Darcy's Law to predict ground-water flow directions and rates.
17
Eva
po
rati
on
and
tra
ns
pir
ati
on
NO
T T
O S
CA
LE
Rad
ioacti
ve-
wa
ste
S
torm
ta
nk
s
se
we
rS
ump
pu
mp
and
dra
ins
Det
enti
on
bas
in
Dra
ina
ge
d
itc
hB
ee
Bro
ok
Mil
lsto
ne
Riv
er
_^-^
£piP
P^^
^?3o^Mr .< 4 Au
" *"-
^ * -
*>
Flo
od
ed
are
a a
fte
r h
yp
oth
eti
ca
l sp
ill
So
il
Weath
ere
d bedro
ck (c
onfin
ing unit)
l.-.-
.-J
Bedro
ck
aquife
r
Non-join
ted bedro
ck
(confin
ing unit)
Wa
ter
table
G
en
era
lize
d f
low
p
ath
Figu
re 6.
--Sc
hema
tic
representation of hydrogeologic fr
amew
ork
and
potential
flow
pa
ths
of sp
ille
d wa
ter.

Based on the limited data collected during this study, it appears that the hydrogeologic properties of the bedrock aquifer are isotropic within the study area with respect to the horizontal direction. Drawdown and recovery data from the aquifer test do not indicate any directional preference of ground-water flow. If the aquifer were anisotropic in the horizontal direction, drawdown in wells at similar distances but different directions from the pumped well would be significantly different. As shown in table 3, wells TW1, TW2, TW5, TW7, and TW8 all had similar amounts of drawdown. These wells were installed at similar distances around the pumped well (TW3), and they all are open to the aquifer at about the same depth.
Table 3.--Summary of aquifer-test drawdown data.
Well no.
TW1TW2TW5TW7TW8
Distance frompumped well (feet)
100929593
117
Az imuthrelative topumped well (degrees)
23926616633881
Maximumdrawdown (feet)
6.286.346.426.266.13
Data collected during this study are not sufficient to determine whether the hydrogeologic properties of the bedrock aquifer are also isotropic with respect to the vertical versus the horizontal direction. However, the ubiquitous vertical jointing suggests that a simplifying assumption of complete isotropy could be made.
The bedrock aquifer appears to be homogeneous within the study area. Because ground-water flow is controlled by the joints, and the jointing is assumed to be uniform throughout the study area, the aquifer is assumed homogeneous. In addition, no large faults, which would cause non- homogeneous flow, have been identified in or near the study area.
The estimated thickness of the bedrock aquifer is 500 feet. Although the Stockton Formation is much thicker than 500 feet, it has been recognized that only the upper 500 feet of the formation are sufficiently jointed to allow ground-water flow (Greenman, 1955, p. 27).
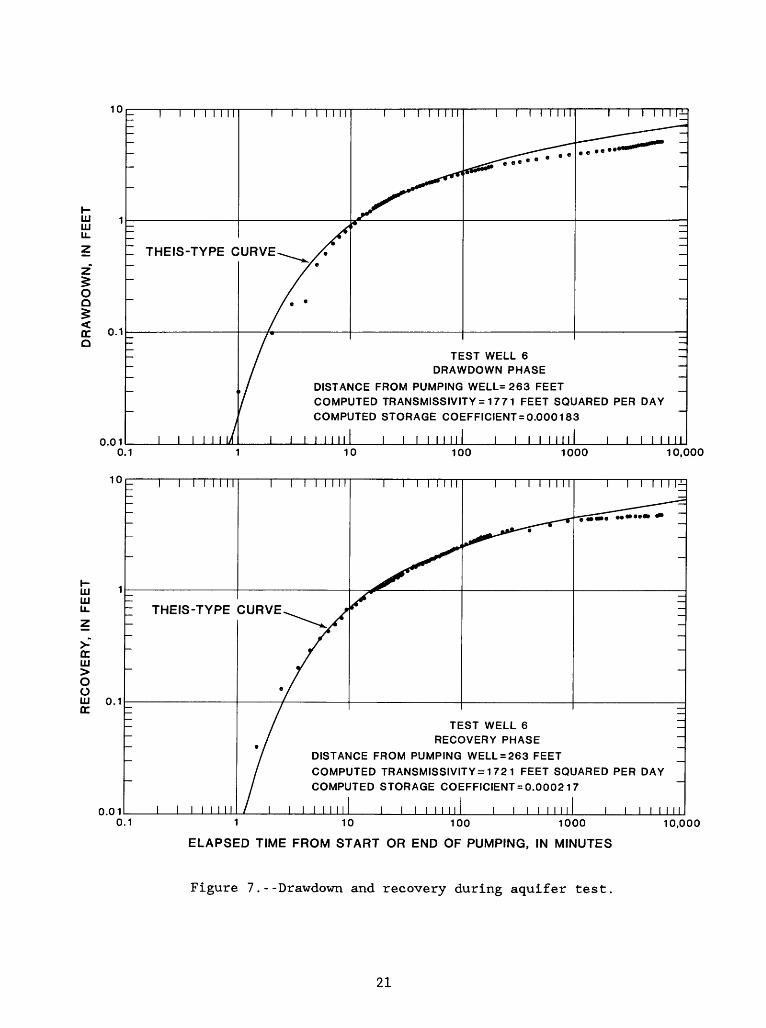
Transmissivity of the bedrock aquifer is about 1,740 ft 2 /d, and the storage coefficient is approximately 0.0002. These values were determined from analysis of the March-April 1986 aquifer test. Plots of drawdown and recovery versus time were made for wells TW1, TW5, TW6, TW7, and TW8. Those wells were chosen for the analysis because they are open at the same or nearly the same depth interval as the pumped well (TW3). The plots were compared to type curves for several types of aquifers including confined, non-leaky aquifers (Theis, 1935), confined aquifers with leaky confining units (Lohman, 1979, plate 4), and water-table aquifers (Lohman, 1979, plate
19

4). The plots (fig. 7) most closely matched the Theis (1935) type curve. However, at times ranging from about 1 to 8 hours after the start of pumping and recovery phases, the water-level changes departed from the Theis curve, suggesting a recharge boundary. The recharge boundary may reflect leakage from Bee Brook. Conditions necessary for determining aquifer properties based on the Theis type curve are: (1) that the pumped well discharges at a constant rate, (2) that the well is of infinitesimal diameter and fully penetrates the aquifer, (3) that the aquifer is not leaky, and (4) that the discharge from the well is derived exclusively from storage in the aquifer. Of those conditions, only the full penetration of the aquifer by the well was not true for this aquifer test. However, computations based on Weeks (1964, p. 202-207) indicate that for this test the effect of partial penetration was negligible in computing aquifer transmissivity and storativity.
Average effective porosity of the bedrock aquifer is estimated at 11 percent. Because specific yield is approximately equal to effective porosity (Fetter, 1980, p. 26), reported values of specific yield were used to estimate effective porosity. Rima and others (1962, p. 29) reported an average specific yield of 10 percent for samples of Stockton Formation rocks similar to those found in the study area. However, these measurements do not account for porosity caused by jointing, which typically increases the porosity of sandstone by one percent (Heath, 1982, p. 7). Therefore, a reasonable estimate of effective porosity of the bedrock aquifer in the study area would be 11 percent. The effective porosity of the soil is estimated at 40 percent, which is the average specific yield for soil (Heath, 1982, p. 9),
Evapotranspiration
Evaporation and transpiration both vary greatly with the season. In the summer, when temperatures are high, potential evaporation is high. In addition, vegetation takes up and transpires a great deal of soil water during the spring and summer months. In the winter, when air temperature is low and vegetation is dormant, both evaporation and transpiration approach zero.
Evaporation and transpiration are difficult to measure or estimate, but they could be critical components of the fate of the radioactive water after a hypothetical accident. For that reason, two methods were used to estimate these factors, one based on direct measurement using evaporation pans and one using an empirically derived calculation.
Evaporation has been measured at the New Brunswick (fig. 1) weather station since 1967 using a standard U.S. Weather Bureau evaporation pan. No data are available for New Brunswick or any other station in New Jersey for the months of November-April, when the pan is taken out of service to prevent damage by freezing. The average evaporation for the other months is presented in table 4 (National Oceanic and Atmospheric Administration, 1968- 1985).
An equation for estimating the sum of potential evapotranspiration was developed empirically by Thornthwaite and Mather (1955). In the equation, potential evaporation and transpiration are functions of air temperature,
20
10
HI HI U_
o o<DC O
0.1
- THEIS-TYPE CURVE
0.01
0.010.1
TEST WELL 6 DRAWDOWN PHASE
DISTANCE FROM PUMPING WELL= 263 FEET
COMPUTED TRANSMISSIVITY = 1771 FEET SQUARED PER DAY
COMPUTED STORAGE COEFFICIENT = 0.000183
II I I I I I I I I I I I I II10 100 1000 10,000
THEIS-TYPE CURVE
TEST WELL 6 RECOVERY PHASE
DISTANCE FROM PUMPING WELL = 263 FEET
COMPUTED TRANSMISSIVITY = 1721 FEET SQUARED PER DAY
COMPUTED STORAGE COEFFICIENT = 0.00021 7
1 10 100 1000
ELAPSED TIME FROM START OR END OF PUMPING, IN MINUTES
10,000
Figure 7.--Drawdown and recovery during aquifer test.
21

Table 4. - - Evaporation and potential evapotranspiration for the study area,
Month
AprilMayJune
JulyAugustSeptember
OctoberNovemberDecember
Average monthly evaporation New Brunswick, New Jersey
(inches)
Not measured 5.92 6.62
8.015.824.52
2.87Not measured Not measured
Average monthly potential evapotranspiration based on mean monthly temperatures at Rightstown, New Jersey
(inches)
JanuaryFebruaryMarch
Not measuredNot measuredNot measured
00.57
8040
4.88
4.985.153.56
9881
22

latitude, and season. Variations in wind speed are not accounted for. The average monthly potential evapotranspiration based on the Thornthwaite and Mather equation are presented in table 4. These averages are based on mean monthly temperatures recorded at Rightstown, New Jersey for the period 1895 to 1984 (National Oceanic and Atmospheric Administration, 1985).
In table 4, the monthly values listed for evaporation are generally higher than the corresponding values for potential evapotranspiration. The higher evaporation values are probably caused partially by heat transfer from the atmosphere to the metal pan. Also, evaporation from the pan simulates evaporation from surface water, but the Thornthwaite and Mather method estimates evaporation and transpiration from the soil. Therefore, the values based on the Thornthwaite and Mather equation are more realistic for purposes of this study.
Infiltration and Flow through the Unsaturated Zone
In addition to factors such as land slope and water and soil temperature, the infiltration capacity of a soil determines the degree to which precipitation (or spilled water) flows over the land surface or infiltrates the soil. Increased soil infiltration capacity generally results in decreased overland flow. Because it was important to estimate how far the water from the radioactive-waste tanks could spread over the land surface after a hypothetical spill, the infiltration capacity of the soil was measured in four representative areas (fig. 4) downslope from the tanks. To avoid variability in measured rates that could result from variance in air or water temperature or from variance in land slope, all measurements were made within a 2-week period under similar temperature and land-slope conditions. Variability in measured rates that could result from differential disturbance of the soil during insertion of the infiltrometers was minimized because there is minimal soil disturbance when using double- cap infiltrometers (Constantz, 1983, p. 228). The measurements, which were made during late August 1986, are summarized in table 5.
Table 5.--Summary of soil infiltration-capacity rates.
[All rates are in inches per hour]
NumberArea of Trials
1 92 63 64 5
MeanRate
3.66.6
1421
MedianRate
0.743.7
1513
MinimumRate
0.062.12
6.85.7
MaximumRate
18242539
Within Area 1 and Area 2, closest to the tanks, the measured rates range over several orders of magnitude. Because scatter in the data caused by temperature variation, land-slope variation, and soil disturbance was minimal, it is believed that most of the scatter in the data for Areas 1 and 2 was caused by actual variability in infiltration capacity. In Area 1,
23

some infiltration measurements were taken at sites where the soil had been compacted by construction equipment during the installation of well TW7. Area 2, unlike the other areas, had been developed and therefore affected by construction and lawn-mowing equipment.
During a hypothetical spill from the radioactive-waste tanks, most of the water would flow over the land surface until it reached the undeveloped areas, where the soils are more permeable, and then it would begin to move downward through the soil. To determine the velocity of water moving downward through the soil, the infiltration capacity, which is a measure of specific discharge, is divided by the effective porosity of the soil (40 percent). For Areas 3 and 4, which are representative of areas where most of the spilled water would infiltrate, the velocity based on median infiltration capacities would be 38 and 33 inches per hour, respectively.
However, downward movement of water through the unsaturated zone either slows or stops when precipitation stops. In the unsaturated zone, water is held to soil and rock particles by surface tension. If the water coating the particles becomes too thick to be held by surface tension, a droplet forms and is drawn downward by gravity. Consequently, moisture flowing downward through the unsaturated zone moves as fronts, with the front from each rainstorm being displaced by one from a more recent storm (Smith, 1967). Between rainstorms, water can evaporate and move upward as water vapor or it can be taken up by plant roots and removed by transpiration. Thus, the amount of water reaching the water table and the time required to reach the water table depend greatly on precipitation amounts as well as on evaporation and transpiration.
Ground-Water/Surface-Water Relations
Within the study area, Bee Brook contains both gaining and losing reaches. Figure 8 shows discharge at eight points along the stream and its tributaries as measured in October 1985. These data indicate that at that time the Brook was losing approximately 149 gallons per minute in the reach between sites A and G but that it was gaining approximately 77 gallons per minute between sites G and H. Throughout the year, flow appears to decrease from site A to site G, suggesting that this is always a losing reach.
The detention basin and the south drainage ditch receive piped water from storm sewers, the sump-pump, and cooling-water blowdown. Consequently, the water-levels in both are artificially high. The lowest portion of the detention basin is concrete-lined. The lined portion has a capacity capable of accepting discharges from all normal operations and storms. However, in extreme conditions, water could overflow the lined portion of the basin and lose water to the subsurface. Because the water-level in the south drainage ditch is artificially high, it is assumed to be a losing stream.
Recharge and Discharge
Recharge to the bedrock aquifer is by lateral ground-water flow in the bedrock into the study area from upgradient areas, leakage from losing reaches of Bee Brook and the south drainage ditch, and, minimally, by leakage of precipitation through the confining overburden into the bedrock aquifer. Lateral movement into the study area is generally from the north,
24

74°36'20" °'"74°36'10 ° f74°36°'"74°35'50
Radioactive-waste tank enclosure
EXPLANATION
Discharge measurement site, 166 site number, and discharge,
in gallons per minute Intermittent stream Intermittent discharge
Developed area
500 FEET
Base map modified from Air-Ography (1983)
Figure 8.--Discharge rates along Bee Brook, October 1985.
25
owing to the overall north-south hydraulic gradient in the bedrock aquifer (see section on potentiometrie surfaces and ground-water flow). The potential for leakage of precipitation through the confining overburden into the rock is indicated by water-level data. Figure 9, hydrographs of wells R5B and nearby TW6, shows the constant downward gradient between the overburden well, R5B, and the bedrock well, TW6. Precipitation for the period is also shown on figure 9.
Within the area influenced by the sump pump, ground-water discharge from the aquifer is mostly to the pump. The pump, which is located under the basement of the reactor building, pumps ground water from a pit which receives water from drain pipes located under and around the reactor building. The pump discharges approximately 150 to 200 gallons per minute, based on visual estimates. Inlets to the drain pipes are at altitudes ranging from 77 feet near the southwest corner of the building to 71 feet near the northeast corner of the building. The pump switch is controlled by a float which keeps the water-level altitude in the pit between 68 and 69 feet. In 1978, before the pump was installed, the water-level altitude in that area was about 89 feet. Therefore, the sump pump has lowered the potentiometric surface by about 20 feet and created a cone of depression centered at the reactor building.
Near the sump pump, an upward hydraulic gradient exists at wells TW5 and TW9, TW3 and TW4, and TW2 and TW10. These well pairs have open intervals at about 30 to 70 feet and about 100 to 120 feet below land surface. Therefore, water from depths as great as 120 feet is flowing upward and discharging to the pump. Hydrographs of wells TW5 and TW9 (fig. 10) show the continuous upward gradient at the site of those wells.
In the southern part of the study area, outside the influence of the sump pump, most ground-water discharge from the aquifer is probably by southward lateral flow out of the study area (fig. 11). In that area, minimal amounts of discharge also may occur by leakage from the aquifer upward into the overlying overburden. Water levels in wells HI and H1A, H3 and H3A, and H4 and H4A (table 1), indicate that an upward hydraulic gradient exists between the bedrock and overburden. From the overburden, the water may then discharge to Bee Brook or to the atmosphere by evapotranspiration.
Potentiometric Surfaces and Ground-Water Flow
Lateral and vertical hydraulic gradients are toward the sump pump in the northeastern part of the study area and probably also in the northwestern part, although no data were collected there. _Elsewhere gradients are toward the south-southeast.
Figure 11 is a map of the study area showing the potentiometric surface of the bedrock aquifer on October 30, 1986. Water-level data collected since July 1985, indicate that water levels were near their seasonally lowest values on that date. The potentiometric surface indicates that the cone of depression extends at least as far as Bee Brook (1,040 feet) to the east-northeast and about 775 feet to the southeast, as indicated by the ground-water divide on figure 11. Water-level data for April 10, 1986 (table 1), when levels were near their seasonally highest values, indicate a
26

90
uuj
85
o *
*Is
5s <
CO
_j
HI
80
UJ
>>
0
UJ m
QC H
UJ
UJ
I-
UJ
<
U-
75
70
2co
I-
UJ
< I
I- O
02
1
HU
J
QC 0.0
N.O
.A.A
. p
recip
itati
on
--« g
age at *
- P
rin
ceto
n,
N.J
.U
.S.G
.S.
pre
cip
itat
ion
gag
e at
stu
dy
area
1M
AR
A
PR
MA
Y
JU
N
JU
L
AU
G1986
SE
PO
CT
NO
VD
EC
Fig
ure
9
.--H
yd
rog
rap
hs
of
well
s R
5B
and
TW6
wit
h
gra
ph o
f p
recip
itati
on
am
ounts
, M
arch
-Dec
emb
er,
1986.

79
00
DC
LU
77
111 >
LLJ
CO LLJ
> o CD
< r-
LU
LLJ
±
76
LU
Q -I 75
< _J
LU
>
LU74 73
I I
I~
lI
I I
I 1
I I
I I
I I
I T
TW
5
TW
O___
NO
R
EC
OR
D
LU > O 00
10
0
80
I-
, 60
LU >
LU4
0
g"S
20
1 O
ve
rbu
rde
n
Bed
rock
Te
st
well
9
_
_
Te
st
we
ll
5
I I
II
I I
I I
I I
I
13
20
27
3 10
17
24
1 8
15
22
29
5 12
19
26
3 10
17
24
31
7 14
21
28
4 11
18
25
MA
R
AP
R
MA
Y
JU
NE
J
UL
Y
AU
G
SE
P
19
86
Figure 10.--Hydrographs of wells TW5
and TW
9, March-September 1986.

74°36'20* 74°36'10* 74°36' 74°35'50*
79.97 80.00
79.72 / 80.20-
... Radioactive-waste tank enclosure
EXPLANATION 70
Pocenciomecric concour-- shows alcicude of wacer level in feec above sea level. Dashed where approximately located. Contour interval 1 foot. Datum is NGVD of 1929.
79.20
Well location and water level in feet above sea level.
Inferred location of ground- water divide
Generalized flow direction
Intermittent stream
Intermittent drainage
Developed area
Base map modified from Air-Ography (1983)
Figure 11.--Potentiometric surface of the bedrock aquifer, October 30, 1986.
29

steeper cone of depression than in the fall, which results in a steeper gradient toward the sump pump. The steeper cone of depression in the spring is caused by higher water levels, which necessitate greater pumping rates to keep the area around the reactor building dewatered.
Generalized ground-water flow directions are also shown on figure 11. In an isotropic aquifer, ground water flows downgradient, perpendicular to the potentiometric contour lines. The average linear velocity of ground water between any two points can be determined by the adaptation of Darcy's Law (Freeze and Cherry, 1978, p. 71):
qt- Kt (dh/dl)/n,
where q. is the ground-water flow rate in direction i,
K. is hydraulic conductivity in direction i,
dh/dl is the difference in head (water level) between two points along direction i divided by the distance between the two points, and
n is effective porosity.
The average linear velocity of ground water is a measure of the rate at which water actually moves through open spaces in an aquifer. In the study area, transmissivity of the bedrock aquifer is 1,740 ft2 /d, and the thickness of the aquifer is 500 feet. Thus, the hydraulic conductivity is about 3.5 feet per day. Because this value of hydraulic conductivity is based on the transmissivity value obtained from an aquifer test, it is not truly the value of hydraulic conductivity at every point in the study area. Rather, it is an average, or integrated, value of conductivity for the area. The effective porosity is approximately 11 percent.
Using the above data, the average linear velocity between well N3 and well TW1 is about 170 feet per year in the fall and 270 feet per year in the spring. In the southern portion of the study area, outside the influence of the sump pump, the average linear velocity of ground-water in the bedrock aquifer was 100 feet per year on October 30, 1986. The average linear velocity during the spring was not determined, because wells were not installed in the bedrock aquifer in that area until later. However, it is likely that the velocity there is also higher in the spring than in the fall.
GROUND-WATER QUALITY
Background Water Quality
One objective of this study was to provide ambient ground-water-quality data prior to the commencement of any future operations at the Laboratory. To provide background data, ground-water samples were taken from three wells in the study area, TWl, TW10 , and PW5, and from wells PW2 and PW3, which are about 4,700 feet west-southwest of the study area. These wells were selected because of their varying depths (table 1) and locations. The samples were analyzed for common ions, trace metals, and tritium. Table 6
30

Table
6. --Water-quality
data for
well
s in
the
study
area
[Uni
ts:
/z/L
, micrograms pe
r liter; mg/L,
milligrams pe
r liter;
a dash in
dica
tes
that
the
sample was
not
anal
yzed
for
this
co
nsti
tuen
t]
Cons
titu
ent
Alka
lini
ty,
fiel
d to
tal
as Ca
C03,
mg
/L
Ammo
nium
, di
ssol
ved,
as am
moni
um,
mg/L
Ammo
nium,
dissolved,
as n
itro
gen,
mg
/L
Ammo
nium
+ organic
nitrogen,
diss
olve
d, as ni
trog
en,
mg/L
Barium,
dissolved, jug/L
Bery
lliu
m, di
ssol
ved,
ju
g/L
Cadmium, di
ssol
ved,
/j
g/L
Calc
ium,
di
ssol
ved,
mg
/L
Chlo
ride
, dissolved, mg
/L
Coba
lt,
dissolved, ju
g/L
Copp
er,
dissolved, /xg/L
Fluoride,
dissolved, mg
/L
Iron,
dissolved, jug/L
Lead,
diss
olve
d, p,g/l
Lithium, dissolved, /x
g/L
Magn
esiu
m, di
ssol
ved,
mg/L
Manganese, di
ssol
ved,
/i
g/L
Molybdenum,
diss
olve
d, /i
g/L
Nitrite, di
ssol
ved,
as n
itro
gen,
mg
/L
Nitr
ite
+ Ni
trat
e, di
ssol
ved,
as
nit
roge
n, mg/L
Nitrogen,
orga
nic,
di
ssol
ved,
as Ni
trog
en,
mg/L
TW1
4-24-86
145 -- .0
1
--
360 1
< 1
46 12
< 3
< 10
.1
120
< 10 6
14 120
< 10
< .0
1
.151
TW1
7-24-86
146
--
.021
--
330
< .5
< 1
43 12
< 3
< 10
< .1
31
< 10
< 8 12 140
< 10
< .0
1
< .1
TW1
10-2
9-86
-. --
< .0
1
--
350 1
< 1
46 12
< 3
< 10
.1
12
< 10 7
14 170
< 10
< .0
1
< .1
Well
name
TW10
4-24-86
145 -- .0
5
--
390
< .5
<
< 1
<
45 11
< 3
<
< 10
<
.1
370
< 10
<
7
12 290
< 10
<
< .0
1 <
< .1
<
and
sample d
ate
TW10
TW
10
7-24
-86
10-2
9-86
142 -- .0
41
<
--
410
.5 1 <
43 11
3 <
10
<
.1
390 10
<
10 11 300 10
<
.01
<
.1
<
-- -- .01
--
390 1 1
46 12
3 10
.1
510 10 8
12 300 10
.01
.1
PW5a
7-16
-85
70
.17
.13
.3
150
< .5 1
18 5.5
< 3 20
< .1
1200
< 10 9 7.
9
500
< 10
< .0
1
1.1 .17
PW2b
7-
16-8
5
21
.05
.04
.4
250
.6
< 1 7.8
12
< 3 10
< .1
840
< 10 9 2.
9
40
< 10
< .0
1
4.1 .36
PW3b
7-
16-8
5
54
.01
< .01
.2
160 1.
2
< 1.
19 26
< 3
< 10
< .1
170 10 10 7.2
10
< 10
< .01
1.81

Tabl
e 6. -Water-quality da
ta for
wells
in t
he study
area --Contin
ued
[Units:
jit/
L, micrograms pe
r liter; mg/L,
mill
igra
ms pe
r liter;
a da
sh indicates
that
the
samp
le w
as n
ot an
alyz
ed f
or this c
onstituent]
Cons
titu
ent
Nitr
ogen
, dissolved,
as Ni
trog
en,
mg/L
Nitr
ogen
, dissolved, KJ
D, mg/L
Oxygen,
dissolved, mg
/L
pH,
fiel
d
Phosphate, di
ssol
ved
orth
o,
as phosphorous, mg
/L
Pota
ssiu
m, di
ssol
ved,
mg/L
Silica,
diss
olve
d, mg
/L
Sodium,
diss
olve
d, mg
/L
Spec
ific
conductance,
fiel
d, mi
cros
ieme
ns pe
r cent
imet
er
Stro
ntiu
m, dissolved, ju
g/L
Sulfate, di
ssol
ved,
mg/L
Trit
ium,
pi
coCu
ries
/L,
PPPL
C
Tritium, pi
coCu
ries
/L,
Miam
i6
Vana
dium
, dissolved, ju
g/L
Water
temperature, deg
C
Zinc
, di
ssol
ved,
jug/L
TW1
4-24-86
.2 .3
7.5 .021
1.6
28 10 370
380 18
86+/-12
77+/
-16
< 6
12.4
11
TW1
7-24-86
< .2 .0
7.4 .030
1.6
25 9.9
353
359
21 -- -
< 6
12.7
10
TW1
10-29-86
.8 .8
7.3 .021
1.5
25 10 359
380
20 NRd
66+/-3
< 6
12.2
< 3
Well
name
TW10
4-
24-8
6
.2
<
.3
7.6 .021
1.7
27 9.7
350
410 15
86+/-12
67+/-13
< 6
<
12.5
< 3
and
samp
le d
ate
TW10
TW10
7-
24-8
6 10
-29-
86
.2 .1
7.4 .021
1.7
26 9.6
346
420 19 -- -- 6
12.9 7
.4 .5
7.5 .021
1.6
26 9.5
307
410 17 NR
72+/-3
< 6
12.0
< 3
PW5a
7-
16-8
5
1.4
-- -- 6.5 .13
1.3
25 7.8
214
120 9.0
80+/-5
96+/
-16
< 6
13.5
24
PW2b
7-
16-8
5
4.5 --
3.84
5.5
< .0
1
2.8
29 11 154 71 5.
1
--
112+
/-19
< 6
16.3
82
PW3b
7-
16-8
5
2.0
--
3.6
6.2 .14
1.8
27 14 251
140 17 -
70+/-19
< 6
13.1 7
Note
s:
a.
This
sample c
ould n
ot be
filtered in
the
field; all
valu
es re
port
ed a
s "d
isso
lved
" are
actually "
tota
l".
b.
This
we
ll is lo
cate
d outside
the
study
area
, at
"B"
site o
f th
e Ja
mes
Forr
esta
l Campus,
abou
t 4700 feet we
st southwest
ofth
e re
acto
r building.
c.
Analysis th
e th
e Plasma Physics
Labo
rato
ry,
Prin
ceto
n University.
d.
"NR"
indicates
that
the
value
was
not
repo
rted
bec
ause
of
malf
unct
ion
of an
alyt
ical
equipment.
e.
Anal
ysis
by Uni
vers
ity
of Miami
Tritium
Labo
rato
ry.

lists analytical results. Predominant ions in the samples were calcium, magnesium, and carbonate. For some of the samples, the reported concentrations of iron and manganese were above drinking-water criteria. The criterion for iron is 300 micrograms per liter (U.S. Environmental Protection Agency, 1977, p. 78), and for manganese, 50 micrograms per liter (U.S. Environmental Protection Agency, 1977, p. 95). However, water containing similarly high concentrations of iron and manganese are common in surface and ground water in the area (Stencel, 1985, p. 43-70) and are not indicative of an on-site source of contamination. No unusually high concentrations of any other common ions or trace metals were found.
Tritium concentrations in background samples ranged from 67 to 112 pCi/L (picoCuries per liter). For purposes of comparison, the maximum allowable concentration of tritium in water that is the only used source of public drinking water is 20,000 pCi/L (U.S. Environmental Protection Agency, 1976). Tritium is a common constituent of rain water and, consequently, also a common constituent of surface water and ground water. Tritium is produced naturally in small amounts in the outer atmosphere and in larger amounts in thermonuclear weapons (Hem, 1985, p. 150). Before 1952, the tritium content of most rain water ranged from 3 to 30 pCi/L. After 1952, when testing of thermonuclear weapons commenced, the tritium content of rain water greatly increased world-wide. Reported tritium concentrations in rain water reached a peak in 1954, when 9,378 pCi/L were reported at Ottawa, Canada (Davis and DeWiest, 1966, p. 137). Since that time, radioactive decay and a reduction of thermonuclear-weapons testing have decreased tritium concentrations in water.
Water-quality Monitoring Program
Another objective of this study was to begin a ground-water-quality monitoring program for the purpose of detecting changes in ground-water quality and establishing seasonal and long-term water-quality trends. For those purposes, wells TW1 and TW10 have been sampled quarterly since April 1986. These wells were chosen for monitoring because of their different depths and their proximity to the radioactive-waste tanks. Samples were analyzed for common ions, trace metals, and tritium. Table 6 lists the results of analyses for the three sampling dates completed.
POSSIBLE EFFECTS OF A HYPOTHETICAL RADIOACTIVE-WATER SPILL
Potential Flow Paths of Spilled Water
The fate of water spilled from the radioactive-waste tanks would be largely dependent upon the nature of the accident, atmospheric conditions before and after the accident, and hydrologic conditions before and after the accident. Figure 6 depicts generalized potential flow paths of the spilled water. If the accident involved complete destruction of the tanks and the containment structure around them, the water would spill very quickly and spread farther over land than if the tanks or containment wall only cracked. If the ground were frozen, the spilled water would spread farther over land than if the ground were not frozen. The amount of spilled water removed by evapotranspiration would depend largely on atmospheric conditions and antecedent soil moisture.
33

Some spilled water could enter the storm-sewer drain located in the road directly south of the radioactive-waste tanks. However, the land around the tanks slopes downward to the north; therefore most of the spilled water would be expected to flow north rather than south. However, if the spill were very rapid, or if the containment structure ruptured only on its south side, some spilled water could enter the drain. The drain leads to a sewer pipe which discharges into the detention basin in the central part of the study area (fig. 2).
Spilled water that does not enter the storm sewer drain would flow over land toward the north. During the simulated spill of September 30, 1986, the overland flow of spilled water reached a maximum distance of 154 feet from the radioactive-waste tanks (fig. 4).
After flowing over the land surface, the water would infiltrate into the soil. Unless the soil were frozen, infiltration would occur quite rapidly, based on measured infiltration-capacity rates. Relatively slow infiltration would occur only in the developed portion of the study area close to the tanks. In that developed area, most of the spilled water would move downslope over land until it reached the more permeable zones.
After infiltration, evapotranspiration could transport none to all of the spilled water, and tritium, to the atmosphere. During the simulated spill, 45,000 gallons (6,000 cubic feet) of water covered an area of approximately 11,000 square feet, with an average depth of flooded water of 0.55 feet (6.5 inches). The measured mean-monthly evaporation at New Brunswick for July, 8.01 inches, and the estimated potential evapotranspiration for August, 5.15 inches, indicate that all, or almost all, of the spilled water could be removed by evapotranspiration if subsequent precipitation were minimal.
After the water is in the soil, if it were not removed by evapotranspiration, it would move downward toward the saturated zone at a rate which is largely dependent on subsequent precipitation amounts. Depending on the season and location, the top of the saturated zone is anywhere from 7 to 24 feet below land surface. After the simulated spill, water samples were collected about every 3 weeks from wells in the vicinity of the spill (TW1, TW2, TW7, Nl, N2, and N3) and from pipes discharging to the sump-pump pit. As of 63 days after the spill, no bromide tracer was detected in any of those samples, even though one of the wells, TW2, is located within the spill area, and 9.3 inches of rain had fallen since the spill. This suggests that it has taken at least 63 days for the spilled water to reach the saturated zone at that site.
After the spilled water reaches the saturated zone, it would flow toward a sump-pump drain (fig. 2) at a rate of about 170 feet per year in the fall and about 270 feet per year in the spring. In the following calculations, the average of those two velocities, 220 feet per year, was used for purposes of estimating ground-water travel times. The first water to reach the drain would be water that infiltrated a few feet north of the radioactive-waste tanks, because that is where it would first encounter permeable soil. It would take about 1.1 years for that water to reach the drain (235 feet away). The last water to reach the sump pump drain would be water that had flowed the farthest over land after the spill. During the
34

simulated spill, water reached a distance of 388 feet from the sump pump drain. It would take about 1.8 years for that water to reach the drain. Thus, the spilled water would continue to reach the sump pump over a period of about 0.7 years, or 8.5 months.
It is possible that some spilled water could move downward deep enough to escape the influence of the sump pump and continue flowing southward, as illustrated by the deepest flow line in figure 6. However, upward movement of ground water in the vicinity of wells TW4, TW9, and TW10 indicates that the spilled water would have to reach a depth greater than 120 feet in order for it to escape the sump pump. Any radioactive water entering the ground- water system in this way would probably be minimal and not pose a threat to any potable-water-supply wells.
Potable-water-supply wells closest to the study area are probably still too far from it to be affected by a spill from the radioactive-waste tanks. Several wells serving Princeton Township are located between 2 and 4 miles southwest of the site, but they are located across the Millstone River and are, therefore, separated from the study area by an assumed major hydrogeologic boundary. The only other nearby water-supply wells are at least 3 miles north (upgradient) of the study area. In addition, only minimal amounts of spilled water would be expected to leave the study area as ground water. As discussed above, most of the spilled water would be captured by the sump pump over a period of several months and be discharged into Bee Brook.
Water that is captured by the sump pump would reach the south drainage ditch, Bee Brook, Devils Brook, and the Millstone River by way of storm- sewer pipes and the detention basin (fig. 6). Because the drainage ditch and portions of Bee Brook are losing reaches, water in the brook may re- enter the ground-water flow system. However, stream discharge measurements along the Brook indicate that all or most of the losses occur upstream from the confluence with the south drainage ditch. Therefore, only a small amount of tritium, if any, from a hypothetical spill would re-enter the ground-water from Bee Brook. The detention basin and the drainage ditch may also recharge the bedrock aquifer. Water-level data (table 1) indicate that water entering the ground water at those points would flow southeast toward the gaining reach of Bee Brook. Because of the short distances involved, that water would probably stay in the local flow system and discharge back into Bee Brook. However, some of the radioactive water could remain in the aquifer and flow out of the study area under Bee Brook. As is the case with radioactive water that may escape the sump pump, the amount of radioactive water that escapes Bee Brook would probably be minimal.
Fate of Tritium in Ground Water
Radioactive decay, evaporation, dilution, and dispersion are the only mechanisms that would change the concentration of tritium in ground water following a hypothetical spill. Tritium is a conservative constituent of water. It is generally not subject to chemical reactions (Lewis and Goldstein, 1982, p. 60) or to removal from solution by sorption before reaching the water table (Robertson, 1974, p. 3). Because most of the tritium released during a spill is expected to be in the ground water for less than 1 year, and because the half life of tritium is 12.33 years,
35

radioactive decay would not be significant. When tritiated water evaporates, it carries the tritium with it rather than leaving it in the soil as would be the case for an ionic solute. As previously discussed, evapotranspiration may remove all or none of the spilled water and, therefore, all or none of the tritium.
Because there is no tritium plume on the site to measure, both dilution and dispersion of tritium in ground water are difficult to estimate for the study area. For that reason, and because a worst-case accident would involve no dilution or dispersion in the ground water, the following estimates of concentrations of tritium leaving the study area after a hypothetical spill assume no dilution or dispersion of tritium during travel within the ground-water system. The amount of dilution that could occur within the surface-water bodies would depend on how fast the spilled water reached them and upon stream discharge following the spill.
Based on the extent of flooding after the simulated spill, the most probable accident would cause any spilled water that does not evaporate to enter the ground-water system and subsequently be discharged into the south drainage ditch. Discharge into the ditch would occur during the period beginning 1.1 years after the spill and ending 0.7 years later. Therefore, during that 0.7-year period, the tritiated water would discharge into the ditch at a rate of 45,000 gallons per 0.7 years, or 0.12 gallons per minute. The 1.47 X 10 11 pCi/L of tritium in the spilled water would enter Bee Brook at a rate of 0.12 gallons per minute, and it would be diluted by a minimum of 310 gallons per minute streamflow (fig. 8). The resultant concentration of tritium in the Brook leaving the study area would be 5.7 X 10 7 pCi/L. These calculations are based on the simulated spill and on the worst-case assumption that none of the spilled water is removed by evaporation or transpiration. Actual concentrations of tritium in stream water leaving the study area after a hypothetical accident would depend on the exact nature and timing of the accident.
In the unlikely event that all of the spilled water entered the storm sewer drain south of the radioactive-waste tanks, it could reach Bee Brook in about 1 hour after only minimal dilution within the sewer pipe. In that case, the concentration of tritium in the stream water leaving the study area would be 1.0 X 10 X1 pCi/L.
SUMMARY AND CONCLUSIONS
This report presents the results of an investigation of ground-water conditions at the site of a fusion test reactor located at the James Forrestal Campus of Princeton University in Plainsboro Township, Middlesex County, New Jersey. In the unlikely event of an accidental release of radioactive water inside the reactor building, the water would be directed to three above ground tanks outside the building. In such an event, water containing up to 25,000 curies of radioactivity could be contained in the tanks. Because the site overlies a potable-water-supply aquifer, the potential effects of a hypothetical spill of that water onto the ground were addressed.
The study included test drilling and well installation; aquifer testing; measurement of water levels, infiltration capacity, and stream discharge;
36

ground-water sampling and analysis; and a simulation of the hypothetical spill. Estimates were made of aquifer thickness, effective porosity, and evaporation.
The study area comprises 0.3 square miles and lies within the Newark Basin, about 4,000 feet from the Fall Line. It is underlain by the Triassic Stockton Formation, which is composed of sandstone and siltstone with minor amounts of shale and clay. Bedrock strikes approximately 65 degrees northeast and dips approximately 8 degrees northwest. Near-vertical joints are common in the bedrock. The area is characterized by a moderate climate and low topographic relief. Surface drainage is to Bee Brook, which flows into Devils Brook and the Millstone River.
The aquifer is overlain by weathered bedrock and by unconsolidated clayey silt and sand, which are weathering products of the Stockton Formation. In places, it is also overlain by alluvium or artificial fill.
The aquifer is the 500-foot-thick zone of the Stockton Formation which is well jointed. Its transmissivity is about 1,740 ft 2 /d, and its storage coefficient is approximately 0.0002. It is confined by overlying weathered bedrock in which joints have been filled in by weathering products and by underlying bedrock which is not jointed. The effective porosity of the aquifer is estimated to be 11 percent, and the effective porosity of the soil is estimated to be 40 percent.
The median infiltration capacity of the soil ranges from about 0.74 inches per hour where the soil has been compacted to about 13 inches per hour in wooded, undisturbed areas. Potential evapotranspiration rates range from zero in winter to about 5 inches per month in summer.
Bee Brook contains both gaining and losing reaches within the study area throughout the year. In its losing reach, 149 gallons per minute seeps into the ground-water system. Also, the south drainage ditch, which receives cooling-water blowdown, pumped ground water from the sump pump, and storm- sewer effluent, is probably a losing stream.
Ground-water recharge to the aquifer is by lateral movement into the study area from the north, leakage from losing reaches of Bee Brook and the south drainage ditch, and by leakage of precipitation through the overburden into the rock. Ground-water discharge from the aquifer is to the sump pump located under the reactor building, lateral movement southward out of the study area, and, minimally, by leakage upward into the overburden.
Ground-water flow is toward the sump pump in the northern part of the study area; elsewhere, it is toward the south. The average linear velocity of ground-water flowing toward the sump pump ranges from about 170 feet per year in the fall to 270 feet per year in the spring. In the southern portion of the study area, outside the influence of the pump, ground water flows southward at a rate of about 100 feet per year in the fall.
To provide background water-quality data, water samples from five wells in the vicinity of study area were analyzed for common ions, trace metals, and tritium. In the study area, the predominant ions in ground water were calcium, magnesium, and carbonate. No unusually high concentration of any
37

common ions or trace metals were detected. Tritium concentrations in those samples ranged from 67 to 112 pCi/L, a value which can be considered background and not indicative of any on-site source.
The fate of water spilled from the radioactive-waste tanks during the hypothetical spill would be largely dependent upon the nature of the accident and upon the weather. An instantaneous rupture of the tanks and the containment structure around them would result in a larger flooded area than if the tanks or containment structure broke only in a few places. Atmospheric conditions and vegetative cover would greatly affect the fate of the water after the spill.
Some of the spilled water could enter a storm-sewer drain, which would channel the water quickly to the detention basin and south drainage ditch (fig. 6). However, most of the spilled water is expected to flow over land and infiltrate into the soil. After infiltration some of the water would probably be removed by evapotranspiration. The remainder of the spilled water would move downward through the unsaturated zone at a rate which is controlled greatly by subsequent precipitation. After the spilled water reaches the saturated zone, nearly all of it would flow toward the sump-pump drain northeast of the reactor building at a rate of about 220 feet per year. It would then move quickly to the sump pump, storm sewer, detention basin, south drainage ditch, and Bee Brook. Thus, all or nearly all of the water would be captured by the sump pump and leave the study area as streamflow. Any amounts of radioactive water that leave the study area as ground water would be minimal and would probably not threaten any existing potable-water-supply well.
Dilution, dispersion, and evaporation are the only mechanisms that would significantly reduce the concentration of tritium in ground water after a hypothetical spill. Evaporation could remove all or none of the spilled water, depending on the season. Dilution and dispersion within the ground- water system are difficult to estimate. The amount of dilution of tritium in the surface-water bodies would depend on the nature of the accident and subsequent stream discharge rates. If the accident were similar to the simulated spill, the tritium concentration of stream water leaving the study area would be about 5.7 X 10⁷ pCi/L. If the water spread farther than it did during the simulated spill, subsequent dilution would be greater. On the other hand, if all the water entered the storm-sewer drain, dilution would be minimal, and the concentration of tritium in stream water leaving the site would be about 1.0 X 10 X1 pCi/L.
In summary, it is estimated that all or nearly all of the spilled radioactive water would be captured by the sump pump or storm sewer and leave the study area as streamflow. Any amounts of radioactive water not captured by the sump pump or storm sewer probably would be minimal and not pose a threat to existing downgradient potable-water-supply wells in the area.
38

REFERENCES CITED
Air-Ography, Inc., 1983, Areal photograph of Princeton Plasma PhysicsLaboratory and environs: Air-Ography, Inc., Levittown, Pennsylvania, unpublished photograph.
A.D.R. Associates, 1973, Topographic survey, land of Princeton University and environs, Plainsboro Township, Middlesex County, N.J.: A.D.R. Associates, Riverside, New Jersey, 12 sheets, scale 1:1200.
Barksdale, H.D., Johnson, M.E., Baker, R.C., Schaefer, E.J., andDeBuchananne, G.D., 1943, The ground-water supplies of Middlesex County, New Jersey with special reference to the part of the Coastal Plain northeast of Jamesburg: New Jersey State Water Policy Commission Special Report 8, 150 p.
Constantz, J.E., 1983, Adequacy of a compact double-cap infiltrometercompared to the ASTM double-ring infiltrometer, in Slack, J.C., ed. , Advances in Infiltration: St. Joseph, Michigan, American Society of Agricultural Engineers, p. 226-230.
Davis, S.N. and De Wiest, R.J.M, 1966, Hydrogeology: John Wiley, New York, 463 p.
Fetter, C.W., Jr., 1980, Applied Hydrogeology: Charles E. Merrill, Columbus, Ohio, 488 p.
Fishman, J.J. and Friedman, L.C., eds., 1985, Methods for determination of inorganic substances in water and fluvial sediments: U.S. Geological Survey Techniques of Water-Resources Investigations, Book 5, Ch. Al, 709 p.
Freeze, R.A. and Cherry, J.A., 1979, Groundwater: Englewood Cliffs, New Jersey, Prentice-Hall, 604 p.
Friedman, L.C. and Erdmann, D.A., 1982, Quality assurance practices for the chemical and biological analyses of water and fluvial sediments: U.S. Geological Survey Techniques of Water-Resources Investigations, Book 5, Ch. A6, 181 p.
Greenman, D.W., 1955, Ground water resources of Bucks County, Pennsylvania: Pennsylvania Geological Survey Fourth Series Bulletin Wll, 67 p.
Heath, R.C., 1982, Basic ground-water hydrology: U.S. Geological Survey Water-Supply Paper 2200, 84 p.
Hem, J.D., 1985, Study and interpretation of the chemical characteristics of natural water: U.S. Geological Survey Water-Supply Paper 2254, 263 p.
Lewis, B.D. and Goldstein, F.J., 1982, Evaluation of a predictive ground- water solute-transport model at the Idaho National Engineering Laboratory, Idaho: U.S. Geological Survey Water-Resources Investigations 82-25: 71 p.
39

REFERENCES CITED--Continued
Lohman, S.W., 1979, Ground-water hydraulics: U.S. Geological Survey Professional Paper 708, 70 p.
National Oceanic and Atmospheric Administration, 1968-1985, Climatological data annual summary, New Jersey, 1967-1884, v. 71-89, No.13.
Olsen, P.E., 1980, The latest Triassic and Early Jurassic formations of the Newark basin (eastern North America, Newark Supergroup) stratigraphy, structure, and correlation: New Jersey Academy of Science Bulletin, v. 25, p. 25-51.
Rima, D.R., Meisler, Harold, and Longwill, Stanley, 1962, Geology andhydrology of the Stockton Formation in Southeastern Pennsylvania, a study of the effect of lithology upon the yield of wells: Pennsylvania Geological Survey Bulletin W14, Fourth Series, 46 p.
Robertson, J.B., 1974, Digital modeling of radioactive and chemical waste transport in the Snake River Plain Aquifer at the National Reactor Testing Station, Idaho: U.S. Geological Survey Open-File Report IDO- 22054, 41 p.
Sanders, J.E., 1963, Late Triassic tectonic history of Northeastern United States: American Journal of Science, v. 261, p. 501-524.
Smith, W.O., 1967, Infiltration in sands and its relation to groundwater recharge: Water Resources Research, v. 3, p. 539-555.
Stencel, J.R., 1985, Environmental monitoring report for calendar year 1984: Princeton University Plasma Physics Laboratory Report PPPL-2220, 87 p.
Theis, C.V., 1935, The relation between the lowering of the piezometricsurface and the rate and duration of discharge of a well using ground- water storage: Transactions of the American Geophysical Union, v. 16, p. 510-524.
Thornthwaite, G.W. , and Mather, J.R., 1955, The water balance: Publications in Climatology, v. 8, p. 345-381.
U.S. Environmental Protection Agency, 1976, Interim primary drinking water regulations - promulgation of regulations on radionuclides: Federal Register, v. 41, no. 133, Friday, July 9, 1976, Part II, p. 28402- 29409.
U.S. Environmental Protection Agency, 1977, Quality criteria for water: Washington, D.C., U.S. Government Printing Office, 256 p.
Vecchioli, John, Carswell, L.D., and Kasabach, H.F., 1969, Occurrence andmovement of ground water in the Brunswick Shale at a site near Trenton, New Jersey: U.S. Geological Survey Professional Paper 650-B, p. B154- B157.
40

REFERENCES CITED--Continued
Walker, F.W., Kirouac, G.J., and Rourke, P.M., 1977, Chart of the nuclides (12th ed.): Knolls Atomic Power Laboratory, 1 chart.
Ward, Joseph F., Inc., 1976, Report of soils and foundation investigation, Tokamak Fusion Test Reactor, Princeton Plasma Physics Laboratory, Princeton, New Jersey: Joseph F. Ward, Inc., Caldwell, New Jersey, 200 p.
Weeks, E.P., 1969, Determining the ratio of horizontal to verticalpermeability by aquifer-test analysis: Water Resources Research, v. 5, no. 1, p. 196-214.
41

GLOSSARY
Alluvium. A general term for all unconsolidated deposits resulting from erosion and deposition by modern streams.
Altitude. As used in this report, "altitude" refers to the distance above or below sea level.
Aquifer. A geologic formation, group of formations, or part of a formation that contains sufficient saturated permeable material to yield significant quantities of water to wells and springs.
Beta radiation. The emission of either an electron or a positron by an atomic nucleus. (As used in this report, beta radiation is the emission of an electron by an atomic nucleus.)
Cone of depression. A depression in the water table or other potentiometric surface produced by the withdrawal of water from an aquifer; it is shaped like an inverted cone with its apex at the area of greatest pumping.
Confining unit. A body of less permeable material stratigraphicallyadjacent to one or more aquifers. The hydraulic conductivity of a confining unit may range from nearly zero to some value significantly lower than that of the aquifer.
Cooling-water blowdown. Water containing heat collected from a heat sink, such as a cooling tower. The Tokamak Fusion Test Reactor cooling towers serve as an ultimate heat sink for the Tokamak Fusion Test
. Reactor facility by ejecting heat generated by equipment partially to the air, and partially to blowdown water.
Dip. The angle at which a stratum or any planar feature is inclined from the horizontal. The dip is at a right angle to the strike.
Discharge. The volume of water (or more broadly, volume of fluid plussuspended sediment), that passes a given point within a given period of time.
Dissolved. Chemical constituents in a water sample which pass through a 0.45-micrometer membrane filter. This is a convenient operational definition used by Federal agencies that collect water data. Determination of "dissolved" constituents are made on subsamples of the filtrate.
Drawdown. The lowering of the water table or potentiometric surface caused by pumping.
Effective porosity. The amount of interconnected pore space through which fluids can pass, expressed as percent of bulk volume. Part of the total porosity is occupied by static fluid being held to the mineral surface by surface tension, so effective porosity is less than total porosity.
42
GLOSSARY--Continued
Evaporation. The process by which water passes from the liquid to the vapor state.
Evapotranspiration. The sum of evaporation and transpiration.
Evapotranspiration. actual. The evapotranspiration that actually occurs under given climatic and soil-moisture conditions.
Evapotranspiration. potential. The evapotranspiration that would occur under given climatic conditions if there were unlimited soil moisture.
Fall Line. A line characterized by the outcrop of bedrock that divides the rolling topography of the Piedmont physiographic province from the relatively flat plains of the Coastal Plain physiographic province.
Ground water. Water saturating soil, unconsolidated deposits, or bedrock beneath the land surface.
Ground water, confined. Water under pressure significantly greater thanatmospheric. Its upper limit is the bottom of a unit with distinctly lower hydraulic conductivity than that of the material in which the confined water occurs. "Artesian" is synonymous with confined.
Half life. The time period in which half the initial number of atoms of a radioactive element disintegrate.
Head, static. The height above a standard datum of the surface of a column of water (or other liquid) that can be supported by the static pressure at a given point. Head, when used alone, is understood to mean static head.
Homogeneity. Synonymous with uniformity. A material is homogeneous if its hydrologic properties are identical everywhere.
Hydrauliceonductivitv. The capacity of soil, unconsolidated deposits, and rock to transmit water. For an isotropic medium, it is expressed as the volume of water at the existing kinematic viscosity that will move in unit time under a unit hydraulic gradient through a unit area measured at right angles to the direction of flow.
Infiltration. The flow of water downward from the land surface into and through the upper soil layers.
Infiltration capacity. The maximum rate at which infiltration can occur under specific conditions of soil moisture. For a given soil, the infiltration is a function of the water content.
Isotropy. That condition in which all significant properties are independent of direction.
43

GLOSSARY--Continued
Joint. Fracture in rock, generally more or less vertical or transverse to bedding, along which no appreciable movement has occurred.
Lithology. The physical character of a rock, generally as determined macroscopically or with the aid of a low-power magnifier.
Micrograms per liter (ug/L). A unit expressing the concentration of chemical constituents in solution as the mass (microgram = 1 x 10 6 gram) of solute per unit volume (liter) of water. One /^g/L is approximately equal to 1 part per billion (ppb) in aqueous solutions of low dissolved-solids concentration.
Milligrams per liter (mg/L). A unit expressing the concentration of chemical constituents in solution as the weight (milligram) of solute per unit volume (liter) of water. One thousand micrograms per liter is equivalent to one milligram per liter. For water containing less than 7,000 mg/L of total dissolved solids, the numerical value for milligrams per liter of a constituent is the same as for concentrations in parts per million (ppm).
Minimum detection limit. For a given type of sample and analyticalprocedure, it is the concentration value below which the presence of the constituent being analyzed cannot be verified or denied. Minimum detection limits can be identified in table 6 of this report by a less-than (<) symbol preceding a numerical value.
Outcrop. The exposure of bedrock or strata projecting through the overlying cover of unconsolidated deposits and soil.
Permeability, intrinsic. A measure of the relative ease with which a porous medium can transmit a liquid under a potential gradient.
PicoCurie (pCi). One trillionth (1 x 10" 12 ) of the amount ofradioactivity represented by a curie (Ci). A curie is the amount of radioactivity that yields 3.7 X 10 10 radioactive disintegrations per second. A picoCurie yields 2.22 disintegrations per minute.
Porosity. The ratio of interstitial or void space within a rock or soil to its total volume. It may be expressed as a decimal fraction or as a percentage.
Potentiometric surface. A surface that represents the static head in an aquifer. The potentiometric surface is defined by the levels to which water will rise in tightly cased wells. See head, static.
Recharge. The process by which water is added to an aquifer.
Sea level. In this report, "sea level" refers to the the National Geodetic Vertical Datum of 1929 (N.G.V.D. of 1929), a geodetic datum derived from a general adjustment of the first order level of nets of both the United States and Canada, formerly called "Mean Sea Level".
44

GLOSSARY--Continued
Secondary mineral. A general terra applied to minerals formed as aconsequence of the alteration of pre-existing minerals. Secondary minerals may be formed in place, or they may be deposited from solution in the interstices of a rock through which a solution is passing.
Specific conductance. A measure of the capacity of a water to conduct an electrical current expressed in microsiemens per centimeter at 25 degrees Celsius.
Specific yield. In general terms, the volume of water yielded from a water bearing material by gravity drainage, as occurs when the water table declines. More exactly, the specific yield of a rock or soil is the ratio of the volume of water which a saturated rock or soil will yield by gravity to the volume of the rock or soil.
Storage coefficient. The volume of water a porous medium releases from or takes into storage per unit surface area of the aquifer per unit change in head.
Stream, gaining. A stream or reach of a stream whose flow is being increased by inflow of ground water.
Stream, losing. A stream or reach of a stream that is losing water to the ground.
Strike. The course or bearing of the outcrop of an inclined bed or structure on a level surface; the direction or bearing of a horizontal line in the plane of an inclined stratum, joint, fault, cleavage plane, or other structural plane. It is perpendicular to the direction of the dip. A horizontal bed or structure has zero strike.
Transmissivity. The rate at which water of the prevailing kinematicviscosity is transmitted through a unit width of the aquifer under a unit hydraulic gradient. It equals the hydraulic conductivity multiplied by the aquifer thickness.
Transpiration. The process by which plants give off water vapor through their leaves.
Tritium unit (TU). A measure of the concentration of tritium. One tritium unit is equal to 1 tritium isotope per 10 18 hydrogen atoms. One tritium unit is equal to 3.193 picoCuries per liter of water.
Water table. The level in the saturated zone at which the pressure is equal to the atmospheric pressure.
45