by larry chapman mph senior vice president webmd health services (206) 364-3448 does wellness work?:...
TRANSCRIPT

byLarry Chapman MPHSenior Vice President
WebMD Health Services(206) 364-3448
Does Wellness Work?: A Look at the Evidence for Worksite Wellness
AWC Wellness AcademyWenatchee, WA
April 17-19, 2007

Agenda
• Do Wellness programs improve health?
• Do Wellness programs reduce health costs?
• Do Wellness programs save money?
• What will Wellness programs look like in the future?

Fun activity focusNo risk reductionNo high risk focusNot HCM orientedAll voluntarySite-based onlyNo personalizationMinimal incentivesNo spouses servedNo evaluation
Mostly health focusSome risk reductionLittle high risk focusLimited HCM orientedAll voluntarySite-based onlyWeak personalizationModest incentivesFew spouses servedWeak evaluation
Add productivityStrong risk reductionStrong high risk focusStrong HCM orientedSome reqd activitySite and virtual bothStrongly personalMajor incentivesMany spouses servedRigorous evaluation
Quality ofWorkLife
TraditionalHealth and
ProductivityManagement
Morale-Oriented Activity-Oriented Results-Oriented
Program Model
Main Features
Primary Focus
First, Wellness comes in different “flavors”
Usual Percent Participation
15% - 29% 30% - 65% 66% - 98%

Do Wellness programs improve health?
Source: Art of Health Promotion Newsletter, Vol. 1, No. 3, 1997
Answer: “Yes” for most types of Wellness Programs

Health risks are related to health costs
70%
46%
35%
21%
20%
12%
10%
0% 20% 40% 60% 80%
No Exercise
High BP
Smoker
Obesity
Blood Sugar
Stressed
Depressed
Percent Higher Annual Health Plan Costs
Health Plan Cost
Source: Goetzel RZ, et. al. (1998, October). The relationship between modifiable health risks and health care expenditures: An analysis of the multi-employer HERO health risk and cost database. JOEM, 40(10):843-54.
N = 46,000+ X 3 years

When health risks change costs change
$0$1,000$2,000$3,000$4,000$5,000$6,000$7,000$8,000
YR. 1 YR. 2 YR. 3 YR. 4 YR. 5
Low Risk Individual
High to Low
High Risk Individual
Source: Updated from Edington, et. al., (1997, November). The financial impact of changes in personal health practices. JOEM, 39(11), p. 1037-1046.
Annual Per Capita Health Care Costs

What drives health care cost?
Supply-Side Factors (outside the individual)
Extent and scope of insurance coverage
Point-of-use cost sharing
Geographic access to services
Size of discounts
Supply-Side Factors (outside the individual)
Regional or local practice patterns
Provider incentives affecting diagnosis and treatment decisions
Demand-Side Factors (inside the individual)
Age
Sense of responsibility for personal
health
Clinical risk factors
Current morbidity
Self-efficacy
Gender
Personal health
behavior
Attitudes about personal health and health care
use.

Do Wellness programs save money?
Define Wellness Programs
Define Study InclusionCriteria
Conduct Literature Search
Select Studies
Apply Meta-EvaluationCriteria
Produce SummaryPublications
ArticleMeta-Evaluation of EconomicReturn Studies
BookProof Positive

Study inclusion criteria• Multi-component programming• Workplace setting only• Reasonably rigorous study design• Original research results• Examines economic variables• In peer review journal• Use comparison or control group• Use statistical analysis• Must be replicable approach• At least 12 months in duration

Meta-Evaluation criteria
1. Quality of research design
2. Sample size
3. Quality of baseline delineations
4. Quality of measurements
5. Appropriateness and replicability of interventions
6. Length of observational period
7. Recentness of experimental period

Example of Meta-Evaluation criteria
#2 Sample size
Points Criteria Sub-Components
5 Sample size > 50,000
4 Sample size from 25,000 to 49,999
3 Sample size from 10,000 to 24,999
2 Sample size from 1,000 to 9,999
1 Sample size 999
1 bonus For controlling for sample attrition

Study Parameter Averages & Totals (N=60)
Average study years 3.77 Observational years 226.3 Year Reported (median) 1995 # of Study Subjects 552,339 # of Control Subjects 200,259 Average # of Program Targets 5.1 % Change in Sick Leave -25.3% (26) % Change in HCs -26.5% (27) % Change in Workers’ Comp -40.7% (5) % Change in Disability Mang. -24.2% (3) C/B Ratio 1:5.81 (22)
Summary of 2007 findings
Source: Proof Positive: An Analysis of the Cost-Effectiveness of Worksite Wellness, Sixth Edition, 2007.

Peer Reviewed C/B studies
0
2
4
6
8
10
12
14
16
18
20
#1 #2 #3 #4 #5 #6 #7 #8 #9 #10 #11 #12 #13 #14 #15 #16 #17 #18 #19 #20 #21 #22
Traditional
Newer Programs
OutliersC/B Ratio
Study Number
Bank of AmericaBlue Shield of CADuke University
CitibankCity of Birmingham
CoorsDuPont
General FoodsGeneral MotorsGlaxoSmithKline
Indiana BCBSJohnson & Johnson
Life AssuranceNortel
PrudentialTravelers
Union PacificWashoe County
Source: Proof Positive: An Analysis of the Cost-Effectiveness of Worksite Wellness, Summex Health Management, Sixth Edition, 2007.

Summary of C/B results
0
2
4
6
8
10
12
14
16
18
20
#1 #2 #3 #4 #5 #6 #7 #8 #9 #10 #11 #12 #13 #14 #15 #16 #17 #18 #19 #20 #21 #22
C/B Ratio
Study Number
Source: Proof Positive: An Analysis of the Cost-Effectiveness of Worksite Wellness, Summex Health Management, Sixth Edition, 2007.
Average C/B Ratio = 1:5.81
Red = Health plan savings only

Summary of C/B results
0
2
4
6
8
10
12
14
16
18
20
#1 #2 #3 #4 #5 #6 #7 #8 #9 #10 #11 #12 #13 #14 #15 #16 #17 #18 #19 #20 #21 #22
C/B Ratio
Study Number
Source: Proof Positive: An Analysis of the Cost-Effectiveness of Worksite Wellness, Summex Health Management, Sixth Edition, 2007.
Average C/B Ratio = 1:5.81
Red = Health plan savings only Blue = Health plan and sick leave savings
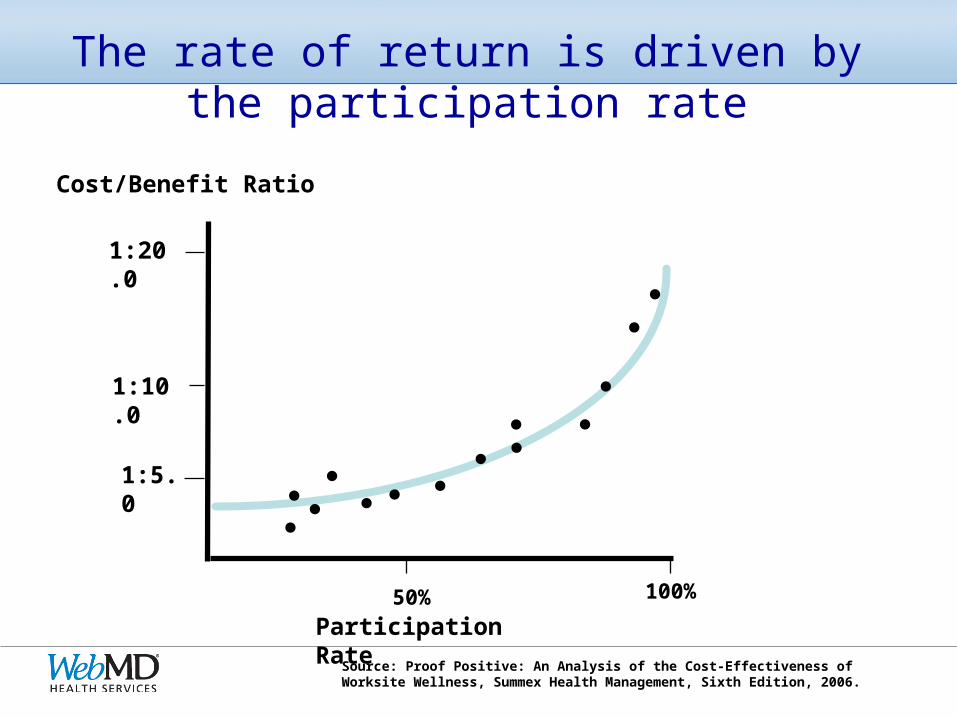
The rate of return is driven by the participation rate
50% 100%
Cost/Benefit Ratio
Participation Rate
●●
●●
●●●
●
●
●
●
●
1:10.0
1:20.0
●
●
1:5.0
Source: Proof Positive: An Analysis of the Cost-Effectiveness of Worksite Wellness, Summex Health Management, Sixth Edition, 2006.

Another very important study
$0
$344
$83
$391
$173
$607
$543
$625
$0
$100
$200
$300
$400
$500
$600
$700
0 1 2 3+
No Activities
Activities
Number of HRAs in 6 Years (1992-1997)
P = 13,048
NP = 13,363
Avera
ge A
nnu
al Savin
gs
P-N
P
Controlled for:AgeGenderBargaining
statusPlan typeSite Baseline claims
Source: Serxner, et.al., The Relationship Between Health Promotion Program Participation and Medical Costs: A Dose Response, JOEM, 45(11), November, 1196-1200.

Lifetime Health Costs Perspective
Birth Death
An
nu
al H
ealt
h
Costs
Without Wellness
With Wellness65

Fun activity focusNo risk reductionNo high risk focusNot HCM orientedAll voluntarySite-based onlyNo personalizationMinimal incentivesNo spouses servedNo evaluation
Mostly health focusSome risk reductionLittle high risk focusLimited HCM orientedAll voluntarySite-based onlyWeak personalizationModest incentivesFew spouses servedWeak evaluation
Add productivityStrong risk reductionStrong high risk focusStrong HCM orientedSome reqd activitySite and virtual bothStrongly personalMajor incentivesMany spouses servedRigorous evaluation
Quality ofWorkLife
Traditional orConventional
Health andProductivityManagement
Morale-Oriented Activity-Oriented Results-Oriented
Model
Features
Focus
Future of Wellness programming

Referrals
HRA
Personal Report
Telephone Coaching
Email and Mail Messaging
PCP Summary
Online E-HealthIncentives for Wellness
Communications Kit
“Virtual” Wellness Infrastructure for the Future

Summary of key points• There are a large number of health improvement and economic return studies now in the
literature.
• They are of differing quality and rigor.
• However, all of them with a few exceptions document positive findings, but with different magnitudes.
• They have been conducted in a wide variety of industries and settings with varying size work groups.
• The more rigorous the evaluation effort the greater the health effect and economic return.
• The higher the participation levels the greater the health effect and economic return.
• Studies are now being reported in other developed nations that parallel US study findings.
• There are a number of programming strategies that will enhance the economic return from these types of programs.
• Therefore, Yes - Wellness programs do work.

Questions?