by lukas audickas wales elections:...
TRANSCRIPT

www.parliament.uk/commons-library | intranet.parliament.uk/commons-library | [email protected] | @commonslibrary
BRIEFING PAPER
Number CBP 7594, 19 May 2016
National Assembly for Wales Elections: 2016
By Lukas Audickas
Contents: 1. Introduction 2. Party summaries 3. Candidates 4. Results 5. Turnout 6. Composition of the Assembly 7. Appendix

2 National Assembly for Wales Elections: 2016

3 National Assembly for Wales Elections: 2016
Editor
Contributing Authors
Richard Keen, Lukas Audickas
Cover page image attributed to: National Assembly for Wales, Licensed by Creative Commons Attribution-NonComercial-ShareAlike 2.0 Generic (CC BY 2.0) / image cropped

4 National Assembly for Wales Elections: 2016
Contents Summary 5
Seats and votes by party 1999 to 2016 6
1. Introduction 7
2. Party summaries 9 Conservative 9 Labour 10 Liberal Democrats 11 Plaid Cymru 12 UK Independence Party 13 Green party 14 Other Parties 14
3. Candidates 15
4. Results 16 Percentage share of the vote, by party, 2011 and 2016 16 National Assembly for Wales elections: 5 May 2016 17 National Assembly for Wales elections: 5 May 2011 18
5. Turnout 19
6. Composition of the Assembly 20 Parties and regions 20 Ethnicity 20 Gender 20
7. Appendix 21 7.1 Constituency Ballot 21
Table 1: Constituency results - votes and turnout by constituency 21 Table 2: Constituency results - seats by majority (from highest to lowest percentage majority) 22 Table 3: Constituency results - party share of vote by constituency, and majority 23 Table 4: Change in share of the vote and turnout by constituency 24 Table 5: Constituency results - votes and shares by region and party 25 Table 6: Constituency ballot results - change in share of the vote by region 25 Table 7: Difference in turnout and party share of vote between constituency and regional ballots by region 25 Table 8: Constituency results - party share of vote by constituency 26 Table 9: Largest and smallest constituency majorities by party 27 Table 10: Constituencies with highest and lowest turnout in each region 27 Table 11: Highest and lowest shares of constituency vote 28
7.2 Regional ballot 29 Table 12: Regional results - votes and turnout by constituency 29 Table 13: Regional results - change in party share of vote and turnout by constituency 30 Table 14: Regional ballot results - votes and turnout by party and region 31 Table 15: Regional ballot results - party share of vote by party and region 31 Table 16: Regional ballot results - change in share of the vote by region 31
7.3 Assembly Members elected 32 Table 17: Seats won by seat type, party and region 32 Table 18a: Assembly Members elected, May 2016 33 Table 18b: Assembly Members elected, May 2016 34
Tables and underlying data in this briefing are available as Excel files via: http://researchbriefings.parliament.uk/ResearchBriefing/Summary/CBP-7594

5 National Assembly for Wales Elections: 2016
Summary Labour fell short of a majority winning 29 of the 60 seats in the National Assembly. The seats won by each party were as follows:
• Conservatives 11 • Labour 29 • Liberal Democrats 1 • Plaid Cymru 12 • UKIP 7
Labour’s share of the vote fell to 33.2%, from 39.6% in 2011, but it remained the largest party in the National Assembly. Plaid Cymru have overtook the Conservatives as second largest party with 20.7%, up from 18.6%. The Conservatives polled 20.0%, 3.8% points less than in 2011. The UK Independence Party’s share has risen by 10.4% points to 12.7%, compared to 2.3% in 2011. The Liberal Democrat’ share fell to 7.1% from 9.3%, and the Green Party polled 2.7%, up from 1.8%.
Average turnout across all the constituencies and regions was 45.4%, up by 4.0% points from 2011. The highest turnout was in Cardiff North (56.8%) and Brecon & Radnorshire (56.5). The lowest turnout was in Alyn & Deeside where 34.6% voted. Following the elections, the Assembly comprises 35 men and 25 women. The overall women representation have increased by one, compared to 2011. It is three fewer than in 2007 and five fewer than in the 2003, when there was an equal number of men and women elected.
There are currently two known ethnic minority Assembly Members. Mohammad Asghar was first elected for Plaid Cymru in 2007 and then for the Conservatives in 2011 and in 2016; Vaughan Gething was elected for Labour in 2011 and re-elected in 2016.
Results in Brief
(Constituency + Regional)
Votes
Conservative 451,162 23.8% 406,443 20.0%
Labour 751,612 39.6% 673,061 33.1%
Liberal Democrat 176,608 9.3% 143,669 7.1%
Plaid Cymru 352,706 18.6% 420,922 20.7%
UKIP 43,256 2.3% 259,176 12.7%
Green 34,163 1.8% 55,413 2.7%
Others 88,634 4.7% 75,439 3.7%
Seats 2011 2016 Change
Conservative 14 11 -3
Labour 30 29 -1
Liberal Democrat 5 1 -4
Plaid Cymru 11 12 +1
UKIP 0 7 +7
Green 0 0 0
Others 0 0 0
Turnout 41.4% 45.4% +4.0%
20162011
0
5
10
15
20
25
30
35
40
2011 2016
Asembly members by gender
Men Women

6 National Assembly for Wales Elections: 2016
National Assembly for Wales seats and votes by party 1999 to 2016
Seats and votes by party 1999 to 2016
Share of seats by party 1999 2003 2007 2011 2016
ConservativeSeats 9 11 12 14 11
Constituency 1 1 5 6 6Regional 8 10 7 8 5
Share 16.2% 19.6% 21.9% 23.8% 20.0%
Constituency 15.8% 19.9% 22.4% 25.0% 21.1%Regional 16.5% 19.2% 21.5% 22.5% 18.8%
Labour
Seats 28 30 26 30 29
Constituency 27 30 24 28 27Regional 1 0 2 2 2
Share 36.5% 38.3% 30.9% 39.6% 33.1%
Constituency 37.6% 40.0% 32.2% 42.3% 34.7%Regional 35.4% 36.6% 29.6% 36.9% 31.5%
Liberal Democrat
Seats 6 6 6 5 1
Constituency 3 3 3 1 1Regional 3 3 3 4 0
Share 13.0% 13.4% 13.3% 9.3% 7.1%
Constituency 13.5% 14.1% 14.8% 10.6% 7.7%Regional 12.5% 12.7% 11.7% 8.0% 6.5%
Plaid Cymru
Seats 17 12 15 11 12
Constituency 9 5 7 5 6Regional 8 7 8 6 6
Share 29.5% 20.5% 21.7% 18.6% 20.7%
Constituency 28.4% 21.2% 22.4% 19.3% 20.5%Regional 30.5% 19.7% 21.0% 17.9% 20.8%
UK Independence Party
Seats - 0 0 0 7
Constituency - 0 0 0 0Regional - 0 0 0 7
Share - 2.9% 2.9% 2.3% 12.7%
Constituency - 2.3% 1.8% 0.0% 12.5%Regional - 3.5% 3.9% 4.6% 13.0%
Green
Seats 0 0 0 0 0
Constituency 0 0 0 0 0Regional 0 0 0 0 0
Share 0.1% 1.8% 1.7% 1.8% 2.7%
Constituency 0.1% 0.0% 0.0% 0.2% 2.5%Regional 2.5% 3.5% 3.5% 3.4% 3.0%
0%
10%
20%
30%
40%
50%(Conservative)
0%
10%
20%
30%
40%
50% (Labour)
0%
10%
20%
30%
40%
50%(Liberal Democrat )
0%
10%
20%
30%
40%
50% (Plaid Cymru)
0%
10%
20%
30%
40%
50% (UKIP)
0%
10%
20%
30%
40%
50% (Green)
7 Commons Library Briefing, 17 May 2016
1. Introduction The fifth set of elections to the National Assembly for Wales took place on Thursday, 5 May 2016, simultaneously with elections to the Scottish Parliament, elections to the Northern Ireland Assembly, local authority elections in England, London authority elections and Elections for Police and Crime Commissioners across England and Wales.
The system for electing members to the National Assembly is known as the Additional Member System. Voters are given two ballot papers. The first is used to elect each of 40 constituency Assembly Members (AMs) under the traditional first-past-the-post system. The second ballot paper is used to elect four AMs from each of five electoral regions. These additional members are elected so that the total representation from each geographical area, including those members elected under first-past-the-post, corresponds more closely to the share of the votes cast for each political party in the region.
2016 was the first Assembly election when all three UK-wide parties: Conservative, Labour and Liberal Democrats lost seats. This was influenced by UKIP’s performance, securing seven seats, their first the National Assembly.
Labour maintained the status of the largest party in the Assembly, but fell one seat short of a working majority. This was Labour’s second worse performance, in terms of seats won, after 2007 when they won 24 seats (5 fever than in 2016).
The Conservatives, for the first time, did not increase their seat count loosing 3 seats. Plaid Cymru regained their status as second largest party in the Assembly, with 0.7% points of votes share and one more seat than the Conservative.
Measured by number of seats gained, it was the most successful Assembly election for UKIP and the worst for the Liberal Democrats. The Liberal Democrats have lost four Assembly Members and secured just one seat.
Data in this publication:
Data in this research paper for the number of votes cast in each ballot and for the electorates in each constituency and region has been provided by local authorities and may differ from figures reported in the media. Turnout is measured as the number of valid votes divided by the electorate. Some Returning Officers include rejected ballots in their calculation of turnout, leading to higher measures of turnout than those reported here.
Regional seats are assigned as follows: The votes for each party are summed, and divided by the number of seats the party has already gained in the constituencies plus one. The first seat is then awarded to the party with the most votes. The process is repeated, taking the newly assigned seat into account until all regional seats are filled.

8 National Assembly for Wales Elections: 2016
National Assembly for Wales constituency ballot winners: 2016
9 Commons Library Briefing, 17 May 2016
2. Party summaries Conservative
Change in share of the vote between 2016 and 2016 by region Conservative's share of votes and seats
-15% -10% -5% 0% +5% +10%+15%
All regions
South Wales West
South Wales East
South Wales Central
North Wales
Mid and West WalesConstituency ballot
Regional ballot
0%
10%
20%
30%
40%
50%
1999 2003 2007 2011 2016
Vote share
% Seats
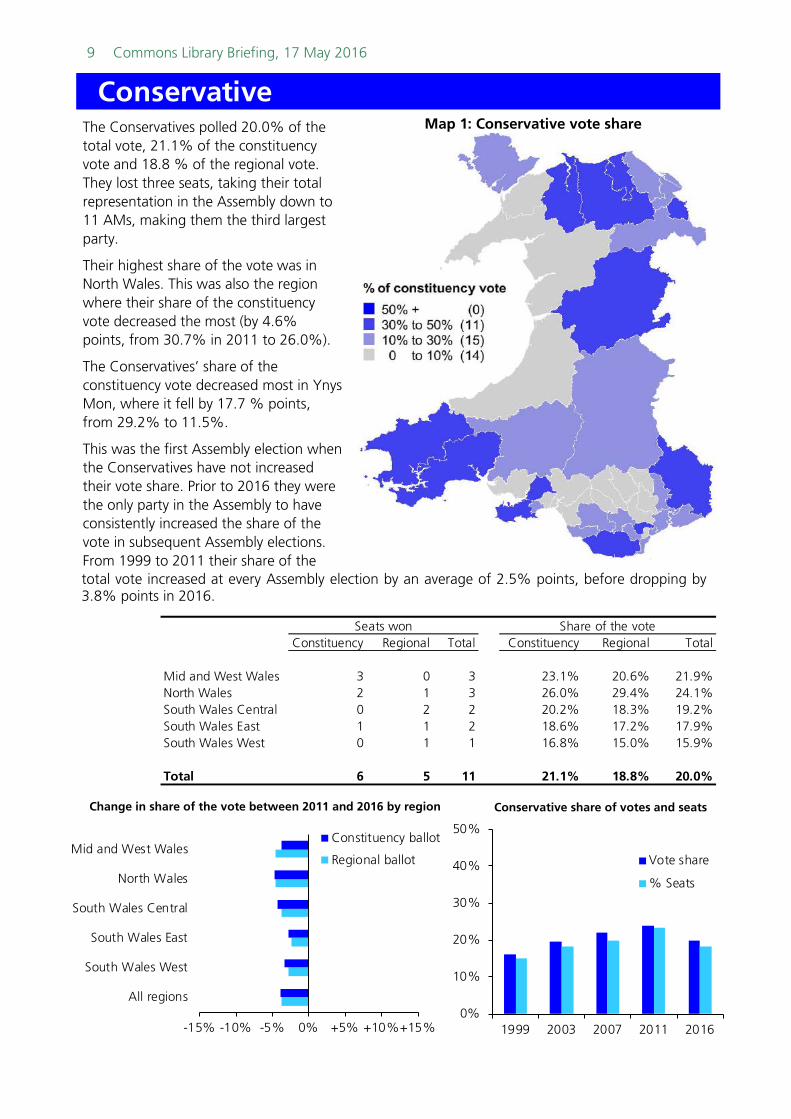
The Conservatives polled 20.0% of the total vote, 21.1% of the constituency vote and 18.8 % of the regional vote. They lost three seats, taking their total representation in the Assembly down to 11 AMs, making them the third largest party.
Their highest share of the vote was in North Wales. This was also the region where their share of the constituency vote decreased the most (by 4.6% points, from 30.7% in 2011 to 26.0%).
The Conservatives’ share of the constituency vote decreased most in Ynys Mon, where it fell by 17.7 % points, from 29.2% to 11.5%.
This was the first Assembly election when the Conservatives have not increased their vote share. Prior to 2016 they were the only party in the Assembly to have consistently increased the share of the vote in subsequent Assembly elections. From 1999 to 2011 their share of the
total vote increased at every Assembly election by an average of 2.5% points, before dropping by 3.8% points in 2016.
ConservativeMap 1: Conservative vote share
Constituency Regional Total Constituency Regional Total
Mid and West Wales 3 0 3 23.1% 20.6% 21.9%North Wales 2 1 3 26.0% 29.4% 24.1%South Wales Central 0 2 2 20.2% 18.3% 19.2%South Wales East 1 1 2 18.6% 17.2% 17.9%South Wales West 0 1 1 16.8% 15.0% 15.9%
Total 6 5 11 21.1% 18.8% 20.0%
Seats won Share of the vote
Conservative share of votes and seats Change in share of the vote between 2011 and 2016 by region

10 National Assembly for Wales Elections: 2016
Labour
LabourThis was the third Assembly election that Labour did not secure a working majority of seats.
Labour gained the highest share of the vote with 33.1% of the total vote, 34.7% of the constituency vote and 31.5% of the regional vote. Labour also won the highest number of seats (29), one fewer, compared with the 2011 election.
Labour’s share of the vote decreased by 7.6% points in the constituency ballot and by 5.4% in the regional ballot. Their highest share of the vote in any region was in South Wales West. This was also the region where their constituency vote share deceased the most, by 9.7% points, from 55.1% in 2011 to 45.4%.
Labour’s highest share of the vote in any constituency was in Ogmore, where they won 55.2% of the constituency ballot. The largest decline in support for Labour was reported in Rhondda constituency, where they lost 27.3% of constituency votes compared to 2011.
Map 2: Labour vote share
Change in share of the vote between 2016 and 2016 by region Labour's share of votes and seats
-15% -10% -5% 0% +5% +10%+15%
All regions
South Wales West
South Wales East
South Wales Central
North Wales
Mid and West Wales Constituency ballot
Regional ballot
0%
10%
20%
30%
40%
50%
1999 2003 2007 2011 2016
Vote share % Seats
Change in share of the vote between 2011 and 2016 by region Labour share of votes and seats
Constituency Regional Total Constituency Regional Total
Mid and West Wales 1 2 3 17.6% 19.4% 18.5%North Wales 5 0 5 32.6% 28.1% 30.3%South Wales Central 7 0 7 40.7% 33.9% 37.3%South Wales East 7 0 7 39.8% 38.3% 39.1%South Wales West 7 0 7 45.4% 39.5% 42.5%
Total 27 2 29 34.7% 31.5% 33.1%
Seats won Share of the vote

11 Commons Library Briefing, 17 May 2016
Liberal Democrats
Change in share of the vote between 2011 and 2016 by region Liberal Democrat share of votes and seats
Liberal Democrats
The Liberal Democrats gained support in only two constituencies: Brecon & Radnorshire and Clwyd South. Their largest gain was in Brecon & Radnorshire, where their share of the vote increased by 9.3% points, from 43.1% in 2011 to 52.4%.
The Liberal Democrats received 7.1% of the total vote, 7.7% of the constituency vote and 6.5% of the regional vote, winning only one seat. Overall, this is 2.2% points less and four seats fewer than in 2011. This was the worst performance for the Liberal Democrats in any Assembly election so far.
It is a notable change from their long-term position in Wales, which had been relatively stable. In Assembly elections prior to 2011 the Liberal Democrats consistently polled between 13.0% and 13.5% of the total vote, before losing 4.0% points in 2011.
The largest reduction in the Liberal Democrats’ share of the vote took place in Newport East, where their share of the constituency vote fell by 11.9% points, from 19.1% in 2011 to 7.2%. Across the whole of the South Wales East region, which includes the Newport constituencies, the Liberal Democrats’ share of the constituency vote fell by 4.0% points.
Map 3: Liberal Democrat vote share
Constituency Regional Total Constituency Regional Total
Mid and West Wales 1 0 1 16.7% 10.9% 13.8%North Wales 0 0 0 4.6% 4.6% 4.6%South Wales Central 0 0 0 7.3% 6.4% 6.9%South Wales East 0 0 0 3.5% 3.5% 3.5%South Wales West 0 0 0 5.0% 6.5% 5.7%
Total 1 0 1 7.7% 6.5% 7.1%
Seats won Share of the vote
-15% -10% -5% 0% +5% +10% +15%
All regions
South Wales West
South Wales East
South Wales Central
North Wales
Mid and West WalesConstituency ballot
Regional ballot
0%
10%
20%
30%
40%
50%
1999 2003 2007 2011 2016
Vote share
% Seats
Liberal Democrat

12 National Assembly for Wales Elections: 2016
Plaid Cymru
Plaid Cymru
Plaid Cymru polled 20.7% of the total vote, 20.5% of the constituency vote and 20.8% of the regional vote and became the second largest party after overtaking the Conservatives by 0.7% points.
They gained one seat, taking their total representation in the Assembly to 12 AMs. Plaid Cymru’s highest share of the vote in any region was in Mid and West Wales, where they polled 26.9% of total constituency vote.
The largest increase in regional vote share was recorded in South Wales Central region, where it rose by 7.2% points, from 13.7 in 2011 to 20.9%.
Plaid Cymru’s share of the constituency vote increased most in Blaenau Gwent, where it rose by 31.2% points, from 5.4% to 36.6%.
Map 4: Plaid Cymru vote share
-15% -5% +5% +15%
All regions
South Wales West
South Wales East
South Wales Central
North Wales
Mid and West WalesConstituency ballot
Regional ballot
0%
10%
20%
30%
40%
50%
1999 2003 2007 2011 2016
Vote share
% Seats
Change in share of the vote between 2011 and 2016 by region Plaid Cymru share of votes and seats
Constituency Regional Total Constituency Regional Total
Mid and West Wales 3 1 4 26.9% 26.3% 26.6%North Wales 2 1 3 24.5% 12.6% 23.9%South Wales Central 1 1 2 18.6% 20.9% 19.7%South Wales East 0 1 1 16.3% 15.3% 15.8%South Wales West 0 2 2 15.2% 17.2% 16.2%
Total 6 6 12 20.5% 20.8% 20.7%
Share of the voteSeats won

13 Commons Library Briefing, 17 May 2016
UK Independence Party
Map 5: UK Independence Party vote share
UK Independence Party For the first time the UK Independence Party was elected to The National Assembly for Wales.
UKIP polled 12.7% of the total vote, 12.5% of the constituency vote, 13.0% of the regional vote, and won seven seats. Overall, this is 10.5% of vote. The best performance for UKIP in any Assembly election so far.
UKIP’s highest share of the vote in any region was in South Wales East, where they received 18.1%. UKIP did not field any constituency candidates in the 2011 election. They gained their highest share of the constituency vote (22.6%) in Torfaen constituency.
UKIP increased their share of the regional ballot in every region. Their regional vote share across Wales increased by 8.4% points from 4.6% in 2011 to 13.0%. Their strongest regional performance was in South Wales East, where they polled 17.8% of the regional vote.
Constituency Regional Total Constituency Regional Total
Mid and West Wales 0 1 1 10.8% 11.6% 11.2%North Wales 0 2 2 10.7% 12.5% 11.6%South Wales Central 0 1 1 9.8% 10.4% 10.1%South Wales East 0 2 2 18.0% 17.8% 8.9%South Wales West 0 1 1 14.0% 13.7% 13.8%
Total 0 7 7 12.5% 13.0% 12.7%
Seats won Share of the vote
-20% -10% 0% +10% +20%
All regions
South Wales West
South Wales East
South Wales Central
North Wales
Mid and West Wales Constituencyballot
Regional ballot
0%
10%
20%
30%
40%
50%
1999 2003 2007 2011 2016
Vote share
% Seats
Change in share of the vote between 2011 and 2016 by region UKIP share of votes and seats

14 National Assembly for Wales Elections: 2016
Green party
Other Parties
The Green Party raised had candidates in a majority of constituencies and in all five regions, but did not win any seats.
They received 2.7% of the total vote, 2.5% of the constituency vote and 3.0% of the regional vote.
Overall, this is 0.9% points more than in 2011, the best performance of the Greens compared to any prior Assembly election.
The Green Party’s share of the regional vote fell from 3.4% to 3.0%. However, their share of constituency vote increased notably, from 0.2% in 2011 to 2.5%.
The Green Party performed the best in Ceredigion and Cardiff Central constituencies, with 6.2% and 5.9% of regional vote respectively.
Green
Other partiesOther political parties (not included in party summaries above) and independent candidates received 3.7% of the total vote, 1.0% of the constituency vote and 6.4% of the regional vote. None of these parties secured any constituency or regional seats.
The highest increase in share of regional votes for other parties (3.1%) was recorded in Mid and West Wales region. Whereas, in South Wales East the regional ballot share fell the most, by 3.3% points.
Other parties’ share of constituency votes generally did not increase in any of the regions. The highest decrease, of 7.7% points, was recorded in the South Wales East region.
None of the other individual political parties gained more than 1% of constituency vote.
The Abolish The Welsh Assembly Party, was the only other party to receive more than 1% of regional votes. They received 4.4% of total regional votes..
0%
10%
20%
1999 2003 2007 2011 2016
Green Party vote share
Change in share of the vote between 2011 and 2016 by region
-10% 0% +10%
All regions
South Wales West
South Wales East
South Wales Central
North Wales
Mid and West Wales
Constituency ballot Regional ballot
-10% 0% +10%
All regions
South Wales West
South Wales East
South Wales Central
North Wales
Mid and West Wales
Constituency ballot Regional ballot
Change in share of the vote between 2011 and 2016 by region
Constituency Regional Total
Mid and West Wales 3.1% 3.8% 3.4%North Wales 1.5% 3.1% 1.9%South Wales Central 2.8% 3.4% 3.1%South Wales East 2.4% 2.5% 2.5%South Wales West 2.5% 2.6% 2.5%
Total 2.5% 3.0% 2.7%
Share of the vote
Constituency Regional Total
Mid and West Wales 1.8% 7.3% 4.6%North Wales 0.1% 6.9% 3.5%South Wales Central 0.6% 6.7% 3.6%South Wales East 1.3% 5.4% 3.3%South Wales West 2.5% 5.5% 3.4%
Total 1.0% 6.4% 3.7%
Share of the vote
0%
10%
1999 2003 2007 2011 2016
Green Party vote share

15 Commons Library Briefing, 17 May 2016
3. Candidates Over 300 of regional and nearly 250 of constituency candidates stood for election to The National Assembly for Wales on 5 May 2016.
On average, across Wales there were 6.2 candidates per constituency. This is just above the UK average (6.1), comparing to the last general election in 2015.
Data collection1 The gender of candidates is not systematically recorded and data is only available from the third party sources. Information about National Assembly for Wales election candidates is collected using Democracy Club data. The gender of some candidates was assigned on the basis of their first name in absence of other information.
Gender by region The gender balance among regional and constituency candidates was roughly the same. From all the regional and constituency candidates around one-third (34%) were women.
The South Wales Central regions had the most proportional gender balance among candidates. There, around 41% of candidates were women. There was a similar gender balance was in the South Wales West region, where 61% of candidates were male. The largest gender disparity was recoded in the South Wales East region where 30% of candidates were women.
Gender by party The Wales Green Party had the most equal gender distribution among regional candidates. Half (50%) of the Green Party regional candidates were women. Labour Party had the highest number of women on its regional lists (60%).
Two-fifths (42%) of Green Party constituency candidates were females. Followed by 38% Liberal Democrats and 37% Labour’s candidates.
30% of UK Independence Party and around 34% of Conservative regional candidates were women.
The Conservative Party had the lowest proportion of female constituency candidates. Less than a quarter (23%) of their candidates were women.
1 Democracy Club (2016) Member of the National Assembly for Wales
0%
20%
40%
60%
80%
100%
Regionalcadidates
Constituencycandidates
Constituency and regional candidates
by gender
Women Men
0 10 20 30 40 50 60 70
Conservative
Labour Party
Liberal Democrats
Plaid Cymru
UK Independence Party
Green Party
Regional candidates by gender and party
0 10 20 30 40 50 60 70
Mid and West Wales
North Wales
South Wales Central
South Wales East
South Wales West
Regional candidates by gender and region
0 10 20 30 40 50 60 70
Conservative
Labour Party
Liberal Democrats
Plaid Cymru
UK Independence Party
Green Party
Constituency candidates by gender and party

16 National Assembly for Wales Elections: 2016
4. Results The reference table below provides regional and constituency results for the National Assembly for Wales Election in 2016 and 2011. This compares regional and constituency ballot results by percentage share of vote.
For detailed results by party refer to “Party Summary” section (pp. 7-12)
Percentage share of the vote, by party, 2011 and 2016
Constituency Region All votes
Conservative 21.1% 18.8% 20.0%
Labour 34.7% 31.5% 33.1%
Liberal Democrat 7.7% 6.5% 7.1%
Plaid Cymru 20.5% 20.8% 20.7%
UKIP 12.5% 13.0% 12.7%
Green 2.5% 3.0% 2.7%
Others 1.0% 6.4% 3.7%
Total 100.0% 100.0% 100.0%
Constituency Region All votes
Conservative 25.0% 22.5% 23.8%
Labour 42.3% 36.9% 39.6%
Liberal Democrat 10.6% 8.0% 9.3%
Plaid Cymru 19.3% 17.9% 18.6%
UKIP 0.0% 4.6% 2.3%
Green 0.2% 3.4% 1.8%
Others 2.7% 6.7% 3.7%
Total 100.0% 100.0% 100.0%
Constituency Region All votes
Conservative -3.9% -3.7% -3.8%
Labour -7.6% -5.4% -6.5%
Liberal Democrat -2.9% -1.6% -2.2%
Plaid Cymru +1.3% +3.0% +2.1%
UKIP +12.5% +8.5% +10.5%
Green +2.3% -0.5% +0.9%
Others -1.7% -0.2% 0.0%
2016 Assembly election
2011 Assembly election
Change 2011-2016
17 Commons Library Briefing, 17 May 2016
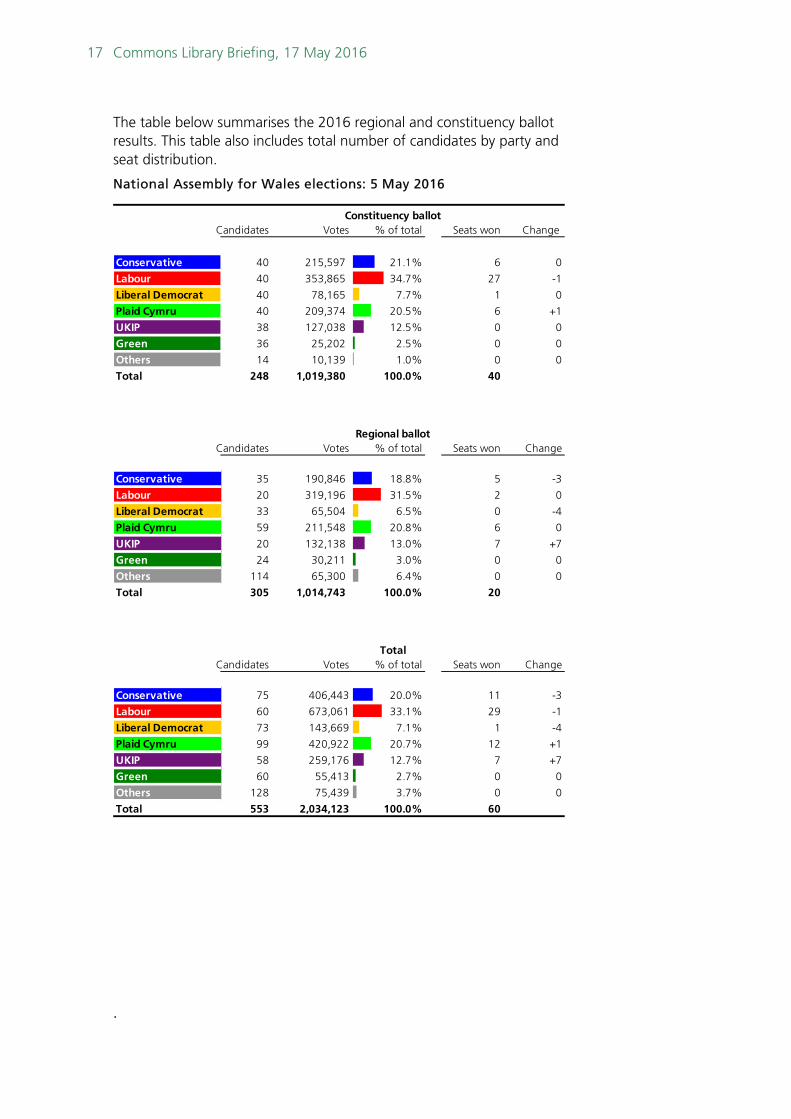
The table below summarises the 2016 regional and constituency ballot results. This table also includes total number of candidates by party and seat distribution.
National Assembly for Wales elections: 5 May 2016
.
Candidates Votes % of total Seats won Change
Conservative 40 215,597 21.1% 6 0
Labour 40 353,865 34.7% 27 -1
Liberal Democrat 40 78,165 7.7% 1 0
Plaid Cymru 40 209,374 20.5% 6 +1
UKIP 38 127,038 12.5% 0 0
Green 36 25,202 2.5% 0 0
Others 14 10,139 1.0% 0 0
Total 248 1,019,380 100.0% 40
Candidates Votes % of total Seats won Change
Conservative 35 190,846 18.8% 5 -3
Labour 20 319,196 31.5% 2 0
Liberal Democrat 33 65,504 6.5% 0 -4
Plaid Cymru 59 211,548 20.8% 6 0
UKIP 20 132,138 13.0% 7 +7
Green 24 30,211 3.0% 0 0
Others 114 65,300 6.4% 0 0
Total 305 1,014,743 100.0% 20
Candidates Votes % of total Seats won Change
Conservative 75 406,443 20.0% 11 -3
Labour 60 673,061 33.1% 29 -1
Liberal Democrat 73 143,669 7.1% 1 -4
Plaid Cymru 99 420,922 20.7% 12 +1
UKIP 58 259,176 12.7% 7 +7
Green 60 55,413 2.7% 0 0
Others 128 75,439 3.7% 0 0
Total 553 2,034,123 100.0% 60
Total
Constituency ballot
Regional ballot

18 National Assembly for Wales Elections: 2016
The final reference table in this section looks at 2011 election results. It includes total number of candidates by party and seat distribution.
National Assembly for Wales elections: 5 May 2011
Candidates Votes % of total Seats won
Conservative 40 237,389 25.0% 6
Labour 40 401,677 42.3% 28
Liberal Democrat 40 100,259 10.6% 1
Plaid Cymru 40 182,907 19.3% 5
UKIP - - - 0
Green 1 1,514 0.2% 0
Others 16 25,507 2.7% 0
Total 177 949,253 100.0% 40
Candidates Votes % of total Seats won
Conservative 42 213,773 22.5% 8
Labour 20 349,935 36.9% 2
Liberal Democrat 25 76,349 8.0% 4
Plaid Cymru 20 169,799 17.9% 6
UKIP - * 43,256 4.6% 0
Green - * 32,649 3.4% 0
Others 115 * 63,127 6.7% 0
Total 222 948,888 100.0% 20
Candidates Votes % of total Seats won
Conservative 82 451,162 23.8% 14
Labour 60 751,612 39.6% 30
Liberal Democrat 65 176,608 9.3% 5
Plaid Cymru 60 352,706 18.6% 11
UKIP - * 43,256 2.3% 0
Green - * 34,163 1.8% 0
Others 131 * 88,634 4.7% 0
Total 399 1,898,141 100.0% 60Note: * Number of Regional UKIP and Green candidates is included in total count for others
Total
Constituency ballot
Regional ballot

19 Commons Library Briefing, 17 May 2016
5. Turnout Turnout is measured as the number of valid votes divided by the electorate.
The overall turnout across Wales in both the constituency and regional ballots was 45.4%, up by 4.0% points from 2011. The highest turnout was in Cardiff North and Brecon & Radnorshire, where 56.8% and 56.5% of the electorate cast valid ballots. The lowest turnout was in Alyn & Deeside, where 34.6% of eligible voters participated.
The region with the highest turnout was Mid and West Wales, with a turnout of 51.4% (2.8% points increase since 2011). The region with the lowest turnout was South Wales East, where turnout was 42.7% (4.2% points increase since 2011).
Constituencies within each region with the highest and lowest turnout
Region Constituency Turnout
Highest turnout
South Wales Central Cardiff North 56.8%
Mid and West Wales Brecon & Radnorshire 56.5%
North Wales Arfon 50.9%
South Wales West Gower 49.8%
South Wales East Monmouth 48.9%
Lowest turnout
South Wales Central Cynon Valley 38.2%
Mid and West Wales Dwyfor Meirionnydd 46.8%
North Wales Alyn & Deeside 34.6%
South Wales West Swansea East 35.7%
South Wales East Newport East 37.1%
Map 6: National Assembly for Wales - 2016 Turnout
Increase in turnout by region, 2011-2016
0% 1% 2% 3% 4% 5% 6% 7% 8%
Mid and West Wales
North Wales
South Wales Central
South Wales East
South Wales West
Total

20 National Assembly for Wales Elections: 2016
6. Composition of the Assembly Parties and regions A majority of constituency seats in South Wales Central, South Wales East and South Wales West regions are held by Labour Members. This party won 21 out of 23 constituency seats in these areas. The remaining two seats are held by Plaid Cymru (Rhondda) and Conservatives (Monmouth).
Constituency seats in Mid and West Wales region is more diversely distributed: both Plaid Cymru and Conservatives secured three seats each. In Lianelli and Brecon & Radnorshire constituencies Labour and Liberal Democrats had the largest majorities.
Four of constituency seats in the North Wales region are held by Labour. Conservatives and Plaid Cymru have two seats each.
Regional seats are less dominated by Labour. UKIP has the highest number of regional seats (7), followed by the Plaid Cymru (6) and Conservatives (5). Labour had gained two regional seats.
Ethnicity There are currently two known ethnic minority Assembly members2.
Mohammad Asghar was first elected for Plaid Cymru in 2007 and was re-elected for the Conservatives in 2011 and in 2016. He became the first AM to cross the floor of the Assembly in December 2009.
Vaughan Gething was elected for Labour in 2011 and was re-elected in 2016. He is the second minority ethnic candidate to be elected to the Assembly.
Gender Following the elections, the Assembly comprises 35 men and 25 women. The overall women representation have increased by one, compared to 2011. It is three fewer than in 2007 and five fewer than in the 2003, when there was an equal number of men and women elected.
2 Ethnicity of Assembly Members is not systematically recorded. It is a self-defined factor,
and information about it is only available from third-party sources.
Map 7: National Assembly for Wales – 2016 Constituency seat winners
Assembly members by gender, 1999-2016
0 10 20 30 40 50 60
2016
2011
2007
2003
1999
Women Men
21 Commons Library Briefing, 17 May 2016
7. Appendix
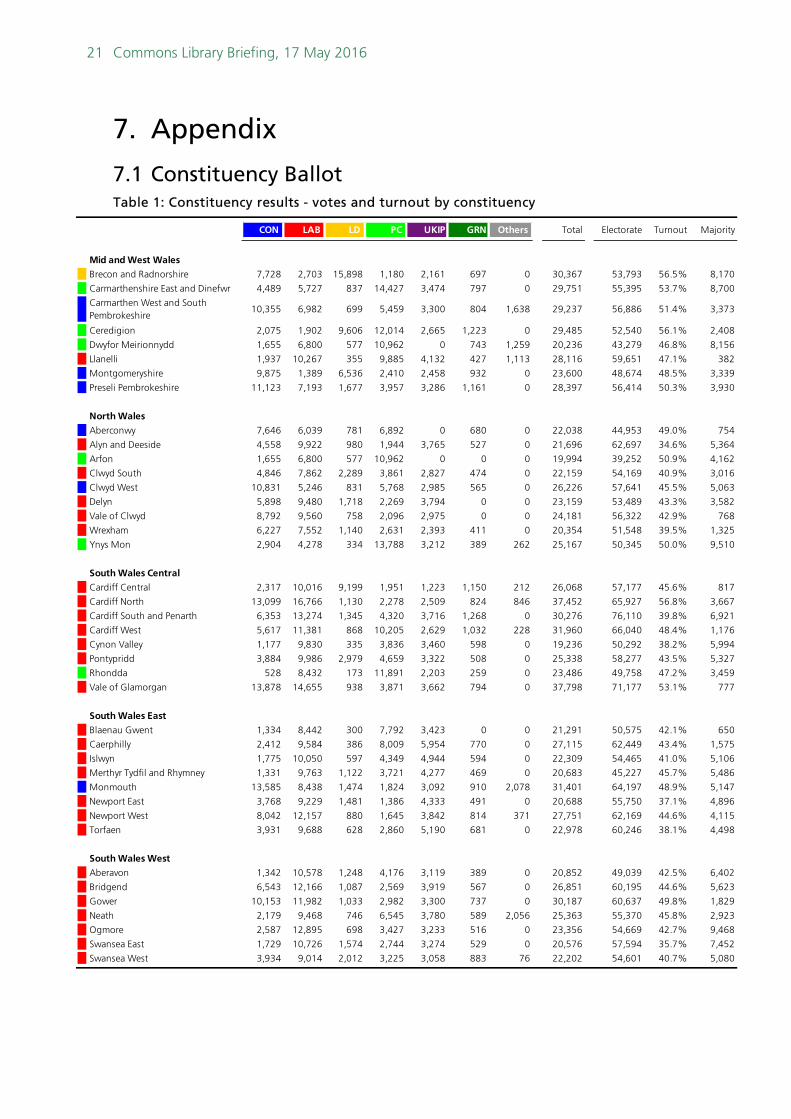
7.1 Constituency Ballot Table 1: Constituency results - votes and turnout by constituency
CON LAB LD PC UKIP GRN Others Total Electorate Turnout Majority
Mid and West Wales
Brecon and Radnorshire 7,728 2,703 15,898 1,180 2,161 697 0 30,367 53,793 56.5% 8,170
Carmarthenshire East and Dinefwr 4,489 5,727 837 14,427 3,474 797 0 29,751 55,395 53.7% 8,700
Carmarthen West and South Pembrokeshire
10,355 6,982 699 5,459 3,300 804 1,638 29,237 56,886 51.4% 3,373
Ceredigion 2,075 1,902 9,606 12,014 2,665 1,223 0 29,485 52,540 56.1% 2,408
Dwyfor Meirionnydd 1,655 6,800 577 10,962 0 743 1,259 20,236 43,279 46.8% 8,156
Llanelli 1,937 10,267 355 9,885 4,132 427 1,113 28,116 59,651 47.1% 382
Montgomeryshire 9,875 1,389 6,536 2,410 2,458 932 0 23,600 48,674 48.5% 3,339
Preseli Pembrokeshire 11,123 7,193 1,677 3,957 3,286 1,161 0 28,397 56,414 50.3% 3,930
North Wales
Aberconwy 7,646 6,039 781 6,892 0 680 0 22,038 44,953 49.0% 754
Alyn and Deeside 4,558 9,922 980 1,944 3,765 527 0 21,696 62,697 34.6% 5,364
Arfon 1,655 6,800 577 10,962 0 0 0 19,994 39,252 50.9% 4,162
Clwyd South 4,846 7,862 2,289 3,861 2,827 474 0 22,159 54,169 40.9% 3,016
Clwyd West 10,831 5,246 831 5,768 2,985 565 0 26,226 57,641 45.5% 5,063
Delyn 5,898 9,480 1,718 2,269 3,794 0 0 23,159 53,489 43.3% 3,582
Vale of Clwyd 8,792 9,560 758 2,096 2,975 0 0 24,181 56,322 42.9% 768
Wrexham 6,227 7,552 1,140 2,631 2,393 411 0 20,354 51,548 39.5% 1,325
Ynys Mon 2,904 4,278 334 13,788 3,212 389 262 25,167 50,345 50.0% 9,510
South Wales Central
Cardiff Central 2,317 10,016 9,199 1,951 1,223 1,150 212 26,068 57,177 45.6% 817
Cardiff North 13,099 16,766 1,130 2,278 2,509 824 846 37,452 65,927 56.8% 3,667
Cardiff South and Penarth 6,353 13,274 1,345 4,320 3,716 1,268 0 30,276 76,110 39.8% 6,921
Cardiff West 5,617 11,381 868 10,205 2,629 1,032 228 31,960 66,040 48.4% 1,176
Cynon Valley 1,177 9,830 335 3,836 3,460 598 0 19,236 50,292 38.2% 5,994
Pontypridd 3,884 9,986 2,979 4,659 3,322 508 0 25,338 58,277 43.5% 5,327
Rhondda 528 8,432 173 11,891 2,203 259 0 23,486 49,758 47.2% 3,459
Vale of Glamorgan 13,878 14,655 938 3,871 3,662 794 0 37,798 71,177 53.1% 777
South Wales East
Blaenau Gwent 1,334 8,442 300 7,792 3,423 0 0 21,291 50,575 42.1% 650
Caerphilly 2,412 9,584 386 8,009 5,954 770 0 27,115 62,449 43.4% 1,575
Islwyn 1,775 10,050 597 4,349 4,944 594 0 22,309 54,465 41.0% 5,106
Merthyr Tydfil and Rhymney 1,331 9,763 1,122 3,721 4,277 469 0 20,683 45,227 45.7% 5,486
Monmouth 13,585 8,438 1,474 1,824 3,092 910 2,078 31,401 64,197 48.9% 5,147
Newport East 3,768 9,229 1,481 1,386 4,333 491 0 20,688 55,750 37.1% 4,896
Newport West 8,042 12,157 880 1,645 3,842 814 371 27,751 62,169 44.6% 4,115
Torfaen 3,931 9,688 628 2,860 5,190 681 0 22,978 60,246 38.1% 4,498
South Wales West
Aberavon 1,342 10,578 1,248 4,176 3,119 389 0 20,852 49,039 42.5% 6,402
Bridgend 6,543 12,166 1,087 2,569 3,919 567 0 26,851 60,195 44.6% 5,623
Gower 10,153 11,982 1,033 2,982 3,300 737 0 30,187 60,637 49.8% 1,829
Neath 2,179 9,468 746 6,545 3,780 589 2,056 25,363 55,370 45.8% 2,923
Ogmore 2,587 12,895 698 3,427 3,233 516 0 23,356 54,669 42.7% 9,468
Swansea East 1,729 10,726 1,574 2,744 3,274 529 0 20,576 57,594 35.7% 7,452
Swansea West 3,934 9,014 2,012 3,225 3,058 883 76 22,202 54,601 40.7% 5,080

22 National Assembly for Wales Elections: 2016
Table 2: Constituency results - seats by majority (from highest to lowest percentage majority)
Elected
Constituency candidate Votes Rank % Rank
Ogmore Huw Irranca-Davies LAB PC 9,468 2 40.5% 1
Ynys Mon Rhun Ap Iorwerth PC LD 9,510 1 37.8% 2
Swansea East Mike Hedges LAB UKIP 7,452 5 36.2% 3
Cynon Valley Vikki Howells LAB PC 5,994 8 31.2% 4
Aberavon David Rees LAB PC 6,402 7 30.7% 5
Carmarthenshire East and Dinefwr
Adam Price PC LAB 8,700 3 29.2% 6
Brecon and Radnorshire Kirsty Williams LD CON 8,170 4 26.9% 7
Merthyr Tydfil and Rhymney Dawn Bowden LAB UKIP 5,486 10 26.5% 8
Alyn and Deeside Carl Sargeant LAB CON 5,364 11 24.7% 9
Newport East John Griffiths LAB UKIP 4,896 17 23.7% 10
Islwyn Rhianon Passmore LAB UKIP 5,106 14 22.9% 11
Swansea West Julie James LAB CON 5,080 15 22.9% 12
Cardiff South and Penarth Vaughan Gething LAB CON 6,921 6 22.9% 13
Pontypridd Mick Antoniw LAB PC 5,327 12 21.0% 14
Bridgend Carwyn Jones LAB CON 5,623 9 20.9% 15
Arfon Sian Gwenllian PC LD 4,162 19 20.8% 16
Dwyfor Meirionnydd Dafydd Elis-Thomas PC LD 4,162 19 20.6% 17
Torfaen Lynne Neagle LAB UKIP 4,498 18 19.6% 18
Clwyd West Darren Millar CON PC 5,063 16 19.3% 19
Monmouth Nick Ramsay CON LD 5,147 13 16.4% 20
Delyn Hannah Blythyn LAB CON 3,582 24 15.5% 21
Newport West Jayne Bryant LAB CON 4,115 21 14.8% 22
Rhondda Leanne Wood PC LD 3,459 25 14.7% 23
Montgomeryshire Russell George CON LD 3,339 27 14.1% 24
Preseli Pembrokeshire Paul Windsor Davies CON LD 3,930 22 13.8% 25
Clwyd South Ken Skates LAB CON 3,016 28 13.6% 26
Carmarthen West and South Pembrokeshire
Angela Burns CON LAB 3,373 26 11.5% 27
Neath Jeremy Miles LAB PC 2,923 29 11.5% 28
Cardiff North Julie Morgan LAB CON 3,667 23 9.8% 29
Ceredigion Elin Jones PC LD 2,408 30 8.2% 30
Wrexham Lesley Griffiths LAB CON 1,325 33 6.5% 31
Gower Rebecca Evans LAB CON 1,829 31 6.1% 32
Caerphilly Hefin David LAB PC 1,575 32 5.8% 33
Cardiff West Mark Drakeford LAB PC 1,176 34 3.7% 34
Aberconwy Janet Finch-Saunders CON PC 754 38 3.4% 35
Vale of Clwyd Ann Jones LAB CON 768 37 3.2% 36
Cardiff Central Jenny Rathbone LAB LD 817 35 3.1% 37
Blaenau Gwent Alun Davies LAB PC 650 39 3.1% 38
Vale of Glamorgan Jane Hutt LAB CON 777 36 2.1% 39
Llanelli Lee Waters LAB PC 382 40 1.4% 40
1st 2nd
Majority

23 Commons Library Briefing, 17 May 2016
Table 3: Constituency results - party share of vote by constituency, and majority
CON LAB LD PC UKIP GRN Others Total Majority
Mid and West Wales
Brecon and Radnorshire 25.4% 8.9% 52.4% 3.9% 7.1% 2.3% 0.0% 100.0% 26.9%
Carmarthenshire East and Dinefwr 15.1% 19.2% 2.8% 48.5% 11.7% 2.7% 0.0% 100.0% 29.2%
Carmarthen West and South Pembrokeshire
35.4% 23.9% 2.4% 18.7% 11.3% 2.7% 5.6% 100.0% 11.5%
Ceredigion 7.0% 6.5% 32.6% 40.7% 9.0% 4.1% 0.0% 100.0% 8.2%
Dwyfor Meirionnydd 8.2% 33.6% 2.9% 54.2% 0.0% 3.7% 6.2% 108.7% 40.3%
Llanelli 6.9% 36.5% 1.3% 35.2% 14.7% 1.5% 4.0% 100.0% 1.4%
Montgomeryshire 41.8% 5.9% 27.7% 10.2% 10.4% 3.9% 0.0% 100.0% 14.1%
Preseli Pembrokeshire 39.2% 25.3% 5.9% 13.9% 11.6% 4.1% 0.0% 100.0% 13.8%
North Wales
Aberconwy 34.7% 27.4% 3.5% 31.3% 0.0% 3.1% 0.0% 100.0% 3.4%
Alyn and Deeside 21.0% 45.7% 4.5% 9.0% 17.4% 2.4% 0.0% 100.0% 24.7%
Arfon 8.3% 34.0% 2.9% 54.8% 0.0% 0.0% 0.0% 100.0% 20.8%
Clwyd South 21.9% 35.5% 10.3% 17.4% 12.8% 2.1% 0.0% 100.0% 13.6%
Clwyd West 41.3% 20.0% 3.2% 22.0% 11.4% 2.2% 0.0% 100.0% 19.3%
Delyn 25.5% 40.9% 7.4% 9.8% 16.4% 0.0% 0.0% 100.0% 15.5%
Vale of Clwyd 36.4% 39.5% 3.1% 8.7% 12.3% 0.0% 0.0% 100.0% 3.2%
Wrexham 30.6% 37.1% 5.6% 12.9% 11.8% 2.0% 0.0% 100.0% 6.5%
Ynys Mon 11.5% 17.0% 1.3% 54.8% 12.8% 1.5% 1.0% 100.0% 37.8%
South Wales Central
Cardiff Central 8.9% 38.4% 35.3% 7.5% 4.7% 4.4% 0.8% 100.0% 3.1%
Cardiff North 35.0% 44.8% 3.0% 6.1% 6.7% 2.2% 2.3% 100.0% 9.8%
Cardiff South and Penarth 21.0% 43.8% 4.4% 14.3% 12.3% 4.2% 0.0% 100.0% 22.9%
Cardiff West 17.6% 35.6% 2.7% 31.9% 8.2% 3.2% 0.7% 100.0% 3.7%
Cynon Valley 6.1% 51.1% 1.7% 19.9% 18.0% 3.1% 0.0% 100.0% 31.2%
Pontypridd 15.3% 39.4% 11.8% 18.4% 13.1% 2.0% 0.0% 100.0% 21.0%
Rhondda 2.2% 35.9% 0.7% 50.6% 9.4% 1.1% 0.0% 100.0% 14.7%
Vale of Glamorgan 36.7% 38.8% 2.5% 10.2% 9.7% 2.1% 0.0% 100.0% 2.1%
South Wales East
Blaenau Gwent 6.3% 39.7% 1.4% 36.6% 16.1% 0.0% 0.0% 100.0% 3.1%
Caerphilly 8.9% 35.3% 1.4% 29.5% 22.0% 2.8% 0.0% 100.0% 5.8%
Islwyn 8.0% 45.0% 2.7% 19.5% 22.2% 2.7% 0.0% 100.0% 22.9%
Merthyr Tydfil and Rhymney 6.4% 47.2% 5.4% 18.0% 20.7% 2.3% 0.0% 100.0% 26.5%
Monmouth 43.3% 26.9% 4.7% 5.8% 9.8% 2.9% 6.6% 100.0% 16.4%
Newport East 18.2% 44.6% 7.2% 6.7% 20.9% 2.4% 0.0% 100.0% 23.7%
Newport West 29.0% 43.8% 3.2% 5.9% 13.8% 2.9% 1.3% 100.0% 14.8%
Torfaen 17.1% 42.2% 2.7% 12.4% 22.6% 3.0% 0.0% 100.0% 19.6%
South Wales West
Aberavon 6.4% 50.7% 6.0% 20.0% 15.0% 1.9% 0.0% 100.0% 30.7%
Bridgend 24.4% 45.3% 4.0% 9.6% 14.6% 2.1% 0.0% 100.0% 20.9%
Gower 33.6% 39.7% 3.4% 9.9% 10.9% 2.4% 0.0% 100.0% 6.1%
Neath 8.6% 37.3% 2.9% 25.8% 14.9% 2.3% 8.1% 100.0% 11.5%
Ogmore 11.1% 55.2% 3.0% 14.7% 13.8% 2.2% 0.0% 100.0% 40.5%
Swansea East 8.4% 52.1% 7.6% 13.3% 15.9% 2.6% 0.0% 100.0% 36.2%
Swansea West 17.7% 40.6% 9.1% 14.5% 13.8% 4.0% 0.3% 100.0% 22.9%

24 National Assembly for Wales Elections: 2016
Table 4: Change in share of the vote and turnout by constituency
2011 2016 Change CON LAB LD PC UKIP GRN Others
Mid and West WalesBrecon and Radnorshire 52.9% 56.5% +3.5% -7.9% -8.0% +9.3% -2.8% +7.1% +2.3% 0.0%Carmarthenshire East and Dinefwr 51.3% 53.7% +2.4% -5.2% -10.8% -2.0% +3.6% +11.7% +2.7% 0.0%Carmarthen West and South Pembrokeshire
48.2% 51.4% +3.2% -0.4% -6.6% -1.5% -11.1% +11.3% +2.7% +5.6%
Ceredigion 51.0% 56.1% +5.1% -2.4% -2.3% -2.6% -0.6% +9.0% -1.1% 0.0%Dwyfor Meirionnydd 46.4% 46.8% +0.3% -12.3% +21.0% -2.0% +7.6% 0.0% +3.7% -9.3%Llanelli 44.3% 47.1% +2.8% -4.2% -3.2% -0.8% -4.3% +14.7% +1.5% -3.7%Montgomeryshire 47.1% 48.5% +1.4% -1.9% -5.5% -5.9% -1.1% +10.4% +3.9% 0.0%Preseli Pembrokeshire 47.1% 50.3% +3.2% -3.2% -9.1% -1.8% -1.6% +11.6% +4.1% 0.0%
North WalesAberconwy 45.1% 49.0% +3.9% +0.7% +1.7% -10.6% +5.0% 0.0% +3.1% 0.0%Alyn and Deeside 36.9% 34.6% -2.3% -7.1% -6.9% -3.1% +1.4% +17.4% +2.4% -4.2%Arfon 43.0% 50.9% +8.0% -4.2% +7.8% -1.6% -1.9% 0.0% 0.0% 0.0%Clwyd South 36.8% 40.9% +4.1% -7.3% -6.9% +0.5% -1.1% +12.8% +2.1% 0.0%Clwyd West 43.4% 45.5% +2.1% -2.0% -6.4% -4.2% -1.0% +11.4% +2.2% 0.0%Delyn 43.0% 43.3% +0.3% -8.2% -5.2% -0.2% -2.8% +16.4% 0.0% 0.0%Vale of Clwyd 41.0% 42.9% +1.9% +3.0% -11.2% -1.6% -2.6% +12.3% 0.0% 0.0%Wrexham 34.9% 39.5% +4.6% +3.7% -7.7% -8.8% -1.0% +11.8% +2.0% 0.0%Ynys Mon 48.7% 50.0% +1.3% -17.7% -9.2% -1.8% +13.4% +12.8% +1.5% +1.0%
South Wales CentralCardiff Central 36.7% 45.6% +8.9% -6.2% +0.5% -2.4% +0.3% +4.7% +4.4% -1.3%Cardiff North 51.4% 56.8% +5.4% -7.4% -2.8% -1.6% +0.7% +6.7% +2.2% +2.3%Cardiff South and Penarth 36.6% 39.8% +3.2% -6.5% -6.4% -5.7% +2.2% +12.3% +4.2% 0.0%Cardiff West 43.2% 48.4% +5.2% -8.3% -11.5% -4.3% +11.9% +8.2% +3.2% +0.7%Cynon Valley 36.0% 38.2% +2.3% -2.0% -10.9% -0.9% -7.3% +18.0% +3.1% 0.0%Pontypridd 38.9% 43.5% +4.6% -0.4% -11.4% -6.1% +4.9% +13.1% +2.0% -2.1%Rhondda 38.1% 47.2% +9.1% -2.6% -27.3% -1.7% +21.1% +9.4% +1.1% 0.0%Vale of Glamorgan 46.4% 53.1% +6.7% +0.7% -8.6% -2.1% -1.9% +9.7% +2.1% 0.0%
South Wales EastBlaenau Gwent 38.0% 42.1% +4.1% +1.0% -24.3% -0.4% +31.2% +16.1% 0.0% -23.5%Caerphilly 41.2% 43.4% +2.2% -4.3% -13.6% -2.7% -0.2% +22.0% +2.8% -4.0%Islwyn 38.1% 41.0% +2.9% -4.0% -12.9% -0.4% -2.2% +22.2% +2.7% -5.3%Merthyr Tydfil and Rhymney 35.1% 45.7% +10.6% +0.1% -7.1% -7.4% +9.2% +20.7% +2.3% -17.8%Monmouth 46.3% 48.9% +2.7% -7.0% -3.0% -5.1% -1.7% +9.8% +2.9% +4.1%Newport East 35.3% 37.1% +1.8% -4.9% -6.2% -11.9% -0.3% +20.9% +2.4% 0.0%Newport West 36.4% 44.6% +8.2% -4.9% -8.4% -3.7% -1.1% +13.8% +2.9% +1.3%Torfaen 36.5% 38.1% +1.6% +2.3% -4.0% -1.1% +0.3% +22.6% +3.0% -23.0%
South Wales WestAberavon 37.2% 42.5% +5.3% -7.9% -13.4% -0.8% +5.2% +15.0% +1.9% 0.0%Bridgend 40.7% 44.6% +3.9% -3.6% -10.9% -3.2% +0.9% +14.6% +2.1% 0.0%Gower 43.2% 49.8% +6.5% +3.7% -8.4% -6.5% -2.3% +10.9% +2.4% 0.0%Neath 41.5% 45.8% +4.4% -3.1% -16.1% -1.2% -0.8% +14.9% +2.3% +3.9%Ogmore 36.5% 42.7% +6.2% -3.5% -8.7% -1.9% -2.0% +13.8% +2.2% 0.0%Swansea East 31.4% 35.7% +4.3% -6.2% -6.2% -1.2% +0.9% +15.9% +2.6% -5.8%Swansea West 35.0% 40.7% +5.7% -6.3% -4.7% -7.7% +0.6% +13.8% +4.0% +0.3%
Turnout Change in share of vote 2011-2016

25 Commons Library Briefing, 17 May 2016
Table 5: Constituency results - votes and shares by region and party
Table 6: Constituency ballot results - change in share of the vote by region
Table 7: Difference in turnout and party share of vote between constituency and regional ballots by region
CON LAB LD PC UKIP GRN Others Total Electorate Turnout
Mid and West Wales 50,742 38,606 36,524 58,898 23,625 6,784 4,010 219,189 426,632 51.4%North Wales 53,357 66,739 9,408 50,211 21,951 3,046 262 204,974 470,416 43.6%South Wales Central 46,853 94,340 16,967 43,011 22,724 6,433 1,286 231,614 494,758 46.8%South Wales East 36,178 77,351 6,868 31,586 35,055 4,729 2,449 194,216 455,078 42.7%South Wales West 28,467 76,829 8,398 25,668 23,683 4,210 2,132 169,387 392,105 43.2%All regions 215,597 353,865 78,165 209,374 127,038 25,202 10,139 1,019,380 2,238,989 45.5%
Mid and West Wales 23.1% 17.6% 16.7% 26.9% 10.8% 3.1% 1.8% 100.0%North Wales 26.0% 32.6% 4.6% 24.5% 10.7% 1.5% 0.1% 100.0%South Wales Central 20.2% 40.7% 7.3% 18.6% 9.8% 2.8% 0.6% 100.0%South Wales East 18.6% 39.8% 3.5% 16.3% 18.0% 2.4% 1.3% 100.0%South Wales West 16.8% 45.4% 5.0% 15.2% 14.0% 2.5% 1.3% 100.0%All regions 21.1% 34.7% 7.7% 20.5% 12.5% 2.5% 1.0% 100.0%
CON LAB LD PC UKIP GRN Others Total
Mid and West Wales -3.8% -5.8% -0.6% -2.4% +10.8% +2.4% -0.7% 0.0%
North Wales -4.6% -5.4% -3.4% +1.6% +10.7% +1.5% 0.0% 0.4%
South Wales Central -4.2% -9.2% -3.2% +3.9% +9.8% +2.8% 0.0% -0.1%
South Wales East -2.9% -9.5% -4.0% +3.6% +18.0% +2.4% -4.2% 3.5%
South Wales West -3.3% -9.7% -3.4% +0.1% +14.0% +2.5% 0.0% 0.1%
All regions -3.9% -7.6% -2.9% +1.3% +12.5% +2.3% 0.0% 1.7%
CON LAB LD PC UKIP GRN Others Turnout
Mid and West Wales +2.6% -1.8% +5.8% +0.6% -0.8% -0.7% -5.5% +0.8%North Wales +3.8% +4.4% +0.0% +1.2% -1.8% -0.9% -6.8% +0.1%South Wales Central +2.0% +6.8% +0.9% -2.4% -0.6% -0.7% -6.1% +0.1%South Wales East +1.5% +1.5% +0.0% +1.0% +0.3% -0.1% -4.2% +0.0%South Wales West +1.8% +5.8% -1.5% -2.0% +0.3% -0.1% -4.3% +0.1%All regions +2.3% +3.3% +1.2% -0.3% -0.6% -0.5% -5.4% +0.2%

26 National Assembly for Wales Elections: 2016
Table 8: Constituency results - party share of vote by constituency
CON LAB LD PC UKIP GRN Others Total
Mid and West Wales
Brecon and Radnorshire 25.4% 14.8% 30.2% 7.3% 8.8% 3.8% 9.7% 100.0%
Carmarthenshire East and Dinefwr 14.5% 20.0% 3.1% 43.2% 11.4% 2.7% 5.1% 100.0%
Carmarthen West and South Pembrokeshire 28.5% 24.2% 2.9% 21.0% 13.0% 3.0% 7.5% 100.0%
Ceredigion 9.9% 10.2% 20.4% 37.2% 10.3% 6.2% 5.8% 100.0%
Dwyfor Meirionnydd 16.6% 13.7% 3.6% 44.5% 11.4% 3.8% 6.3% 100.0%
Llanelli 8.0% 37.4% 1.1% 30.8% 14.2% 1.9% 6.6% 100.0%
Montgomeryshire 32.0% 8.9% 20.2% 12.2% 11.6% 5.1% 10.1% 100.0%
Preseli Pembrokeshire 31.1% 23.7% 4.1% 17.0% 12.1% 4.3% 7.7% 100.0%
North Wales
Aberconwy 26.3% 22.5% 3.8% 27.2% 10.6% 2.5% 7.1% 100.0%
Alyn and Deeside 22.1% 38.7% 3.3% 9.2% 16.1% 2.1% 8.5% 100.0%
Arfon 6.9% 24.2% 2.9% 50.3% 6.9% 3.5% 5.3% 100.0%
Clwyd South 20.2% 31.3% 8.9% 18.6% 12.7% 2.4% 5.9% 100.0%
Clwyd West 32.2% 19.9% 3.7% 23.1% 12.4% 2.2% 6.4% 100.0%
Delyn 23.3% 34.6% 6.0% 11.6% 14.7% 1.8% 8.0% 100.0%
Vale of Clwyd 29.2% 33.2% 2.3% 13.1% 12.5% 1.7% 7.9% 100.0%
Wrexham 23.4% 32.6% 8.5% 13.1% 12.1% 3.0% 7.3% 100.0%
Ynys Mon 13.7% 18.4% 2.3% 44.0% 13.7% 2.3% 5.7% 100.0%
South Wales Central
Cardiff Central 10.2% 33.1% 28.2% 10.9% 5.9% 5.9% 5.8% 100.0%
Cardiff North 29.4% 34.2% 5.0% 12.6% 8.6% 3.1% 7.2% 100.0%
Cardiff South and Penarth 19.0% 37.3% 4.6% 14.9% 12.1% 4.9% 7.2% 100.0%
Cardiff West 16.4% 29.9% 3.8% 30.6% 8.5% 4.3% 6.4% 100.0%
Cynon Valley 6.4% 43.1% 2.0% 23.9% 16.2% 2.2% 6.1% 100.0%
Pontypridd 13.8% 35.4% 5.3% 22.1% 13.6% 2.6% 7.3% 100.0%
Rhondda 2.5% 32.3% 1.2% 48.1% 10.1% 1.5% 4.4% 100.0%
Vale of Glamorgan 32.8% 30.1% 2.8% 13.3% 10.5% 2.6% 7.9% 100.0%
South Wales East
Blaenau Gwent 5.4% 38.8% 1.5% 31.5% 15.8% 1.6% 5.3% 100.0%
Caerphilly 10.1% 34.7% 1.9% 25.9% 20.5% 2.4% 4.5% 100.0%
Islwyn 8.3% 44.5% 2.3% 16.7% 21.0% 2.0% 5.2% 100.0%
Merthyr Tydfil and Rhymney 6.5% 46.7% 3.3% 16.4% 20.4% 2.0% 4.7% 100.0%
Monmouth 37.2% 25.6% 6.0% 8.5% 11.8% 3.9% 7.1% 100.0%
Newport East 19.0% 40.6% 5.9% 7.7% 19.7% 2.2% 5.0% 100.0%
Newport West 26.1% 41.5% 3.6% 6.0% 14.8% 2.8% 5.2% 100.0%
Torfaen 15.1% 40.2% 2.8% 12.6% 21.0% 2.3% 5.9% 100.0%
South Wales West
Aberavon 6.2% 45.9% 5.4% 21.3% 14.5% 1.8% 4.9% 100.0%
Bridgend 22.6% 36.3% 5.7% 12.6% 14.2% 2.7% 6.0% 100.0%
Gower 27.2% 34.2% 5.8% 13.4% 10.4% 2.6% 6.5% 100.0%
Neath 8.2% 37.8% 4.1% 26.6% 15.1% 2.7% 5.5% 100.0%
Ogmore 10.3% 47.9% 3.6% 17.6% 13.9% 2.0% 4.7% 100.0%
Swansea East 9.1% 42.4% 10.9% 14.9% 15.7% 2.3% 4.6% 100.0%
Swansea West 15.8% 35.4% 10.9% 14.9% 12.9% 4.2% 6.0% 100.0%

27 Commons Library Briefing, 17 May 2016
Table 9: Largest and smallest constituency majorities by party
Table 10: Constituencies with highest and lowest turnout in each region
Constituency Absolute majority
Largest
Conservative Monmouth 5,147
Labour Ogmore 9,468
Liberal Democrat Brecon and Radnorshire 8,170
Plaid Cymru Ynys Mon 9,510
Smallest
Conservative Aberconwy 754
Labour Llanelli 382
Liberal Democrat Brecon and Radnorshire 8,170
Plaid Cymru Ceredigion 2,408
Constituency Percentage
majority
Largest
Conservative Monmouth 16.4%
Labour Ogmore 40.5%
Liberal Democrat Brecon and Radnorshire 26.9%
Plaid Cymru Ynys Mon 37.8%
Smallest
Conservative Aberconwy 3.4%
Labour Llanelli 1.4%
Liberal Democrat Brecon and Radnorshire 26.9%
Plaid Cymru Ceredigion 8.2%
Region Constituency Turnout
Highest turnout
Mid and West Wales Brecon & Radnorshire 56.5%
North Wales Arfon 50.9%
South Wales Central Cardiff North 56.8%
South Wales East Monmouth 48.9%
South Wales West Gower 49.8%
Lowest Turnout
Mid and West Wales Dwyfor Meirionnydd 46.8%
North Wales Alyn & Deeside 34.6%
South Wales Central Cynon Valley 38.2%
South Wales East Newport East 37.1%
South Wales West Swansea East 35.7%

28 National Assembly for Wales Elections: 2016
Table 11: Highest and lowest shares of constituency vote
Highest Lowest
CON Monmouth 43.3% Merthyr Tydfil & Rhymney 6.4%
Montgomeryshire 41.8% Blaenau Gwent 6.3%
Clwyd West 41.3% Cynon Valley 6.1%
Preseli Pembrokeshire 39.2% Rhondda 2.2%
LAB Ogmore 55.2% Ynys Mon 17.0%
Swansea East 52.1% Brecon & Radnorshire 8.9%
Cynon Valley 51.1% Ceredigion 6.5%
Aberavon 50.7% Montgomeryshire 5.9%
LD Brecon & Radnorshire 52.4% Blaenau Gwent 1.4%
Cardiff Central 35.3% Ynys Mon 1.3%
Ceredigion 32.6% Llanelli 1.3%
Montgomeryshire 27.7% Rhondda 0.7%
PC Arfon 54.8% Cardiff North 6.1%
Ynys Mon 54.8% Newport West 5.9%
Dwyfor Meirionnydd 54.2% Monmouth 5.8%
Rhondda 50.6% Brecon & Radnorshire 3.9%
UKIP Torfaen 22.6% Cardiff West 8.2%
Islwyn 22.2% Brecon & Radnorshire 7.1%
Caerphilly 22.0% Cardiff North 6.7%
Newport East 20.9% Cardiff Central 4.7%
GRN Cardiff Central 4.4% Aberavon 1.9%
Cardiff South & Penarth 4.2% Ynys Mon 1.5%
Ceredigion 4.1% Llanelli 1.5%
Preseli Pembrokeshire 4.1% Rhondda 1.1%

29 Commons Library Briefing, 17 May 2016
7.2 Regional ballot Table 12: Regional results - votes and turnout by constituency
CON LAB LD PC UKIP GRN Others Total Electorate Turnout
Mid and West Wales
Brecon and Radnorshire 7,625 4,446 9,069 2,181 2,655 1,145 2,909 30,030 53,793 55.8%
Carmarthenshire East and Dinefwr 4,288 5,930 919 12,825 3,393 787 1,521 29,663 55,395 53.5%Carmarthen West and South Pembrokeshire
8,035 6,805 808 5,902 3,657 837 2,122 28,166 56,886 49.5%
Ceredigion 2,834 2,916 5,858 10,692 2,973 1,793 1,662 28,728 52,540 54.7%
Dwyfor Meirionnydd 3,332 2,759 730 8,949 2,299 772 1,274 20,115 43,279 46.5%
Llanelli 2,257 10,492 297 8,648 3,996 521 1,863 28,074 59,651 47.1%
Montgomeryshire 7,483 2,080 4,742 2,856 2,718 1,185 2,355 23,419 48,674 48.1%
Preseli Pembrokeshire 8,607 6,547 1,131 4,701 3,351 1,182 2,126 27,645 56,414 49.0%
North Wales
Aberconwy 5,808 4,961 847 5,994 2,343 547 1,567 22,067 44,953 49.1%
Alyn and Deeside 4,797 8,413 719 2,006 3,496 447 1,857 21,735 62,697 34.7%
Arfon 1,369 4,831 582 10,028 1,376 706 1,056 19,948 39,252 50.8%
Clwyd South 4,472 6,915 1,969 4,106 2,802 520 1,310 22,094 54,169 40.8%
Clwyd West 8,422 5,213 969 6,048 3,232 579 1,685 26,148 57,641 45.4%
Delyn 5,399 8,004 1,390 2,681 3,403 417 1,864 23,158 53,489 43.3%
Vale of Clwyd 7,024 7,986 562 3,157 2,991 397 1,905 24,022 56,322 42.7%
Wrexham 4,747 6,607 1,729 2,666 2,458 599 1,480 20,286 51,548 39.4%
Ynys Mon 3,430 4,598 578 11,015 3,417 577 1,417 25,032 50,345 49.7%
South Wales Central
Cardiff Central 2,642 8,595 7,337 2,831 1,526 1,536 1,518 25,985 57,177 45.4%
Cardiff North 10,964 12,754 1,852 4,714 3,196 1,156 2,693 37,329 65,927 56.6%
Cardiff South and Penarth 5,739 11,264 1,396 4,505 3,671 1,491 2,166 30,232 76,110 39.7%
Cardiff West 5,205 9,521 1,222 9,741 2,698 1,375 2,030 31,792 66,040 48.1%
Cynon Valley 1,227 8,295 385 4,601 3,120 426 1,177 19,231 50,292 38.2%
Pontypridd 3,488 8,973 1,335 5,609 3,437 650 1,839 25,331 58,277 43.5%
Rhondda 582 7,623 278 11,354 2,377 346 1,039 23,599 49,758 47.4%
Vale of Glamorgan 12,338 11,341 1,070 5,002 3,933 969 2,981 37,634 71,177 52.9%
South Wales East
Blaenau Gwent 1,158 8,260 328 6,716 3,373 344 1,120 21,299 50,575 42.1%
Caerphilly 2,728 9,416 526 7,013 5,555 651 1,222 27,111 62,449 43.4%
Islwyn 1,853 9,935 512 3,740 4,683 449 1,165 22,337 54,465 41.0%
Merthyr Tydfil and Rhymney 1,340 9,666 692 3,399 4,230 404 968 20,699 45,227 45.8%
Monmouth 11,604 7,998 1,872 2,646 3,668 1,202 2,212 31,202 64,197 48.6%
Newport East 3,919 8,392 1,213 1,589 4,081 451 1,034 20,679 55,750 37.1%
Newport West 7,228 11,493 985 1,669 4,092 788 1,440 27,695 62,169 44.5%
Torfaen 3,488 9,264 656 2,914 4,842 542 1,363 23,069 60,246 38.3%
South Wales West
Aberavon 1,298 9,556 1,128 4,446 3,019 370 1,022 20,839 49,039 42.5%
Bridgend 6,043 9,724 1,519 3,375 3,804 712 1,618 26,795 60,195 44.5%
Gower 8,220 10,310 1,738 4,044 3,128 799 1,951 30,190 60,637 49.8%
Neath 2,067 9,570 1,040 6,736 3,810 682 1,402 25,307 55,370 45.7%
Ogmore 2,409 11,171 848 4,097 3,246 455 1,090 23,316 54,669 42.6%
Swansea East 1,866 8,724 2,248 3,056 3,236 471 953 20,554 57,594 35.7%
Swansea West 3,511 7,848 2,425 3,296 2,853 931 1,324 22,188 54,601 40.6%

30 National Assembly for Wales Elections: 2016
Table 13: Regional results - change in party share of vote and turnout by constituency
2011 2016 Change CON LAB LD PC UKIP GRN Others
Mid and West WalesBrecon and Radnorshire 52.8% 55.8% +3.0% -7.1% -3.2% +0.9% -0.1% +4.0% -0.6% +6.0%Carmarthenshire East and Dinefwr 51.3% 53.5% +2.2% -3.3% -6.7% -0.8% +3.3% +7.6% -1.3% +1.1%Carmarthen West and South Pembrokeshire
48.2% 49.5% +1.3% -3.8% -3.4% -1.0% -3.8% +8.9% -0.1% +3.3%
Ceredigion 51.0% 54.7% +3.7% -2.9% -0.3% -6.4% +0.7% +6.7% -0.0% +2.3%Dwyfor Meirionnydd 46.5% 46.5% -0.0% -5.9% -1.0% -1.1% -1.1% +7.6% -0.6% +2.1%Llanelli 44.3% 47.1% +2.8% -3.6% -1.4% -1.6% -3.9% +10.3% -0.4% +0.6%Montgomeryshire 47.1% 48.1% +1.1% -5.1% -2.0% -3.8% -0.3% +4.6% +0.6% +6.0%Preseli Pembrokeshire 47.2% 49.0% +1.8% -4.7% -6.9% -1.3% +1.5% +7.9% +0.3% +3.1%
North WalesAberconwy 45.1% 49.1% +4.0% -4.0% -1.7% -4.3% +2.8% +5.9% +0.1% +1.2%Alyn and Deeside 36.9% 34.7% -2.2% -4.4% -4.1% -2.4% +0.3% +10.1% -0.1% +0.6%Arfon 43.0% 50.8% +7.8% -4.4% -0.2% -0.8% +2.8% +4.0% -0.9% -0.4%Clwyd South 36.8% 40.8% +4.0% -4.0% -6.2% +0.9% +1.5% +8.4% -0.1% -0.5%Clwyd West 43.4% 45.4% +1.9% -4.3% -3.2% -1.7% +0.4% +7.6% +0.3% +0.9%Delyn 42.8% 43.3% +0.5% -6.2% -3.0% -0.1% -1.6% +9.3% -0.1% +1.7%Vale of Clwyd 40.8% 42.7% +1.8% -0.6% -6.6% -1.4% +0.0% +7.2% +0.0% +1.4%Wrexham 34.9% 39.4% +4.4% -0.4% -4.6% -2.9% -0.0% +7.7% +0.9% -0.6%Ynys Mon 48.7% 49.7% +1.1% -10.7% -4.7% +0.0% +8.2% +7.7% +0.3% -0.7%
South Wales CentralCardiff Central 36.8% 45.4% +8.6% -5.9% +0.3% +2.4% +3.6% +2.5% -3.2% +0.4%Cardiff North 51.4% 56.6% +5.2% -6.9% -3.2% -1.0% +4.4% +4.6% -0.6% +2.8%Cardiff South and Penarth 36.9% 39.7% +2.8% -4.3% -4.1% -2.7% +4.2% +7.4% -1.0% +0.5%Cardiff West 43.2% 48.1% +4.9% -5.9% -7.6% -1.6% +14.1% +4.4% -4.2% +0.8%Cynon Valley 35.0% 38.2% +3.3% -1.2% -10.3% -0.8% +0.6% +15.8% -1.1% -3.1%Pontypridd 38.9% 43.5% +4.6% -0.4% -9.8% -5.2% +8.5% +8.6% -1.5% -0.1%Rhondda 38.1% 47.4% +9.4% -1.8% -22.3% -1.0% +23.6% +6.7% -1.0% -4.1%Vale of Glamorgan 46.3% 52.9% +6.5% -1.1% -5.3% -1.3% +0.9% +5.1% -1.2% +3.0%
South Wales EastBlaenau Gwent 37.6% 42.1% +4.5% -1.6% -24.0% -1.7% +22.2% +10.8% -0.6% -5.2%Caerphilly 41.2% 43.4% +2.2% -1.7% -9.3% -1.6% -0.4% +16.6% +0.2% -3.8%Islwyn 38.1% 41.0% +2.9% -2.0% -7.1% -0.8% -0.6% +15.7% -0.1% -5.0%Merthyr Tydfil and Rhymney 35.1% 45.8% +10.7% -1.6% -9.2% -3.8% +4.2% +16.0% -0.4% -5.3%Monmouth 46.4% 48.6% +2.2% -5.1% -1.5% -1.8% +2.2% +6.6% -0.4% +0.1%Newport East 35.6% 37.1% +1.5% -2.6% -3.8% -6.4% +1.5% +13.8% +0.3% -2.9%Newport West 36.8% 44.5% +7.8% -3.0% -0.5% -2.1% -0.6% +8.9% -0.1% -2.6%Torfaen 36.5% 38.3% +1.8% -1.2% -7.7% -2.3% +0.9% +14.3% -0.4% -3.6%
South Wales WestAberavon 36.8% 42.5% +5.7% -4.7% -11.3% +0.8% +8.5% +10.6% -0.0% -3.9%Bridgend 40.4% 44.5% +4.1% -3.4% -6.2% -0.8% +3.0% +9.2% +0.3% -2.3%Gower 43.3% 49.8% +6.5% -0.7% -4.0% -1.8% +0.8% +6.1% -0.6% +0.2%Neath 41.6% 45.7% +4.1% -2.6% -10.3% +0.1% +2.7% +11.4% +0.8% -2.1%Ogmore 36.3% 42.6% +6.3% -1.9% -6.2% -0.2% +4.0% +9.6% +0.0% -5.5%Swansea East 31.6% 35.7% +4.1% -2.5% -9.6% +2.7% +3.5% +11.2% +0.2% -5.6%Swansea West 35.2% 40.6% +5.5% -4.8% -3.0% -2.6% +3.0% +8.4% -0.1% -0.9%0 0%
Turnout Change in share of vote 2011-2016

31 Commons Library Briefing, 17 May 2016
Table 14: Regional ballot results - votes and turnout by party and region
Table 15: Regional ballot results - party share of vote by party and region
Table 16: Regional ballot results - change in share of the vote by region
CON LAB LD PC UKIP GRN Others Total Electorate Turnout
Mid and West Wales 44,461 41,975 23,554 56,754 25,042 8,222 15,832 215,840 426,632 50.6%North Wales 45,468 57,528 9,345 47,701 25,518 4,789 14,141 204,490 470,416 43.5%South Wales Central 42,185 78,366 14,875 48,357 23,958 7,949 15,443 231,133 494,758 46.7%South Wales East 33,318 74,424 6,784 29,686 34,524 4,831 10,524 194,091 455,078 42.7%South Wales West 25,414 66,903 10,946 29,050 23,096 4,420 9,360 169,189 392,105 43.1%All regions 190,846 319,196 65,504 211,548 132,138 30,211 65,300 1,014,743 2,238,989 45.3%
CON LAB LD PC UKIP GRN Others Total
Mid and West Wales 20.6% 19.4% 10.9% 26.3% 11.6% 3.8% 7.3% 100.0%
North Wales 22.2% 28.1% 4.6% 23.3% 12.5% 2.3% 6.9% 100.0%
South Wales Central 18.3% 33.9% 6.4% 20.9% 10.4% 3.4% 6.7% 100.0%
South Wales East 17.2% 38.3% 3.5% 15.3% 17.8% 2.5% 5.4% 100.0%
South Wales West 15.0% 39.5% 6.5% 17.2% 13.7% 2.6% 5.5% 100.0%
All regions 18.8% 31.5% 6.5% 20.8% 13.0% 3.0% 6.4% 100.0%
CON LAB LD PC UKIP GRN Others Total
Mid and West Wales -4.6% -3.1% -1.9% -0.5% +7.2% -0.3% +3.1% 0.0%
North Wales -4.6% -4.0% -1.3% +1.9% +7.5% +0.1% 0.0% -0.4%
South Wales Central -3.7% -7.1% -1.5% +7.2% +6.4% -1.7% +1.2% 0.8%
South Wales East -2.4% -7.3% -2.5% +3.2% +12.5% -0.2% +0.6% 3.9%
South Wales West -2.8% -6.9% -0.5% +3.4% +9.4% +0.1% -0.4% 2.2%
All regions -3.7% -5.4% -1.6% +3.0% +8.5% -0.5% -0.5% -0.3%

32 National Assembly for Wales Elections: 2016
7.3 Assembly Members elected Table 17: Seats won by seat type, party and region
Mid & West North South Wales South Wales South Wales Total
Wales Wales Central East WestConstituency seats
Conservative 3 2 0 1 0 6
Labour 1 5 7 7 7 27
Liberal Democrat 1 0 0 0 0 1
Plaid Cymru 3 2 1 0 0 6
UK Independence Party 0 0 0 0 0 0
Green 0 0 0 0 0 0
Independent 0 0 0 0 0 0
All parties 8 9 8 8 7 40
Regional seats
Conservative 0 1 2 1 1 5
Labour 2 0 0 0 0 2
Liberal Democrat 0 0 0 0 0 0
Plaid Cymru 1 1 1 1 2 6
UK Independence Party 1 2 1 2 1 7
Green 0 0 0 0 0 0
Independent 0 0 0 0 0 0
All parties 4 4 4 4 4 20
All seats
Conservative 3 3 2 2 1 11
Labour 3 5 7 7 7 29
Liberal Democrat 1 0 0 0 0 1
Plaid Cymru 4 3 2 1 2 12
UK Independence Party 1 2 1 2 1 7
Green 0 0 0 0 0 0
Independent 0 0 0 0 0 0
All parties 12 13 12 12 11 60
Region

33 Commons Library Briefing, 17 May 2016
Table 18a: Assembly Members elected, May 2016
* Assembly Member immediately prior to 2016 election. Of the 60 AMs elected 37 had been members
Constituency Elected Member Party
Mid and West Wales
Brecon and Radnorshire * Kirsty Williams LD
Carmarthenshire East and Dinefwr Adam Price PC
Carmarthen West and South Pembrokeshire * Angela Burns CON
Ceredigion * Elin Jones PC
Dwyfor Meirionnydd * Dafydd Elis-Thomas PC
Llanelli Lee Waters LAB
Montgomeryshire * Russell George CON
Preseli Pembrokeshire * Paul Windsor Davies CON
North Wales
Aberconwy * Janet Finch-Saunders CON
Alyn and Deeside * Carl Sargeant LAB
Arfon Sian Gwenllian PC
Clwyd South * Ken Skates LAB
Clwyd West * Darren Millar CON
Delyn Hannah Blythyn LAB
Vale of Clwyd * Ann Jones LAB
Wrexham * Lesley Griffiths LAB
Ynys Mon * Rhun Ap Iorwerth PC
South Wales Central
Cardiff Central * Jenny Rathbone LAB
Cardiff North * Julie Morgan LAB
Cardiff South and Penarth * Vaughan Gething LAB
Cardiff West * Mark Drakeford LAB
Cynon Valley Vikki Howells LAB
Pontypridd * Mick Antoniw LAB
Rhondda * Leanne Wood PC
Vale of Glamorgan * Jane Hutt LAB
South Wales East
Blaenau Gwent * Alun Davies LAB
Caerphilly Hefin David LAB
Islwyn Rhianon Passmore LAB
Merthyr Tydfil and Rhymney Dawn Bowden LAB
Monmouth * Nick Ramsay CON
Newport East * John Griffiths LAB
Newport West Jayne Bryant LAB
Torfaen * Lynne Neagle LAB
South Wales West
Aberavon * David Rees LAB
Bridgend * Carwyn Jones LAB
Gower * Rebecca Evans LAB
Neath Jeremy Miles LAB
Ogmore Huw Irranca-Davies LAB
Swansea East * Mike Hedges LAB
Swansea West * Julie James LAB

34 National Assembly for Wales Elections: 2016
Table 18b: Assembly Members elected, May 2016
* Assembly Member immediately prior to 2016 election. Of the 60 AMs elected 37 had been members
Regional List Elected Member Party
Mid and West Wales Neil Hamilton UKIP
Mid and West Wales * Joyce Watson LAB
Mid and West Wales * Simon Thomas PC
Mid and West Wales Eluned Morgan LAB
North Wales * Mark Isherwood Con
North Wales Llyr Gryffudd PC
North Wales Nathan Gill Ukip
North Wales Michelle Brown Ukip
South Wales Central * David Melding Con
South Wales Central * Andrew Davies Con
South Wales Central Gareth Bennett UKIP
South Wales Central Neil McEvoy PC
South Wales East Mark Reckless UKIP
South Wales East David Rowlands UKIP
South Wales East * Mohammed Asghar Con
South Wales East Steffan Lewis PC
South Wales West * Suzy Davies Con
South Wales West * Bethan Jenkins PC
South Wales West Caroline Jones UKIP
South Wales West David Rhys Lloyd PC

BRIEFING PAPER Number CBP 7594 17 May 2016
About the Library The House of Commons Library research service provides MPs and their staff with the impartial briefing and evidence base they need to do their work in scrutinising Government, proposing legislation, and supporting constituents.
As well as providing MPs with a confidential service we publish open briefing papers, which are available on the Parliament website.
Every effort is made to ensure that the information contained in these publicly available research briefings is correct at the time of publication. Readers should be aware however that briefings are not necessarily updated or otherwise amended to reflect subsequent changes.
If you have any comments on our briefings please email [email protected]. Authors are available to discuss the content of this briefing only with Members and their staff.
If you have any general questions about the work of the House of Commons you can email [email protected].
Disclaimer This information is provided to Members of Parliament in support of their parliamentary duties. It is a general briefing only and should not be relied on as a substitute for specific advice. The House of Commons or the author(s) shall not be liable for any errors or omissions, or for any loss or damage of any kind arising from its use, and may remove, vary or amend any information at any time without prior notice.
The House of Commons accepts no responsibility for any references or links to, or the content of, information maintained by third parties. This information is provided subject to the conditions of the Open Parliament Licence.