(c) 2000,2001, 2002 claudia garcia - szekely 1 gdp recession?
TRANSCRIPT
(c) 2000,2001, 2002 Claudia Garcia - Szekely 1
GDP Recession?
(c) 2000,2001, 2002 Claudia Garcia - Szekely©2001Claudia
Garcia-Szekely 2
Price Index
A price index is a number that represents overall prices for a given period of time –say a year-.

(c) 2000,2001, 2002 Claudia Garcia - Szekely 3
Measuring Inflation:The Consumer Price Index
Claudia Garcia-Szekely

(c) 2000,2001, 2002 Claudia Garcia - Szekely 4
The CPI relevant to consumers and workers
Determines how much consumers pay for goods and services. Principal source of information for trends in consumer prices
and inflation. It is one of the most important indicators of inflation. High inflation
equals high interest rates. Low inflation allows interest rates to fall. Helps set labor contracts and government policy. Influences quality of life for retirees. Landlords use it to determine future increases in rents. Judges use it to determine alimony and child support
payments. Used to adjust payments to:
Social Security recipients (50 million) Federal and Military retirees Food Stamps and School Lunches (25 million)
Used to adjust individual income tax brackets.

(c) 2000,2001, 2002 Claudia Garcia - Szekely 5
The Consumer Price Index CPI
The CPI is a measure average change in retail prices over time for a basket of goods and services.
200 categories of goods and services divided into eight groups and weighted by importance.

(c) 2000,2001, 2002 Claudia Garcia - Szekely 6
Current Market Basket•Weights determined by survey about actual purchases in 2003 and 2004. Weights are revised every two years to adjust for changing tastes and priorities.
•In each year, more than 5,000 families from around the country provided information on their spending habits in a series of quarterly interviews.
•To collect information on frequently purchased items such as food and personal care products, another 5,000 families in each of the 3 years kept diaries listing everything they bought during a 2-week period.
(c) 2000,2001, 2002 Claudia Garcia - Szekely 7
Updating the Market Basket CPI revisions occur approximately
every 10 years. The most important revision is the
introduction of a new “market basket”
The last revision to the CPI started in 1998 and completed in 2000.

(c) 2000,2001, 2002 Claudia Garcia - Szekely 8
The CPI1. Fix the basket:
select the most commonly purchased items by conducting surveys.
3 trips
1 computer
5 Doctor visits
2 tuitions
(c) 2000,2001, 2002 Claudia Garcia - Szekely 9
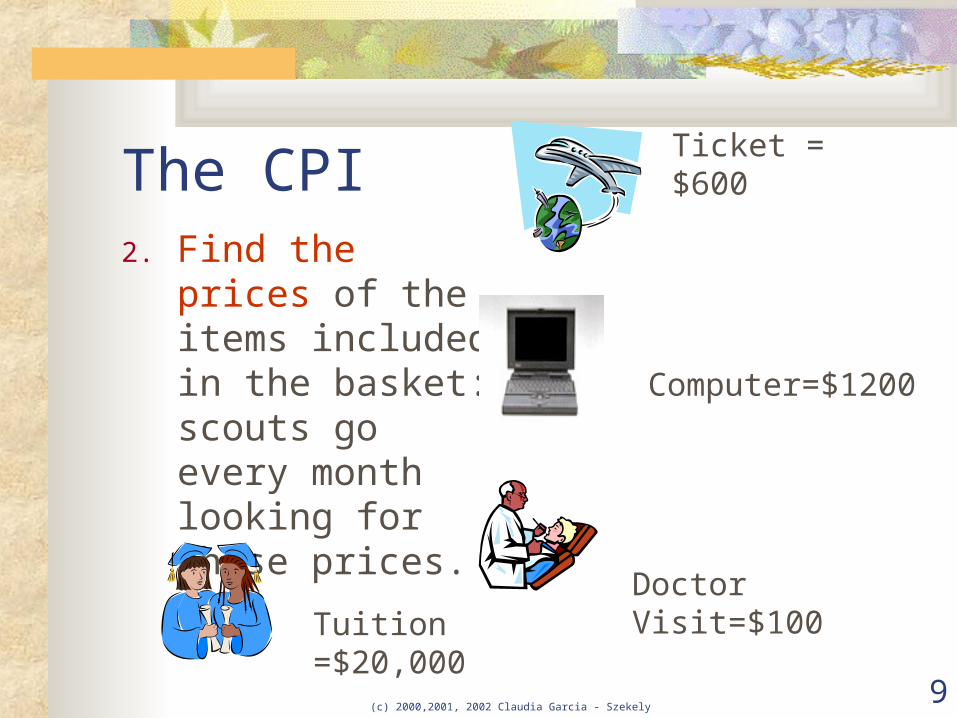
The CPI2. Find the prices of
the items included in the basket: scouts go every month looking for these prices.
Ticket = $600
Doctor Visit=$100Tuition
=$20,000
Computer=$1200
(c) 2000,2001, 2002 Claudia Garcia - Szekely 10
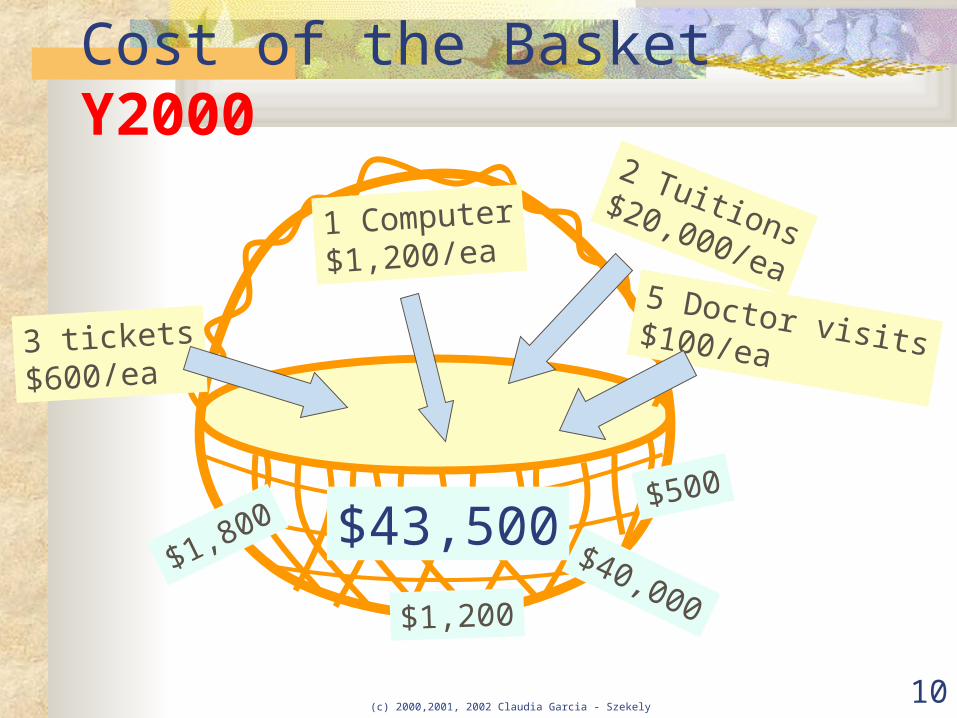
3 tickets$600/ea
1 Computer
$1,200/ea
5 Doctor visits$100/ea
2 Tuitions$20,000/ea
Cost of the Basket Y2000
$43,500$1,800
$1,200
$500
$40,000

(c) 2000,2001, 2002 Claudia Garcia - Szekely 11
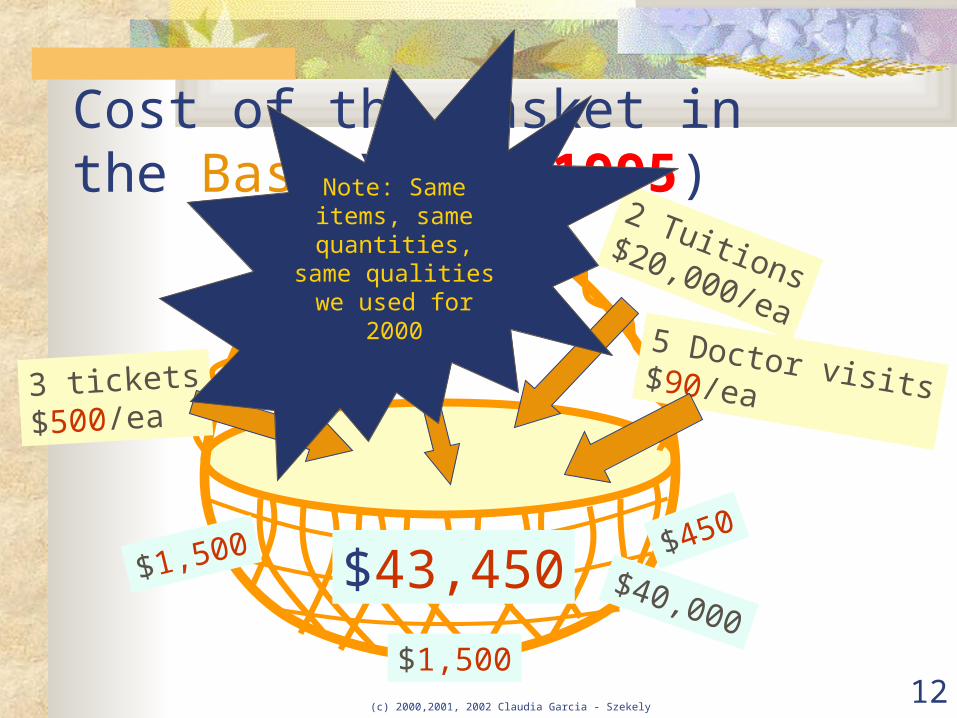
The CPI4. Choose a base year
-the benchmark for comparison- and compute the cost of the basket in the base year…Say 1995
Ticket Price in 1995 = $500
Doctor Visit in 1995 =$90Tuition in 1995
=$20,000
Computer Price in 1995 =$1500
(c) 2000,2001, 2002 Claudia Garcia - Szekely 12
3 tickets$500/ea
1 Computer
$1,500/ea
5 Doctor visits$90/ea
2 Tuitions$20,000/ea
Cost of the Basket in the Base Year (1995)
$43,450$1,500
$1,500
$450
$40,000
Note: Same items, same
quantities, same qualities we used
for 2000
(c) 2000,2001, 2002 Claudia Garcia - Szekely 13
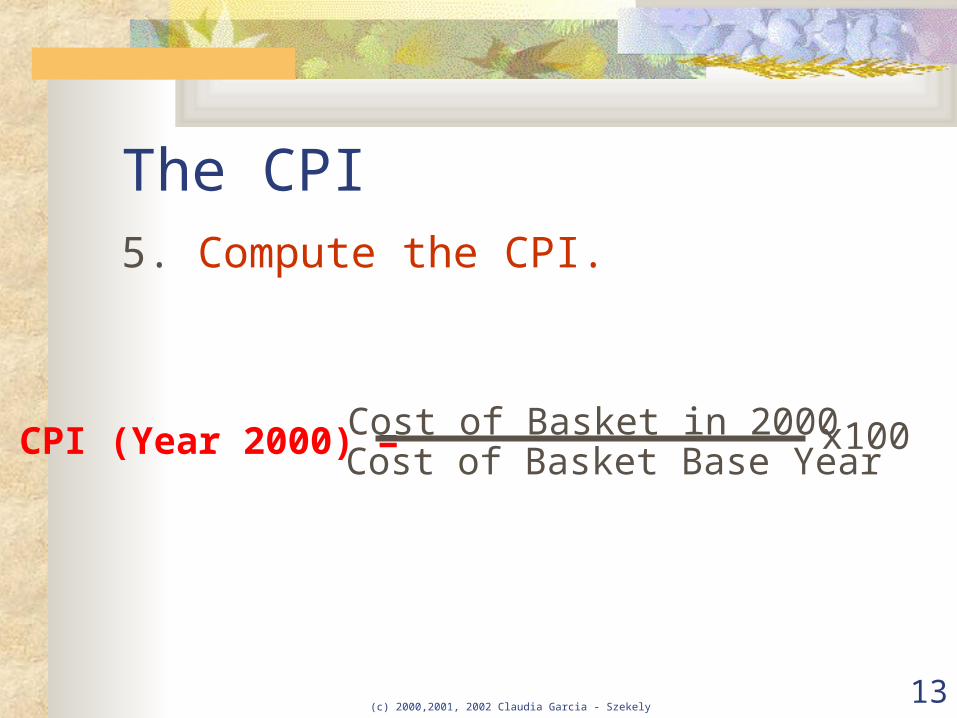
The CPI5. Compute the CPI.
CPI (Year 2000) =Cost of Basket in 2000Cost of Basket Base Year
x100

(c) 2000,2001, 2002 Claudia Garcia - Szekely 14
Calculating the CPI1. Fix the quantities and items in
the basket.2. Find the prices of these items.3. Compute the cost of the items in
the basket at each year’s prices.4. Choose a base year -the
benchmark for comparison-
CPI (Year 2000) =Cost of Basket in 2000Cost of Basket Base Year
x100
(c) 2000,2001, 2002 Claudia Garcia - Szekely 15
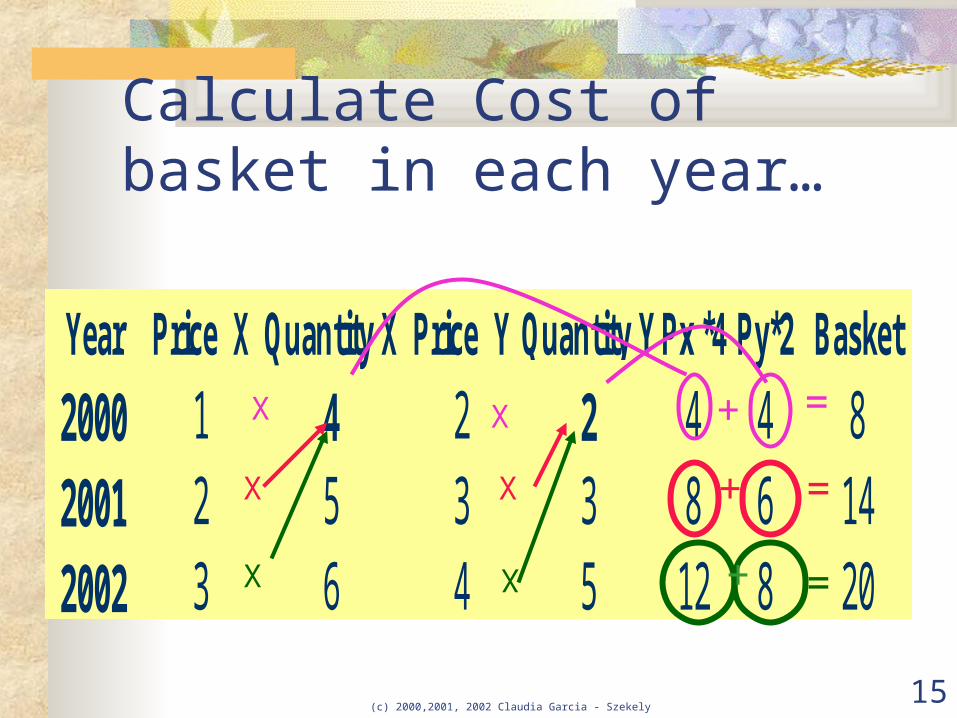
Calculate Cost of basket in each year…
Year Price X Quantity X Price Y Quantity Y Px *4 Py*2 Basket
2000 1 4 2 2 4 4 82001 2 5 3 3 8 6 142002 3 6 4 5 12 8 20
X
X
X
X
X
X +
+
+
=
=
=
(c) 2000,2001, 2002 Claudia Garcia - Szekely 16
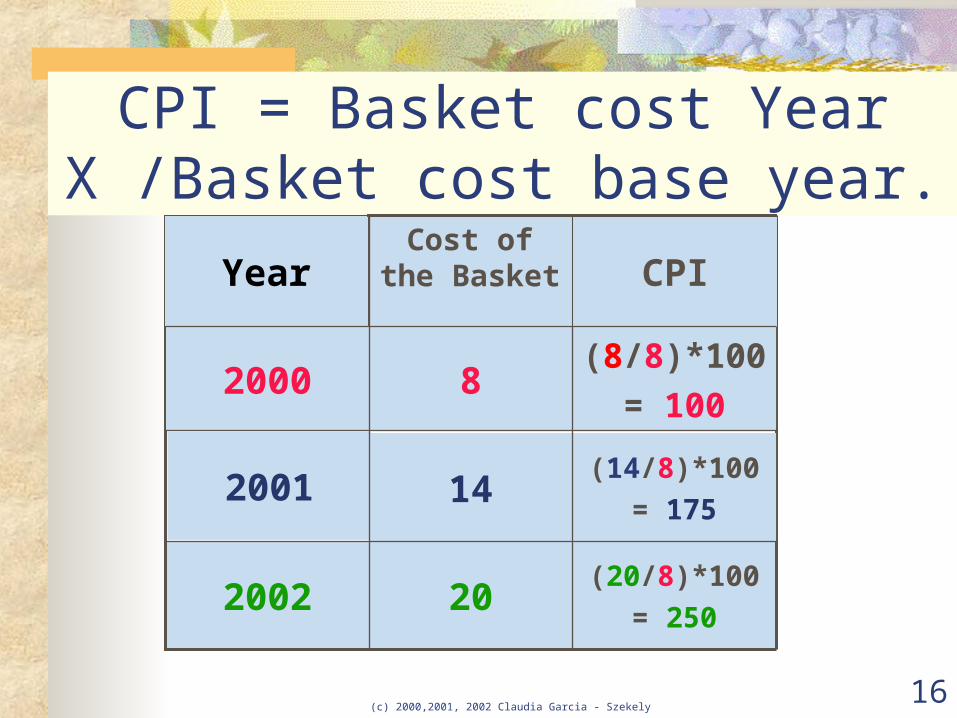
CPI = Basket cost Year X /Basket cost base year.
(20/8)*100
= 250202002
CPICost of the
BasketYear
(8/8)*100
= 10082000
(14/8)*100
= 175142001

(c) 2000,2001, 2002 Claudia Garcia - Szekely 17
Inflation
Measures the rate of CHANGE in prices. Is calculated from a price index, for
different time periods: months, quarters, years.
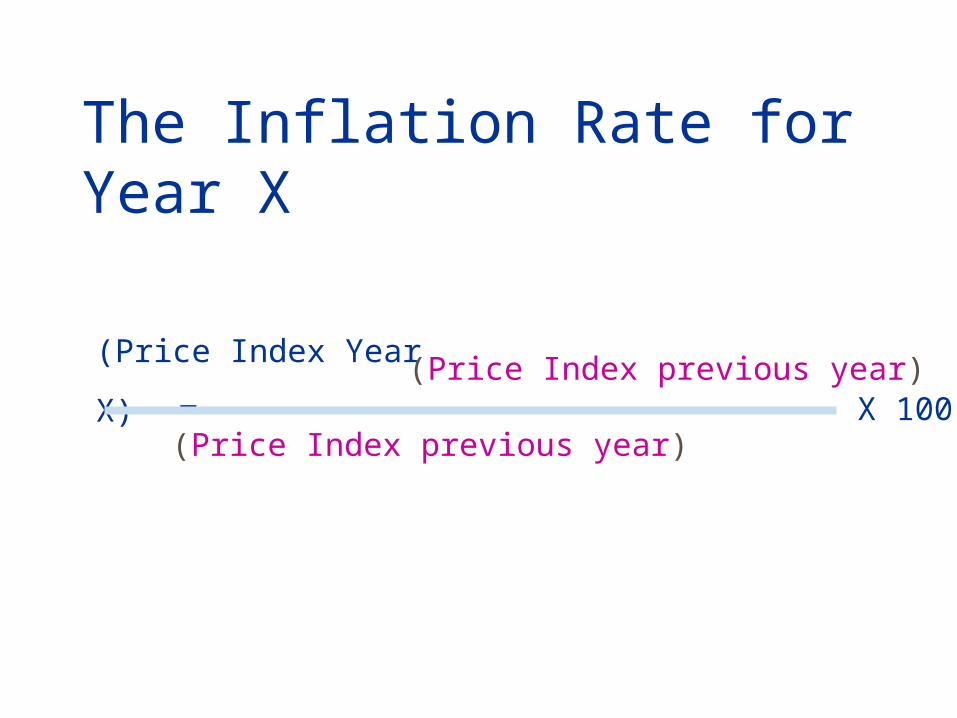
The Inflation Rate for Year X
(Price Index Year X)
-(Price Index previous year)
(Price Index previous year)X 100

(c) 2000,2001, 2002 Claudia Garcia - Szekely 19
Calculating the Inflation Rate
Year CPI Inflation rate
2000 100
2001 175 75
2002 250 42.86
175 - 100
100
X100 = 75%
250 - 175
175X 100 = 43%
You need 75% more money in 2001 than
in 2000 to buy the same
goods

(c) 2000,2001, 2002 Claudia Garcia - Szekely©2001Claudia
Garcia-Szekely 20
What goods and services does the CPI cover?
All goods and services purchased for consumption are classified into 200
categories, arranged into eight major groups.

The CPI includes1. FOOD AND BEVERAGES (breakfast cereal, milk, coffee,
chicken, wine, full service meals and snacks); 2. HOUSING (rent of primary residence, owners' equivalent
rent, fuel oil, bedroom furniture); 3. APPAREL (men's shirts and sweaters, women's dresses,
jewelry); 4. TRANSPORTATION (new vehicles, airline fares, gasoline,
motor vehicle insurance); 5. MEDICAL CARE (prescription drugs and medical supplies,
physicians' services, eyeglasses and eye care, hospital services);
6. RECREATION (televisions, cable television, pets and pet products, sports equipment, admissions);
7. EDUCATION AND COMMUNICATION (college tuition, postage, telephone services, computer software and accessories);
8. OTHER GOODS AND SERVICES (tobacco and smoking products, haircuts and other personal services, funeral expenses).

(c) 2000,2001, 2002 Claudia Garcia - Szekely 22
Although not a “price” CPI includes…
Also included are various government-charged user fees: water and sewerage charges, auto registration fees, and
vehicle tolls. The CPI also includes taxes:
such as sales and excise taxes that are directly associated with the prices of specific goods and services.
The CPI excludes taxes: such as income and Social Security taxes that are not
directly associated with the purchase of consumer goods and services.
The CPI does not include investment items: such as stocks, bonds, real estate, and life insurance.
Because these items relate to savings and not to day-to-day consumption expenses.
(c) 2000,2001, 2002 Claudia Garcia - Szekely 23
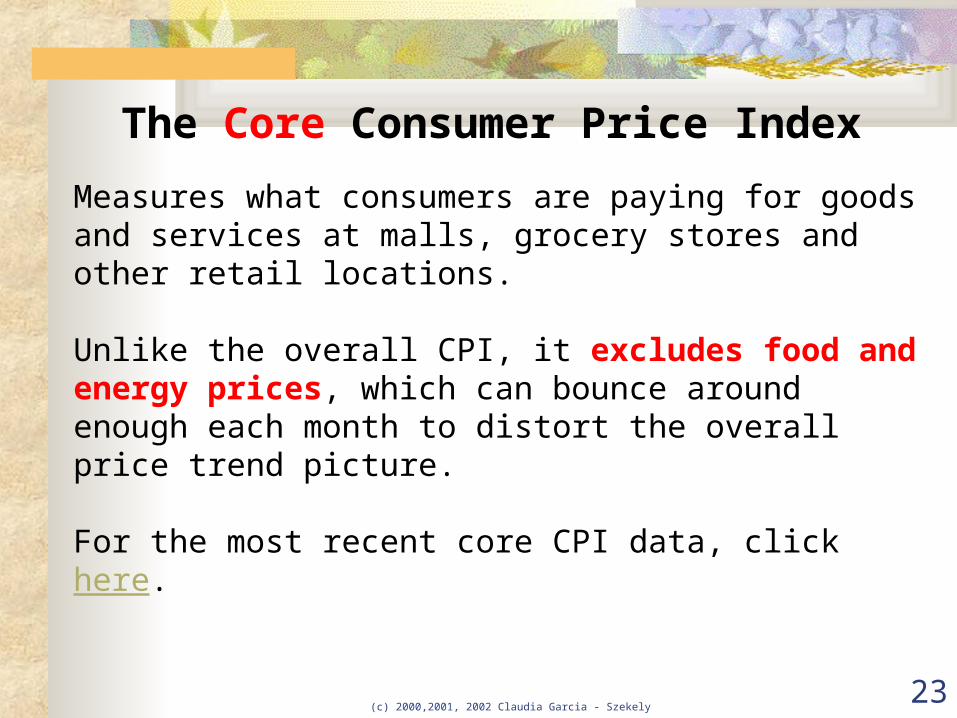
The Core Consumer Price Index
Measures what consumers are paying for goods and services at malls, grocery stores and other retail locations.
Unlike the overall CPI, it excludes food and energy prices, which can bounce around enough each month to distort the overall price trend picture.
For the most recent core CPI data, click here.
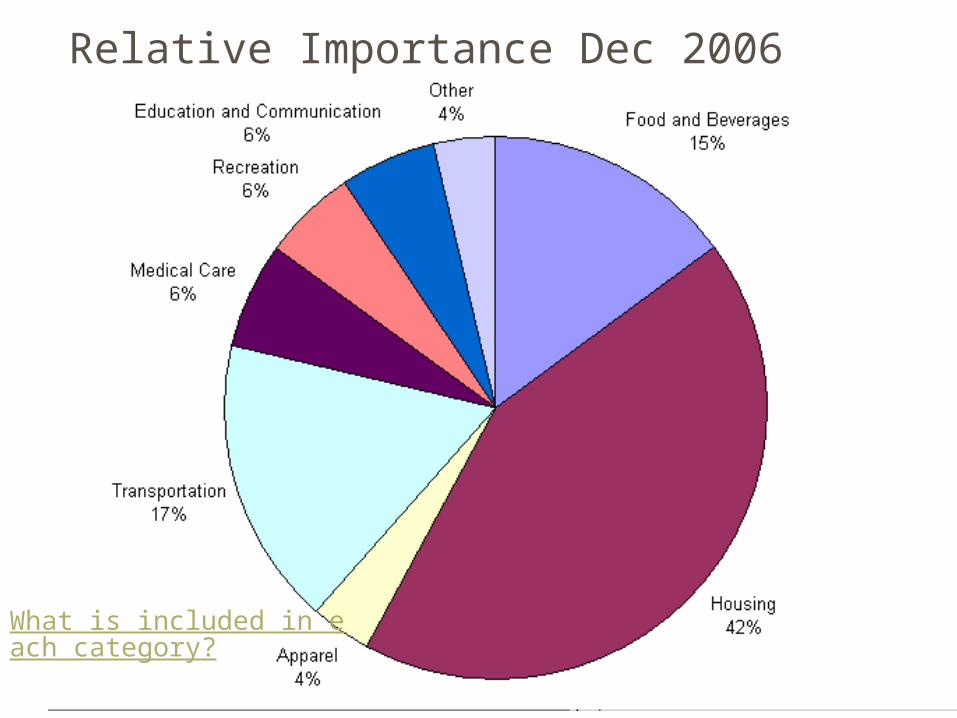
What is included in each category?
Relative Importance Dec 2006
(c) 2000,2001, 2002 Claudia Garcia - Szekely 25
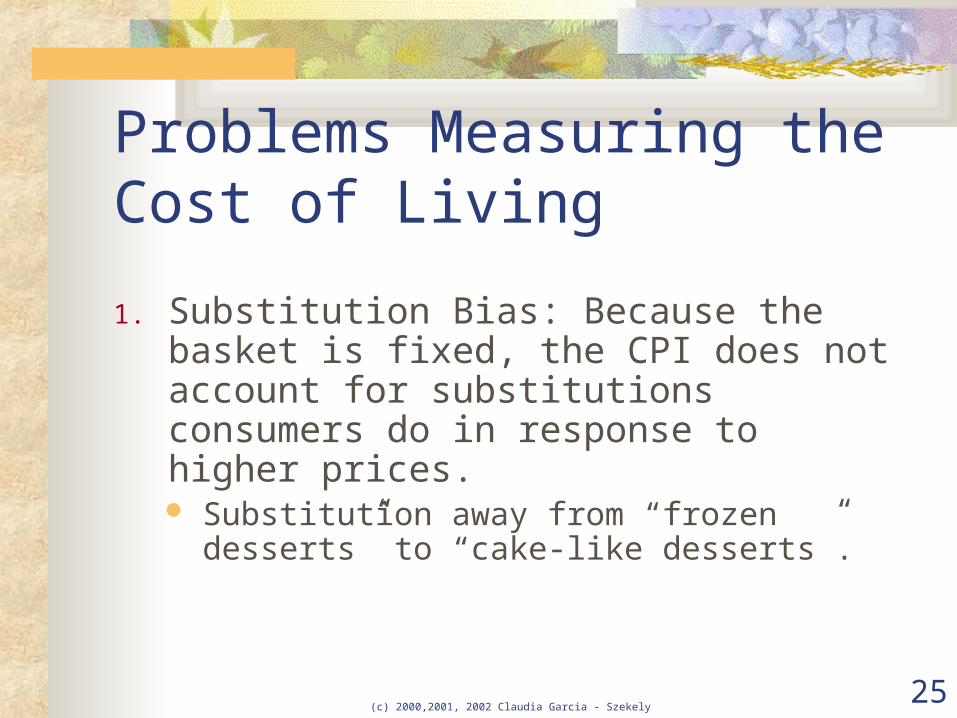
Problems Measuring the Cost of Living
1. Substitution Bias: Because the basket is fixed, the CPI does not account for substitutions consumers do in response to higher prices. Substitution away from “frozen
desserts” to “cake-like desserts”.

(c) 2000,2001, 2002 Claudia Garcia - Szekely 26
Geometric Mean Estimator
•Employs a set of fixed expenditure proportions as weights.•Consumers can alter the quantities of goods and services they buy within the category, when the relative prices of those goods and services change.
3 apples4 ice
cream bars
3 fruits4 frozen desserts

(c) 2000,2001, 2002 Claudia Garcia - Szekely 27
Problems with CPI…2. New Goods Bias: Not included in the
basket. Consumers spend less to attain the same (or higher) standard of living. CPI does not reflect this change in the purchasing power of a dollar.
3. Unmeasured Quality change: If quality improves, the value of the dollar rises.
(c) 2000,2001, 2002 Claudia Garcia - Szekely 28
Inflation Inflation refers to an INCREASE in
the price level from one period to the next.
Inflation can be high (20%) or low (2%)
When inflation drops from 20% to 2% prices still INCREASE, but not as much as the previous time period.

(c) 2000,2001, 2002 Claudia Garcia - Szekely 29
Deflation Deflation refers to a DECREASE in the
price level from one period to the next. Deflation shows up as a NEGATIVE
number for the inflation rate: a –5% “inflation” means that prices DECREASED by 5%.
This is not only a slowing down of inflation but a DROP in prices.

Year CPI Inflation1970 39.81971 41.1 3.31972 42.5 3.41973 46.3 8.91974 51.9 12.11975 55.6 7.11976 58.4 5.01977 62.3 6.71978 67.9 9.01979 76.9 13.31980 66.9 -13.0
For which years there is Deflation?
Inflation?
(c) 2000,2001, 2002 Claudia Garcia - Szekely 31
(c) 2000,2001, 2002 Claudia Garcia - Szekely 32
The GDP Deflator The GDP deflator is a price index. It is calculated from nominal and real
GDP. Sometimes called “implicit” price
deflator because it is the price implicit in the difference between real and nominal.
(c) 2000,2001, 2002 Claudia Garcia - Szekely 33
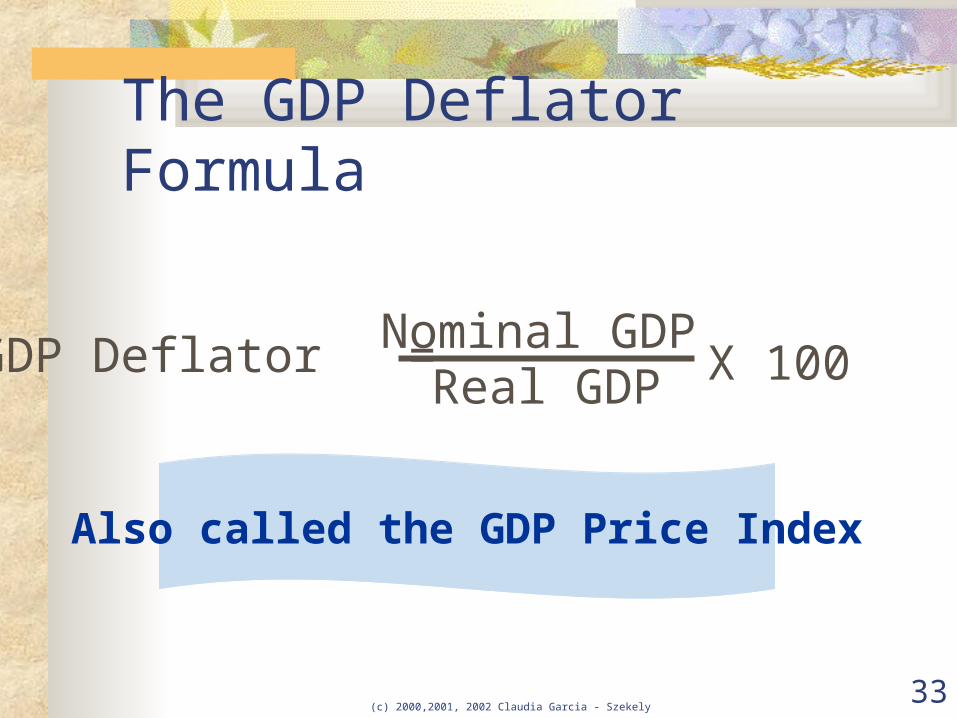
The GDP Deflator Formula
GDP Deflator = Nominal GDPReal GDP X 100
Also called the GDP Price Index

(c) 2000,2001, 2002 Claudia Garcia - Szekely 34
Year CPI
2005 195.3
2006 201.6
2007 207.342
Calculate the inflation rate for these three years.
(c) 2000,2001, 2002 Claudia Garcia - Szekely 35
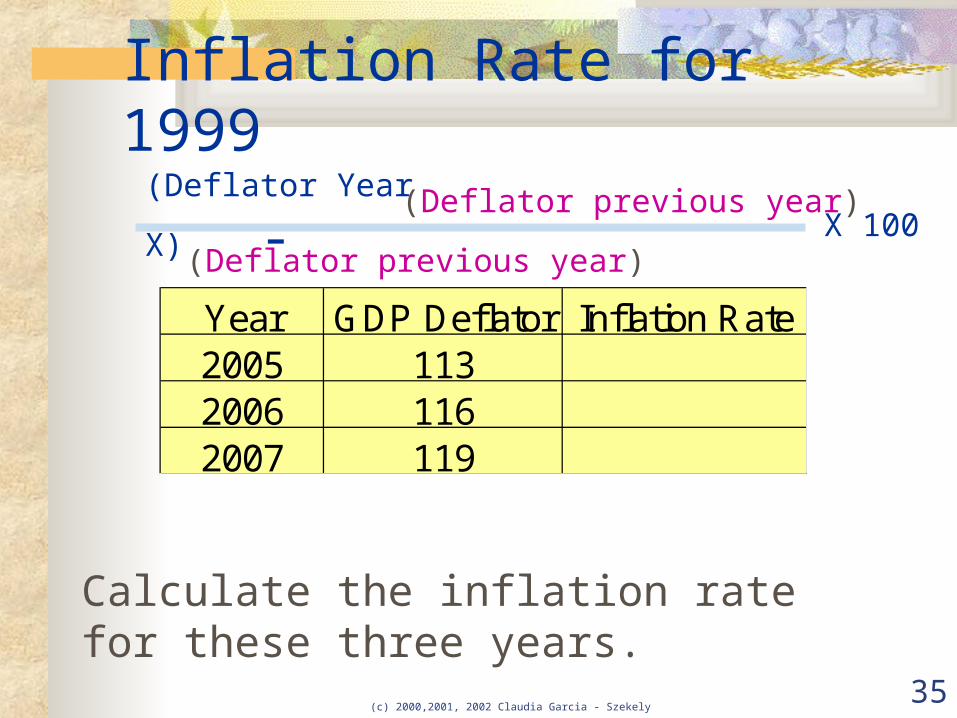
Inflation Rate for 1999
Year GDP Deflator Inflation Rate2005 1132006 1162007 119
(Deflator Year X) - (Deflator previous year)
(Deflator previous year)X 100
Calculate the inflation rate for these three years.
(c) 2000,2001, 2002 Claudia Garcia - Szekely 36
The GDP Deflator vs. the CPI
1. GDP Deflator reflects the prices of all goods and services produced domestically bought by consumers, the government and other countries.
(c) 2000,2001, 2002 Claudia Garcia - Szekely 37
The GDP Deflator vs. the CPI1. The CPI reflects prices of goods
purchased by consumers only. The CPI does not take into account prices of goods and services bought by the government or foreigners.

(c) 2000,2001, 2002 Claudia Garcia - Szekely 38
The GDP Deflator vs. The CPI2. The CPI uses a fixed basket
whereas the GDP deflator uses prices of currently produced goods.
1
2
5
3
(c) 2000,2001, 2002 Claudia Garcia - Szekely 39
Comparing dollar values from different years
$100 in 1930 is not the same as $100 in 2000.
Why not? Because prices were different: $100 used
to buy you more then…To compare $100 in 1931 with $100 today
we must find out what $100 used to buy in 1930 and compare that to what $100 buys today..
(c) 2000,2001, 2002 Claudia Garcia - Szekely 40
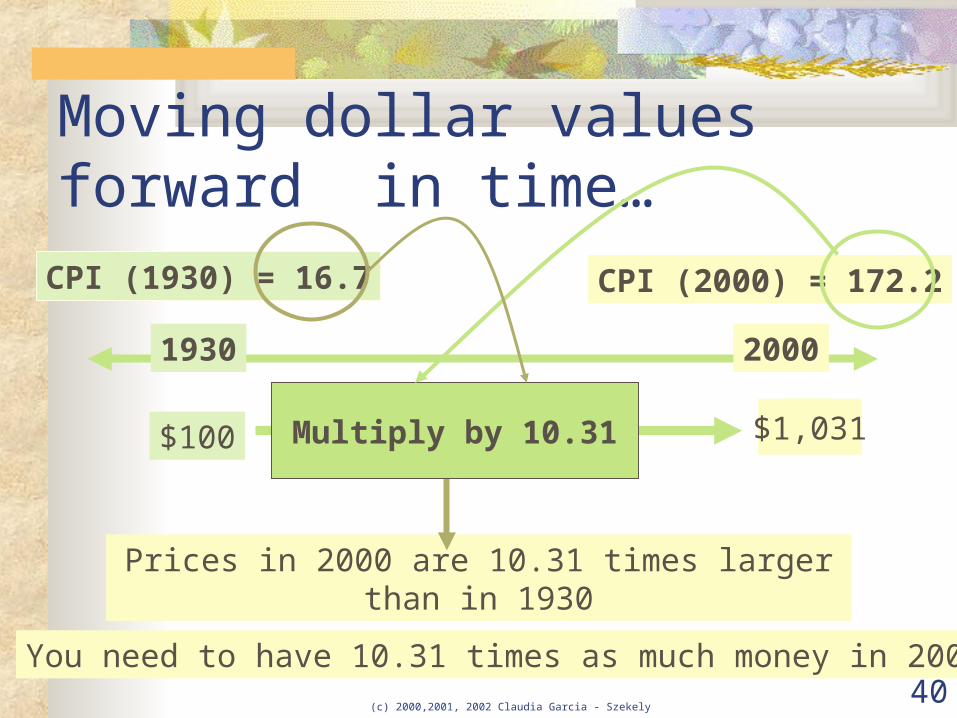
Moving dollar values forward in time…
1930 2000
$100
CPI (1930) = 16.7 CPI (2000) = 172.2
(172.2)/(16.7)=10.31
Prices in 2000 are 10.31 times larger than in 1930
You need to have 10.31 times as much money in 2000
Multiply by 10.31 ?$1,031
(c) 2000,2001, 2002 Claudia Garcia - Szekely 41
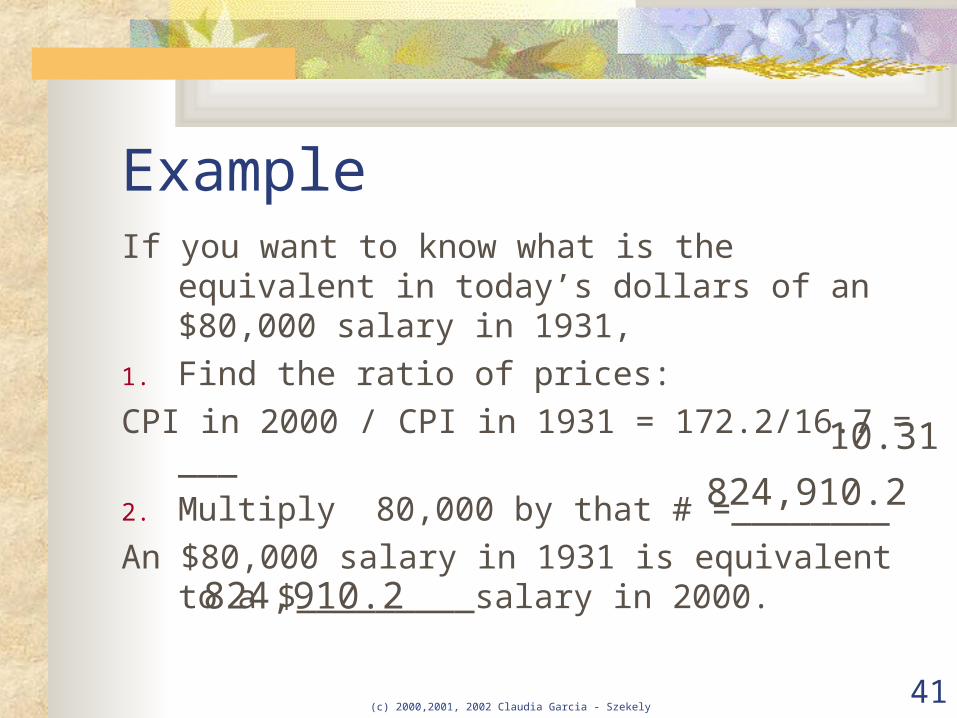
ExampleIf you want to know what is the equivalent
in today’s dollars of an $80,000 salary in 1931,
1. Find the ratio of prices:CPI in 2000 / CPI in 1931 = 172.2/16.7 =
___2. Multiply 80,000 by that # =________An $80,000 salary in 1931 is equivalent to
a $_________salary in 2000.
10.31
824,910.2
824,910.2
(c) 2000,2001, 2002 Claudia Garcia - Szekely 42
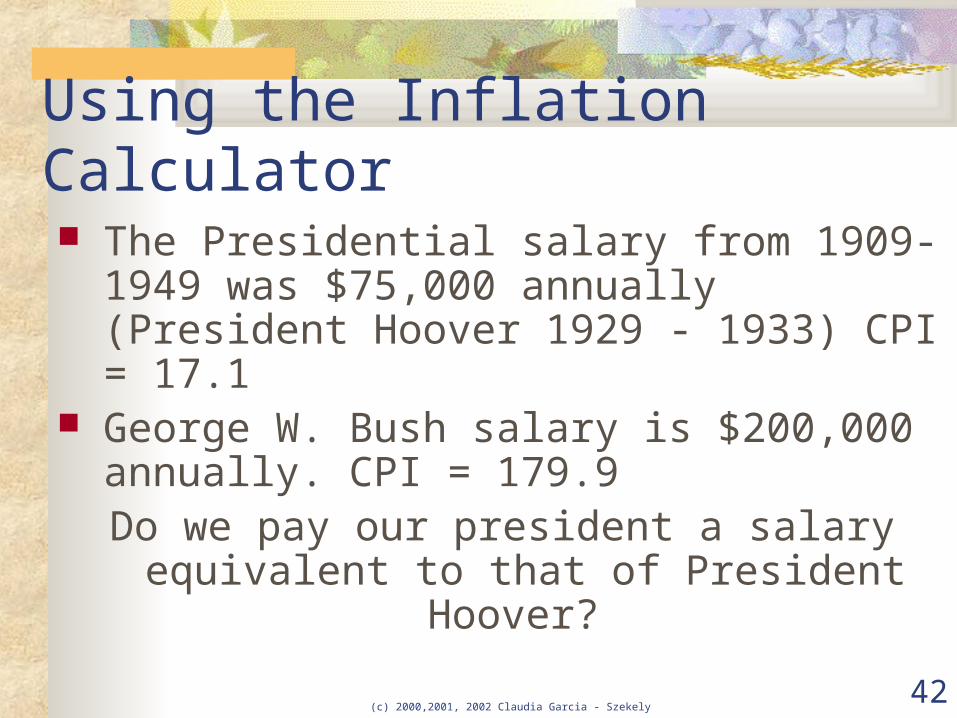
Using the Inflation Calculator The Presidential salary from 1909-
1949 was $75,000 annually (President Hoover 1929 - 1933) CPI = 17.1
George W. Bush salary is $200,000 annually. CPI = 179.9
Do we pay our president a salary equivalent to that of President Hoover?
(c) 2000,2001, 2002 Claudia Garcia - Szekely©2001Claudia
Garcia-Szekely 43
Inflation Calculator
This site finds the equivalencies for dollars in different years.http://data.bls.gov/cgi-bin/cpicalc.pl

(c) 2000,2001, 2002 Claudia Garcia - Szekely 44
Questions to prepare for the test
1. Is the CPI inflation rate measured correctly? In your answer you must mention the new goods bias, the quality bias and the substitution bias. Provide an example for each to illustrate your answer.

2. In 1964 earnings per hour were $7.96 (CPI= 31). Today, earnings per hour are $45(CPI=196.4). Are per hour earnings today equivalent to those in 1964? WHY or why not?
3. In what way are the CPI and the GDP deflator the same? In what way are they different?
4. Use the data in the table in the next slide to calculate:a) Inflation rate 1975b) Inflation rate 1980
5. Identify Inflation/Deflation.

(c) 2000,2001, 2002 Claudia Garcia - Szekely 46
Year CPI Inflation1970 39.81971 41.1 3.31972 42.5 3.41973 46.3 8.91974 51.9 12.11975 55.6 7.11976 58.4 5.01977 62.3 6.71978 67.9 9.01979 76.9 13.31980 66.9 -13.0
(c) 2000,2001, 2002 Claudia Garcia - Szekely 47
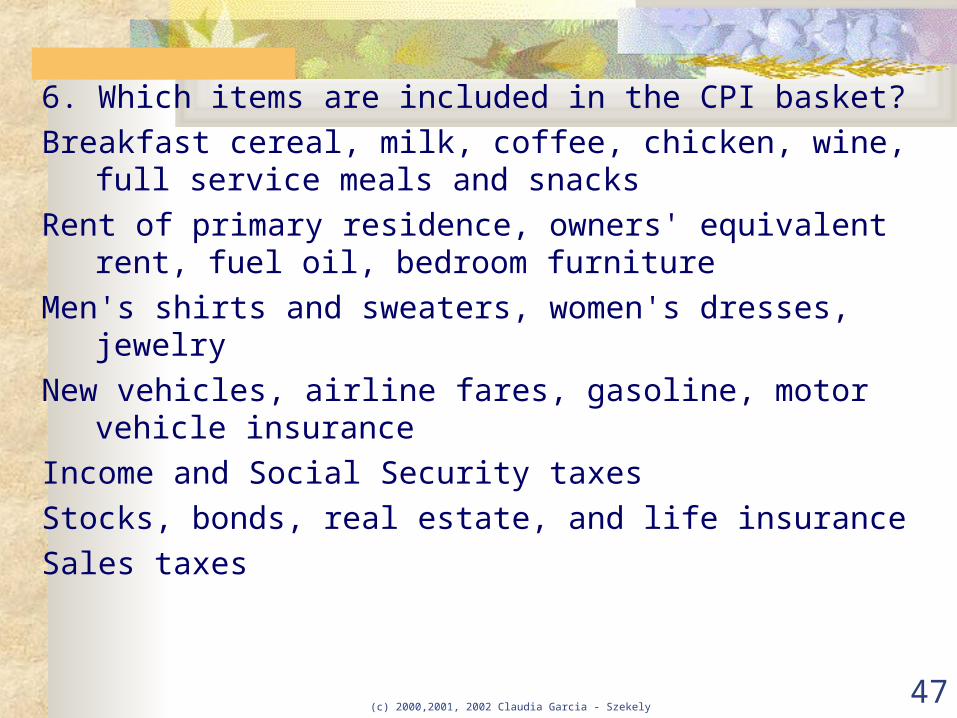
6. Which items are included in the CPI basket?Breakfast cereal, milk, coffee, chicken, wine, full
service meals and snacksRent of primary residence, owners' equivalent
rent, fuel oil, bedroom furniture Men's shirts and sweaters, women's dresses,
jewelryNew vehicles, airline fares, gasoline, motor vehicle
insuranceIncome and Social Security taxes Stocks, bonds, real estate, and life insuranceSales taxes

(c) 2000,2001, 2002 Claudia Garcia - Szekely 48
ECI comes out quarterly and measures changes in employee wages, salaries and benefits.
AHE, the Employment Situation report, comes out monthly, shows how worker wages are changing month to month. Both are important because rapidly rising labor costs can force businesses to raise prices to compensate, spurring inflation. For the most recent ECI data, click here. For the most recent AHE data, click here
Employment Cost Index (ECI)Average Hourly Earnings (AHE)
(c) 2000,2001, 2002 Claudia Garcia - Szekely 50
More Information on the CPI
Go to:http://data.bls.gov/cgi-bin/surveymost?cu
Check on first box: U.S. All items, 1982-84=100 - CUUR0000SA0