c consult author(s) regarding copyright matterseprints.qut.edu.au/78842/3/78842.pdfcylindrical...
TRANSCRIPT
This may be the author’s version of a work that was submitted/acceptedfor publication in the following source:
Narayanasamy, Sumithira, Vincent, Stephen, Sampson, Geoff, & Wood,Joanne(2015)Impact of simulated hyperopia on academic-related performance in chil-dren.Optometry and Vision Science, 92(2), pp. 227-236.
This file was downloaded from: https://eprints.qut.edu.au/78842/
c© Consult author(s) regarding copyright matters
This work is covered by copyright. Unless the document is being made available under aCreative Commons Licence, you must assume that re-use is limited to personal use andthat permission from the copyright owner must be obtained for all other uses. If the docu-ment is available under a Creative Commons License (or other specified license) then referto the Licence for details of permitted re-use. It is a condition of access that users recog-nise and abide by the legal requirements associated with these rights. If you believe thatthis work infringes copyright please provide details by email to [email protected]
Notice: Please note that this document may not be the Version of Record(i.e. published version) of the work. Author manuscript versions (as Sub-mitted for peer review or as Accepted for publication after peer review) canbe identified by an absence of publisher branding and/or typeset appear-ance. If there is any doubt, please refer to the published source.
https://doi.org/10.1097/OPX.0000000000000467
Title page
Impact of simulated hyperopia on academic-related performance in children
Sumithira Narayanasamy B.Optom.(Hons)1
Stephen J Vincent PhD1
Geoff P Sampson PhD2
Joanne M Wood PhD, FAAO1
1School of Optometry and Vision Science, Institute of Health and Biomedical Innovation,
Queensland University of Technology, Brisbane, Australia
2School of Medicine (Optometry), Faculty of Health, Deakin University, Geelong, Australia
Number of Figures: 3
Number of Tables: 2
Corresponding author and address for reprints:
Sumithira Narayanasamy
School of Optometry and Vision Science
Institute of Health and Biomedical Innovation
Queensland University of Technology, Brisbane, Australia
Phone: 617 3138 5504, Fax: 617 3138 5880
Email: [email protected]
Date of submission: 8 March 2014
Date of resubmission: 27 June 2014
Date of 2nd resubmission: 31st July 2014
ABSTRACT
Purpose: To investigate the impact of simulated hyperopia and sustained near work on
children’s ability to perform a range of academic-related tasks.
Methods: Fifteen visually normal children (mean age: 10.9 ± 0.8 years; 10 males and 5 females)
were recruited. Performance on a range of standardised academic-related outcome measures was
assessed with and without 2.50 D of simulated bilateral hyperopia (administered in a randomised
order), before and after 20 minutes of sustained near work, at two separate testing sessions.
Academic-related measures included a standardised reading test (the Neale Analysis of Reading
Ability), visual information processing tests (Coding and Symbol Search subtests from the
Wechsler Intelligence Scale for Children) and a reading-related eye movement test (the
Developmental Eye Movement test).
Results: Simulated bilateral hyperopia and sustained near work each independently impaired
reading, visual information processing and reading-related eye movement performance
(p<0.001). A significant interaction was also demonstrated between these factors (p<0.001), with
the greatest decrement in performance observed when simulated hyperopia was combined with
sustained near work. This combination resulted in performance reductions of between 5% and
24% across the range of academic-related measures. A significant moderate correlation was also
found between the change in horizontal near heterophoria and the change in several of the
academic-related outcome measures, following the addition of simulated hyperopia.
Conclusions: A relatively low level of simulated bilateral hyperopia impaired children’s
performance on a range of academic–related outcome measures, with sustained near work further
exacerbating this effect. Further investigations are required to determine the impact of correcting
low levels of hyperopia on academic performance in children.
Key Words: simulated hyperopia, children, academic performance
Hyperopia is a common refractive condition in children with a reported prevalence ranging from
0.4% to 26%, depending on the definition of hyperopia, age of children studied and measurement
methods used (with or without cycloplegia).1-8 In school aged children (5-17 years), while some
clinicians consider +2.00 D as moderate hyperopia,4, 7 others suggest that < +3.00 D is a
relatively insignificant or low level of hyperopia.8, 9 Importantly, the definition of clinically
meaningful hyperopia varies (ranging from 1.25 to 2.00 D), making direct comparisons between
studies difficult.10 A number of studies have reported that uncorrected hyperopia is associated
with poorer performance on measures of academic-related performance, such as reading
ability.11-22 The link between uncorrected hyperopia and academic performance may arise
because the accommodative demand required to sustain clear focus during near tasks results in
symptoms such as asthenopia, intermittent blurring of print, headaches and fatigue, which in turn
may make it difficult to perform efficiently in the classroom.23
Although numerous studies have reported an association between uncorrected hyperopia and
reduced academic performance in children, the majority of these studies have methodological
limitations.18, 22, 24 For example, many of these studies have employed either case control or cross
sectional designs; 16, 17, 20 this allows identification of associations between uncorrected
hyperopia and academic achievement, but cannot prove that the relationship is causal.24 Another
major limitation is inconsistency in defining and quantifying reading or academic performance.18
A variety of descriptive terms have been used to categorise study participants, including
‘learning disabled’, ‘poor readers’, ‘slow readers’ and ‘reading disabled’, without providing
precise definitions of what these terms mean.25 This largely qualitative approach is further
hampered by the use of non-standardised measures, such as a teacher’s subjective assessment,11
or school derived exams,17 to classify children into different academic performance groups. The
validity and reliability of such measures are undetermined, and they employ an arbitrary
selection of normal versus abnormal criteria; this limits the strength of the conclusions that can
be drawn.26 Poor statistical analysis techniques, such as failure to control for potential
confounding factors or experimental bias are additional limiting factors.24
There is also a lack of consensus regarding the minimum level of uncorrected hyperopia that
would detrimentally affect reading ability or general academic performance in children.27 Survey
findings from the Orinda study revealed that 50% of practitioners would consider bilateral
hyperopia ≥ 1.50 D as the threshold for referral for further testing.28 This was supported by
Leat,29 who recommended that hyperopia ≥ 1.50 D should be corrected during the school years.
Similarly, Cotter30 suggested that hyperopia ≥ 1.50 D should be corrected in symptomatic
children, while Ciner31 recommended that in children aged five and above, hyperopia ≥ 2.00 D
should be corrected. However, each of these recommendations was based solely on the
experience and clinical intuition of individual eye care practitioners, and not on evidence derived
from well-designed studies.
There have also been attempts to empirically determine the magnitude of uncorrected hyperopia
that is likely to be functionally problematic, but these investigations have been restricted to
adults. Walton et al.27 examined the impact of increasing levels of simulated hyperopia on
performance of young adults’ intelligence test scores, using the Otis Lennon Mental Ability Test.
There was a significant decrease in test scores with 2.00 D of hyperopia simulation with a non-
significant decrement in performance for 1.50 D. The authors concluded that uncorrected
hyperopia of 1.50 D should be considered as the referral point for vision screening purposes
while 2.00 D was regarded as the minimum threshold for ophthalmic correction of hyperopia.
However, this study is limited by the fact that participants were not visually screened prior to
inclusion in the study and thus other co-existing vision problems that may have influenced
performance were not accounted for.
Garzia et al.32 also showed that 2.00 D of simulated bilateral hyperopia caused a significant
increase in reading time (but not accuracy) in visually normal adults; participants were screened
prior to this study. A repeated measures design was used, where reading ability was assessed
using a “cloze” procedure under two visual conditions; control (optimal refractive correction)
and 2.00 D of hyperopia (simulated using minus lenses). While these studies suggest that
uncorrected hyperopia between 1.50 to 2.00 D causes a significant decrement in reading
performance in adults (especially reading speed), the impact of simulated hyperopia on
standardised academic-related performance in children has not been assessed. In addition, these
studies also did not attempt to identify the mechanisms underlying the observed changes in
outcome measures with hyperopia simulation. Theoretically, uncorrected hyperopia leads to an
increase in accommodative demand in order to maintain clear near vision, which may result in
visual fatigue, especially when fixation needs to be sustained for long periods. Vergence demand
may also be impacted, further complicating matters.23 However, evidence to support this theory
is scarce.
Near work activities such as reading and writing are considered the most important educational
tasks undertaken by children.33 Ritty et al.33 reported that children spent around 4 to 5 hours daily
on academic activities during school hours, with near tasks comprising about 54% of these
activities. This study showed that on average, students maintained constant near fixation for an
average of 16 minutes at a time.33 However, previous reports linking uncorrected hyperopia with
poor academic performance have not taken into consideration the possible effect of sustained
near work.
The purpose of this study was to investigate the impact of a relatively low level of simulated
bilateral hyperopic refractive error, combined with sustained near work, on a range of
standardised academic-related measures in children. In addition, the change in vergence demand
following the imposition of simulated hyperopia as a possible mechanism which may contribute
to the observed changes in the outcome measures was also investigated. A repeated measures
design approach was used to control for potential differences between participants (such as
socioeconomic status and intelligent quotient) and specifically selected standardised academic-
related outcome measures that mirror common activities usually conducted in school classrooms.
These measures included the Neale Analysis of Reading Ability, the Coding and Symbol Search
subtests (processing speed domain) of the Wechsler Intelligence Scale for Children-Australian
Standardised Edition (WISC-IV) and the Developmental Eye Movement (DEM) test, which are
all commonly used in vision or education research.34-36
METHODS
Participants and vision screening
Fifteen visually normal children (mean age 10.9 ± 0.8 years) were recruited from Years 5 to 7 of
local primary schools through flyers outlining the study sent to academic and professional staff
of Queensland University of Technology (QUT). The participants consisted of 10 males and 5
females, all of Caucasian ethnicity, who spoke English as their first language. Before testing,
each participant underwent a visual screening examination to determine their refractive status,
which included non-cycloplegic retinoscopy and subjective refraction (including binocular
balancing using alternate occlusion). These methods have been shown to be accurate and suitable
for refractive error screening in children.37 During non-cycloplegic retinoscopy, pupil size and
the movement and brightness of the reflex were monitored for accommodative fluctuations
suggestive of accommodative control difficulties, latent hyperopia, attentional or fixation
changes. In addition, children were fogged with +1.50 D lenses over their optimal sphero-
cylindrical refraction and binocular distance visual acuity was remeasured. Two participants
(additional to the main cohort of 15) demonstrating signs of significant latent hyperopia (failed
the fogging test) were thus excluded from the study. A range of binocular vision parameters were
also evaluated, including monocular and binocular amplitudes of accommodation (push-up
method), near point of convergence, stereopsis (TNO test) and near horizontal dissociated
heterophoria (Howell-Dwyer card, Cyclopean Design, Heathmont, Australia). Participants were
excluded if they had visual acuity worse than 0.00 logMAR in either eye, stereoacuity greater
than 60 seconds of arc, any strabismus or amblyopia, any history of ocular disease or surgery, or
any known binocular vision abnormality. One participant who did not meet the visual acuity
inclusion requirement was excluded during the vision screening. This study was conducted in
accordance with the Declaration of Helsinki and was approved by the QUT Human Research
Ethics Committee. Written informed consent was also obtained from the participants and their
parents following a full explanation of the experimental procedures. Participants had the option
to withdraw from the study at any time.
Experimental design
The academic-related outcome measures were measured binocularly for each participant under
two visual conditions (administered in a randomized order), and at two separate time points
using a repeated measures design:
• Control condition (optimal sphero-cyclinder correction with plano lens addition
binocularly)
• Hyperopia simulation condition (optimal sphero-cyclinder correction with minus 2.50 D
lens addition binocularly)
Each participant wore their optimal refractive correction throughout all experimental procedures,
with the minus lenses added to this during the hyperopia simulation condition. Pilot studies
conducted on both visually normal adults and children suggested that a detrimental impact on a
range of standardised academic-related measures resulted from between 2.00 to 3.00 D of
bilateral hyperopia simulation. Therefore, 2.50 D, the intermediate level of this range, was
selected for this study to achieve balance between investigating a realistic level of uncorrected
hyperopia that may be found in children, and demonstrating an effect of this low level on
academic-related performance. In addition, studies on adults have also shown that simulated
hyperopia between 1.50 D to 2.00 D impacts on functional performance.27, 32 Given that children
have greater accommodative reserve compared to adults, we decided that a higher level of
hyperopia simulation would be required to observe a reduction in performance.
Testing was conducted on two separate visits, controlling for the time of the day, with
participants being assessed under only one visual condition during each visit. Measurements
were conducted immediately following the introduction of control or hyperopia simulation lenses
(using full aperture trial lenses placed in a trial frame), and repeated again after 20 minutes of
sustained near work (with the simulation lenses still in place). During this 20 minutes,
participants performed pen and paper puzzles comprised of N10 print at a working distance of
40cm (which is a common near testing distance in clinical settings).38 This task duration was
selected based on a previous study which reported that on average, school children engage in
near point tasks continuously for about 16 minutes at a time.33 A reading board was used
throughout each near task to ensure a constant working distance between participants and across
experimental sessions. The examiner also verified that the correct working distance was being
maintained by participants at regular intervals throughout the testing session. The order in which
the outcome measures were administered was randomised between participants to minimise
potential order effects.
Reading performance
The Neale Analysis of Reading Ability test was selected to assess reading performance. This is a
widely used standardised measure of reading performance with published normative data
available for Australian children.39 The test assesses three main components of reading
performance; rate, accuracy and comprehension. The test consists of four individual forms, with
each form consisting of six passages of increasing reading difficulty. One form was used during
each assessment (two for each visit; before and after the sustained near task). Each passage was
read aloud by the participant and was immediately followed by a series of comprehension
questions upon completion of the passage. Testing is terminated if the maximum number of
permissible reading errors is made. However, all participants successfully completed all six
passages included in every form, so termination of the test was not required for any of the
participants. Reading rate (words per minute) was derived from the time taken to complete all of
the individual passages using the following formula: (total words read/total time taken) x 60, in
line with test instructions. For each passage, the total number of reading errors was subtracted
from the maximum permissible errors for that particular passage and these values were summed
for the six passages to provide the reading accuracy score. Reading comprehension was
quantified in terms of the total number of questions answered correctly.40
Visual Information Processing (VIP) performance
Processing speed is considered to be linked to many cognitive skills such as word recognition
and reading comprehension.41 Therefore, any abnormalities in processing speed may lead to
difficulties with the learning process and comprehension of new information in children.41 The
Wechsler Intelligence Scale for Children - Australian Standardised Edition (WISC-IV) is widely
used for assessing the intellectual ability of children aged 6 to 16 years old, with published
normative data available for Australian children.42 The processing speed domain of this test
consists of two subtests, Coding and Symbol Search, which were used to assess VIP
performance. The processing speed domain assesses a child’s ability to focus attention and
quickly scan, discriminate between, and sequentially order visual information.
Coding: This subtest is a measure of speed and accuracy of visual motor coordination, attention
skills, visual scanning and tracking. Participants were presented with a rectangular grid of digits
and instructed to substitute the appropriate symbol for each of the digits using a code that
appears at the top of the page. They were required to complete as many items as possible within
120 seconds, and the number of correct responses was recorded.
Symbol Search: This subtest is a measure of perceptual discrimination, speed, accuracy, visual
scanning and visual motor coordination. Participants were presented with a horizontal array of
symbols, divided into a target and a search group. They were instructed to scan the two groups
and indicate whether the target symbols appear in the search group; as with the Coding subtest,

they were required to complete as many items as possible within 120 seconds. The number of
correct responses was recorded.
Developmental Eye Movement (DEM) test
The DEM test was chosen to assess reading-related eye movement performance as it is simple
and quick to administer with children43 and is commonly used clinically to assess automaticity in
number naming and ocular motor fluency in reading.12, 44 The DEM test consists of a pre-test,
two subtests with 40 numbers arranged in vertical columns (subtests A and B) and a subtest with
16 horizontal rows consisting of 80 irregularly spaced numbers (subtest C). The vertical subtest
is designed to measure rapid automatised naming (RAN) ability while the ratio of horizontal to
vertical subtest times (after adjustment for errors), provides a measure of reading-related
saccadic eye movements (RSEM), by controlling for RAN.44 However, questions have been
raised regarding whether the DEM test strictly measures saccadic eye movement ability; DEM
scores have been shown to correlate better with academic test performance than with other
quantitative eye movement measures.34 Nevertheless, the DEM test is considered suitable for
identifying children at risk of academic delays based on its association with reading ability and
visual processing and its construct accounting for verbalisation speed.34 In line with standard
administration procedures, participants were asked to read the single digit numbers aloud as
quickly and accurately as possible. The times taken to complete the two vertical columns (RAN)
and sixteen horizontal lines were separately recorded. The horizontal test times were adjusted for
errors in reporting the numbers, and, upon completion, a ratio (RSEM) of horizontal to vertical
time was calculated.
Near horizontal dissociated heterophoria
Near horizontal dissociated heterophoria was measured using the near Howell-Dwyer Phoria
card (Cyclopean Design, Heathmont, Australia) at a distance of 33cm. A loose dissociating prism
of 6∆ base-down was introduced in front of the right eye and the participant was asked to
identify the number most closely aligned with the top arrow.45 This was conducted immediately
following the introduction of either the optimal refractive correction or the hyperopia simulation
lenses to investigate any change in near heterophoria.
All outcome measures were assessed under photopic illumination conditions (620 lux).
Statistical analysis
Statistical analysis was performed using SPSS 19.0. A two way repeated measures analysis of
variance (ANOVA) was used to examine the influence of refractive error simulation (with and
without -2.50 lens addition) and time (before and after 20 minutes of sustained near work) on the
various academic-related outcome measures. A p-value of less than 0.05 was considered
statistically significant. Pearson’s correlation analysis was conducted to examine the relationship
between changes in the academic-related performance measures and the change in near
horizontal heterophoria following addition of the hyperopia simulation lenses. This was
undertaken to investigate if vergence alignment might be one potential factor associated with the
observed changes, given that hyperopia simulation will also induce change in vergence posture at
near in most children.
RESULTS
All participants had minimal refractive error (group mean spherical equivalent of +0.30 ± 0.29
D, range: -0.25 to + 0.75 D). No subject exhibited anisometropia greater than 0.50 D or
astigmatism greater than 0.50 D and all had best corrected visual acuity of 0.00 logMAR or
better in either eye. The mean reduction in binocular best corrected visual acuity with the +1.50
D fogging lens (excluding the two participants with signs of latent hyperopia) was 0.66 ± 0.07
logMAR (as expected for this magnitude of imposed defocus if optimally corrected).46 Binocular
amplitudes of accommodation (mean: 14.33 ± 1.34 D), near point of convergence (mean: 4.87 ±
1.68 cm), stereoacuity (mean: 27.00 ± 6.21 seconds of arc) and near horizontal heterophoria
(mean: 1.87 ± 2.56 ∆ exophoria) were within clinically acceptable normal limits for children in
this age group,47-49 although it is acknowledged that the criteria for normal cut-off values vary
between authors.50, 51 Baseline data also indicated that most of the participants had an above
average score on all the academic-related outcome measures (approximately in the 70th
percentile for their age group), which was not unexpected given that the participants recruited
were children of academic and professional staff of the University.
Table 1 shows the group mean reduction relative to optimal correction before sustained near
work and results of the statistical comparisons for each of the outcome measures with the
optimal refractive correction and the 2.50 D bilateral hyperopia simulation, before and after 20
minutes of sustained near work.
Table 1 here
Reading performance
All three components of reading performance assessed (rate, accuracy and comprehension) were
significantly reduced by both simulated hyperopia (p<0.001) and sustained near work (p<0.001).
There was also a significant interaction (p<0.001) between simulated hyperopia and near work
for each of these components (Figure 1).
Figure 1 here
Visual information processing performance
The number of correct responses in the Coding and Symbol Search subtests was significantly
reduced by both simulated bilateral hyperopia (p<0.001) and sustained near work (p<0.001). In
addition there was also a significant interaction effect (p<0.001) between hyperopia simulation
and sustained near work for both of these VIP tests (Figure 2).
Figure 2 here
Reading-related eye movement performance
Vertical and horizontal DEM subtest times, as well as the ratio were significantly increased by
both bilateral hyperopia simulation (p<0.001) and sustained near work (p<0.001). A significant
interaction effect (p<0.001) between hyperopia simulation and near work was also observed for
each of these DEM parameters (Figure 3).
Figure 3 here
Mean dissociated horizontal near heterophoria with optimal correction was 1.87 ± 2.56 ∆ exophoria and
2.80 ± 4.86 ∆ esophoria with the 2.50 D hyperopia simulation in place. The correlation between the
change in near horizontal heterophoria and the change in academic-related outcomes following addition
of the hyperopia simulation lenses are summarised in Table 2. Significant positive correlations were
observed for reading accuracy, Coding and Symbol Search WISC subtests.
Table 2 here
DISCUSSION
The impact of simulated hyperopia on standardised academic-related measures in children before
and after a period of sustained near work was examined in this study. There was a statistically
significant main effect of both simulated hyperopia and sustained near work on these measures,
as well as a significant interaction between simulated hyperopia and sustained near work for the
majority of the outcome measures. To the best of our knowledge, this is the first study to
investigate the impact of hyperopia simulation on academic-related measures in children. An
important aspect of this study was the inclusion of a sustained near work component, of a
duration that has been shown to reflect what children are expected to regularly undergo whilst at
school.33
Results of this study demonstrated that hyperopia simulation alone resulted in impaired reading
performance, with the largest decrement being observed in the comprehension measure (5%)
followed by reading rate (2%) and accuracy (2%), and each of these effects were exacerbated
following sustained near work (comprehension (21%), rate (9%) and accuracy (9%)). These
results are in general accord with findings in adults from Garzia et al.,32 who investigated the
impact of induced hyperopia of 2.00 D on reading performance and found that reading rate was
significantly impaired (by up to 11%). However, there was no significant change in the reading
accuracy of their adult participants with hyperopia simulation (1.5% reduction). They suggested
that an increased time for reading was required in order to maintain reading accuracy in the
presence of the induced hyperopia. Given that children are less experienced readers than adults,52
it is likely that any impairment of the visual system may have a greater impact on overall reading
performance (including reading rate, accuracy and comprehension) in children, as shown in the
current study, relative to that of adults. These differences could also be due to the different
reading assessment tools used in each study. This is an important finding given that the reading
components evaluated by the Neale test (rate, accuracy and comprehension) are fundamental to
the everyday learning process in schools.53 Children with uncorrected hyperopia may face
difficulty in optimally developing this essential learning skill, which subsequently may produce a
barrier for their overall academic achievement during the ‘reading to learn’ phase.54
As far as we are aware, this is the first study to explore the impact of simulated hyperopia on
VIP, which are important skills required by children to enable them to extract and organise visual
input from the environment.55, 56 Hyperopia simulation alone resulted in poorer performance on
both the Coding and Symbol Search WISC subtests, which require the participants to quickly
scan, discriminate and sequentially order visual information (with a 5% and 6% reduction
respectively). A greater decrease in performance was observed following sustained near work in
the presence of the hyperopia simulation with a 24% reduction in performance for each of these
subtests. This decrement in performance suggests that those with uncorrected hyperopia may be
less efficient at interpreting visually presented information, which may be a disadvantage when
undertaking academic activities that need to be completed within a limited time frame, such as
school based exams.
Simulated bilateral hyperopia also resulted in slower vertical and horizontal DEM times (both
6% slower) and an increase in the ratio component (0.9%). These reductions in performance
were further exacerbated after sustained near work (vertical time (16%), horizontal time (19%)
and ratio (4%)). Garzia et al.44 proposed that the vertical subtest of DEM measures RAN skills,
while the horizontal subtest measures ocular fixation and saccadic skills, while controlling for
visual to verbal transfer automaticity. Therefore, the increased vertical and horizontal times
observed in the current study suggest that both RAN and RSEM difficulties may result from
hyperopia simulation. The impact of simulated hyperopia was greater for the horizontal
component than vertical, resulting in an increased ratio. Overall, this finding suggests that
simulated hyperopia may compromise reading-related eye movements and visual processing
performance, skills that are considered to be important for children to achieve academically.18, 57
Ayton et al.34 reported that the DEM test is correlated with aspects of reading and visual
processing performance, even though it is not significantly correlated with quantitative measures
of eye movements. The relationship between the DEM test and reading performance was also
examined by Palomo-Alvarez & Puell,58 who reported a negative correlation between reading
speed and the time to complete the DEM horizontal subtest.
However, while the observed changes in reading, VIP and reading-related eye movement
performance due to simulated hyperopia were statistically significant in this sample of children,
it is difficult to comment on the educational significance of these changes. The reason for this is
that there are no established guidelines as to what constitutes a clinically or academically
significant reduction for the outcome measures used in this study. However, examination of the
change in percentile ranks scores (an average of all the academic-related measures examined;
Neale, VIP and DEM tests) does provide some insight into the academic significance of
hyperopia simulation and sustained near work. On average, children’s performance dropped
from the 70th percentile to the 63rd percentile during the hyperopia simulation alone and further
to the 46th percentile following sustained near work, with 52% of the participants falling ‘below
average’ (lower than the 50th percentile). Whilst these levels do not constitute a low level of
functioning, these findings do suggest that a significant proportion of children may perform
substantially below their capability in the presence of simulated hyperopia.
An important finding in the current study was that sustained near work (for a period of 20
minutes) resulted in a small but statistically significant decrement in each of the academic-
related measures included in this study, even in the absence of simulated hyperopia. A previous
study investigating ergonomic demands in primary school classrooms highlighted the finding
that about 50% of the student’s activities were focussed on near tasks such as reading and
writing.33 On average, students were required to maintain near fixation for approximately 16
minutes at any one time.33 Therefore, results of this current study have implications for daily
classroom activity planning by teachers. Regular break times are necessary to avoid visual
fatigue, which may be detrimental to a student’s academic performance in school especially in
the presence of uncorrected hyperopia.
This study demonstrated that bilateral hyperopia simulation of 2.50 D resulted in a significant
decrease in performance for a range of outcome measures, which were exacerbated when
accompanied by sustained near work. This indicates that uncorrected bilateral hyperopia may be
detrimental to academic-related performance in children, especially in the presence of continuous
near fixation. While 2.50 D of hyperopia is considered a relatively low level of refractive error in
young children,8, 9 many children may manifest an even lower degree of uncorrected hyperopia.
Such children may also be affected academically, as observed in this study, but to a lesser extent.
However, the dioptric cut-off level that would provide a negative impact on academic
performance cannot be readily ascertained using the study design adopted here. Importantly, our
results are in accord with previous prescribing guidelines for hyperopia that were primarily
designed to prevent amblyopia and largely rely on clinical intuition; this suggests that refractive
correction for this level of uncorrected hyperopia would potentially benefit children in relation to
academic related activities.16, 20, 29 However, factors such as a child’s current academic
performance at school, amount of near work and binocular vision status should all be taken into
consideration.30 These results additionally indicate that it is important to screen for uncorrected
hyperopia in children in order to minimise potential functional disadvantage at school. Vision
screening protocols should include clinical techniques such as fogging lenses to detect low levels
of hyperopia.
The exact mechanisms that drive the observed decrease in performance across the different
academic-related measures are unclear. One possible explanation for these changes was explored
in this study; namely that increased vergence demand associated with the hyperopic simulation
may contribute to the observed functional decrements. The findings obtained provide some
support for this hypothesis by demonstrating a significant although moderate correlation between
the change in near horizontal heterophoria and the change in several of the outcome measures
(reading accuracy and VIP subtests); this suggests that a greater esophoric shift was associated
with a greater reduction in performance. This implies that the increase in accommodative
demand associated with hyperopia simulation may not be the only factor involved with the
reduction in performance of the academic-related measures and changes to vergence demand
may also be contributing. The relative impacts of accommodation and vergence demand are
difficult to tease out precisely and would be likely to vary from child to child, depending on their
uncorrected vergence posture and fusional vergence reserves. It may not be essential to
separately measure the impact of each of these individually given that they effectively occur as a
single entity; uncorrected hyperopes would experience a relative esophoric shift while they
remain uncorrected. Nonetheless, findings of this study highlight the need for further
investigation to explore these associations more systematically.
An advantage of this study was the use of a repeated measures design which allows for the
control of other potential variables such as intelligent quotient and socioeconomic status which
may differ between participants. This was not accounted for in previous studies investigating the
relationship between uncorrected hyperopia and academic performance.16, 17, 20 However, there
are some potential limitations in this design which need to be considered when interpreting the
findings. While simulation of refractive error is a common research methodology,59-62 the
pseudo-refractive error scenario used in this experiment does not necessarily equate to actual
uncorrected refractive errors in children. In this study the effects observed may be artificially
inflated compared to children with habitual uncorrected hyperopia who may have partially
adapted to their condition. Despite this limitation, the repeated measures simulation approach
allowed us to isolate the impact of hyperopia alone without introducing inter-individual
variations in performance. Another potential limitation of this study was that the participants
were generally skewed towards above average achievers, which may explain the minimal
variation between participants in the results. An additional issue that needs to be taken into
consideration is the working distance that was adopted in this study (40 cm). Even though this is
commonly used in clinical settings,38 some studies have shown that children may adopt a shorter
working distance when performing near tasks (approximately 30 cm).33, 38 This shorter distance
would impose higher accommodative demand and is likely to further worsen the functional
impact of uncorrected hyperopia on measures of academic performance.
The use of non-cycloplegic measures to determine the refractive errors of the participants in this
study may have underestimated any latent hyperopia and therefore influenced the overall amount
of hyperopia that was simulated. However, a fogging technique (+1.50 D bilateral blur) was used
to screen for potential latent hyperopes (which resulted in two potential participants were
excluded from the study). The mean reduction in binocular best corrected visual acuity with the
+1.50 D fogging lens was 0.66 ± 0.07 logMAR (over six lines reduction in acuity). This
reduction in visual acuity suggests that the emmetropic participants in this current study had
minimal latent hyperopia. This is consistent with Fotedar et al.7 who reported that emmetropic 12
years olds showed minimal manifestation of hyperopia following cycloplegia (0.25 D to 0.50 D
more hyperopia).
In summary, this study demonstrated that a low level of simulated hyperopia in children resulted
in impaired performance on a range of academic-related measures, with fatigue from sustained
near work appearing to further exacerbate this effect. Future studies should explore the impact of
different magnitudes of both bilateral and unilateral simulated hyperopia and importantly explore
these relationships in those with habitual uncorrected hyperopia in children. Such studies should
also include children with a wider range of academic ability, particularly those whose
performance is below average for their age or school grade level as they may be disadvantaged to
a greater extent in the presence of uncorrected hyperopia. It would also be useful to further
explore the factors underlying the changes in performance measures observed in this study.
ACKNOWLEDGEMENTS
We thank all the participants who volunteered. We also thank Dr Philippe Lacherez for statistical
analysis assistance. Sumithira Narayanasamy was funded by the Malaysian Ministry of Higher
Education post-graduate scholarship.
REFERENCES
1. Giordano L, Friedman DS, Repka MX, Katz J, Ibironke J, Hawes P, Tielsch JM.
Prevalence of refractive error among preschool children in an urban population: the Baltimore
Pediatric Eye Disease Study. Ophthalmology 2009;116:739-46.
2. Goh PP, Abqariyah Y, Pokharel GP, Ellwein LB. Refractive error and visual impairment
in school-age children in Gombak District, Malaysia. Ophthalmology 2005;112:678-85.
3. He M, Zeng J, Liu Y, Xu J, Pokharel GP, Ellwein LB. Refractive error and visual
impairment in urban children in southern China. Invest Ophthalmol Vis Sci 2004:793-9.
4. Ip JM, Robaei D, Kifley A, Wang JJ, Rose KA, Mitchell P. Prevalence of hyperopia and
associations with eye findings in 6- and 12-year-olds. Ophthalmology 2008;115:678-85.
5. Junghans B, Kiely PM, Crewther DP, Crewther SG. Referral rates for a functional vision
screening among a large cosmopolitan sample of Australian children. Ophthalmic Physiol Opt
2002;22:10-25.
6. Murthy G, Gupta SK, Ellwein LB, Muñoz SR, Pokharel GP, Sanga L, Bachani D.
Refractive error in children in an urban population in New Delhi. Invest Ophthalmol Vis Sci
2002;43:623-31.
7. Fotedar R, Rochtchina E, Morgan I, Wang JJ, Mitchell P, Rose KA. Necessity of
cycloplegia for assessing refractive error in 12-year-old children: a population-based study. Am J
Ophthalmol 2007;144:307-9.
8. O'Donoghue L, McClelland JF, Logan NS, Rudnicka AR, Owen CG, Saunders KJ.
Refractive error and visual impairment in school children in Northern Ireland. Br J Ophthalmol
2010;94:1155-9.
9. Robaei D, Rose K, Ojaimi E, Kifley A, Huynh S, Mitchell P. Visual acuity and the causes
of visual loss in a population-based sample of 6-year-old Australian children. Ophthalmology
2005;112:1275-82.
10. Walline JJ, Carder EDJ. Vision problems of children with individualized education
programs. J Behav Opt 2012;23:87-93.
11. Fulk GW, Goss DA. Relationship between refractive status and teacher evaluations of
school achievement. J Optom Vis Dev 2001;32:80-2.
12. American Optometric Association. Optometric clinical practice guideline care of patient
with learning related vision problems. 2000 [Available at:
http://www.aoa.org/documents/optometrists/CPG-20.pdf. Accessed: September 2013.];
13. Grisham JD, Simons HD. Refractive error and the reading process: A literature analysis. J
Am Optom Assoc 1986;57:44-55.
14. Grosvenor T. Refractive state, intelligence test scores, and academic ability. Am J Optom
Arch Am Acad Optom 1970;45:355-61.
15. Rosner J. The still neglected hyperope. Optom Vis Sci 2004;81:223-4.
16. Rosner J. The relationship between moderate hyperopia and academic achievement: How
much plus is enough? J Am Optom Assoc 1997;68:648-50.
17. Rosner J. Comparison of visual characteristics in children with and without learning
difficulties. Ophthalmic Physiol Opt 1987;64:531-33.
18. Scheiman M, Rouse MW. Optometric management of learning-related vision problems.
St Louis: Mosby-Elsevier; 2006.
19. Shankar S, Evans MA, Bobier WR. Hyperopia and emergent literacy of young children:
Pilot study. Optom Vis Sci 2007;84:1031-8.
20. Williams W, Latif A, Hannington L, Watkins D. Hyperopia and educational attainment in
a primary school cohort. Arch Dis Child 2005;90:150-3.
21. Stewart‐Brown S, Haslum MN, Butler N. Educational attainment of 10-year-old children
with treated and untreated visual defects Dev Med Child Neurol 1985;27:504-13.
22. van Rijn LJ, Krijnen JSM, Nefkens-Molster AE, Wensing K, Gutker E, Knol DL.
Spectacles may improve reading speed in children with hyperopia. Optom Vis Sci 2014;91:397-
403.
23. American Optometric Association. Optometric clinical practice guideline: Care of the
patient with hyperopia. 1997 [ Available at: http://www.aoa.org/documents/CPG-16.pdf.
Accessed: December 2013];
24. Bonilla-Warford N, Allison C. A review of the efficacy of oculomotor vision therapy in
improving reading skills. J Optom Vis Dev 2004;35:108-15.
25. Garzia RP. Vision and reading. St. Louis: Mosby; 1996.
26. Simons HD, Grisham JD. Vision and reading disability: Research problems. J Am Optom
Assoc 1986;57:36-42.
27. Walton H, Schubert D, Clark D, Burke W. Effects of induced hyperopia. Am J Optom
Physiol Opt 1978;55:451-5.
28. Blum HL. Vision Screening for Elementary Schools: The Orinda Study. Berkeley:
University of California Press; 1959.
29. Leat SJ. To prescribe or not to prescribe? Guidelines for spectacle prescribing in infants
and children. Clin Exp Optom 2011;94:514-27.
30. Cotter SA. Management of childhood hyperopia: a pediatric optometrist's perspective.
Optom Vis Sci 2007;84:103-9.
31. Ciner EB. Management of refractive errors in infants, toddlers and preschool children.
Probl Optom 1990;2:394-419.
32. Garzia RP, Nicholson SB, Gaines CS, Murphy MA. Effects of nearpoint visual stress on
psycholinguistic processing in reading. J Am Optom Assoc 1989;60:38-44.
33. Ritty JM, Solan HA, Cool SJ. Visual and sensory-motor functioning in the classroom: A
preliminary report of ergonomic demands. J Am Optom Assoc 1993;60:238-44.
34. Ayton LN, Abel LA, Fricke TR, McBrien NA. Developmental eye movement test: What
is it really measuring? Optom Vis Sci 2009;86:722-30.
35. Spooner ALR, Baddeley AD, Gathercole SE. Can reading accuracy and comprehension
be separated in the Neale Analysis of Reading Ability? Br J Educ Psychol 2004;74:187-204.
36. Flanagan DP, Kaufman AS. Essentials of WISC-IV Assessment. New Jersey: John Wiley
& Sons; 2004.
37. Lowery JP, Joachim A, Olson R, Peel J, Pearce NN. Autorefraction vs. retinoscopy: A
comparison of non-cycloplegic measures in a pediatric sample. J Behav Opt 2005;16:3-8.
38. Rosenfield M, Wong NN, Solan HA. Nearwork distances in children. Ophthalmic
Physiol Opt 2001;21:75-6.
39. McKay M. The Neale Analysis of Reading Ability revised — systematically biased? Br J
Educ Psychol 1996;66:259-66.
40. Neale MD. Neale analysis of reading ability: Manual. Melbourne, Australia.: Australian
Council for Educational Research Limited; 1999.
41. Kail R, Hall LK. Processing speed, naming speed, and reading. Dev Psychol
1994;30:949-54.
42. Wechsler D. Wechsler Intelligence Scale for Children–Fourth Edition: Australian
Standardised Edition (WISC-IV Australian). Sydney, Australia: Psychological Corporation;
2005.
43. Webber A, Wood J, Gole G, Brown B. DEM test, visagraph eye movement recordings,
and reading ability in children. Optom Vis Sci 2011;88:295-302.
44. Garzia RP, Richman JE, Nicholson SB, Gaines CS. A new visual-verbal saccade test:
The Developmental Eye Movement test (DEM). J Am Optom Assoc 1990;61:124-35.
45. Elliott DB. Clinical procedures in primary eye care, 3 ed. Edinburgh, New York
Elsevier/Butterworth Heinemann; 2007.
46. Rabbetts RB. Spherical ametropia. In: Rabbetts RB, editor. Bennett and Rabbetts'
Clinical Visual Optics. London: Elsevier/Butterworth Heinemann, 2007: 67-83.
47. Hayes GJ, Cohen BE, Rouse MW, De Land PN. Normative values for the nearpoint of
convergence of elementary schoolchildren. Optom Vis Sci 1998;75:506-12.
48. Scheiman M, Wick B. Clinical management of binocular vision: Heterophoric,
accommodative, and eye movement disorders. Philadelphia: Lippincott Williams & Wilkins;
2008.
49. Rouse MW, Borsting E, Hyman L, Hussein M, Cotter SA, Flynn M, Scheiman M,
Gallaway M, De Land PN. Frequency of convergence insufficiency among fifth and sixth
graders. The Convergence Insufficiency and Reading Study (CIRS) group. Optom Vis Sci
1999;76:643-9.
50. Scheiman M, Gallaway M, Frantz KA, Peters RJ, Hatch S, Cuff M, Mitchell GL.
Nearpoint of convergence: test procedure, target selection, and normative data. Optom Vis Sci
2003;80:214-25.
51. The Convergence Insufficiency Treatment Trial (CITT) Study Group. The convergence
insufficiency treatment trial: Design, methods, and baseline data. Ophthalmic Epidemiol
2008;15:24-36.
52. Thompkins AC, Binder KS. A comparison of the factors affecting reading performance
of functionally illiterate adults and children matched by reading level. Read Res Quart
2003;38:236-58.
53. Roe B, Smith S, Burns PC. Teaching Reading in Today's Elementary Schools.
Wadsworth: Cengage Learning; 2011.
54. Borsting E. Overview of reading. In: Scheiman M, Rouse MW, ed. Optometric
Management of Learning-related Vision Problems. St Louis: Mosby-Elsevier, 2006: 165-79.
55. Kavale K. Meta-analysis of the relationship between visual perceptual skills and reading
achievement. J Learn Disabil 1982;15:42-51.
56. Chen AH, Bleything W, Lim YY. Relating vision status to academic achievement among
year-2 school children in Malaysia. Optometry 2011;82:267-73.
57. Kulp MT, Schmidt PP. The relation of clinical saccadic eye movement testing to reading
in kindergartners and first graders. Optom Vis Sci 1997;74:37-42.
58. Palomo-Álvarez C, Puell MC. Relationship between oculomotor scanning determined by
the DEM test and a contextual reading test in schoolchildren with reading difficulties. Graefes
Arch Clin Exp Ophthalmol 2009;247:1243-9.
59. Wills J, Gillett R, Eastwell E, Abraham R, Coffey K, Webber A, Wood J. Effect of
simulated astigmatic refractive error on reading performance in the young. Optom Vis Sci
2012;89:271-6.
60. Wood JM, Chaparro A, Anstey KJ, Hsing YE, Johnsson AK, Morse AL, Wainwright SE.
Impact of simulated visual impairment on the cognitive test performance of young adults. Br J
Psychol 2009;100:593-602.
61. Wolffsohn JS, Bhogal G, Shah S. Effect of uncorrected astigmatism on vision. J Cataract
Refract Surg 2011;37:454-60.
62. Little JA, Molloy J, Saunders KJ. The differing impact of induced astigmatic blur on
crowded and uncrowded paediatric visual acuity chart results. Ophthalmic Physiol Opt
2012;32:492-500.
FIGURE LEGENDS
Figure 1: Mean reading performance; rate (A), accuracy (B) and comprehension (C) before and
after the 20 minute sustained near work task with and without 2.50 D bilateral hyperopia
simulation (error bars represent the standard error of the mean).
Figure 2: Mean VIP performance; Coding (A) and Symbol Search (B) before and after the 20
minute sustained near work task with and without 2.50 D bilateral hyperopia simulation (error
bars represent the standard error of the mean).
Figure 3: Mean DEM performance; vertical time (A), horizontal time (B) and ratio (C) before
and after the 20 minute sustained near work task with and without 2.50 D bilateral hyperopia
simulation (error bars represent the standard error of the mean).
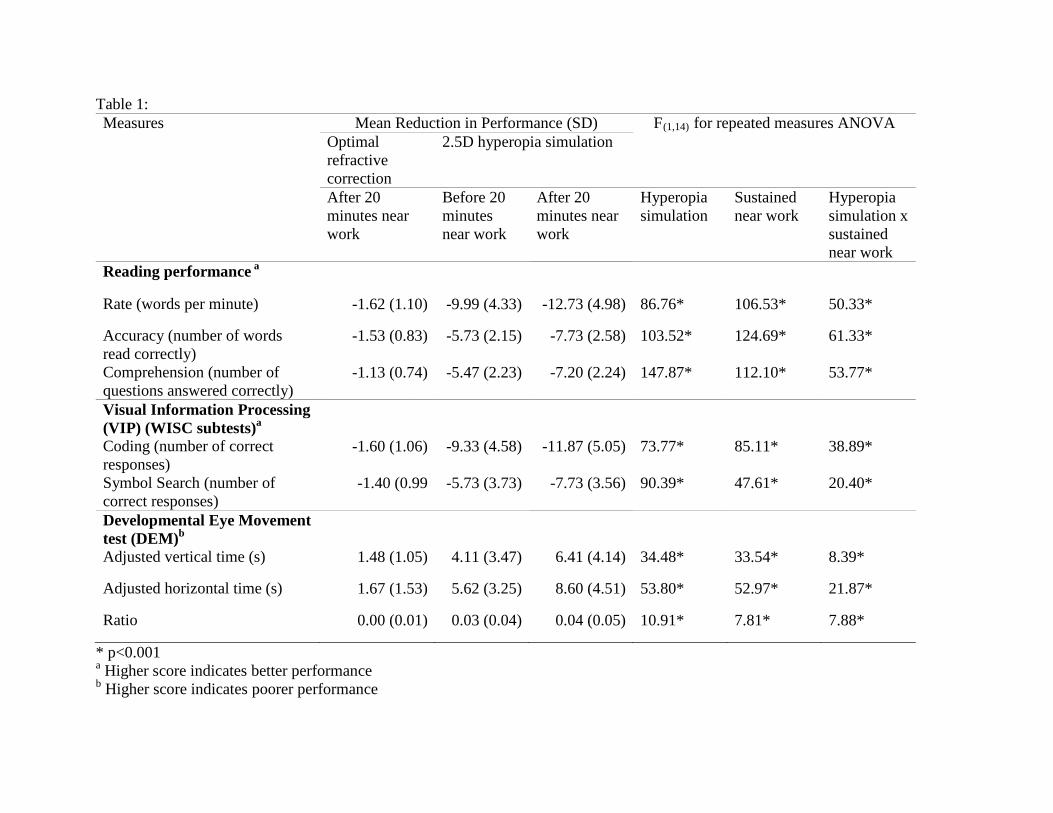
Table 1: Measures
Mean Reduction in Performance (SD) F(1,14) for repeated measures ANOVA Optimal refractive correction
2.5D hyperopia simulation
After 20 minutes near work
Before 20 minutes near work
After 20 minutes near work
Hyperopia simulation
Sustained near work
Hyperopia simulation x sustained near work
Reading performance a
Rate (words per minute) -1.62 (1.10) -9.99 (4.33) -12.73 (4.98) 86.76* 106.53* 50.33*
Accuracy (number of words read correctly)
-1.53 (0.83) -5.73 (2.15) -7.73 (2.58) 103.52* 124.69* 61.33*
Comprehension (number of questions answered correctly)
-1.13 (0.74) -5.47 (2.23) -7.20 (2.24) 147.87* 112.10* 53.77*
Visual Information Processing (VIP) (WISC subtests)a
Coding (number of correct responses)
-1.60 (1.06) -9.33 (4.58) -11.87 (5.05) 73.77* 85.11* 38.89*
Symbol Search (number of correct responses)
-1.40 (0.99 -5.73 (3.73) -7.73 (3.56) 90.39* 47.61* 20.40*
Developmental Eye Movement test (DEM)b
Adjusted vertical time (s) 1.48 (1.05) 4.11 (3.47) 6.41 (4.14) 34.48* 33.54* 8.39*
Adjusted horizontal time (s) 1.67 (1.53) 5.62 (3.25) 8.60 (4.51) 53.80* 52.97* 21.87*
Ratio 0.00 (0.01) 0.03 (0.04) 0.04 (0.05) 10.91* 7.81* 7.88*
* p<0.001 a Higher score indicates better performance b Higher score indicates poorer performance
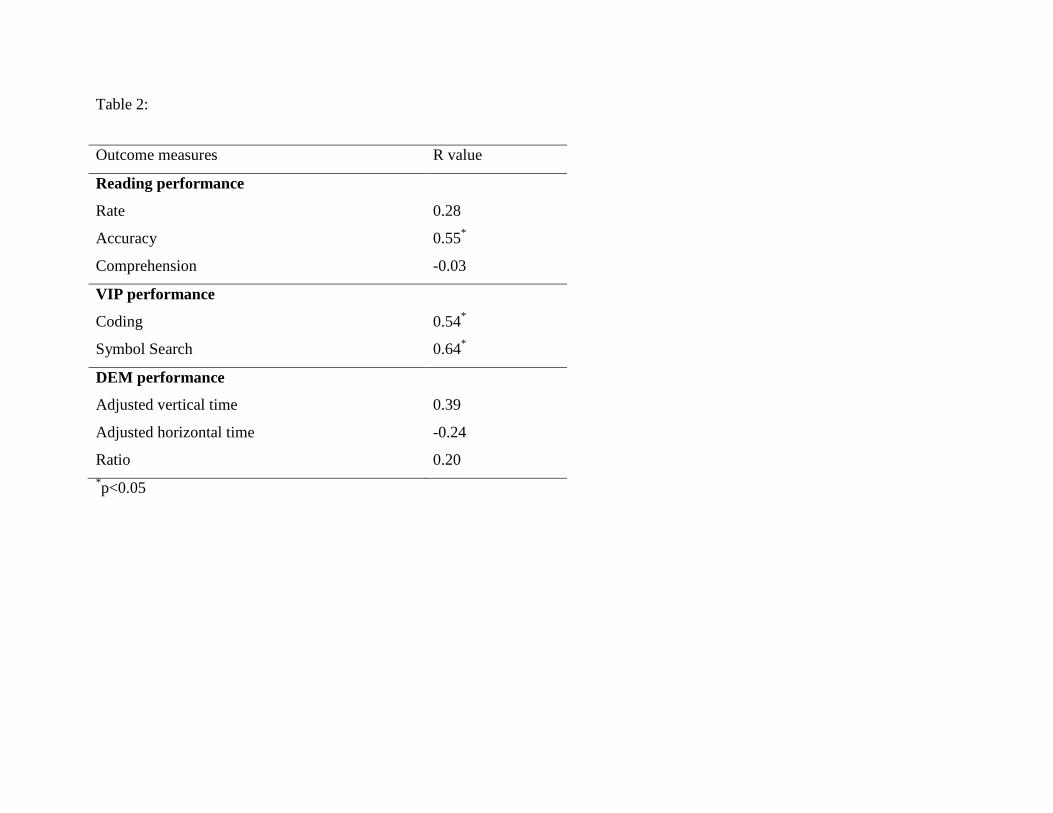
Table 2:
Outcome measures R value
Reading performance
Rate
Accuracy
Comprehension
0.28
0.55*
-0.03
VIP performance
Coding
Symbol Search
0.54*
0.64*
DEM performance
Adjusted vertical time
Adjusted horizontal time
Ratio
0.39
-0.24
0.20 *p<0.05
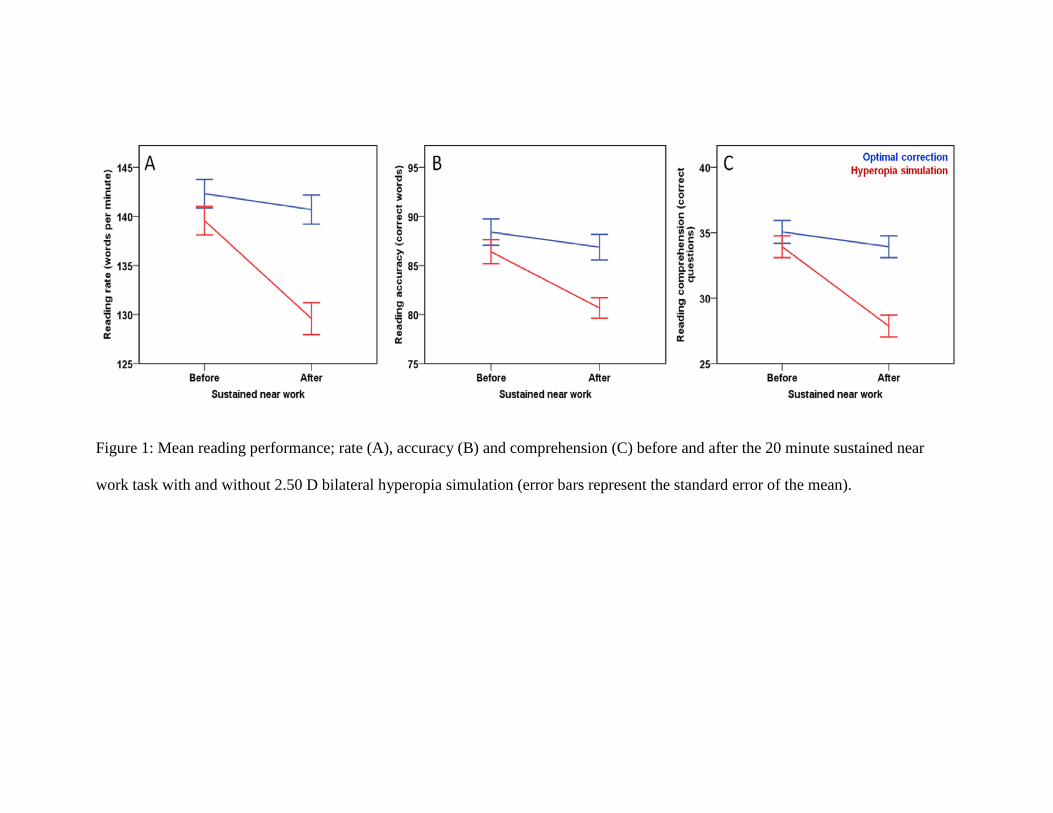
Figure 1: Mean reading performance; rate (A), accuracy (B) and comprehension (C) before and after the 20 minute sustained near
work task with and without 2.50 D bilateral hyperopia simulation (error bars represent the standard error of the mean).
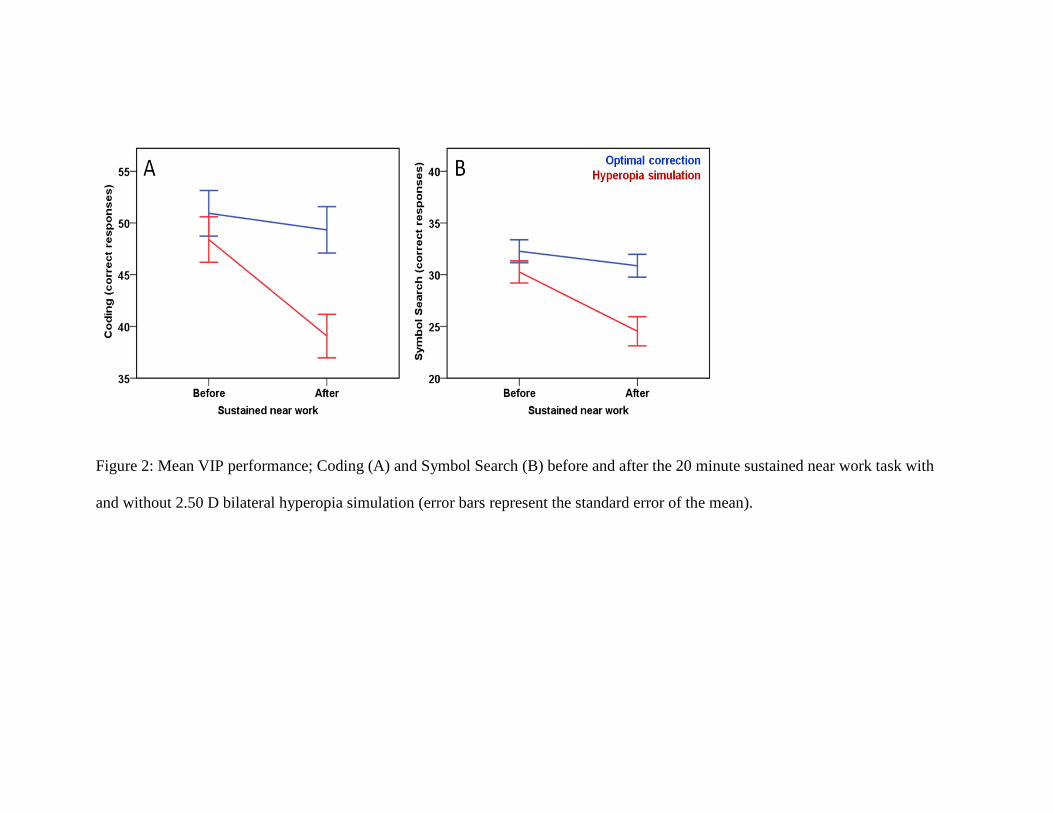
Figure 2: Mean VIP performance; Coding (A) and Symbol Search (B) before and after the 20 minute sustained near work task with
and without 2.50 D bilateral hyperopia simulation (error bars represent the standard error of the mean).
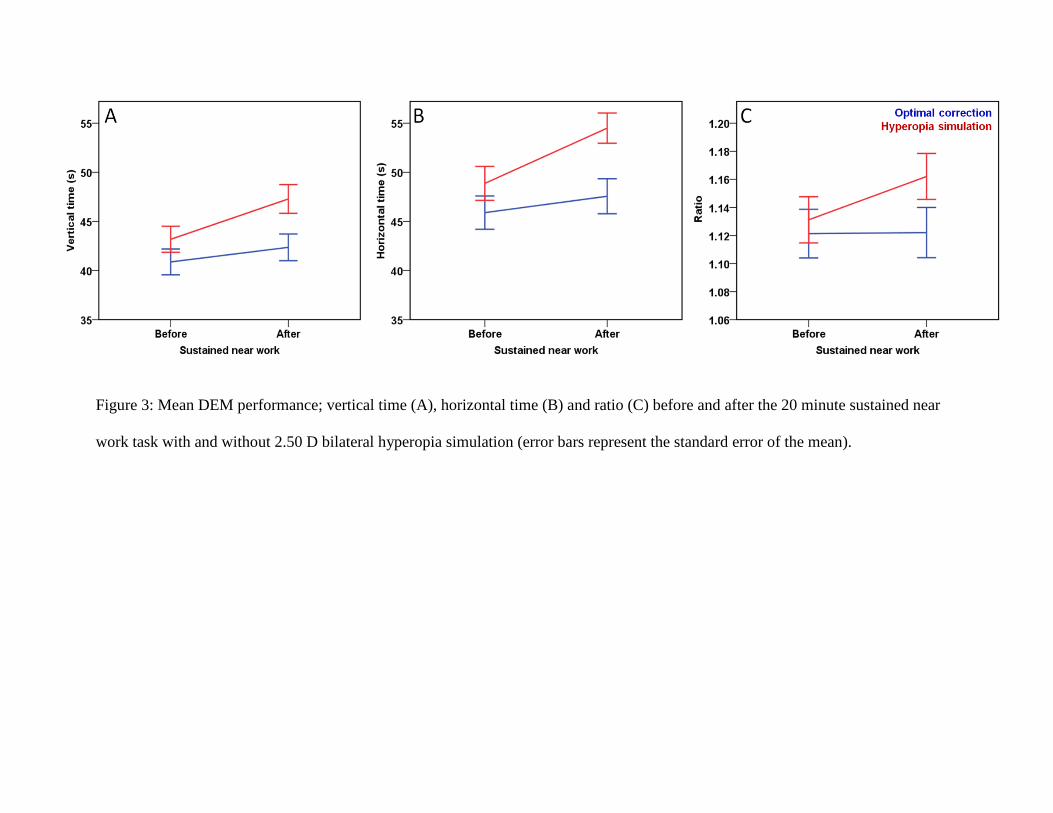
Figure 3: Mean DEM performance; vertical time (A), horizontal time (B) and ratio (C) before and after the 20 minute sustained near
work task with and without 2.50 D bilateral hyperopia simulation (error bars represent the standard error of the mean).
