c copyright ieee 2012 notice changes introduced as a
TRANSCRIPT

This is the author’s version of a work that was submitted/accepted for pub-lication in the following source:
Ingram, David M.E., Schaub, Pascal, Campbell, Duncan A., & Taylor,Richard R. (2013) Performance analysis of PTP components for IEC61850 process bus applications. IEEE Transactions on Instrumentationand Measurement, 62(4), pp. 710-719.
This file was downloaded from: http://eprints.qut.edu.au/53585/
c© Copyright IEEE 2012
Personal use of this material is permitted. However, permission toreprint/republish this material for advertising or promotional purposes orfor creating new collective works for resale or redistribution to servers orlists, or to reuse any copyrighted component of this work in other worksmust be obtained from the IEEE.
Notice: Changes introduced as a result of publishing processes such ascopy-editing and formatting may not be reflected in this document. For adefinitive version of this work, please refer to the published source:
http://dx.doi.org/10.1109/TIM.2013.2245188

IEEE TRANSACTIONS ON INSTRUMENTATION AND MEASUREMENT 1
Performance Analysis of PTP Components forIEC 61850 Process Bus Applications
David M. E. Ingram, Senior Member, IEEE, Pascal Schaub, Duncan A. Campbell, Member, IEEE,and Richard R. Taylor, Member, IEEE
Abstract—New substation automation applications, such assampled value process buses and synchrophasors, require sam-pling accuracy of 1 µs or better. The Precision Time Protocol(PTP), IEEE Std 1588, achieves this level of performance andintegrates well into Ethernet based substation networks. Thispaper takes a systematic approach to the performance evaluationof commercially available PTP devices (grandmaster, slave, trans-parent and boundary clocks) from a variety of manufacturers.The “error budget” is set by the performance requirements ofeach application. The “expenditure” of this error budget by eachcomponent is valuable information for a system designer. Thecomponent information is used to design a synchronization sys-tem that meets the overall functional requirements. The quantita-tive performance data presented shows that this testing is effectiveand informative. Results from testing PTP performance in thepresence of sampled value process bus traffic demonstrate thebenefit of a “bottom up” component testing approach combinedwith “top down” system verification tests. A test method that usesa precision Ethernet capture card, rather than dedicated PTPtest sets, to determine the Correction Field Error of transparentclocks is presented. This test is particularly relevant for highlyloaded Ethernet networks with stringent timing requirements.The methods presented can be used for development purposes bymanufacturers, or by system integrators for acceptance testing.A sampled value process bus was used as the test applicationfor the systematic approach described in this paper. The testapproach was applied, components were selected, and the systemperformance verified to meet the application’s requirements.Systematic testing, as presented in this paper, is applicable toa range of industries that use, rather than develop, PTP for timetransfer.
Index Terms—Ethernet networks, IEC 61850, IEEE 1588,performance evaluation, power transmission, protective relaying,Precision Time Protocol, smart grids, time measurement
I. INTRODUCTION
T IME synchronization has been used in substations forconsistent event time-stamping for some time [1], [2].
This consistency is required when investigating power systemincidents. More accurate time-stamping is now required forphasor monitoring and for digital process buses [3]. New timesynchronization systems, such as the Precision Time Protocol(PTP) [4], are proposed as a means of achieving the high levelof performance required by these new applications [5], [6].PTP is a bidirectional networked time transfer protocol, andcan be used with a variety of underlying network protocols.
David Ingram, Duncan Campbell and Richard Taylor are with the School ofElectrical Engineering and Computer Science, Queensland University of Tech-nology, Brisbane, Queensland 4000, Australia (email: [email protected];[email protected]; [email protected]).
Pascal Schaub is with Powerlink Queensland, Virginia, Queensland 4014,Australia.
The International Electrotechnical Commission (IEC) SmartGrid Vision and US National Institute of Standards andTechnology (NIST) standardization “roadmaps” recommendthe use of PTP for high accuracy time synchronization insubstations and IEC 61850 for substation automation andprotection [7], [8].
The IEC 61850 suite of substation automation standardsprovide an inter-operable communication model that meetsexisting needs, while supporting future developments as tech-nology improves. IEC 61850 communication profiles arebased, where possible, on existing international standards.IEC 61850-9-2 specifies the requirements for an inter-operableSampled Value (SV) process bus.
This paper takes a systematic approach to determiningwhether PTP, when used with the recently published “powersystem profile” [9], is a robust means of synchronizing a SVprocess bus. The operating environment for substation automa-tion is onerous, with any failure of the synchronizing systemdisabling SV based protection of high voltage transmissionlines and transformers. SV merging units generate a largeamount of data (5.5 Mb/s per merging unit, required for eachthree phase set of current transformers). The “error budget”is set by the performance requirements of the application.The “expenditure” of the error budget by each component isvaluable information for a system designer. The componentinformation is used to design a synchronization system thatmeets the overall functional requirements, which in this caseis the synchronization of SV process bus sampling throughouta substation.
The methodology presented in this paper provides a seriesof tests that can be used by system designers to evaluate timingcomponents. The quantitative performance data presented inSection IV demonstrates that such testing is effective andinformative. A comprehensive test of each grandmaster witheach slave clock identifies the relative merit of each device.Results from testing PTP performance in the presence ofSV process bus traffic demonstrate the benefit of a “bottomup” component testing approach combined with “top down”system verification tests.
Power system applications for PTP have been presented ina number of papers [5], [10]. The commercial implementationof process bus substations using PTP to synchronize sam-pling [11] has made this use of PTP an area of interest [6],[12]. Synchrophasors enable wide area monitoring and controlof power systems with the aim of preventing wide-spread out-ages, however stringent phase accuracy requirements demandaccurate sampling. The use of PTP in this application has been

IEEE TRANSACTIONS ON INSTRUMENTATION AND MEASUREMENT 2
discussed by a number of researchers [13], [14].Testing of PTP devices is not new, with transparent clock
performance investigated by several groups [15]–[17]. Testsof the ability of transparent clocks to accurately measurethe residence time of PTP messages have been described byBurch et al. [15] and Cosart [16], however these researchersused specialized PTP test equipment. The method presentedin Section III uses a precision Ethernet capture card and agrandmaster clock, which is a more cost effective solution. Thenon-PTP traffic in a process bus is predominantly multicast,and this affects the queuing behavior of Ethernet switches, andtherefore the results in this paper build upon the work of [16],[17].
Background information, including substation definitionsand details of timing requirements, are presented in Section II.The experimental methods for assessing synchronizing per-formance and transparent clock operation are presented inSection III, and the corresponding results in Section IV. Theimpact of these results on PTP for process bus applicationsare discussed in Section V, with final conclusions presentedin Section VI.
II. BACKGROUND
A. Substation Definitions
A “process bus” carries waveform measurements, digitalstatus information, and transduced analog data from the highvoltage equipment in a substation (for example bus bars,circuit breakers, isolators, earth switches, power transformers,current transformers and voltage transformers) to the substa-tion automation system (SAS), and conveys commands fromthe SAS to high voltage equipment in the switchyard (e.g.circuit breakers, disconnectors and transformer tap changercontrols), over a digital network. Merging units convert asignal proportional to the input signal (which may be analogor digital) into a standard data format for transmission over theprocess bus. The inputs to a merging unit may be conventionalcurrent and voltage transformers (in the case of a Stand AloneMerging Unit), or the output a non-conventional instrumenttransformers secondary converter.
Some protection schemes, in particular transformer pro-tection, require inputs from multiple merging units or fromprocess bus and conventional analog inputs. The current andvoltage samples from different sources need to be synchro-nized by protection relays. Any synchronizing error, regardlessof the method used, manifests as phase error, and this in turnresults in “spill current” in differential protection schemes.This increases the chance of undesirable false tripping. Fig.1 illustrates two examples of transformer protection wheresynchronization is required.
B. Synchronization Requirements
Process buses based on IEC 61850-9-2 must meet samplingaccuracy requirements specified by IEC 61850-5 [18]. Table Ilists the timing classes from edition 1 of this standard thatare relevant to process bus networks, along with the proposedclasses in the draft of edition 2. Protection class P2 is intendedfor transmission substation bays, and class P3 for transmission
Fig. 1. Transformer protection with (a) two merging units (MU) and (b) onemerging unit and one conventional input.
TABLE ISAMPLED VALUE TIME ACCURACY CLASSES FROM IEC 61850-5.
ProtectionClass
RequiredAccuracy
Edition 1TimingClass
Edition 2TimingClass
P1 ±25 µs T3 TS3
P2 ±4 µs T4 TS4
P3 ±1 µs T5 TS5
substation bays with high accuracy requirements. Class P1 isfor distribution substations.
A widely adopted implementation of IEC 61850-9-2, termed“9-2 Light Edition” or “9-2LE”, specifies that sample syn-chronization use one pulse per second (1-PPS) signals, andthat these have an accuracy that is better than 1 µs [19]. This,in combination with pulse propagation delays and samplingerrors, ensures that overall sampling error is within the ±4 µsrequired by timing class T4/TS4.
Phasor monitoring based on IEEE Std C37.118 requiresthat the total vector error (magnitude and phase) be less than1% [20]. A synchronizing accuracy of 1 µs is proposed, as thisallows for phase and magnitude errors in the source instrumenttransformers [2]. This aligns the synchronizing requirementsof SV process buses and phasor monitoring, and sets theperformance requirement that is used in this paper.
C. Performance Metrics
1-PPS synchronizing pulses are currently used to synchro-nize phasor monitoring units and merging units. The rapidupdate that such a signal provides makes jitter more significantthan wander when looking at error. The direct comparison of1-PPS outputs is a well established technique for evaluatingthe effectiveness of PTP for power system applications [6],[21]–[23]. Time errors are presented as time series, histograms,density functions, or a combination of these. This statisticalanalysis gives an understanding of the ongoing performanceof the synchronizing system, and can identify operationalaberrations. The errors may be between grandmaster andslave clocks, or between slave clocks synchronized to thesame grandmaster. The use of PTP to synchronize a sampledvalue process bus is the focus of this paper, and thereforethe “instantaneous” time error between the 1-PPS outputs of

IEEE TRANSACTIONS ON INSTRUMENTATION AND MEASUREMENT 3
grandmaster and slave clocks is the performance metric thatwill be used.
The “Correction Factor Error” (CFE) was defined by Burchet al. to be the difference between the actual residence timeand the Correction field value [15]. A key observation wasthat a CFE that varies with latency indicates an error in thetransparent clock’s estimate of the frame residence time. Thismetric is used in this paper to determine the performance oftransparent clocks under a variety of network load conditions.
III. METHOD
The systematic approach to evaluating the performance ofPTP devices uses a variety of tests. These tests can be appliedto single devices, to the system as a whole, or a combinationof the two. The tests described here are not exhaustive, anddo relate to the application under investigation.
The test methods used to demonstrate the approach fall intotwo classes. The first class was assessment of 1-PPS synchro-nizing accuracy, and included grandmaster, slave, transparentand boundary clocks. These tests provided a methodologyfor system integrators to follow when evaluating productsfor substation timing. The second class of tests examinedthe ability of transparent clocks to compensate for latencyintroduced by other network traffic on the shared process bus,in particular SV traffic in excess of 50 Mb/s.
The PTP parameters specified in Table 1 of the PowerProfile [9] were used for these tests. The key parameters were1 s update rates for Sync, Announce and PathDelay messages.Layer 2 multicast messages were used as the transport andthe network speed was fixed at 100 Mb/s. The peer delaymechanism was used for path delay measurement.
Commercially available PTP devices were used in the devel-opment of these tests. The results in this paper provide a surveyof performance, as well as demonstrating the application ofthe test methods. The grandmaster and slave clocks are rep-resented by host names (PTPx), and the Ethernet switches arerepresented by a code letter (H, M, N and O). A total of threegrandmasters, four slave clocks and four Ethernet switches(capable of transparent and boundary clock operation) wereused in these tests.
A. Grandmaster and Slave Clock Sync Accuracy
The test method used to assess synchronizing performanceis an established method, and uses the 1-PPS electrical out-puts of the master and slave clocks. A digital oscilloscope(Tektronix DPO2014) sampling at 109 samples/s calculated thetime difference (which is referred to as “delay” in these results)between the reference (grandmaster) and slave clock over a30 minute period. A computer recorded each measurement(1800 in total for each test) for statistical analysis. Fig. 2shows this arrangement. Various combinations of grandmasterand slave clocks were used to observe how the selection ofclock device influences performance. A cross-over twisted pairEthernet cable was used to connect the grandmaster and slaveclock to eliminate the influence of other network traffic onsynchronizing performance.
Fig. 2. Test equipment used for assessing synchronizing accuracy testing,based on a digital oscilloscope.
Fig. 3. Synchronizing testing with multiple transparent clocks.
B. Effect of Transparent and Boundary Clocks
Peer-to-peer transparent clocks or boundary clocks thatsupport the peer-delay mechanism are required to distributePTP messages when the C37.238 power profile is used.Experiments were conducted that examined the effect theseapplication specific Ethernet switches have on synchronizingperformance.
The influence of each transparent clock and boundary clockwas assessed by placing the Ethernet switch under test betweenthe grandmaster and slave clocks, in place of the cross-over cable. No other network traffic was introduced to theswitch, and switch management links were disconnected forthe duration of each test. Each test ran for fifteen minutes,generating 900 1-PPS delay measurements. The grandmasterand slave clock used for these tests were the pair that had thebest synchronizing performance when directly connected.
Ideally transparent clocks will estimate the path delays andframe residence times with minimal error. Errors in theseestimates result in synchronizing error between grandmastersand slave clocks. Annex B of IEEE Std C37.238 specifies thatthe worst-case time error between the standard time sourceand a slave device be ±1 µs, with up to 16 network hopsand 80% line-rate network traffic [9]. Grandmaster error isallocated ±0.2 µs and network error is the remaining ±0.8 µs.This limits each transparent clock to introducing no more than50 ns of error in each of the 16 hops (15 identical transparentclocks, 1 grandmaster and 1 slave clock).
Fig. 3 shows the connections for the test with four trans-parent clocks. Two, three and four transparent clocks in serieswere each tested to determine the effect of cascaded switches,and to see if the standalone responses could be used to predictthe behavior of cascaded switches. All Ethernet connectionswere fixed at 100 Mb/s, even though some switches supported1 Gb/s. The four switches were also configured as boundaryclocks, and tested using the same arrangements.

IEEE TRANSACTIONS ON INSTRUMENTATION AND MEASUREMENT 4
Fig. 4. Experimental equipment used to measure PTP Sync message residencetime, based on an Ethernet tap and an Endace DAG7.5G4 capture card.
C. Estimation of Transparent Clock Residence Time
Rather than use a packet injection test set or specializedslave clock, the approach taken was to simultaneously capturethe output of a conventional grandmaster using an in-line Eth-ernet tap (NetOptics 10/100/1000 Tap) and the output of thetransparent clock under test with a precision Ethernet capturecard (Endace DAG7.5G4), as shown in Fig. 4. The DAG cardincludes a precision time-stamping unit that was synchronizedand syntonized (frequency locked) to the grandmaster’s 1-PPSoutput. This improves the DAG card’s time-stamping accuracy,and minimizes drift [24].
A third Ethernet port on the DAG card was used toinject multicast traffic into the transparent clock to simulateother network traffic. VLAN filtering was used to protectthe grandmaster from the multicast traffic, and this is recom-mended practice with multiple multicast protocols in a processbus [25]. The multicast traffic was injected into the switches at1000 Mb/s to simulate the simultaneous arrival of SV frames,thereby increasing latency, but the total load did not exceed100 Mb/s. The exception to this was Switch M which onlyhad Fast Ethernet ports, and therefore traffic injection was at100 Mb/s.
The DAG card time-stamped the frames entering and leav-ing the transparent clock with a common clock, giving ameasurement precision of 8 ns. The 1-PPS input to the DAGcard is used for syntonization which improves the accuracyof the time-stamping clock. This could be supplied by astable local 1-PPS source, such as a GPS receiver, enablingtransparent clock performance to be measured in the field. Thisis a benefit of this method compared to those used in [15] and[16].
The DAG card combines frames captured from all portsinto one “ERF” file. The PTP Correction field contents wereextracted from PTP Sync and Follow-Up frames entering andleaving the transparent clock, and the change in the Correctionfield values calculated. This allowed for transparent clocks tobe installed between the grandmaster and transparent clock un-der test, and for one or two step transparent clocks to be used.One step transparent clocks update the Sync message, whiletwo step transparent clocks update the Follow-Up message.
Four different transparent clocks were tested, and five mul-ticast network loads were applied to each transparent clock:no background traffic, six 9-2LE merging units, 21 9-2LEmerging units, 25 Mb/s random length frames and 95 Mb/srandom length frames. The length of the random frames wasuniformly distributed between 64 and 1500 bytes. Eight PTPSync messages were transmitted per second by the grandmaster
Fig. 5. Connection of three transparent clocks with SV traffic injection tosimulate a loaded process bus network.
and frames were captured for 10 minutes (approximately 4880PTP Sync and Follow-Up messages). The sync rate was fasterthan that specified in C37.238, but enabled a greater samplesize to be collected in a reasonable time.
D. PTP and Sampled Values
Results from testing the transparent clocks individuallyshow that three of the four transparent clocks accuratelyestimated switch residence time. These three switches (H,M and N) were then connected in series and synthetic SVtraffic was injected into the first transparent clock at 1 Gb/sto simulate the simultaneous arrival of frames from multiplemerging units. Fig. 5 shows the arrangement of devices. 1-PPSdelays between the grandmaster and slave clock were recordedfor 15 minutes (900 samples for each test).
Prioritization and VLAN separation using IEEE Std 802.1Qtagging was used, with SV and PTP frames placed in separateVLANs. SV frames were assigned a priority of 4 for all tests.
Two sets of experiments were conducted to determine theeffect of load and priority on synchronizing performance:
1) The effect of SV traffic on PTP performance was as-sessed by injecting six levels of SV traffic into the testsystem: no traffic, 1 merging unit(MU), 3 MUs, 6 MUs,12 MUs and 21 MUs. Previous testing has shown that21 SV transmissions are the maximum that 100 Mb/sEthernet can accommodate without dropping frames (fora 50 Hz power system). PTP frames had a fixed priorityof 4 for the loading tests.
2) The effect of prioritization on PTP performance wasexamined by varying the 802.1Q priority of PTP frameswhile keeping the SV frame priority fixed at 4. Twolevels of SV traffic were injected (12 MUs and 21 MUs)for each of the three PTP priorities: 2, 4 and 7.
IV. RESULTS
This section presents the results of the experiments de-scribed in Section III, and in the same order.
A. Effect of Clock Selection
The standard deviation and range of delays for each com-bination of grandmaster and slave clock are summarized inTable II. Time series plots for each grandmaster and slaveclock combination are shown in Fig. 6, with a common y-axis

IEEE TRANSACTIONS ON INSTRUMENTATION AND MEASUREMENT 5
Fig. 6. Thirty minute time series of the delay between 1-PPS outputs for each combination of directly connected grandmaster and slave clock, for threemodels of grandmaster and four models of slave clocks.
TABLE IISUMMARY OF JITTER IN GRANDMASTER/SLAVE CLOCK SYNCHRONIZING
PERFORMANCE.
Slave PTPA PTPB PTPC PTPF
GM
PTPA — 81.2 ns 46.6 ns 69.4 ns
PTPC 77.9 ns 28.5 ns — 6.58 ns
PTPD 101 ns 46.5 ns 41.7 ns 34.8 ns
(a) Standard deviation.
Slave PTPA PTPB PTPC PTPF
GM
PTPA — 705 ns 304 ns 798 ns
PTPC 715 ns 156 ns — 42.5 ns
PTPD 670 ns 255 ns 232 ns 200 ns
(b) Range.
range for all plots. The rows represent grandmaster clocks andthe columns represent slave clocks in the table and the figure.
The results in Fig. 6 show that PTP devices intendedfor power system use are interoperable, as each grandmasterand slave clock combination successfully synchronized. Theworst performing combination of grandmaster and slave clock,PTPD/PTPA, had jitter ten times worse than that of bestperforming combination, PTPC/PTPF. This shows that theclocks selected for a substation timing system influence itsperformance.
Fig. 7. Sample distributions showing the effect of transparent clocks on thebest performing grandmaster/slave clock combination.
B. Effect of Transparent Clocks
The majority of transparent clocks did not increase thejitter in the measured delay, but all transparent clocks otherthan switch M introduced an offset to the 1-PPS delay.Fig. 7 shows the distribution of 1-PPS delay for the fourtransparent clocks, with the direct-connect (cross-over cable)result included for comparison. Switch O introduced additionaljitter to the distribution of delay, and the time series plot of the1-PPS delay between grandmaster and slave clock in Fig. 8shows a periodic disturbance. This cyclic pattern, present ina single transparent clock, suggests that there is a devicespecific issue and not a weakness in the standard. Selectionof a grandmaster and slave clock that gave a 1-PPS delay thathas low noise greatly assists the identification of perturbationsintroduced by transparent clocks, such as that identified inFig. 8.

IEEE TRANSACTIONS ON INSTRUMENTATION AND MEASUREMENT 6
Fig. 8. Time series of 1-PPS delay with the best grandmaster/slave clockpairing, showing a periodic disturbance introduced by switch O.
Fig. 9. Sample distributions showing the effect of four boundary clocks onsynchronizing performance.
C. Effect of Boundary Clocks
The transparent clock tests were repeated with the fourswitches in boundary clock mode, and the sample distributionsof delay are shown in Fig. 9. The range of the x-axes in Fig. 7and Fig. 9 are the same (215 ns) to aid comparison.
The jitter in the observed delay is similar to the directlyconnected case for each boundary clock. Switch O performssignificantly better as a boundary clock, however the perfor-mance of switch M is degraded as a boundary clock.
D. Multiple Switches in Series
The four transparent clocks were connected in series, oneby one, to assess the effect of multiple transparent clocks onsynchronizing performance. Fig. 10 shows that one to threetransparent clocks did not affect the offset significantly, but thefourth transparent clock did. It is significant that adding switchO to the chain increased the median delay by 434 ns, butwhen switch O was used by itself the median delay decreasedby 114 ns. The offsets introduced by the transparent clocksdo not appear to be additive, complicating system design.Performance testing of a PTP system should therefore beundertaken on the finished network, rather than combing theerrors from the building blocks.
The four transparent clocks were reconfigured as boundaryclocks to determine whether timing errors accumulated, result-ing in degraded performance. The difference in performancebetween four transparent clocks and boundary clocks is sig-nificant, with the large offset present in the transparent clocks
Fig. 10. Sample distributions showing the effect of multiple transparentclocks on synchronizing performance, with the directly connected case pro-vided for reference.
Fig. 11. Sample distributions for four boundary clocks in series, with fourtransparent clocks in series shown for comparison.
being eliminated. Switch O introduced significant jitter as atransparent clock, which is apparent in Fig. 7, but did not doso when operating as a boundary clock. The results shownin Fig. 11 suggest that switch O does not respond negativelyto upstream clocks when in boundary clock mode. Furtherresearch is required to determine the optimum combinationof transparent clocks and boundary clocks for the switchesavailable in the process bus test bed.
E. Transparent Clock Correction Accuracy
The four network loads (six merging units, 21 merging units,25 Mb/s random length frames and 95 Mb/s random lengthframes) increased the Sync message switch residence times.The no-load and 25 Mb/s random length frames cases havebeen selected to best demonstrate the effect of backgroundtraffic on latency and CFE. The other cases give similar results,with different ranges for latency. The random length framesrepresent TCP traffic on the process bus, which may be froma variety of sources. 25 Mb/s is equivalent to approximatelysix merging units.
Table III summarizes the results shown in Fig. 12. The meanand range of CFE did not vary when background traffic wasadded for switches H, M and N; however switch O’s CFEhas increased range when the background traffic was applied.The CFE for switch O is dependent on latency, with the
IEEE TRANSACTIONS ON INSTRUMENTATION AND MEASUREMENT 7
Fig. 12. Transparent clock Correction field accuracy, with (a) no backgroundtraffic and (b) 25 Mb/s random length frames background traffic.
TABLE IIICORRECTION FIELD ERROR STATISTICS FOR FOUR TRANSPARENT
CLOCKS, WITH AND WITHOUT TRAFFIC.
TC No Traffic 25% Random Traffic
Mean Range R2 Mean Range R2
H –205 ns 184 ns 0.000 –187 ns 218 ns 0.000
M –572 ns 177 ns 0.009 –568 ns 173 ns 0.000
N –549 ns 179 ns 0.000 –540 ns 170 ns 0.000
O –388 ns 481 ns 0.237 –404 ns 674 ns 0.322
negative slope apparent in Fig. 12 indicating the transparentclock is over-estimating the frame residence time (Correctionexceeds the actual residence time). The slope of the pointcloud is –1.8×10⁻⁵, suggesting the reference oscillator in thistransparent clock is running fast by 18 parts per million. TheR2 (coefficient of determination) values in Table III confirmthat switch O has some linear dependency between CFE andlatency, and that switches M, M and N do not.
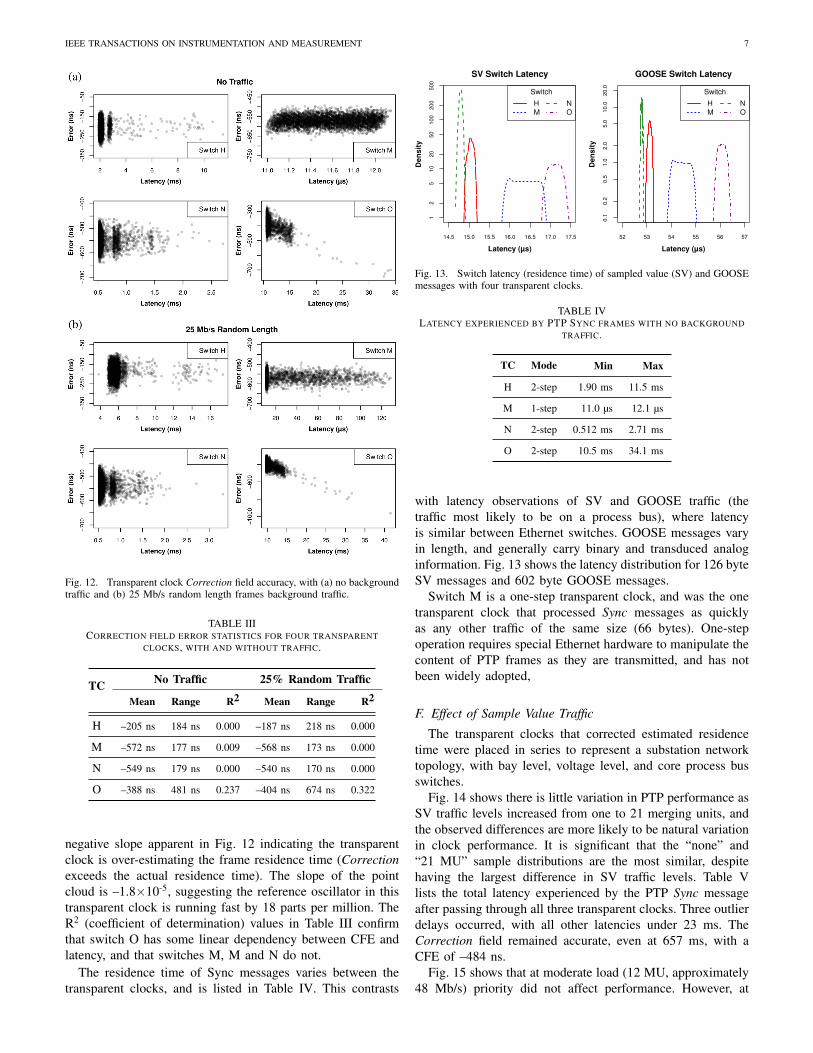
The residence time of Sync messages varies between thetransparent clocks, and is listed in Table IV. This contrasts
Fig. 13. Switch latency (residence time) of sampled value (SV) and GOOSEmessages with four transparent clocks.
TABLE IVLATENCY EXPERIENCED BY PTP SYNC FRAMES WITH NO BACKGROUND
TRAFFIC.
TC Mode Min Max
H 2-step 1.90 ms 11.5 ms
M 1-step 11.0 µs 12.1 µs
N 2-step 0.512 ms 2.71 ms
O 2-step 10.5 ms 34.1 ms
with latency observations of SV and GOOSE traffic (thetraffic most likely to be on a process bus), where latencyis similar between Ethernet switches. GOOSE messages varyin length, and generally carry binary and transduced analoginformation. Fig. 13 shows the latency distribution for 126 byteSV messages and 602 byte GOOSE messages.
Switch M is a one-step transparent clock, and was the onetransparent clock that processed Sync messages as quicklyas any other traffic of the same size (66 bytes). One-stepoperation requires special Ethernet hardware to manipulate thecontent of PTP frames as they are transmitted, and has notbeen widely adopted,
F. Effect of Sample Value Traffic
The transparent clocks that corrected estimated residencetime were placed in series to represent a substation networktopology, with bay level, voltage level, and core process busswitches.
Fig. 14 shows there is little variation in PTP performance asSV traffic levels increased from one to 21 merging units, andthe observed differences are more likely to be natural variationin clock performance. It is significant that the “none” and“21 MU” sample distributions are the most similar, despitehaving the largest difference in SV traffic levels. Table Vlists the total latency experienced by the PTP Sync messageafter passing through all three transparent clocks. Three outlierdelays occurred, with all other latencies under 23 ms. TheCorrection field remained accurate, even at 657 ms, with aCFE of –484 ns.
Fig. 15 shows that at moderate load (12 MU, approximately48 Mb/s) priority did not affect performance. However, at

IEEE TRANSACTIONS ON INSTRUMENTATION AND MEASUREMENT 8
Fig. 14. Sample distributions for three transparent clocks in series, withsix different 9-2LE sampled value (SV) traffic levels. PTP and sampled value802.1Q priority both set to 4.
TABLE VLATENCY EXPERIENCED BY PTP SYNC FRAMES PASSING THROUGH
THREE TRANSPARENT CLOCKS.
SV Traffic Min Max
none 2.59 ms 16.1 ms
1 MU 2.59 ms 364 ms
3 MU 2.58 ms 187 ms
6 MU 2.57 ms 19.5 ms
12 MU 2.58 ms 15.3 ms
21 MU 2.59 ms 657 ms
high load (21 MU) higher priority PTP messages did yieldslightly improved performance (an improvement of 5 ns overPriority 4), and the low priority case had marginally degradedperformance (by approximately 18 ns). This result is contraryto established practice where PTP messages are thought torequire high priority handling, however this does require theuse of transparent or boundary clocks that support the peer-delay mechanism.
V. DISCUSSION
A. Effect of Clock Selection
The best performing grandmaster was PTPC, with the leastjitter when used with any of the slave clocks. Similarlythe best performing slave clock was PTPF regardless of thegrandmaster used. These clocks had a range of local oscillatortypes, ranging in quality (from low to high) from a crystaloscillator (XO) in PTPA to an oven controlled crystal oscillator(OCXO) in PTPC. The slave-only clock PTPB had an XOand PTPF had a temperature compensated crystal oscillator(TCXO), and the difference in performance is apparent inFig. 6.
The stability of an oscillator improves the phase noise,and higher Q improves performance (OCXOs have higher Qthan TCXOs) [26]. PTP performance, as shown in Fig. 6,correlates with the expected phase noise performance of thelocal oscillator in each clock, based on the type of localoscillator.
Fig. 15. Sample distributions for three transparent clocks in series, with twodifferent SV traffic levels and three PTP 802.1Q priorities (“PTP Pri” in thelegend). Sampled value frames had 802.1Q priority set to 4.
B. Effect of Transparent and Boundary Clocks
Switches N and O performed better as boundary clocks,switch M performed better as a transparent clock and theperformance of switch H was similar as a transparent orboundary clock. Switches that do not syntonize (frequencylock) their local oscillator with the grandmaster in transparentclock mode often do so in boundary clock mode, as theirlocal oscillator becomes the reference for slave clocks anddownstream boundary clocks.
The transparent clocks all supported boundary clock modeas an alternative to transparent clock mode. boundary clocksto some extent decouple slave clocks from the grandmaster,and can provide additional robustness in case of networkoutage if the boundary clock’s internal clock is sufficientlystable. transparent clock mode is the default for most switches,however the results presented in this paper show that boundaryclock mode should be evaluated to ensure the best performanceis obtained from the equipment in a PTP system. Designersneed to be prepared to look at the boundary clock mode ofoperation when selecting products for a timing system.
Periodic perturbations in the synchronizing error betweenthe grandmaster and slave clock with one transparent clockindicates that some implementations have issues. These pertur-bations are straightforward to observe when the synchronizingerror is stable, but may be masked by a noisy grandmas-ter/slave clock combination. Therefore it is recommended thatthe most stable combination of grandmaster and slave clockis used for the assessment of transparent clock performance.
C. Transparent Clock Correction Accuracy
The mean CFE in Table III is not zero as the transparentclocks estimated the path delay with the peer to peer delaymechanism, and added this delay to the Correction field. Thedelay through the physical interface was as high as 300 nsfor some PTP devices, giving peer-delays of 600 ns for shortlinks. The latency measured by the DAG card through theEthernet tap could not take into account delays leaving thegrandmaster, and so the Correction field value was larger thanthe measured latency, resulting in the negative CFE valuesin Table III. Local oscillator frequency errors in transparentclocks have been shown to be the main source of error in

IEEE TRANSACTIONS ON INSTRUMENTATION AND MEASUREMENT 9
estimates of peer-to-peer path delay [27]. Syntonizing the localoscillators of transparent clocks to the grandmaster shouldimprove the accuracy of residence time estimates, and thisoption is provided by some manufacturers.
The test methodology presented in this paper, using astandard grandmaster, an Ethernet tap and a precision Ethernetcard, is a straightforward means of assessing the ability of atransparent clock to correctly measure the residence time of aPTP Sync message passing through the switch. This test couldbecome part of a standard validation process for evaluatingtransparent clocks for substation timing, and can be appliedthroughout a substation.
D. Operation with Sampled Values
The results shown in Fig. 14 and Fig. 15 demonstrate thatthe PTP system performance meets the ±1 µs requirementsof 9-2LE when a shared process bus network is used forSV and for time synchronization. Increased prioritization ofPTP makes a slight improvement at high network loads, asthe capability of transparent clocks to accurately estimateresidence time compensates for queuing delays experienced byPTP frames. It has been suggested that PTP messages shouldbe switched with high priority to ensure PTP accuracy [5],[17], but the results presented in this paper show that this is notnecessary when peer-delay transparent clocks are used. PTPaware Ethernet switches operating as transparent clocks, withthe exception of one, accurately measured the frame residencetime of PTP Sync messages. This enabled PTP to provideacceptable synchronizing performance, with offsets less than200 ns, in the presence of background traffic from 21 mergingunits. The one switch that had a latency dependent CFEintroduced the most jitter when used in the timing network.
The switch residence time is not critical, provided theresidence time is accurately reflected in the Correction field.The three large latencies of 187 ms, 364 ms and 657 msshow that accurate Correction values do compensate for largeswitch delays. Acceptable performance was obtained whenall switches operated as a boundary clock. System integratorsshould consider this mode of operation when designing PTPtiming systems for substations.
PTP and the power system profile meet the synchronizingrequirements of SV process buses with a shared network,provided PTP-aware Ethernet switches are used.
VI. CONCLUSIONS
The methodology and results presented in this paper havedemonstrated the benefits of a systematic approach to assess-ing the performance of a PTP based synchronizing system,with a particular focus on SV process buses in high voltagesubstations. Component testing, where each component is acommercially available PTP clock (grandmaster, slave, trans-parent or boundary clock), provides system designers withquantitative performance figures. The contribution of eachdevice to the overall “error budget” can then inform productselection by customers, or product development by suppliers.“Top down” testing of the final application, such as SV process
bus or synchrophasors, now becomes confirmation testing ofacceptable performance, rather than a fault-finding process.
The results presented in this paper show that while allgrandmaster and slave clocks tested were interoperable, aten-fold difference in grandmaster-slave jitter existed betweenthe best and worst performing combinations. Interoperabilityshould not be underestimated as this is a significant concernwhen moving from established timing systems to new networkbased systems, such as PTP.
Gaining an understanding of how each component performs,along with overall performance, will provide decision makersthe confidence to adopt this technology. Adoption of networkbased precision timing will reduce the cost of engineering andconstructing substation automation systems, especially whenthe network extends to the high voltage switchyard.
ACKNOWLEDGMENTS
Belden Solutions, Cisco Systems and Meinberg Funkuhrenkindly contributed hardware for the process bus PTP test bed.
REFERENCES
[1] A. Apostolov, “Requirements for automatic event analysis in substationautomation systems,” in IEEE PES Gen. Meet. 2004, Denver, CO, USA,6–10 Jun. 2004, pp. 1055–1060.
[2] F. Steinhauser, C. Riesch, and M. Rudigier, “IEEE 1588 for timesynchronization of devices in the electric power industry,” in Proc. 2010IEEE Int. Symp. Precis. Clock Synchr. Meas. Control Commun. (ISPCS),Portsmouth, NH, USA, 27 Sep. – 1 Oct. 2010, pp. 1–6.
[3] C. Brunner and G. S. Antonova, “Smarter time sync: Applying the IEEEPC37.238 standard to power system applications,” in Proc. 64rd Ann.Conf. Prot. Rel. Eng., College Station, TX, USA, 11–14 Apr. 2011, pp.91–102.
[4] IEEE Standard for a Precision Clock Synchronization Protocol forNetworked Measurement and Control Systems, IEEE Std. 1588-2008,24 Jul. 2008.
[5] C. M. De Dominicis, P. Ferrari, A. Flammini, S. Rinaldi, and M. Quar-antelli, “On the use of IEEE 1588 in existing IEC 61850-based SASs:Current behavior and future challenges,” IEEE Trans. Instrum. Meas.,vol. 60, no. 9, pp. 3070–3081, Sep. 2011.
[6] D. M. E. Ingram, P. Schaub, and D. A. Campbell, “Use of precisiontime protocol to synchronize sampled value process buses,” IEEE Trans.Instrum. Meas., vol. 61, no. 5, pp. 1173–1180, May 2012.
[7] SMB Smart Grid Strategic Group. (2010, Jun.) Smartgrid standardization roadmap. IEC. [Online]. Available: http://www.iec.ch/smartgrid/downloads/sg3_roadmap.pdf
[8] Office of the National Coordinator for Smart Grid Interoperability,“NIST framework and roadmap for smart grid interoperabilitystandards, release 2.0,” National Institute of Standards and Technology,Gaithersburg, MD, USA, Special Publication 1108R2, Feb. 2012.[Online]. Available: http://www.nist.gov/smartgrid/upload/NIST_Framework_Release_2-0_corr.pdf
[9] IEEE Standard Profile for Use of IEEE 1588 Precision Time Protocolin Power System Applications, IEEE Std. C37.238-2011, 14 Jul. 2011.
[10] J. Amelot, J. Fletcher, D. Anand, C. Vasseur, Y.-S. Li-Baboud, andJ. Moyne, “An IEEE 1588 time synchronization testbed for assessingpower distribution requirements,” in Proc. 2010 IEEE Int. Symp. Precis.Clock Synchr. Meas. Control Commun. (ISPCS), Portsmouth, NH, USA,27 Sep. – 1 Oct. 2010, pp. 13–18.
[11] R. Moore, R. Midence, and M. Goraj, “Practical experience with IEEE1588 high precision time synchronization in electrical substation basedon IEC 61850 process bus,” in IEEE PES Gen. Meet. 2010, Minneapolis,MN, USA, 25–29 Jul. 2010, pp. 1–4.
[12] C. Brunner, “Will IEEE 1588 finally leverage the IEC 61850 processbus?” in Proc. 10th IET Int. Conf. Dev. Power Sys. Prot. (DPSP),Manchester, UK, 29 Mar. – 1 Apr. 2010, pp. 1–5.
[13] M. Lixia, N. Locci, C. Muscas, and S. Sulis, “Synchrophasors measure-ment in a GPS-IEEE 1588 hybrid system,” Eur. Trans. Elect. Power,vol. 21, no. 4, pp. 1509–1520, May 2011.

IEEE TRANSACTIONS ON INSTRUMENTATION AND MEASUREMENT 10
[14] A. Carta, N. Locci, C. Muscas, F. Pinna, and S. Sulis, “GPS and IEEE1588 synchronization for the measurement of synchrophasors in electricpower systems,” Comput. Stand. Interfac., vol. 33, no. 2, pp. 176–181,Feb. 2011.
[15] J. B. Burch, K. Green, J. Nakulski, and D. Vook, “Verifying theperformance of transparent clocks in PTP systems,” in Proc. 2009IEEE Int. Symp. Precis. Clock Synchr. Meas. Control Commun. (ISPCS),Brescia, Italy, 12–16 Oct. 2009, pp. 1–6.
[16] L. Cosart, “Characterizing grandmaster, transparent, and boundaryclocks with a precision packet probe and packet metrics,” in Proc. 2011IEEE Int. Symp. Precis. Clock Synchr. Meas. Control Commun. (ISPCS),Munich, Germany, 12–16 Sep. 2011, pp. 56–61.
[17] R. Zarick, M. Hagen, and R. Bartoš, “Transparent clocks vs. enterpriseEthernet switches,” in Proc. 2011 IEEE Int. Symp. Precis. Clock Synchr.Meas. Control Commun. (ISPCS), Munich, Germany, 12–16 Sep. 2011,pp. 62–68.
[18] Communication Networks and Systems in Substations – Part 5: Com-munication Requirements for Functions and Device Models, IEC 61850-5:2003(E), Jul. 2003.
[19] UCA International Users Group. (2004, 7 Jul.) Implementationguideline for digital interface to instrument transformersusing IEC 61850-9-2 R2-1. Raleigh, NC, USA. [On-line]. Available: http://iec61850.ucaiug.org/Implementation%20Guidelines/DigIF_spec_9-2LE_R2-1_040707-CB.pdf
[20] IEEE Standard for Synchrophasor Measurements for Power Systems,IEEE Std. C37.118.1-2011, 28 Dec. 2011.
[21] J. Amelot, Y.-S. Li-Baboud, C. Vasseur, J. Fletcher, D. Anand, andJ. Moyne, “An IEEE 1588 performance testing dashboard for powerindustry requirements,” in Proc. 2011 IEEE Int. Symp. Precis. ClockSynchr. Meas. Control Commun. (ISPCS), Munich, Germany, 12–16 Sep.2011, pp. 132–137.
[22] J. del Río, D. Toma, S. Shariat-Panahi, A. Mànuel, and H. G. Ramos,“Precision timing in ocean sensor systems,” Meas. Sci. Technol., vol. 23,no. 2, p. 7, Dec. 2012.
[23] P. Ferrari, A. Flammini, S. Rinaldi, and G. Prytz, “Evaluation of timegateways for synchronization of substation automation systems,” IEEETrans. Instrum. Meas., vol. 61, no. 10, pp. 2612–2621, Oct. 2012.
[24] J. Micheel, S. Donnelly, and I. Graham, “Precision timestamping ofnetwork packets,” in Proc. 1st ACM SIGCOMM Wkshp Internet Meas.,San Francisco, CA, USA, 1–2 Nov. 2001, pp. 273–277.
[25] D. M. E. Ingram, P. Schaub, and D. Campbell, “Multicast traffic filteringfor sampled value process bus networks,” in Proc. 37th Ann. Conf. IEEEIndust. Electron. Soc. (IECON), Melbourne, Australia, 7–10 Nov. 2011,pp. 4710–4715.
[26] J. Esterline, “Phase noise: Theory versus practicality,” Microw. J.,vol. 51, no. 4, pp. 72–87, Apr. 2008.
[27] J. Gao, F. Yang, J. Yang, and H. Zhao, “Effects of IEEE 1588 clock fre-quency drift on path delay measurement in power system applications,”J. Inform. Comput. Sci., vol. 8, no. 16, pp. 4337–4342, Dec. 2011.
David Ingram (S’94 M’97 SM’10) received theB.E. (with honours) and M.E. degrees in electricaland electronic engineering from the University ofCanterbury, Christchurch, New Zealand, in 1996 and1998, respectively. He is currently working towardthe Ph.D. degree at the Queensland University ofTechnology, Brisbane, Australia, with research in-terests in substation automation and control.
He has previous experience in the Queenslandelectricity supply industry in transmission, distribu-tion, and generation.
Mr. Ingram is a Chartered Member of Engineers Australia and is aRegistered Professional Engineer of Queensland.
Pascal Schaub received the B.Sc. degree in com-puter science from the Technical University Brugg-Windisch, Windisch, Switzerland, (now the Univer-sity of Applied Sciences and Arts NorthwesternSwitzerland) in 1995.
He was with ABB, with a leading role in theproduct development of control and protection sys-tems, nonconventional instrument transformers, andfield bus communication technology. He is currentlythe Principal Consultant Power System Automationwith Powerlink Queensland, Brisbane, Australia. He
is a member of Standards Australia working group EL-050 "Power SystemControl and Communications" and a member of the international workinggroup IEC/TC57 WG10 "Power System IED Communication and AssociatedData Models."
Duncan Campbell (M’84) received the B.Sc. de-gree (with honours) in electronics, physics, andmathematics and the Ph.D. degree from La TrobeUniversity, Melbourne, Australia.
He has collaborated with a number of universitiesaround the world, including Massachusetts Insti-tute of Technology, and Telecom-Bretagne, Brest,France. He is currently a Professor with the Schoolof Electrical Engineering and Computer Science,Queensland University of Technology, Brisbane,Australia, where he is also the Director of the
Australian Research Centre for Aerospace Automation (ARCAA). His re-search areas of interest are robotics and automation, embedded systems,computational intelligence, intelligent control, and decision support.
Prof. Campbell is the Immediate Past President of the Australasian As-sociation for Engineering Education and was the IEEE Queensland SectionChapter Chair of the Control Systems/Robotics and Automation Society JointChapter (2008/2009).
Richard Taylor (M’08) received the B.E. (withhonours) and M.E. degrees in electrical and elec-tronic engineering from the University of Canter-bury, Christchurch, New Zealand, in 1977 and 1979,respectively, and the Ph.D. degree from the Univer-sity of Queensland, Brisbane, Australia in 2007.
He is the former Chief Technical Officer ofMesaplexx Pty Ltd and currently holds a fractionalappointment as an Adjunct Professor in the Schoolof Electrical Engineering and Computer Science atthe Queensland University of Technology. He started
his career as a telecommunications engineer in the power industry in NewZealand. In the past 25 years he has established two engineering businessesin Queensland, developing innovative telecommunications products.