c d - dm5migu4zj3pb.cloudfront.net€¦ · (c,d) bar graphs summarizing frequency and peak...
TRANSCRIPT

Freq
uenc
y (H
z)D1 MSNs D2 MSNs
WT
KO
WT
KO
A B
C D
Supplemental Figure 1 . B deletion did not alter GABA-mIPSCs in D1 or D2 MSNs. (A,B) Representative recording traces of GABA-mIPSCs in the presence of TTX,
NBQX and APV from acute striatal brain slices. (C,D) Bar graphs summarizing frequency and peak amplitude of mIPSCs from D1 and D2 MSNs of WT and Shank3B KO mice, n = 16 from 3 mice per group.
D1 WT D1 KO D2 WT D2 KO0
1
2
3
4
Ampl
itude
(pA)
D1 WT D1 KO D2 WT D2 KO0
10
20
30
40
50

Supplemental Figure 2. An increased intrinsic excitability in D2 MSNs of Shank3B KO mice.(A) Average instant firing frequency-current (F/I) curves for D1 MSNs in both
wild type and Shank3B KO mice (WT: n=19 cells from 6 mice; KO: n=17 cells from 5 mice, two way ANOVA, Interaction p>0.99)
(B) Average F/I curves for D2 MSNs in both wild type and Shank3B KO mice. At 6 current injection intensity, the firing frequency of D2 MSNs in Shank3B KO mice is significantly higher than WT D2 MSNs (WT: n=16 cells from 5 mice; KO = 15 cells from 5 mice, two way ANOVA, Interaction p = 0.90. Sidak's multiple comparisons test, stimulation = 190 pA, p = 0.039; stimulation = 210 pA, p = 0.011; stimulation = 230 pA, p = 0.038; stimulation = 250 pA, p = 0.035; stimulation = 270 pA, p = 0.035; stimulation = 290 pA, p = 0.035 ).
D1 MSNs
150 250 350 4500
10
20
30
40
WTKO
Current injection(pA)
Ave
rg. I
nst.
Fre.
(Hz)
150 250 350 4500
10
20
30
40
D2 MSNs
Current Injection(pA)
WTKO
**
** * *
A
Ave
rg. I
nst.
Fre.
(Hz)
B

0 10 20 30 400.0
0.5
1.0
1.5
AM251(5 M)
0.0
0.5
1.0
1.5 baselinelast 10 min
0
50
100
150
200
baseline
after HFS
100 pA
20 ms
D2 MSN
0 10 20 30 400.0
0.5
1.0
1.5
2.0
AM251(5 M)
0.0
0.5
1.0
1.5
eEPS
Cs
Amp
(%) baseline
last 10 min
0
50
100
150
200
PPR
D1 MSNs
PPR
eEPS
Cs
Amp
(%)
eEPS
Cs
Amp
(%)
eEPS
Cs
Amp
(%)
200 pA
20 ms
baseline
after HFS
Time (min)
Time (min)
A B C
D
E F G
H
Supplemental Figure 3. HFS-LTD could be blocked by AM251 (CB1 receptor antagonist, 5μM) in D1 and D2 Shank3B KO MSNs.(A) Average traces from a representative LTD experiment in D1 KO MSN using HFS-LTD protocol with AM251 bathing for whole time of recording.(B) Time course plots displaying relative changes in EPSC amplitudes during bath perfusion of AM251 for whole period of HFS-LTD protocol in D1 MSNs. n = 4 cells, N = 2 mice(C) Summary data of eEPSCs amplitude of D1 KO MSNs comparing between baseline and the last 10 min in B. n = 4, Data represent the mean ± S.E.M. paired t test was used for comparison.(D) Summary data of PPR of D1 KO MSNs comparing between baseline and the last 10 min in B. (E) Average traces from a representative LTD experiment in D2 KO MSN using HFS-LTD protocol with AM25 bathing for whole time of recording.(F) Time course plots displaying relative changes in EPSC amplitudes during bath perfusion of AM251 for whole period of HFS-LTD protocol in D2 MSNs. n = 4 cells, N = 2 mice(G) Summary data of eEPSCs amplitude of D2 KO MSNs comparing between baseline and the last 10 min in B. n = 4, Data represent the mean ± S.E.M. paired t test was used for comparison.(H) Summary data of PPR of D2 KO MSNs comparing between baseline and the last 10 min in B.

Supplemental Figure 4. FPL application induced slower decay timeconstant in D2 MSNs of Shank3B KO mice.(WT-before: 13.5 ± 3.30 ms, WT-after: 15.7 ± 2.77 ms, n = 6 cells, N = 3 mice.KO-before: 12.7 ± 2.10 ms, KO-after: 24.83 ± 6.00 ms, n = 7cells, N = 3 mice. Two-way ANOVA, p = 0.1795).
before-
FPL
after-
FPL
before-
FPL
after-
FPL0
10
20
30
40
τ w(m
s)
WTKO

Supplemental Figure 5. Comparable CB1 receptor agonist-induced LTD in D2 MSNs of WT and Shank3B KO mice. (A) Time course plots displaying relative changes in eEPSC amplitudes after bath perfusion of WIN 55212-2 (WIN 55, 1µM) for 10min. (B) Summary bar graph demonstrates WIN 55 induced similar degree of depressed eEPSC amplitudes in D2 MSNs of WT and Shank3B KO mice (mean values of eEPSC amplitudes over last 10 min normalized to baseline period; WT, n=7 cells, N = 3 mice; KO, n=8 cells, N=3 mice).(C) Summary bar graph demonstrates WIN 55 similarly affected PPR of eEPSCs in D2 MSNs of WT and Shank3B KO mice. (WT, n=7; KO, n=8)All data are presented as mean ± S.E.M.
0 10 20 30 40 500.0
0.5
1.0
1.5
0.0
0.5
1.0WT D2KO D2
0
50
100
150
EPSC
sAm
p.(%
)
EPSC
sAm
p.(%
)
PPR
(%)
Time (min)
WIN 55 (1 μM)
20 ms
100pA
WT D2 MSN
KO D2 MSN
A B
C

Supplemental Figure 6. Representative low magnification image of striatum infected by pAAV-hSyn1-EGFPf-WPRE-hGH virus. Please note sparse striatal MSNs were labeled with GFP.
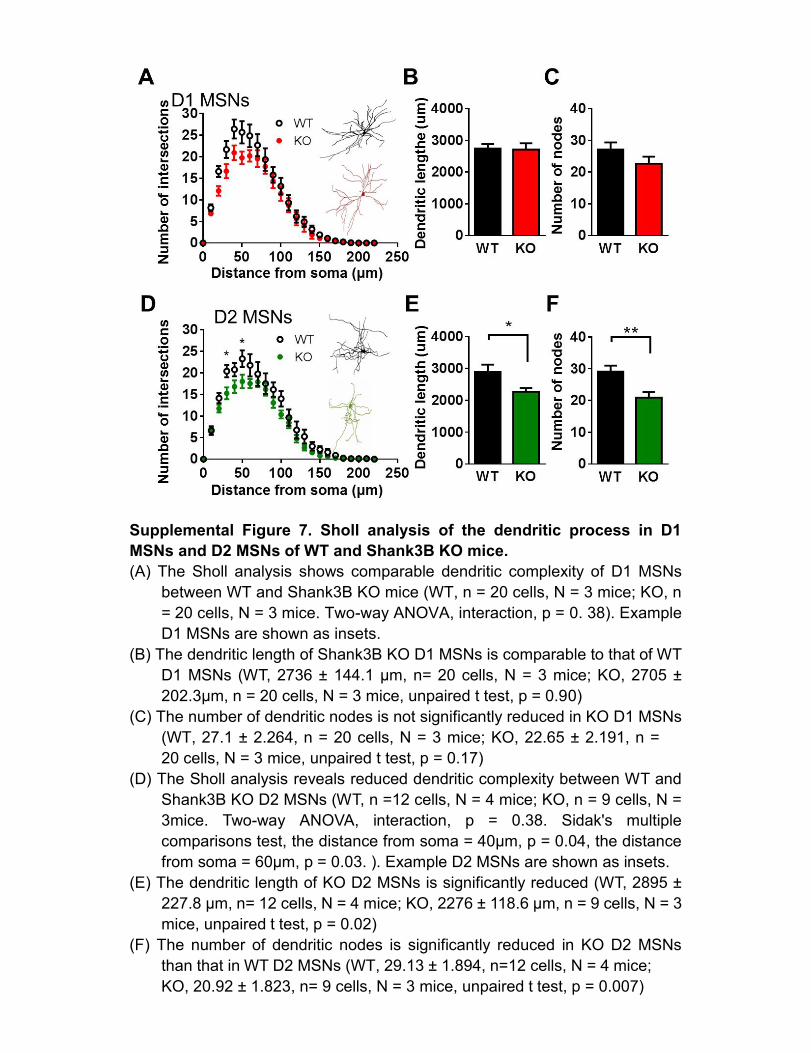
Supplemental Figure 7. Sholl analysis of the dendritic process in D1 MSNs and D2 MSNs of WT and Shank3B KO mice.(A) The Sholl analysis shows comparable dendritic complexity of D1 MSNs
between WT and Shank3B KO mice (WT, n = 20 cells, N = 3 mice; KO, n = 20 cells, N = 3 mice. Two-way ANOVA, interaction, p = 0. 38). Example D1 MSNs are shown as insets.
(B) The dendritic length of Shank3B KO D1 MSNs is comparable to that of WT D1 MSNs (WT, 2736 ± 144.1 μm, n= 20 cells, N = 3 mice; KO, 2705 ± 202.3μm, n = 20 cells, N = 3 mice, unpaired t test, p = 0.90)
(C) The number of dendritic nodes is not significantly reduced in KO D1 MSNs (WT, 27.1 ± 2.264, n = 20 cells, N = 3 mice; KO, 22.65 ± 2.191, n = 20 cells, N = 3 mice, unpaired t test, p = 0.17)
(D) The Sholl analysis reveals reduced dendritic complexity between WT and Shank3B KO D2 MSNs (WT, n =12 cells, N = 4 mice; KO, n = 9 cells, N = 3mice. Two-way ANOVA, interaction, p = 0.38. Sidak's multiple comparisons test, the distance from soma = 40μm, p = 0.04, the distance from soma = 60μm, p = 0.03. ). Example D2 MSNs are shown as insets.
(E) The dendritic length of KO D2 MSNs is significantly reduced (WT, 2895 ± 227.8 μm, n= 12 cells, N = 4 mice; KO, 2276 ± 118.6 μm, n = 9 cells, N = 3 mice, unpaired t test, p = 0.02)
(F) The number of dendritic nodes is significantly reduced in KO D2 MSNs than that in WT D2 MSNs (WT, 29.13 ± 1.894, n=12 cells, N = 4 mice; KO, 20.92 ± 1.823, n= 9 cells, N = 3 mice, unpaired t test, p = 0.007)

A B
D
0
20
40
60
80
C
* **
0
5
10
15
20
** 0.078
Supplemental Figure 8. High dose of CNO induces locomotor activity changes in Shank3B-D1cre and Shank3B-A2Acre mice. (A) Schematics of CNO injection and behavioral tests. (B) Open field tracking maps showing high dose of CNO (0.7mg/kg) induces profound locomotor activity changes in WTxD1-cre and WTxA2A cre mice injected with AAV-hM3Dq-mCherry. (C) Summary bar graphs showing significant increased locomotion activities induced by CNO (0.7mg/kg)
in both WT x D1-cre and Shank3B KO x D1-cre mice injected with AAV-hM3Dq-mCherry (paired t test, WT: **p= 0.0437, KO: **p = 0.0072). (D) Summary bar graphs showing significant decreased locomotion activities induced by CNO (0.7mg/kg) in WT x A2A-cre mice injected with AAV-hM3Dq-mCherry (paired t-test, WT: **p= 0.0032). A trend of
decreased locomotion activities was also observed in Shank3 KO x A2A cre mice injected with AAV-hM3Dq-mCherry (paired t test, p = 0.078).
Tukey’s multiple comparisons test, WT-mCherry vs. WT-DREADD, p< 0.01. All data are presented as means ± S.E.M. from 6–9 mice per genotype.
WTKO
-15
-10
-5
0
5 *
**Δ To
tal d
ista
nce
(m)
mCherry DREADD
WTKO
-20
0
20
40
60***
**
mCherry DREADD
Δ To
tal d
ista
nce
(m)
E F
(E) Statistical analysis showing CNO significant increased locomotion activities (two way ANOVA, p= 0.0002; Tukey’s multiple comparisons test, WT-mCherry vs. WT-DREADD, p< 0.05. KO-mCherry vs. KO- DREADD, p< 0.05. (F) Statistial analysis showing CNO significant decreased locomotion activities (two way ANOVA, p = 0.0021;
Tota
l Dis
tanc
e (m
)
Tota
l Dis
tanc
e (m
)D1-Cre A2a-Cre
Basal BasalCNO CNO0.7 mg/kg CNO
Post-CNOPre-CNOHabituation
Open field testGrooming
PostPre
Open field testGrooming
Break
WT-mCherry
KO-mCherry
WT-DREADD
KO-DREADD
WT-mCherry
KO-mCherry
WT-DREADD
KO-DREADD
Pre PrePrePre PostPostPostPost Pre PrePrePre PostPostPostPost
1 Hour

Supplemental Figure 9. No change in grooming duration was observed by reducing D2 MSNs activity with DREADD-hM4Di system.
10 μM CNO10 μM CNO
20 s10 mV
10 μM CNO
5 s2 mV
-80 mV
WT Gi0
100
200
300
400
500
ΔG
room
ing
dura
tion
(s)
A C
-15
-10
-5
0
CNO treatment
RMP
(mV)
Δ(A) Representative recording trace of CNO-induced hyperpolarization of a D2 MSN expressing hM4Di-mCherry.(B) 4 out of 6 recorded D2 MSNs expressing hM4Di-mCherry showing hyper- polarization resting membrane potential during CNO bathing (-7.4 ± 1.32mV n = 4 cells, N = 2 mice).(C) CNO induced comparable grooming changes in both Control and hM4Di-mCherry group ( WT: 291.1 ± 77.86 s, N = 8 mice. Gi: 362 ± 102.8 s, N = 5 mice, p = 0.59, unpaired t test)
B

Intrinsic embrane properties of D1 MSNs
Genotype RMP (mV) AP Peak (mV) Half width (ms) Threshold (mV) Rheobase (pA)
WT (n=14) -80.9 ± 1.45 91.8 ± 1.86 0.9 ± 0.02 -42.3 ± 0.68 235.7 ± 18.48
KO (n=13) -81.6 ± 1.50 93.8 ± 1.08 0.8 ± 0.02 * -44.1 ± 1.01 245.4 ± 24.90
Genotype RMP (mV) AP Peak (mV) Half width (ms) Threshold (mV) Rheobase (pA)
WT (n=15) -82.3 ± 1.43 95.6 ± 1.17 1.0 ± 0.03 -44.1 ± 1.05 216.7 ± 20.81
KO (n=14) -81.5 ± 1.80 91.3 ± 1.17* 0.9 ± 0.03 -46.5 ± 0.99 180.7 ± 17.05
Supplemental Table 1
Intrinsic embrane properties of D2 MSNs
*, p<0.05
Instrinsic properties of dorsal striatal MSNs in WT and Shank3B KO mice