c e ethiopian environment and forest research institute
TRANSCRIPT

Lowland Bamboo (Oxytenanthera abyssinica) deforestation and subse-
quent cultivation effects on soil Physico-chemical properties in South-
western Ethiopia
Zebene Tadesse abc, Melkamu Abere d, Belayineh Azene abd, Pan Kaiwen ab*,
Yigardu Mulatu e, Meta Francis ab
a Chengdu Institute of Biology, Chinese Academy of Sciences, Chengdu 610041
b University of Chinese Academy of Sciences, Beijing 100049
c Central Ethiopia Environment and Forest Research Center, Addis Ababa, Ethiopia.
d Bahir Dar Environment and Forest Research Center, Bahir Dar, Ethiopia.
e Ethiopian Environment and Forest Research Institute, Addis Ababa, Ethiopia.
Corresponding Author: Pan Kaiwen; [email protected]
Abstract
In Ethiopia, bamboo thickets and woodlands play an important role in soil-water conservation
and climate change mitigation in arid and semi-arid regions. However, bamboo mass flower-
ing, rapid demographic changes and expansion of agricultural investments to bamboo domi-
nated areas have led to deforestation and land degradation. In this study, we determined the
effects of deforestation and subsequent cultivation on soil physical and chemical properties
along a chronosequence of closely located agricultural lands with different ages (1, 3, 5 and 7
years) since converted from natural lowland bamboo forest. Hence, soil samples (n = 90)
have been taken from both natural bamboo forests and adjacent agricultural lands at two soil
depths (0-20 cm and 20-40 cm). Our result showed that CEC, K+, Ca+, Mg+ and available P
were varied significantly with respect to cultivation periods and soil depth, while soil pH and
Na+ varied with soil depth (P < 0.001). Soil C and total N contents (g/kg) in 0-20 cm soil lay-
er declined significantly and exponentially with increasing years under cultivation. Conver-
sion of natural bamboo forest to cropland during the past seven year period significantly in-
creased soil pH with soil depths, while CEC was declined throughout the cultivation period
and soil depth. In general, the result revealed that conversion of natural lowland bamboo and
subsequent cultivation of soil had negative effects on measured soil physico-chemical proper-
ties.
Keywords: Land use change; soil quality, Lowland bamboo; Cultivation periods; Ethiopia
Preprints (www.preprints.org) | NOT PEER-REVIEWED | Posted: 31 May 2021 doi:10.20944/preprints202105.0734.v1
© 2021 by the author(s). Distributed under a Creative Commons CC BY license.

1. Introduction
The Northwestern part of Ethiopia is known as undifferentiated woodland (White type) which
consists of three major natural vegetation types; Dry Broadleaved deciduous forest (Combre-
tum-Terminalia woodland and wooded grassland), Dry evergreen Afromontane forest and
Moist evergreen Afromontane forest vegetation (White, 1983; Tadesse, 2007). About 3.9 mil-
lion hectares of the region (25% of the country) are dominated by dry broadleaved deciduous
forest and shrubland vegetation (CRGE, 2011; UNDP, 2017). Benishangul Gumuz Region
accounts for 55% of solid-stemmed lowland bamboo cover. These forest ecosystems have
both environmental (soil erosion control, soil fertility maintenance and climate change miti-
gation) and economic (firewood collection, wild food collection, gum-resin production, and
marketing) contribution to the region as well as the country. However, rapid population de-
mographic changes and the growth of agricultural investments in the region have led to de-
forestation and forest degradation. For instance, the region’s agricultural investment and ce-
real crop production have undergone a rapid expansion owing to the growing demand for
food crops and fruit production, driven by encroachment, forest fire, lack of land use policy,
intensive resettlement programs, socio-economic issues, agricultural expansion to forest areas
and current Agriculture Development Led Industrialization (ADLI) economic policy of the
country (Kassa et al., 2017; Tadesse., 2007).
Soil is one of the most important components of the biosphere and plays a significant role in
nutrient cycling, carbon storage and turnover, regulations of biodiversity, and transforming of
pollutant elements and compounds (Juhos et al., 2019; X. Liu et al., 2020; Maschinen et al.,
2015; Safaei et al., 2019). Therefore, it is important to assess its quality (Kalu et al., 2015)
and direction of change over time (Lemenih et al., 2005; Wang & Gong, 1998) and primary
indicators of sustainable agricultural land management (Cardoso et al., 2013; Doran, 2002;
Rais & Sharma, 2008). The assessment of soil quality involves measuring soil attributes that
influence the capacity of soil to support crop production (Doran, 2002; Seifu & Elias, 2018).
These soil attributes could be physical, chemical and biological soil properties and it is the
basic in which organic farming is based (Hillele & Rosenweig, 2004).
However, studies indicated that the extent of measured soil quality varies with types of vege-
tation, management practices, climatic condition of the site, soil type, land use history and
time since conversion (Kassa et al., 2017; Lemenih et al., 2005). Changes in those soil prop-
erties such as direction of change (positive vs negative), magnitude of change (percentage
over a baseline values or rates of change) and duration of change could be used to monitor
Preprints (www.preprints.org) | NOT PEER-REVIEWED | Posted: 31 May 2021 doi:10.20944/preprints202105.0734.v1

agricultural land management. Land use and agricultural management practices greatly af-
fects the direction and degree of soil quality changes (Aran et al., 2001; Wang & Gong,
1998).
In Ethiopia, agriculture is one of the backbone of the economy and major occupation for
nearly 85% of the population. Moreover, long-term sustainable development goals and pov-
erty allevation programs in the country are all designed to be based on the development on-
agricultural economy (CRGE, 2011). Conversely, deforestation and land degradation recently
become serous concerns for soil quality and agricultural productivity decline in almost all
parts of the country. To achieve the CRGE (climate resilent green economy) development
goals, land use and agricultural practices should be sustainable in the country. Despite, defor-
estation and land degradation impacts on soil quality continued, very few studies were con-
ducted to quantify the extent, rate and process of soil fertility depletions under different land
uses and management practices (Elias & Scoones, 1999). This study is the first attempt to in-
vestigate soil physical and chemical attributes after natural lowland bamboo deforestation and
cultivated in a chronosequence for seven years.
Therefore, this study was conducted to assess the effects of lowland bamboo deforestation
and subsequent cultivation on soil quality indicators (soil physical and chemical properties) in
O. abyssinica dominated and cultivated agricultural land using a chronosequence of agricul-
tural lands recently converted from natural lowland bamboo forest. Changes in the soil physi-
cal and chemical properties in the cultivated agricultural lands were compared with similar
soil properties under an adjacent natural lowland bamboo forests. The trends in the changes
experiential were the used to evaluate the impacts of the agricultural land use on soil attrib-
utes and indicators of the sustainability of the cultivated land use.
Preprints (www.preprints.org) | NOT PEER-REVIEWED | Posted: 31 May 2021 doi:10.20944/preprints202105.0734.v1

2. Materials and Methods
2.1. Study Area
The study is conducted in Southwestern Ethiopia, in Benishangul Gumuz Regional State be-
tween 9017'-12006' N; 34010'-37004' E, with altitudes ranging from 580 m.a.s.l to about 2,731
m. The area is characterized by plains, undulating lands, and comprises predominantly the
outcrops of very old Precambrian rocks. The annual rainfall pattern is unimodal with a rainy
season from mid-May to October. The average annual rainfall amount ranges from 500-1800
mm and the minimum and maximum annual temperature vary from 20-35 0C and the varia-
tion is strongly correlated with altitudinal ranges (Demissew et al., 2005). The soil types are
deep clayish, Nitisols, Leptisols, Cambisols, Alisols, and Fluvisols (Dewitte et al., 2013). The
region covers an area of 50,380 km2 and has different types of forests, woodlands, and bam-
boo thickets (Demissew et al., 2005) and known as undifferentiated woodland (Ethiopian
type) (White, 1983).
2.3. Soil sampling and analysis
2.3.1. Soil sampling
The soil samples were taken in three replicates from four corners and the center of the
squared plot measuring 20 m x 20 m2 in both bamboo forest and agricultural fields. We col-
lected samples from two soil depths, 0-20 cm, and 20-40 cm. We followed the FAO guideline
for soil descriptions (FAO, 2006). For soil chemical analysis, the samples were air-dried,
homogenized, and sieved using 2 mm sieve.
2.3.2. Soil laboratory analysis
Soil pH was measured in both water and 1 M KCL suspension of 1:2.5 (soil: liquid ratio) us-
ing a glass-calomel combination electrode (Lemenih et al., 2005). Organic C (OC) and total
nitrogen were analyzed using (Walkley and Black) and Kjeldahl methods, respectively
(Moghiseh et al., 2013). Available P analyzed using the Olson method, while exchangeable
bases (Ca, Mg, K, and Na) were analyzed after extracting I M ammonium acetate at pH 7.0
(Barton & Karathanasis, 1997). Ca and Mg in the extracts were analyzed using atomic ab-
sorption spectrophotometer (Kassa et al., 2017), while Na and K were measured by flame
photometry (Black et al., 1965). The cation exchange capacity (CEC) was measured by the
ammonium acetate method.
Preprints (www.preprints.org) | NOT PEER-REVIEWED | Posted: 31 May 2021 doi:10.20944/preprints202105.0734.v1

The soil organic carbon and nitrogen stock were determined based on the formula (Chan,
2008; Smal et al., 2019; Yan Zhang et al., 2020):
Ct = (H × ρ × %C)*Cf ---------------------------------------------------------------- Eq. 2
Where, Ct = Soil organic carbon stock (g/kg), H = the depth of the soil sample thickness of
the sampled soil layer (cm), ρ = the soil bulk density (g cm-3), %C = the percent of organic
carbon, Cf = Conversion factor (0.1). The total nitrogen stock was also computed using a
similar formula. The losses in soil organic carbon and nitrogen stock -because of deforesta-
tion and subsequent cultivation were computed by subtracting the total soil organic carbon
and nitrogen stocks under bamboo forest from that of the corresponding depth under cultivat-
ed land. The computed loss values were then divided by the number of years since the con-
version to obtain the soil organic carbon and nitrogen losses per year. Particle size analysis
was performed by the hydrometer method. Textural classes were assigned using the USDA
particle size classes, sand (0.05-2.00 mm), silt (0.002–0.05 mm), and clay (<0.002 mm).
Electrical conductivity (EC) was measured using the EC meter.
2.4. Data analysis
We used a two-way analysis of variance (ANOVA) to perform each soil property per two
depths across the land use age to test whether the changes in the soil physical properties were
statistically significant. The mean values were compared using List Significant Difference
(LSD). The soil carbon content (g/kg) of the surface 0-20 cm layer was related to cultivation
period using exponential decay regression function described as follows:
C = a ± be-kt,
Where C is the soil organic carbon content in (g/kg) at a given time t, a and b are the regres-
sion coefficients, k the decay constant. To evaluate the impacts of land-use change on the
soils, the soil status under new land use (agricultural cultivation) is compared with the soil
under lowland bamboo forest, which can be then expressed as soil degradation index (SDI)
(Adejuwon & Ekanade, 1988; Islam & Weil, 2000; Sione et al., 2017). The degradation index
(DI) shows the percent changes whether positive or negative in soil properties under a new
land use from the values under the natural system (bamboo forest). For the establishment of
DI for each soil property, we followed the method used in (Lemenih et al., 2005). We fol-
lowed the FAOs qualitative land evaluation procedure to evaluate whether, threshold levels
had been reached for the observed soil changes (FAO, 1976).
Preprints (www.preprints.org) | NOT PEER-REVIEWED | Posted: 31 May 2021 doi:10.20944/preprints202105.0734.v1
3. Results
3.1. Soil physical property responses
3.1.1. Soil Textural classes and their distribution
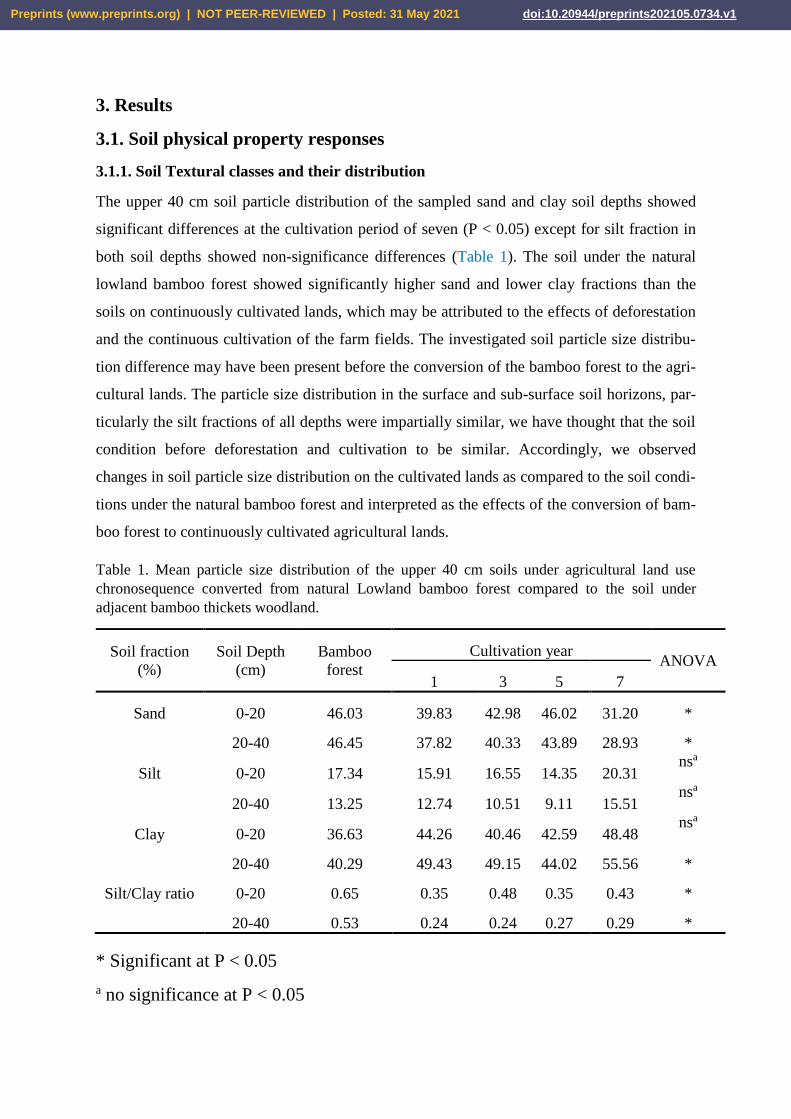
The upper 40 cm soil particle distribution of the sampled sand and clay soil depths showed
significant differences at the cultivation period of seven (P < 0.05) except for silt fraction in
both soil depths showed non-significance differences (Table 1). The soil under the natural
lowland bamboo forest showed significantly higher sand and lower clay fractions than the
soils on continuously cultivated lands, which may be attributed to the effects of deforestation
and the continuous cultivation of the farm fields. The investigated soil particle size distribu-
tion difference may have been present before the conversion of the bamboo forest to the agri-
cultural lands. The particle size distribution in the surface and sub-surface soil horizons, par-
ticularly the silt fractions of all depths were impartially similar, we have thought that the soil
condition before deforestation and cultivation to be similar. Accordingly, we observed
changes in soil particle size distribution on the cultivated lands as compared to the soil condi-
tions under the natural bamboo forest and interpreted as the effects of the conversion of bam-
boo forest to continuously cultivated agricultural lands.
Table 1. Mean particle size distribution of the upper 40 cm soils under agricultural land use
chronosequence converted from natural Lowland bamboo forest compared to the soil under
adjacent bamboo thickets woodland.
Soil fraction
(%)
Soil Depth
(cm)
Bamboo
forest
Cultivation year ANOVA
1 3 5 7
Sand 0-20 46.03 39.83 42.98 46.02 31.20 *
20-40 46.45 37.82 40.33 43.89 28.93 *
Silt 0-20 17.34 15.91 16.55 14.35 20.31 nsa
20-40 13.25 12.74 10.51 9.11 15.51 nsa
Clay 0-20 36.63 44.26 40.46 42.59 48.48 nsa
20-40 40.29 49.43 49.15 44.02 55.56 *
Silt/Clay ratio 0-20 0.65 0.35 0.48 0.35 0.43 *
20-40 0.53 0.24 0.24 0.27 0.29 *
* Significant at P < 0.05
a no significance at P < 0.05
Preprints (www.preprints.org) | NOT PEER-REVIEWED | Posted: 31 May 2021 doi:10.20944/preprints202105.0734.v1

The soil types are clayey with the mean clay contents ranging from 36.63 to 48.8% on the
upper 0-20 cm and 40.29 to 55.56% in the sub-surface 20-40 cm depths. The clay enrichment
in the lower soil depths may be due to the migration of clays. The natural bamboo forest has
shown significantly higher silt/clay ratios than all sampled depths under the adjacent cultivat-
ed lands. The silt/clay ratio in the upper soil depths ranges from 0.35 to 65 and 0.24 to 0.53 to
the lower soil depths, which were rated higher (Table 1), indicating the accumulation of
weatherable mineral reserve in the soil layers.
3.2. Soil chemical property responses
3.2.1. Soil carbon and total nitrogen
The soil carbon and nitrogen contents (g/kg) and stocks (t/ha) in the upper 20 cm soil layer
decreased continuously and significantly (P < 0.05) with the cultivation period and sampling
depths of the agricultural lands (Table 2). The magnitude of declines in the soil carbon con-
tent (64.5%) was observed after seven years of continuous cultivation compared to the adja-
cent natural bamboo forest. The soil carbon contents and stocks of the upper soil layer (0-20
cm) showed an exponential decline with increasing cultivation period (Fig. 2) and soil depths
and significantly (P < 0.001) higher than the last two cultivation periods. Interestingly, the
SOC and TN in the subsurface were increased throughout the cultivation periods. The total
nitrogen content and concentration in the natural lowland bamboo have a statistically signifi-
cant mean difference (P < 0.001) with all the cultivation periods. The SOC, TN content and
stocks have no significant difference in the subsurface soil layer (p < 0.05).
Table 2. Mean (±SEM) for soil C and total N (g/kg), C: N ration, and soil C and total N stocks
(t/ha) in the 0-20 and 20-40 cm soil layers along agricultural land use chronosequence converted
from lowland bamboo compared to soil adjacent to the natural lowland bamboo forest.
Cultivation Year Soil Depth SOC (g/kg) TN (g/kg) C: N SOC (t/ha) TN (t/ha)
Bamboo forest 0-20 36.42 ± 1.83 3.16 ± 0.55 13.20 ± 1.35 830.43 ± 41.78 71.95 ± 12.63
20-40 12.31 ± 2.27 1.23 ± 0.19 9.95 ± 0.70 263.46 ± 48.58 26.39 ± 4.18
1 0-20 27.86 ± 0.97 1.67 ± 0.10 17.00 ± 0.68 635.11 ± 22.04 38.00 ± 2.37
20-40 17.43 ± 3.25 1.46 ± 0.25 12.03 ± 1.31 373.07 ± 69.47 31.15 ± 5.34
3 0-20 25.08 ± 1.70 2.03 ± 0.22 13.68 ± 1.78 571.77 ± 38.83 46.36 ± 4.98
20-40 13.62 ± 3.20 1.00 ± 0.15 13.51 ± 1.71 291.52 ± 68.46 21.40 ± 3.19
5 0-20 24.01 ± 1.70 1.80 ± 0.15 13.56 ± 0.86 547.45 ± 38.83 41.04 ± 3.36
20-40 13.99 ± 3.18 0.92 ± 0.19 15.04 ± 0.94 299.36 ± 68.11 19.74 ± 4.11
7 0-20 23.49 ± 1.65 1.76 ± 0.04 13.40 ± 0.91 535.55 ± 37.71 40.03 ± 1.01
Preprints (www.preprints.org) | NOT PEER-REVIEWED | Posted: 31 May 2021 doi:10.20944/preprints202105.0734.v1

20-40 14.61 ± 4.09 1.01 ± 0.22 14.36 ± 1.54 312.68 ± 87.55 21.64 ± 4.68
The total amount of nitrogen present in the natural lowland bamboo forest soil was signifi-
cantly higher than the soil on the cultivated fields (P < 0.05), which may be attributed to the
effects of high biomass production of the bamboo and conversion and continuous cultivation
on the farm fields may contribute for the decline (Fig. 3a). The content of the total nitrogen in
the cultivated fields was not significantly different, except the soil depths, which declined
significantly to the lower soil layers at (P < 0.05) (Fig. 3b). Our study showed that the mean
SOC (1.5-3.9) and total nitrogen content (0.25-0.5) in the natural lowland bamboo forest
were rated significantly higher than the soil on the farm fields. The mean ratings of the SOC
and TN on continuously cultivated agricultural lands were found in medium level (1.5-3.9)
and (0.15-0.25), respectively (Table 2).
0 2 4 6 8
20
25
30
35
40
Soil
C (
g/k
g)
Cultivation period (Years)
Fig. 2. Effects of deforestation and subsequent cultivation on soil organic C (g/kg) contents in
agricultural land use chronosequence converted from natural lowland bamboo forest in the
southwest Ethiopia (0-20 cm). Regression equation (y), line of best fit, correlation coefficient
(r) and statistical significance (P < 0.001) and confidence interval (the error bars) are shown.
C = 23.97 + 12.40e-1.11t
R2 = 0.99***
Preprints (www.preprints.org) | NOT PEER-REVIEWED | Posted: 31 May 2021 doi:10.20944/preprints202105.0734.v1

The time zero along the x-axis denotes the natural forest and ‘t’ in the equation denotes
period of cultivation (year).
3.2.2. Carbon-to-nitrogen ratio
The carbon/nitrogen ratios for the two soil layers (0-20 and 20-40 cm) were significantly
lower (P < 0.05), respectively under the natural bamboo forests compared to continuously
cultivated agricultural fields. The two soil layers C/N ratios followed different patterns, in-
creased in the first cultivation period, and declined afterward on the upper 20 cm layer. In the
sub-surface soil layer, the C/N ratios increased up to five years of cultivation and decreased at
the cultivation period of seven years, but significantly higher than the natural bamboo forest
(Table 2). The C/N ratios of the natural bamboo forest declined from the top to the sub-
surface and observed a similar pattern in the first and third year cultivation period. In the cul-
tivation period of five and seven years, slightly increased from top to the sub-surface soil lay-
ers.
3.2.3. Relative changes in SOC and TN Stocks
Our result showed that the conversion of natural lowland bamboo forest to agricultural lands
in a chronosequnce has led to a significant (P < 0.001) net C loss of (23.50%, 31.14%,
34.07% and 35.5%) for SOC concentration in an interaction of cultivated years and soil depth
and 47.57% across the soil depths (Table 3). The TN concentrations decreased significantly
at (P < 0.001) with conversion of natural lowland bamboo forest to cultivated agricultural
lands in a chronosequences (47.15%, 35.76%, 43.04% and 44.30%), respectively (Table 3).
Similarily, SOC and TN stock showed a decreasing trend on the topsoil layers when natural
lowland bamboo converted into cultivated agricultural lands. In contrast, the conversion of
the natural lowland bamboo into agricultural land has contributed a significant SOC stock in
subsurface soil layers with a relative percent changes (41.60%, 10.65%, 13.63% and 18.68%)
in a chronosequence of cultivation (Table 3) and 4.75% TN stock gain in the first year.
3.2.4. Soil pH and Cation exchangeable capacity (CEC)
There were no significant interaction effects between the cultivation chronosequences and
soil sampling depths on soil pH. The values were significantly higher as the soil sampling
depths increased ( P < 0.05) and the seven year cultivated land had relatively higher soil pH
than the bamboo and young cultivated agricultural lands (Table 4). The exchangeable Na and
Ca:Mg ratios were not significantly different in both chronological sequences and sampling
Preprints (www.preprints.org) | NOT PEER-REVIEWED | Posted: 31 May 2021 doi:10.20944/preprints202105.0734.v1

depths. Exchangeable Na and Ca:Mg ratio in the 0-20 cm soil increased by 3.83, 0.17 and
0.03, respectively during the first one year cultivation period following deforestation of bam-
boo and gradually declined to the rest of the cultivation period except the exchangeable Na
and Ca:Mg ration, reaching peak at the fifth years and then declined to next cultivation period
in exch.Na and the Ca:Mg ration increased to the last two cultivation periods. CEC, echange-
able K, echangeable Ca and echangeable Mg were significantly changes in a chronosequenc-
es and soil layers (Table 4). Echangeable K, Echangeable Ca and Echangeable Mg contents
of the natural bamboo forest was significantly different from the cultivated lands and varied
along the soil layers (P < 0.05). CEC was reached peak during the 3rd year cultivation period
and declined in the 5th year and then gradualy increased to the rest of the cultivation periods.
The topsoil available P contents of both the natural bamboo forest and cultivated agricultural
fields were significantly different in a chronosequence (P < 0.05) and declined to the subsur-
face soil throughout the cultivation periods. The highest available soil P was measured during
the first 3 years of cultivated agricultural lands (Table 4)1.83.
Table 3. Mean (±SEM) for the contents of soil C and total N (g/kg), and soil C and total N stocks
(t/ha) in the 0-20 and 20-40 cm soil layers along agricultural land use chronosequence converted from
lowland bamboo compared to soil adjacent to the natural lowland bamboo forest.
Land-use change 0-20 cm 20-40 cm
SOC content TN content SOC content TN content
Bamboo-Year I -8.57 ± 2.26 -1.49 ± 0.39 5.12 ± 4.59 0.22 ± 0.29
Bamboo-Year III -11.34 ± 2.26 -1.12 ± 0.39 1.31 ± 4.59 -0.23 ± 0.29
Bamboo-Year V -12.41 ± 2.26 -1.36 ± 0.39 1.68 ± 4.59 -0.31 ± 0.29
Bamboo-Year VII -12.96 ± 2.26 -1.40 ± 0.39 2.30 ± 4.59 -0.22 ± 0.29
Mean -11.39 ± 2.26 -1.34 ± 0.39 2.60 ± 4.59 -0.14 ± 0.29
Land use change 0-20 cm 20-40 cm
SOC stock TN stock SOC stock TN stock
Bamboo-Year I -195.32 ± 51.65 -33.95 ± 8.99 109.62 ± 98.34 4.75 ± 6.15
Bamboo-Year III -258.65 ± 51.65 -25.59 ± 8.99 20.06 ± 98.34 -4.99 ± 6.15
Bamboo-Year V -282.97 ± 51.65 -30.90 ± 8.99 35.90 ± 98.34 -6.66 ± 6.15
Bamboo-Year VII -294.88 ± 51.65 -31.91 ± 8.99 49.22 ± 98.34 -4.76 ± 6.15
Mean -257.95 ± 51.65 -30.59 ± 8.99 53.70 ± 98.34 -2.3 ± 6.15
Preprints (www.preprints.org) | NOT PEER-REVIEWED | Posted: 31 May 2021 doi:10.20944/preprints202105.0734.v1

Cultivation periods in years
0 1 3 5 7
Mean tota
l nitro
gen c
onte
nt in
(%
)
0.10
0.12
0.14
0.16
0.18
0.20
0.22
0.24
0.26
0.28
Figure 3. The mean total nitrogen content changes in natural bamboo forests and cultivated
lands during the cultivation period (a) and across the sampled soil layers (b).
4. Discussion
4.1. Soil Physico-chemical characteristics
4.1.1. Soil texture distribution
Our study revealed that the sand and silt soil fractions declined rapidly with soil sampling
depths, whereas clay soil fraction increased to the subsoils as compared to topsoil. Clay con-
tents increased in subsoils with soil sampling depths as compared to topsoils. In this study,
the overall clay content tended to be increased and the sand soil fraction was tended to be
smaller in the cultivated lands in a chronosequence as compared the adjacent natural bamboo
forest. So, deforestation and cultivation promotes the weathering processes as it shears and
pulverizes the soil and changes the moisture and temperature regimes (Reicosky & Forcella,
1998). The soil textural differences also might be due to the variation of pedogenic processes,
especially in relation to the rate of weathering.
4.1.2. Soil pH, Soil organic carbon and total N contents
Our study highligheted that soil sampling depths have significant effects on soil pH in both
natural bamboo forests and cultivated agricultural lands in a chronological sequences. The
soil pH was found to be increased to the higher soil sampling depths that might be due to the
availability of high exchangeable base cations and higher acidification near the soil surface.
Preprints (www.preprints.org) | NOT PEER-REVIEWED | Posted: 31 May 2021 doi:10.20944/preprints202105.0734.v1

This finding is consistent with other studies on soil quality following deforestation and con-
version to agricultural lands (Davari et al., 2020; Kassa et al., 2017; D. Liu et al., 2018;
Moghiseh et al., 2013). The results of low surface soil pH values can be related to low con-
centrations of base forming cations (Ca2+ , K+ , Mg2+ and Na+ ) through a continuous nutrient
uptake by plants during the continuous cultivation and leaching and surface soil erosion loss.
This finding is in accordance with (Adugna & Abegaz, 2015; Negasa, 2020). Even though,
the fact that the measured pH values in both natural bamboo forest and cultivated land uses of
the subsurface lie within the optimal ranges (6-7.5), we observed that deforestation and sub-
sequent cultivation can lead to rise in soil pH (Table 4). This can be attributed to the use of
inorganic soil fertilizers and mixing up of the subsoil which is dominated by carbonates with
the topsoil. Elevated level of CO2 partial pressure lead to low soil pH values in forest soil due
to the formation of carbonic acid in the soil solution (Bargrizan et al., 2020). Accordingly,
solubility and leaching of calcium carbonates from the surface soil layer to lower depths can
be increased (Karchegani et al., 2012; Schindlbacher et al., 2015, 2019).
Soil organic carbon and total N content is found to be decreased significantly on the topsoil in
a chronosequence following deforestation and repeated cultivation. We also found that the
SOC and TN content increased in the topsoil (0-20 cm) and decreased in the 20-40 cm soil
layers. This result suggested that SOC and N dynamics of natural bamboo forest and agricul-
tural lands were dependent on sampling depths under different intensity of land uses which is
consistent with our research hypothesis. Our observed increase in the SOC and TN content in
the topsoil was consistent with the findings of previous studies by (Kassa et al., 2017;
Lemenih et al., 2005; Li et al., 2020). However, the continuous decline in the SOC and TN
content in a chronosequence will have a significant effects on the agricultural productivity
because the organic matter supplies taken up by the crops. Furthermore, the occurrence of
higher topsoil SOC and TN contents in a chronosequence might be due to the litter fall re-
turned to the surface soil as organic matter (Andivia et al., 2016; Innangi et al., 2017; Lei et
al., 2019). The first year cultivation period relatively has high subsurface SOC and TN that
can be due to root turnover and soil microbials contribution of organic matter decomposition
in the subsurface soil. The SOC and TN significantly higher in natural bamboo forest than
cultivated lands that might be due to the production of higher biomass in bamboo forests than
agricultural lands. (Liang et al., 2018) finding indicated that SOC and TN declined rapidly
with sampling depths which corresponds with our observation. Remarkably, in the subsurface
Preprints (www.preprints.org) | NOT PEER-REVIEWED | Posted: 31 May 2021 doi:10.20944/preprints202105.0734.v1

soil the SOC and TN were inceasing with the cultivation period. This might be related to the
accumulation and decomposition of organic matter through time.
The C/N ratio is influenced by the type of forest vegetation and other site related factors. The
range of the C:N ratio in the topsoil layers varied significantly from 13.20-17.00 and declined
to the subsoil layers in a range of 9.95-15.04. The C/N ration decreased with increasing soil
depths. This might be indicated a decreasing influence of forest and crop roots on a C/N ra-
tion with soil depth. This can be elucidated by decreasing soil organic matter content and
bamboo and crops root densities with increasing soil depths. This study result is supported by
the findings of (Cools et al. 2014; Langenbruch et al. 2012). In the subsoil layers the C/N ra-
tio was increased with increasing cultivation period. The can be related to the accumulated
and decomposed organic matter goes to the subsoil layer through time. In general, the C/N
ratio in this study < 25 which indicated that high nitrogen content is found in the soil. This
result is supported by the study of (Cools et al., 2014) who reported low, medium and high N
content with the C/N ratio variation.
4.1.3. Available Phosphorus, exchangeable calcium, exchangeable K and Magnesium
Conversion of natural forest vegetation to long-term agricultural production adversely affects
soil available phosphorus (P). The available P was varied significantly with soil layers and
cultivation periods in the topsoil layers in a chronosequence. Overall, the P concentration was
decreased when natural bamboo forest converted to cultivated agricultural lands. This result
is consistent with the study of (Zhang et al. 2020a) who reported that higher available P was
found in natural forest than crop, pasture and plantation forest. The natural lowland bamboo
forest and the three year cultivated lands have significantly higher topsoil available phospho-
rus than the other cultivated lands. This might be related to the litter fall and decomposition
from different leguminous and non-leguminous trees, shrubs, herbs and crop residues. This
finding is consistent with the study of (Kassa et al., 2017) who reported higher available in
forest and agroforestry.
Our study indicated that the concentrations of exchangeable Ca+, K+ and Mg+ were signifi-
cantly differ in the two land use types that might be due to the influences of the land uses and
application of chemical fertilizers. The concentration of mean exchangeable Na+ had no sig-
nificant differences with both sampling soil depths and cultivation periods (P < 0.05). Alt-
hough, there was significant interaction differences in the soil layers and cultivated years, the
natural bamboo forest had relatively the highest mean exc. Na+ (1.11 ppm (+) /100gm soil),
Preprints (www.preprints.org) | NOT PEER-REVIEWED | Posted: 31 May 2021 doi:10.20944/preprints202105.0734.v1

while the cultivated lands had lower concentration of Na+. This result is supported by the
findings of (Yimer et al., 2008), who reported that exchangeable Na+ concentration were
higher in grazing and native forest soils than cropland soils.
4.1.4. Cation exchange capacity and Electrical conductivity
Cation exchangeable capacity (CEC) and electrical conductivity (EC) are the most important
soil properties for major distinctions among land use-types. The natural bamboo forest and
agricultural lands have significantly higher topsoil and subsurface CEC in a chronosequence
of cultivation. This might be related to the accumulation of higher organic matter and clay
fractions in the surface of both natural bamboo forest and cultivated agricultural lands, from
which the organic matter formed by bamboo litter and crops residues completely breakdown
and decomposed, in both land use types. Our observation is similar with the study of (Gruba
& Mulder, 2015; Sohng et al., 2017). The presence of moderate to higher CEC (12.99-28.20
meq/100g of soil) in the subsurface soils of natural lowland bamboo forest and agricultural
lands can be explained by the availability of decomposed organic matter and weathered par-
ent material. The variation of trees, shrubs, and crop root and microbial communities have
intrinsic ability to increase the availability of organic matter, releasing base cations and nu-
trients to the subsurface soil layers. Our result is consistent with the findings of (Kassa et al.,
2017), who reported a rapid rise of CEC on the organic matter (in forest and agroforestry)
and evergreen forest of India (Grandgirard et al., 2002).
The EC values of both the natural bamboo forest and agricultural lands were ranged from
0.026-0.054 and 0.034-0.057, respectively (Table 4), but the difference within and between
soil sampling depths and cultivation year were not significant (P < 0.05). We observed rela-
tively higher EC values in cultivated agricultural lands as compared to the natural bamboo
forest. Our result is consistent with the findings of (Kizilkaya & Dengiz, 2010), who reported
that conversion of forest vegetation into agricultural land increased the value of EC due to the
application rate of inorganic fertilizers. This finding is contrasting with (Tellen & Yerima,
2018) who stated that natural forests had higher EC values as compared with grazing and
farmlands, conversion of those forest to cultivated lands leading to a decreased EC values in
cultivated lands. The contrasting trend of variation in EC of natural bamboo forest and culti-
vated lands can be attributed to the inconsistent mean annual application of fertilizers in the
agricultural lands. In the subsurface soil layers, the EC values were increased along a chron-
osequence of cultivation upto five years and then slightly declined to seven year cultivation
period.
Preprints (www.preprints.org) | NOT PEER-REVIEWED | Posted: 31 May 2021 doi:10.20944/preprints202105.0734.v1

4.2. Soil organic carbon, nitrogen stocks and their relationship with soil depth
Conversion of the forest vegetation into agricultural land uses, affect the soil physico-
chemical and biological properties whether positively or negatively with the extents of these
effects being controlled by the type of the agricultural practices implemented on the land
(Tully et al., 2015; Zajícová & Chuman, 2019). In Ethiopia no work has been done to investi-
gate the effects of the natural bamboo forest conversion to agricultural lands on soil proper-
ties.
Table 4. The mean soil chemical properties in the two soil layers along agricultural chronose-
quence converted from natural lowland bamboo forest compared to the adjacent natural bam-
boo forestland.
Soil properties Soil Depth
(cm)
Bamboo
forest
Cultivation periods (Years) ANOVA
1 3 5 7
pH_H2O (1:2.5) 0-20 5.93 ± 0.05 5.92 ± 0.21 5.82 ± 0.09 5.83 ± 0.09 5.97 ± 0.06 ans
20-40 6.36 ± 0.07 6.10 ± 0.15 6.25 ± 0.07 6.22 ± 0.1 6.22 ± 0.04 ans
pH_KCL 0-20 4.89 + 0.13 5.18 + 0.23 4.95 + 0.10 5.00 + 0.14 5.20 + 0.11 ans
20-40 5.43 + 0.08 5.57 + 0.20 5.40 + 0.05 5.39 + 0.13 5.47 + 0.08 ans
CEC 0-20 48.45 ± 4.72 39.25 ± 4.75 34.22 ± 3.75 23.26 ± 4.70 20.08 ± 6.11 *
(meq/100gm Soil) 20-40 28.20 ± 3.57 21.76 ± 2.46 20.42 ± 5.27 17.02 ± 4.50 12.99 ± 2.58 *
ECe 0-20 0.51 0.48 0.30 0.54 0.50
ans
20-40 0.25 0.32 0.40 0.47 0.42 ans
EC (ms/cm) 0-20 0.054 ± 0.01 0.051 ± 0.009 0.032 ± 0.003 0.057 ± 0.018 0.053 ± 0.006 ans
20-40 0.026 ± 0.003 0.034 ± 0.003 0.042 ± 0.014 0.049 ± 0.004 0.044 ± 0.005 ans
Echangeable Sodium 0-20 3.25 ± 0.72 1.69 ± 0.39 2.04 ± 0.42 2.11 ± 0.44 2.47 ± 0.21 *
Percentage (ESP) 20-40 3.51 ± 0.66 2.59 ± 0.62 2.67 ±0.38 5.33 ± 1.02 3.81 ± 0.60 *
Exchangeable Na 0-20 0.79 ± 0.18 0.96 ± 0.15 0.72 ± 0.18 1.11 ± 0.15 0.76 ± 0.14 ans
(ppm) 20-40 1.00 ± 19.00 0.89 ± 0.11 1.10 ± 0.16 1.14 ± 0.14 0.97 ± 0.13 ans
Exchangeable K 0-20 0.13 ± 0.02 0.11 ± 0.02 0.33 ± 0.08 0.12 ± 0.02 0.16 ± 0.05 *
(ppm) 20-40 0.10 ± 0.01 0.30 ± 0.18 0.18 ± 0.03 0.23 ± 0.03 0.28 ± 0.05 *
Exchangeable_Ca 0-20 12.90 ± 0.99 10.98 ± 1.63 16.92 ± 1.04 10.37 ± 0.59 14.29 ± 1.23 *
(ppm) 20-40 13.47 ± 2.82 25.67 ± 2.26 12.32 ± 1.29 23.17 ± 3.48 22.46 ± 3.15 *
Exchangeable Mg 0-20 4.54 ± 0.36 3.89 ± 0.59 5.88 ± 0.39 3.61 ± 0.21 4.89 ± 0.40 *
(ppm) 20-40 4.44 ± 0.97 8.60 ± 0.66 4.25 ± 0.46 7.79 ± 1.11 7.63 ± 1.04 *
Available Phosphorus
(P-available) 0-20 47.37 ± 8.24 23.68 ± 2.03 50.48 ± 6.27 29.20 ± 1.43 37.44 ± 2.06 *
20-40 18.97 ± 2.55 21.35 ± 2.07 18.62 ± 3.38 24.22 ± 3.61 22.96 ± 2.55 ans
Ca:Mg ratios 0-20 2.85 ± 0.05 2.88 ± 0.15 2.89 ± 0.04 2.88 ± 0.07 2.91 ± 0.05 ans
Preprints (www.preprints.org) | NOT PEER-REVIEWED | Posted: 31 May 2021 doi:10.20944/preprints202105.0734.v1

20-40 3.07 ± 0.08 2.96 ± 0.05 2.91 ± 0.04 2.94 ± 0.03 2.93 ± 0.07 ans
a no significance at P < 0.05
* Significant at P < 0.05
SOC and TN were the most discriminating variables across all sampling soil depths and cul-
tivated agricultural lands. Our study revealed that SOC and TN consistently decreased with
soil depth and agricultural land in a chronosequence. This pattern taking place in most eco-
systems and ascribed to the higher inputs of C and nutrients at the soil surface compared to
the subsurface soil layers (Jobbágy et al. 2001; Omonode & Vyn 2006; Chai et al. 2015;
Goebes et al. 2019; Murphy et al. 2019). Both SOC and TN were significantly higher in natu-
ral lowland bamboo forest as compared with agricultural lands in a chronosequences (P <
0.001). This clearly shows that without the accumulation of litter on agricultural lands, SOC
and TN could become lower. Whereas in the subsurface soil layers no significance differ-
ences were observed when we compared natural bamboo forest and agricultural lands culti-
vated in a chronosequences. As the stocks declined with soil depths, the organic matter be-
comes progressively enriched with N, leading to lower C:N ratio at depth (Tipping et al.,
2016). Given its fast growth, large biomass and high litter production, bamboo could play an
important role in redressing most of the deforestation related problems (Embaye et al., 2003)
and affecting the nutrient turnover and forest regeneration (Takahashi et al 2007; Austin and
Marchesini 2012). This result is in line with the previous work of (Mohammed & Bekele,
2017; Yuen et al., 2017; T. Zhang et al., 2013) who evidenced high soil carbon stock in bam-
boo forest as compared to native forest, evergreen forest and paddy fields, respectively. The
result is in contrary of (Kenye et al. 2019) that bamboo has low SOC stock as compared to
homegarden, grassland, natural forest and shifting cultivation. This can be explained by the
legacy effects of the land use history, climate and types of bamboo species used in the studies
are different.
Additionally, we found low SOC and TN in agricultural lands that might be due to the crops
nutrient uptake, leaching and surface erosion losses. Inappropriare land management practic-
es, animal grazing and crop residue removal might have negative effects on SOC and TN to
be low in the croplands surface and subsurface soils. The finding is in line with the study of
(Don et al., 2011; D. Liu et al., 2018). And also a meta-analysis conducted by (Wei et al.,
2014) indicated that 34.7% and 45% of Soil C stock was lost due to conversion of forest to
agricultural lands in early stage (≤ 10 years) and middle stage (11-15 years), respectively.
Preprints (www.preprints.org) | NOT PEER-REVIEWED | Posted: 31 May 2021 doi:10.20944/preprints202105.0734.v1

5. Conclusion
The conversion of the natural lowland bamboo forest into agricultural lands has significant
changes on the soil physical and chemical properties. Soils collected from the natural lowland
bamboo forest and cultivated in a chronosequence, showed a significant differerences in soil
sand, silt/clay ratio, SOC, TN concentration and stocks, CEC, ESP, available P, exchangeable
K, Ca, and Mg in both soil sampling depths and cultivation periods. Our result suggests that
conversion of natural lowland bamboo forest into agricultural lands has direct implications on
soil physical and chemical properties. Sebsequent cultivation of agricultural lands will not be
sustainable as the result indicated significant soil degradation. Therefore, soil improvement
practices should be in place to esnsure sustainability of soil quality and agricultural produc-
tivity.
Preprints (www.preprints.org) | NOT PEER-REVIEWED | Posted: 31 May 2021 doi:10.20944/preprints202105.0734.v1

References
Adejuwon, J. O., & Ekanade, O. (1988). A comparison of soil properties under different
landuse types in a part of the Nigerian cocoa belt. Catena, 15(3–4), 319–331.
https://doi.org/10.1016/0341-8162(88)90054-9
Adugna, A., & Abegaz, A. (2015). Effects of soil depth on the dynamics of selected soil
properties among the highlands resources of Northeast Wollega, Ethiopia: are these sign
of degradation? Solid Earth Discussions, 7(3), 2011–2035. https://doi.org/10.5194/sed-
7-2011-2015
Andivia, E., Rolo, V., Jonard, M., Formánek, P., & Ponette, Q. (2016). Tree species identity
mediates mechanisms of top soil carbon sequestration in a Norway spruce and European
beech mixed forest. Annals of Forest Science, 73(2), 437–447.
https://doi.org/10.1007/s13595-015-0536-z
Aran, D., Gury, M., & Jeanroy, E. (2001). Organo-metallic complexes in an Andosol: A
comparative study with a Cambisol and Podzol. Geoderma, 99(1–2), 65–79.
https://doi.org/10.1016/S0016-7061(00)00064-1
Austin, A. T., & Marchesini, V. A. (2012). Gregarious flowering and death of understorey
bamboo slow litter decomposition and nitrogen turnover in a southern temperate forest
in Patagonia, Argentina. Functional Ecology, 26(1), 265–273.
https://doi.org/10.1111/j.1365-2435.2011.01910.x
Bargrizan, S., Smernik, R. J., & Mosley, L. M. (2020). Constraining the carbonate system in
soils via testing the internal consistency of pH, pCO2 and alkalinity measurements.
Geochemical Transactions, 21(1), 1–10. https://doi.org/10.1186/s12932-020-00069-5
Barton, C. D., & Karathanasis, A. D. (1997). Measuring cation exchange capacity and total
exchangeable bases in batch and flow experiments. Soil Technology, 11(2), 153–162.
https://doi.org/10.1016/S0933-3630(97)00002-0
Black, C. A., Evans, D. D., White, J. L., Ensminger, L. E., & Clark, F. E. (1965). Methods of
Soil Analysis. Part 1. Physical and Mineralogical Properties Including Statistics of
Measurement and Sampling.
Cardoso, E. J. B. N., Vasconcellos, R. L. F., Bini, D., Miyauchi, M. Y. H., dos Santos, C. A.,
Alves, P. R. L., de Paula, A. M., Nakatani, A. S., Pereira, J. de M., & Nogueira, M. A.
(2013). Soil health: Looking for suitable indicators. What should be considered to assess
the effects of use and management on soil health? Scientia Agricola, 70(4), 274–289.
https://doi.org/10.1590/S0103-90162013000400009
Chai, H., Yu, G., He, N., Wen, D., Li, J., & Fang, J. (2015). Vertical distribution of soil
carbon, nitrogen, and phosphorus in typical Chinese terrestrial ecosystems. Chinese
Geographical Science, 25(5), 549–560. https://doi.org/10.1007/s11769-015-0756-z
Chan, Y. (2008). Increasing soil organic carbon of agricultural land. Carbon, JANUARY.
Cools, N., Vesterdal, L., De Vos, B., Vanguelova, E., & Hansen, K. (2014). Tree species is
the major factor explaining C: N ratios in European forest soils. Forest Ecology and
Management, 311, 3–16. https://doi.org/10.1016/j.foreco.2013.06.047
CRGE. (2011). Ethiopia’s Climate Resilient Green Economy .Sustainable Development
Knowledge Platform. Report, III(November), 200.
Preprints (www.preprints.org) | NOT PEER-REVIEWED | Posted: 31 May 2021 doi:10.20944/preprints202105.0734.v1

http://sustainabledevelopment.un.org/index.php?page=view&type=400&nr=677&menu
=865
Davari, M., Gholami, L., Nabiollahi, K., Homaee, M., & Jafari, H. J. (2020). Deforestation
and cultivation of sparse forest impacts on soil quality (case study: West Iran, Baneh).
Soil and Tillage Research, 198(February 2019), 104504.
https://doi.org/10.1016/j.still.2019.104504
Demissew, S., Nordal, I., Herrmann, C., Friis, I., Awas, T., & Stabbetorp, O. (2005).
Diversity and endemism of the western Ethiopian escarpment – a preliminary
comparison with other areas of the Horn of Africa. Biologiske Skrifter, 55(August 2014),
315–330.
Dewitte, O., Jones, A., Spaargaren, O., Breuning-Madsen, H., Brossard, M., Dampha, A.,
Deckers, J., Gallali, T., Hallett, S., Jones, R., Kilasara, M., Le Roux, P., Michéli, E.,
Montanarella, L., Thiombiano, L., Van Ranst, E., Yemefack, M., & Zougmore, R.
(2013). Harmonisation of the soil map of africa at the continental scale. Geoderma, 211–
212, 138–153. https://doi.org/10.1016/j.geoderma.2013.07.007
Don, A., Schumacher, J., & Freibauer, A. (2011). Impact of tropical land-use change on soil
organic carbon stocks - a meta-analysis. Global Change Biology, 17(4), 1658–1670.
https://doi.org/10.1111/j.1365-2486.2010.02336.x
Doran, J. W. (2002). Soil health and global sustainability: translating science into practice.
Agriculture, Ecosystems and Environment, 119–127(88), 1–10.
https://doi.org/10.1007/11545163_1
Elias, E., & Scoones, I. (1999). Perspectives on soil fertility change: A case study from
southern Ethiopia. Land Degradation and Development, 10(3), 195–206.
https://doi.org/10.1002/(SICI)1099-145X(199905/06)10:3<195::AID-
LDR328>3.0.CO;2-N
Embaye, K., Christersson, L., Ledin, S., & Weih, M. (2003). Bamboo as bioresource in
Ethiopia : management strategy to improve seedling performance ( Oxytenanthera
abyssinica ). Bioresource Technology, 88, 33–39.
FAO. (1976). Framework for Land Evaluation. In Int Inst Land Reclam Improv Neth Publ
(Issue 22).
FAO. (2006). Guidelines for soil description (2006): FAO, Rome, 4th edition (Issue August
2018).
Goebes, P., Schmidt, K., Seitz, S., Both, S., Bruelheide, H., Erfmeier, A., Scholten, T., &
Kühn, P. (2019). The strength of soil-plant interactions under forest is related to a
Critical Soil Depth. Scientific Reports, 9(1), 1–12. https://doi.org/10.1038/s41598-019-
45156-5
Grandgirard, J., Poinsot, D., Krespi, L., Nénon, J. P., & Cortesero, A. M. (2002). Costs of
secondary parasitism in the facultative hyperparasitoid Pachycrepoideus dubius: Does
host size matter? Entomologia Experimentalis et Applicata, 103(3), 239–248.
https://doi.org/10.1023/A
Gruba, P., & Mulder, J. (2015). Tree species affect cation exchange capacity (CEC) and
cation binding properties of organic matter in acid forest soils. Science of the Total
Environment, 511, 655–662. https://doi.org/10.1016/j.scitotenv.2015.01.013
Preprints (www.preprints.org) | NOT PEER-REVIEWED | Posted: 31 May 2021 doi:10.20944/preprints202105.0734.v1

Hillele, D. C., & Rosenweig, D. P. (2004). Encyclopedia of soils in the environment.
Innangi, M., Danise, T., d’Alessandro, F., Curcio, E., & Fioretto, A. (2017). Dynamics of
organic matter in leaf litter and topsoil within an Italian alder (Alnus cordata (Loisel.)
Desf.) ecosystem. Forests, 8(7). https://doi.org/10.3390/f8070240
Islam, K. R., & Weil, R. R. (2000). Land use effects on soil quality in a tropical forest
ecosystem of Bangladesh. Agriculture, Ecosystems and Environment, 79(1), 9–16.
https://doi.org/10.1016/S0167-8809(99)00145-0
Jobbagy, E. G., & Jackson, R. B. (2000). The Vertical Distribution of Soil Organic Carbon
and Its Relation to Climate and Vegetation. Ecological Applications, 10(2), 423.
https://doi.org/10.2307/2641104
Jobbágy, E. G., Jackson, R. B., Biogeochemistry, S., & Mar, N. (2001). The Distribution of
Soil Nutrients with Depth : Global Patterns and the Imprint of Plants Published by :
Springer Stable URL : http://www.jstor.org/stable/1469627 REFERENCES Linked
references are available on JSTOR for this article : You may need to log i.
Biogeochemistry, 53(1), 51–77. https://link-springer-
com.libraryproxy.griffith.edu.au/content/pdf/10.1023%2FA%3A1010760720215.pdf
Juhos, K., Czigány, S., Madarász, B., & Ladányi, M. (2019). Interpretation of soil quality
indicators for land suitability assessment – A multivariate approach for Central
European arable soils. Ecological Indicators, 99(November 2018), 261–272.
https://doi.org/10.1016/j.ecolind.2018.11.063
Kalu, S., Koirala, M., Khadka, U. R., & C, A. K. (2015). Soil Quality Assessment for
Different Land Use in the Panchase Area of Western Nepal. International Journal of
Environmental Protection, 5(1), 38–43. https://doi.org/10.5963/ijep0501006
Karchegani, P. M., Ayoubi, S., Mosaddeghi, M. R., & Honarjoo, N. (2012). Soil organic
carbon pools in particle-size fractions as affected by slope gradient and land use change
in hilly regions, western Iran. Journal of Mountain Science, 9(1), 87–95.
https://doi.org/10.1007/s11629-012-2211-2
Kassa, H., Dondeyne, S., Poesen, J., Frankl, A., & Nyssen, J. (2017). Impact of deforestation
on soil fertility, soil carbon and nitrogen stocks: the case of the Gacheb catchment in the
White Nile Basin, Ethiopia. Agriculture, Ecosystems and Environment, 247(June), 273–
282. https://doi.org/10.1016/j.agee.2017.06.034
Kenye, A., Kumar Sahoo, U., Lanabir Singh, S., & Gogoi, A. (2019). Soil organic carbon
stock of different land uses of Mizoram, Northeast India. AIMS Geosciences, 5(1), 25–
40. https://doi.org/10.3934/geosci.2019.1.25
Kizilkaya, R., & Dengiz, O. (2010). Variation of land use and land cover effects on some soil
physico-chemical characteristics and soil enzyme activity. Zemdirbyste, 97(2), 15–24.
Langenbruch, C., Helfrich, M., & Flessa, H. (2012). Effects of beech (Fagus sylvatica), ash
(Fraxinus excelsior) and lime (Tilia spec.) on soil chemical properties in a mixed
deciduous forest. Plant and Soil, 352(1–2), 389–403. https://doi.org/10.1007/s11104-
011-1004-7
Lei, Z., Yu, D., Zhou, F., Zhang, Y., Yu, D., Zhou, Y., & Han, Y. (2019). Changes in soil
organic carbon and its influencing factors in the growth of Pinus sylvestris var.
mongolica plantation in Horqin Sandy Land, Northeast China. Scientific Reports, 9(1),
Preprints (www.preprints.org) | NOT PEER-REVIEWED | Posted: 31 May 2021 doi:10.20944/preprints202105.0734.v1

1–12. https://doi.org/10.1038/s41598-019-52945-5
Lemenih, M., Karltun, E., & Olsson, M. (2005). Assessing soil chemical and physical
property responses to deforestation and subsequent cultivation in smallholders farming
system in Ethiopia. Agriculture, Ecosystems and Environment, 105(1–2), 373–386.
https://doi.org/10.1016/j.agee.2004.01.046
Li, Q., Li, A., Dai, T., Fan, Z., Luo, Y., Li, S., Yuan, D., Zhao, B., Tao, Q., Wang, C., Li, B.,
Gao, X., Li, Y., Li, H., & Wilson, J. P. (2020). Depth-dependent soil organic carbon
dynamics of croplands across the Chengdu Plain of China from the 1980s to the 2010s.
Global Change Biology, 26(7), 4134–4146. https://doi.org/10.1111/gcb.15110
Liang, Z., Elsgaard, L., Nicolaisen, M. H., Lyhne-Kjærbye, A., & Olesen, J. E. (2018).
Carbon mineralization and microbial activity in agricultural topsoil and subsoil as
regulated by root nitrogen and recalcitrant carbon concentrations. Plant and Soil, 433(1–
2), 65–82. https://doi.org/10.1007/s11104-018-3826-z
Liu, D., Huang, Y., An, S., Sun, H., Bhople, P., & Chen, Z. (2018). Soil physicochemical and
microbial characteristics of contrasting land-use types along soil depth gradients.
Catena, 162(October), 345–353. https://doi.org/10.1016/j.catena.2017.10.028
Liu, X., Liang, J., & Gu, L. (2020). Photosynthetic and environmental regulations of the
dynamics of soil respiration in a forest ecosystem revealed by analyses of decadal time
series. Agricultural and Forest Meteorology, 282–283(November 2018), 107863.
https://doi.org/10.1016/j.agrformet.2019.107863
Maschinen, B., Investition, A., Beschaffungen, G., Ersatzbeschaffungen, B., &
Mittelherkunft, S. (2015). Soil Microbiology, Ecology and Biochemistry.
Moghiseh, E., Heidari, A., & Ghannadi, M. (2013). Impacts of deforestation and reforestation
on soil organic carbon storage and CO2 emission. Soil and Environment, 32(1), 1–13.
Mohammed, A., & Bekele, L. (2017). Changes in Carbon Stocks and Sequestration Potential
under Native Forest and Adjacent Land use Systems at Gera , South- Western Ethiopia
ChangesinCarbonStocksandSequestrationPotentialunderNativeForestandAdjacentLandu
seSystemsatGeraSouthWesternEthiopia. Global Journal of Science Frontier Research,
14(January 2014), 10–20.
Murphy, B. W., Wilson, B. R., & Koen, T. (2019). Mathematical Functions to Model the
Depth Distribution of Soil Organic Carbon in a Range of Soils from New South Wales,
Australia under Different Land Uses. Soil Systems, 3(3), 46.
https://doi.org/10.3390/soilsystems3030046
Negasa, D. J. (2020). Effects of Land Use Types on Selected Soil Properties in Central
Highlands of Ethiopia. Applied and Environmental Soil Science, 2020.
https://doi.org/10.1155/2020/7026929
Omonode, R. A., & Vyn, T. J. (2006). Vertical distribution of soil organic carbon and
nitrogen under warm-season native grasses relative to croplands in west-central Indiana,
USA. Agriculture, Ecosystems and Environment, 117(2–3), 159–170.
https://doi.org/10.1016/j.agee.2006.03.031
Rais, M., & Sharma, D. C. (2008). Characterising indicators of sustainable land management
in Indian himalayan sloping lands. Journal of Environmental Assessment Policy and
Management, 10(4), 431–460. https://doi.org/10.1142/S1464333208003111
Preprints (www.preprints.org) | NOT PEER-REVIEWED | Posted: 31 May 2021 doi:10.20944/preprints202105.0734.v1

Reicosky, D. C., & Forcella, F. (1998). Cover crop and soil quality interactions in
agroecosystems. Journal of Soil and Water Conservation, 3(53), 224–229.
Safaei, M., Bashari, H., Mosaddeghi, M. R., & Jafari, R. (2019). Assessing the impacts of
land use and land cover changes on soil functions using landscape function analysis and
soil quality indicators in semi-arid natural ecosystems. Catena, 177(February), 260–271.
https://doi.org/10.1016/j.catena.2019.02.021
Schindlbacher, A., Beck, K., Holzheu, S., & Borken, W. (2019). Inorganic Carbon Leaching
From a Warmed and Irrigated Carbonate Forest Soil. Frontiers in Forests and Global
Change, 2(August), 1–13. https://doi.org/10.3389/ffgc.2019.00040
Schindlbacher, A., Borken, W., Djukic, I., Brandstätter, C., Spötl, C., & Wanek, W. (2015).
Contribution of carbonate weathering to the CO2 efflux from temperate forest soils.
Biogeochemistry, 124(1–3), 273–290. https://doi.org/10.1007/s10533-015-0097-0
Seifu, W., & Elias, E. (2018). Soil Quality Attributes and Their Role in Sustainable
Agriculture: A Review. International Journal of Plant & Soil Science, 26(3), 1–26.
https://doi.org/10.9734/ijpss/2018/41589
Sione, S. M. J., Wilson, M. G., Lado, M., & González, A. P. (2017). Evaluation of soil
degradation produced by rice crop systems in a Vertisol, using a soil quality index.
Catena, 150, 79–86. https://doi.org/10.1016/j.catena.2016.11.011
Smal, H., Ligęza, S., Pranagal, J., Urban, D., & Pietruczyk-Popławska, D. (2019). Changes in
the stocks of soil organic carbon, total nitrogen and phosphorus following afforestation
of post-arable soils: A chronosequence study. Forest Ecology and Management,
451(August). https://doi.org/10.1016/j.foreco.2019.117536
Sohng, J., Singhakumara, B. M. P., & Ashton, M. S. (2017). Effects on soil chemistry of
tropical deforestation for agriculture and subsequent reforestation with special reference
to changes in carbon and nitrogen. Forest Ecology and Management, 389, 331–340.
https://doi.org/10.1016/j.foreco.2016.12.013
Tadesse., D. (2007). Forest cover change and socioeconomic drivers in southwest Ethiopia.
Technische Universität München.
Takahashi, M., Furusawa, H., Limtong, P., Sunanthapongsuk, V., Marod, D., & Panuthai, S.
(2007). Soil nutrient status after bamboo flowering and death in a seasonal tropical
forest in western Thailand. Ecological Research, 22(1), 160–164.
https://doi.org/10.1007/s11284-006-0194-6
Tellen, V. A., & Yerima, B. P. K. (2018). Effects of land use change on soil physicochemical
properties in selected areas in the North West region of Cameroon. Environmental
Systems Research, 7(1). https://doi.org/10.1186/s40068-018-0106-0
Tipping, E., Somerville, C. J., & Luster, J. (2016). The C:N:P:S stoichiometry of soil organic
matter. Biogeochemistry, 130(1–2), 117–131. https://doi.org/10.1007/s10533-016-0247-
z
Tully, K., Sullivan, C., Weil, R., & Sanchez, P. (2015). The State of Soil Segradation in Sub-
Saharan Africa: Baselines, Trajectories, and Solutions. June.
https://doi.org/10.3390/su7066523
Wang, X., & Gong, Z. (1998). Assessment and analysis of soil quality changes after eleven
years of reclamation in subtropical China. Geoderma, 81(3–4), 339–355.
Preprints (www.preprints.org) | NOT PEER-REVIEWED | Posted: 31 May 2021 doi:10.20944/preprints202105.0734.v1

https://doi.org/10.1016/S0016-7061(97)00109-2
Wei, X., Shao, M., Gale, W., & Li, L. (2014). Global pattern of soil carbon losses due to the
conversion of forests to agricultural land. Scientific Reports, 4, 6–11.
https://doi.org/10.1038/srep04062
White, F. (1983). The vegetation of Africa: A descriptive memior to accompany the
UNESCO/AETFAT/UNESO. Natural Resources Research XX.
Yimer, F., Ledin, S., & Abdelkadir, A. (2008). Concentrations of exchangeable bases and
cation exchange capacity in soils of cropland, grazing and forest in the Bale Mountains,
Ethiopia. Forest Ecology and Management, 256(6), 1298–1302.
https://doi.org/10.1016/j.foreco.2008.06.047
Yuen, J. Q., Fung, T., & Ziegler, A. D. (2017). Carbon stocks in bamboo ecosystems
worldwide: Estimates and uncertainties. Forest Ecology and Management, 393(August),
113–138. https://doi.org/10.1016/j.foreco.2017.01.017
Zajícová, K., & Chuman, T. (2019). Effect of land use on soil chemical properties after 190
years of forest to agricultural land conversion. 2019(3), 121–131.
Zhang, T., Li, Y., Chang, S. X., Jiang, P., Zhou, G., Liu, J., & Lin, L. (2013). Converting
paddy fields to Lei bamboo (Phyllostachys praecox) stands affected soil nutrient
concentrations, labile organic carbon pools, and organic carbon chemical compositions.
Plant and Soil, 367(1–2), 249–261. https://doi.org/10.1007/s11104-012-1551-6
Zhang, Yan, Liao, X., Wang, Z., Wei, X., Jia, X., & Shao, M. (2020). Synchronous
sequestration of organic carbon and nitrogen in mineral soils after conversion
agricultural land to forest. Agriculture, Ecosystems and Environment, 295(February),
106866. https://doi.org/10.1016/j.agee.2020.106866
Zhang, Yaqi, Bhattacharyya, R., Dalal, R. C., Wang, P., Menzies, N. W., & Kopittke, P. M.
(2020). Impact of land use change and soil type on total phosphorus and its fractions in
soil aggregates. Land Degradation and Development, 31(7), 828–841.
https://doi.org/10.1002/ldr.3501
Preprints (www.preprints.org) | NOT PEER-REVIEWED | Posted: 31 May 2021 doi:10.20944/preprints202105.0734.v1