c h a p t e r the demand for labor in the short run 4
TRANSCRIPT
C H A P T E R
The Demand for Labor in the Short Run
4
© 2003 South-Western
2
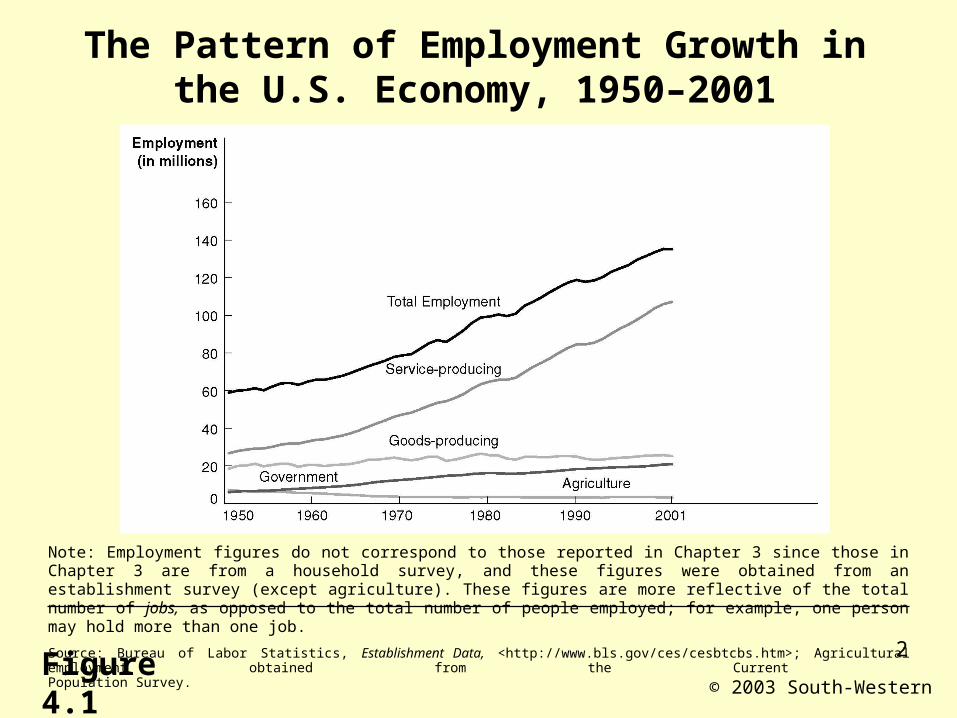
The Pattern of Employment Growth in the U.S. Economy, 1950–2001
Figure 4.1
Note: Employment figures do not correspond to those reported in Chapter 3 since those in Chapter 3 are from a household survey, and these figures were obtained from an establishment survey (except agriculture). These figures are more reflective of the total number of jobs, as opposed to the total number of people employed; for example, one person may hold more than one job.
Source: Bureau of Labor Statistics, Establishment Data, <http://www.bls.gov/ces/cesbtcbs.htm>; Agricultural employment obtained from the Current Population Survey.

© 2003 South-Western
3
Data Necessary to Derive A Hypothetical Firm’s Labor Demand Curve
Table 4.1

© 2003 South-Western
4
The Relationship Between Total and Marginal Product Schedules
Figure 4.2
© 2003 South-Western
5
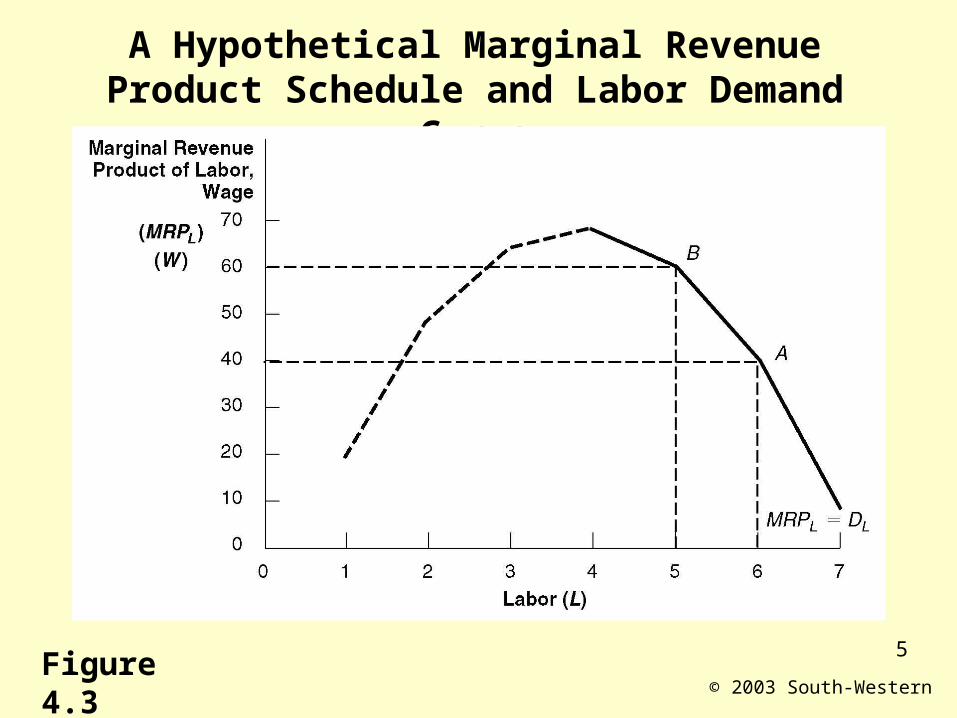
A Hypothetical Marginal Revenue Product Schedule and Labor Demand Curve
Figure 4.3

© 2003 South-Western
6
The Impact on the Labor Demand Curve of Changes in Product Demand and Market Structure
Figure 4.4

© 2003 South-Western
7
Derivation of the Market Labor Demand Curve
Figure 4.5
© 2003 South-Western
8
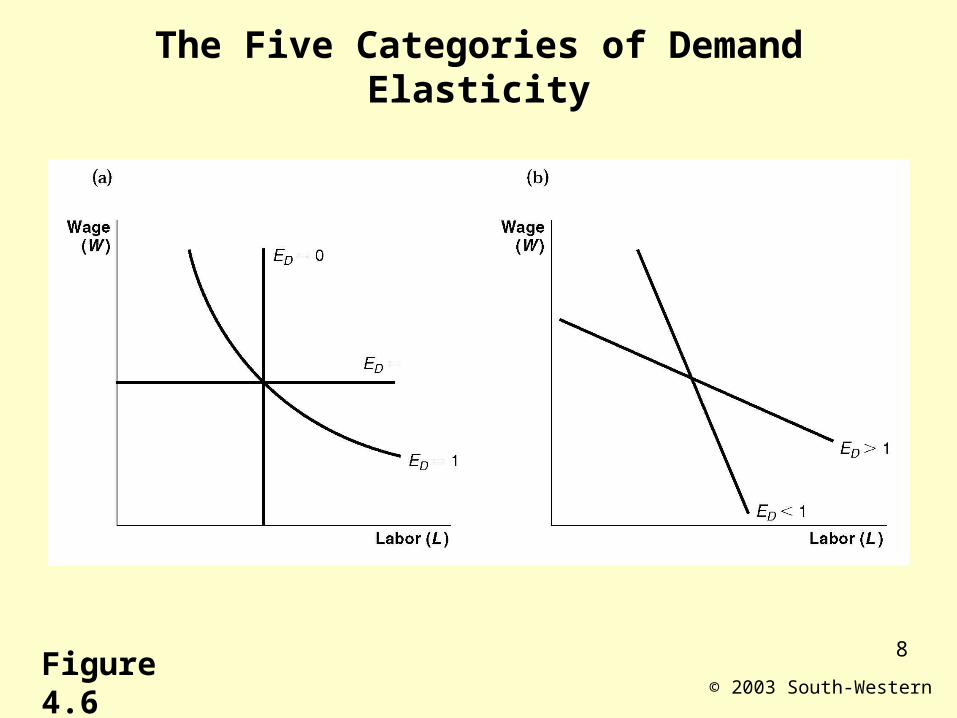
The Five Categories of Demand Elasticity
Figure 4.6
© 2003 South-Western
9
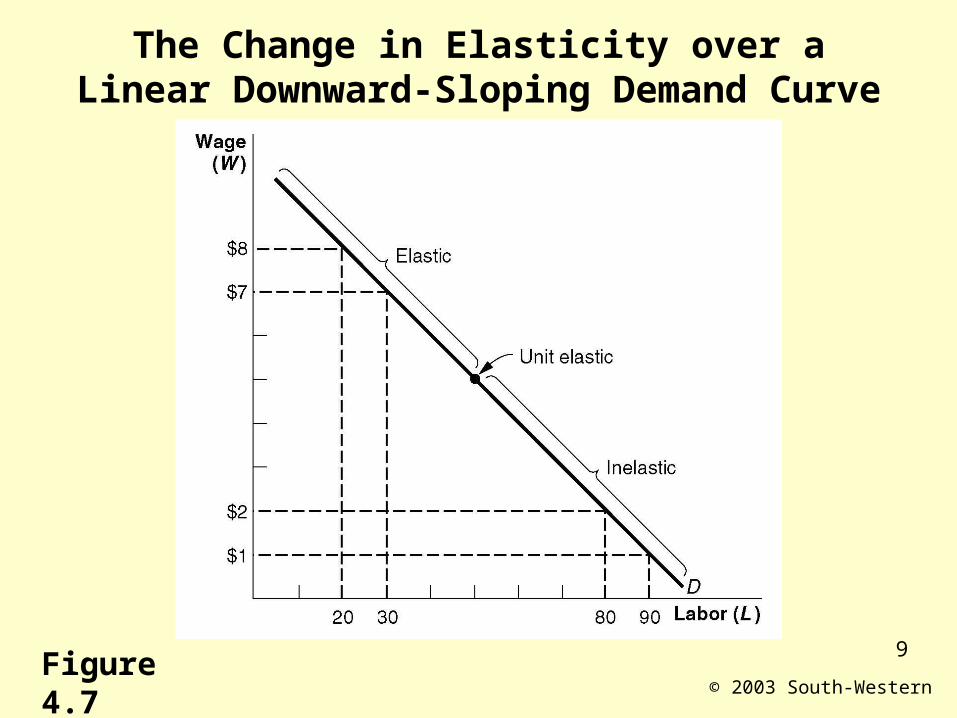
The Change in Elasticity over a Linear Downward-Sloping Demand Curve
Figure 4.7

© 2003 South-Western
10
The Growth in Nonagricultural Employment over the Business Cycle, 1947–2001
Figure 4.8
SOURCE: Department of Commerce, Survey of Current Business (Washington, D.C.: Government Printing Office) and Bureau of Labor Statistics, <http://www.bls.gov/webapps/legacy/cesbtab1.htm>
© 2003 South-Western
11
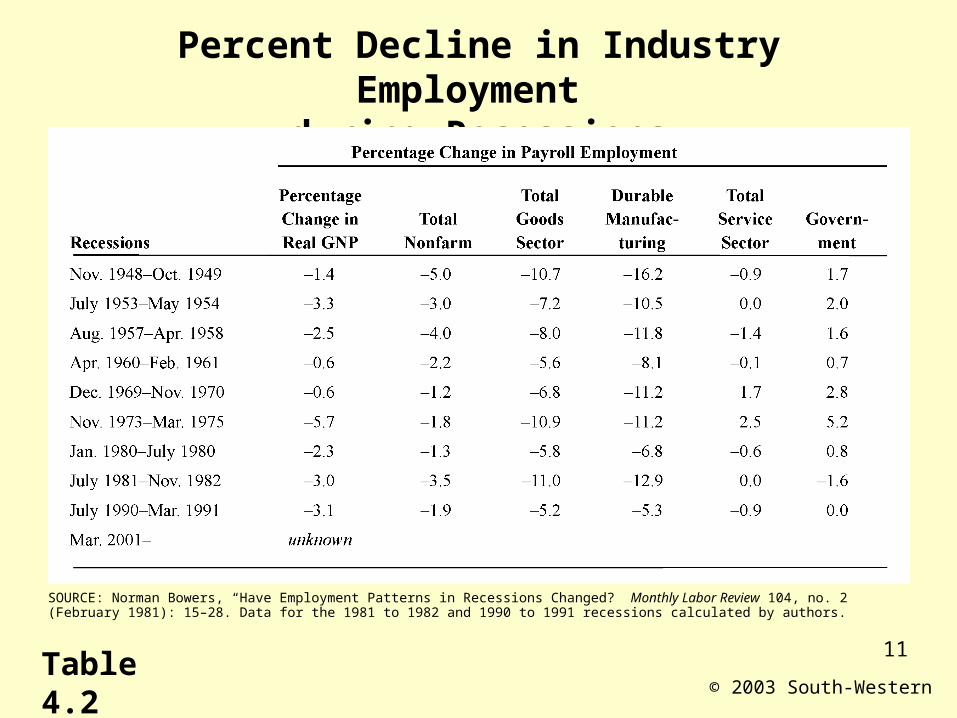
Percent Decline in Industry Employment during Recessions
Table 4.2
SOURCE: Norman Bowers, “Have Employment Patterns in Recessions Changed?” Monthly Labor Review 104, no. 2 (February 1981): 15–28. Data for the 1981 to 1982 and 1990 to 1991 recessions calculated by authors.
© 2003 South-Western
12
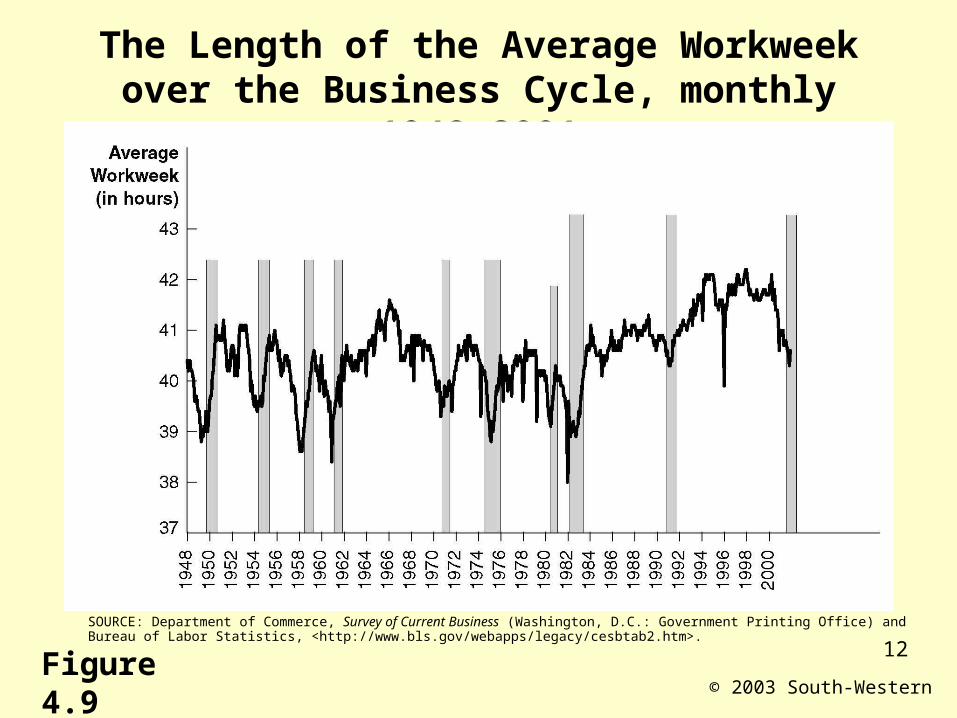
The Length of the Average Workweek over the Business Cycle, monthly 1948–2001
Figure 4.9
SOURCE: Department of Commerce, Survey of Current Business (Washington, D.C.: Government Printing Office) and Bureau of Labor Statistics, <http://www.bls.gov/webapps/legacy/cesbtab2.htm>.

© 2003 South-Western
13
Employment Growth in 10 Consumer Goods Industries, 1980–2000
Table 4.3
SOURCE: U.S. Census Bureau, Statistical Abstract of the United States: 2001, Table 609 <http://www.census.gov/statab/www/>.
© 2003 South-Western
14
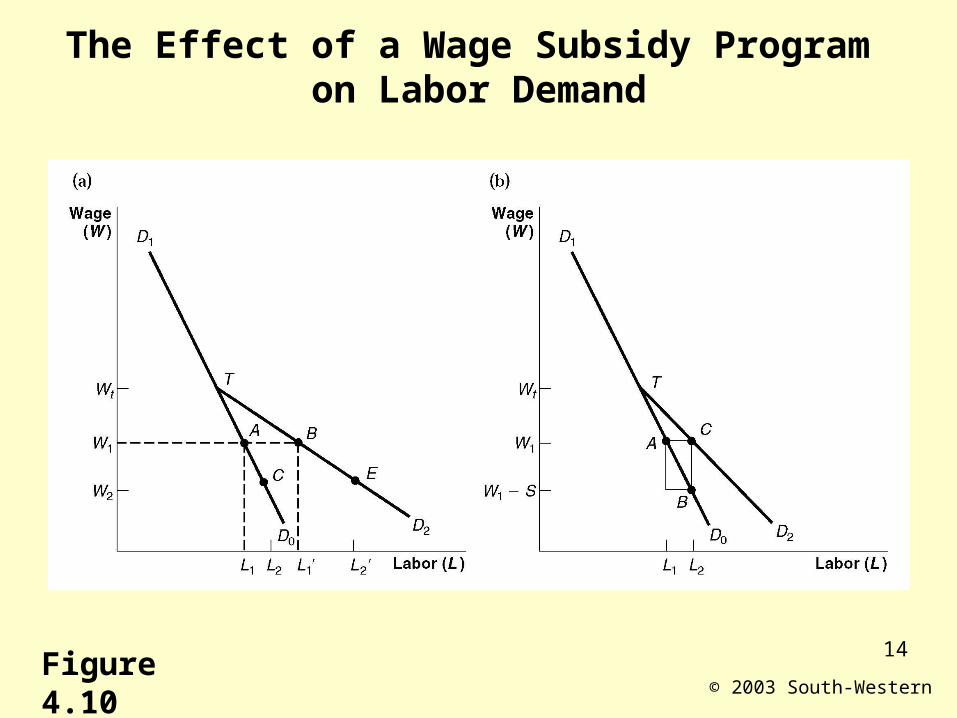
The Effect of a Wage Subsidy Program on Labor Demand
Figure 4.10
© 2003 South-Western
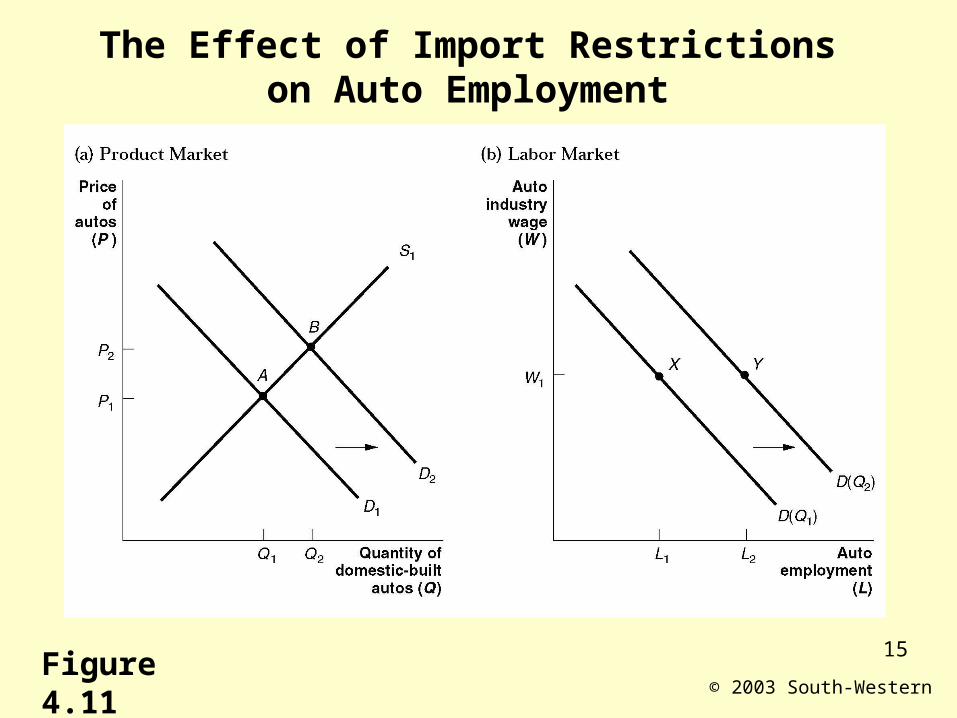
15
The Effect of Import Restrictions on Auto Employment
Figure 4.11

© 2003 South-Western
16
Impact of Import Restrictions on Price and Employment in Seven Industries (in 2000 dollars)
Table 4.4

© 2003 South-Western
17
The Demand for Labor and Wage Concessions
Figure 4.12

E N D