c hapter 47 e nergy in e cosystems. p roducers provide energy for other organisms in an ecosystem....
TRANSCRIPT

CHAPTER 47ENERGY IN ECOSYSTEMS

PRODUCERS PROVIDE ENERGY FOR OTHER ORGANISMS IN AN ECOSYSTEM. Producers = Plants
Producers are also known as autotrophs—they make their own food.Producers need sunlight to make food.
The sun is their main source of energy.

ALMOST ALL PRODUCERS OBTAIN ENERGY FROM SUNLIGHT.
Most producers on Earth use sunlight as their energy source—they undergo photosynthesis to manufacture carbohydrates.
Chemosynthesis In 1977, scientists discovered
the first prokaryotes (archaea) that did NOT need sunlight to make food.
Instead, these prokaryotes utilized the chemicals in the water to form carbohydrates—this is called chemosynthesis.

Consumers = Everything else!Consumers are also known as
heterotrophs-- Organisms that get their energy by eating other living or once-living resources.Energy flows from producers to consumers.
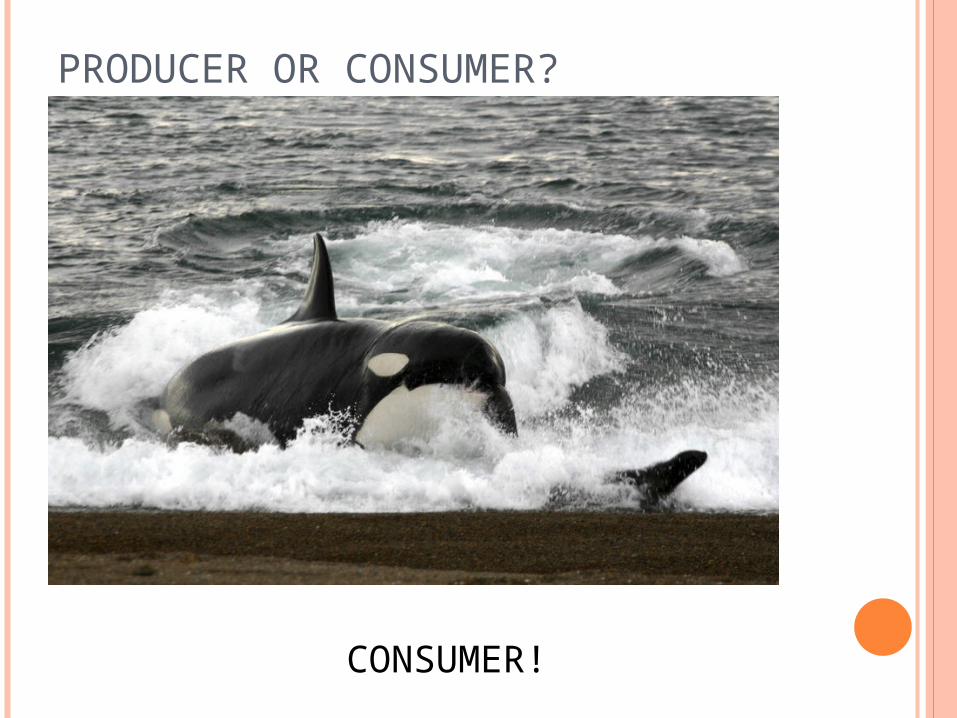
PRODUCER OR CONSUMER?
CONSUMER!

PRODUCER OR CONSUMER?
PRODUCER

PRODUCER OR CONSUMER?
PRODUCER

PRODUCER OR CONSUMER?
CONSUMER

PRODUCER OR CONSUMER?
CONSUMER

PRODUCER OR CONSUMER?
PRODUCER AND CONSUMER

FOOD CHAINS AND FOOD WEBS

FOOD CHAINS A food chain is a
sequence that links species by their feeding relationships. This model chain
only shows the connection between ONE producer and a SINGLE chain of consumers within an ecosystem.

TYPES OF CONSUMERS Herbivores
Eat only plants—Fruit bat Carnivores
Eat only meat (includes insects)—Hyenas
Omnivores Eat both plants and animals
(includes insects)—Kangaroo Rats
Detritivores Eat detritus, or dead organic
matter—millipede Decomposers
Are detritivores that break down organic matter into simpler compounds—Fungi Important to the stability of an
ecosystem by returning vital nutrients back into the environment.

TYPES OF CONSUMERS Specialist
A consumer that primarily eats one specific organism or feed on a very small number of organisms.
Specialists are sensitive to changes in the availability of prey.
Generalist Consumers
that have a varying diet.
Giant Pandas are specialists. Over 95% of their diet comes from bamboo. If bamboo became scarce, the Panda would be in danger of extinction.
Raccoons are generalists. They can live almost anywhere, and eat almost anything.

TROPHIC LEVELS
Trophic levels are the levels of nourishment in a food chain. Produceherbivore
carnivore has three trophic levels. Carnivores are at the third,
or highest, trophic level. Herbivores are at the second trophic level. Producers are at the first, or bottom, trophic level. Energy flows UP the food
chain, from the lowest trophic level to the highest.
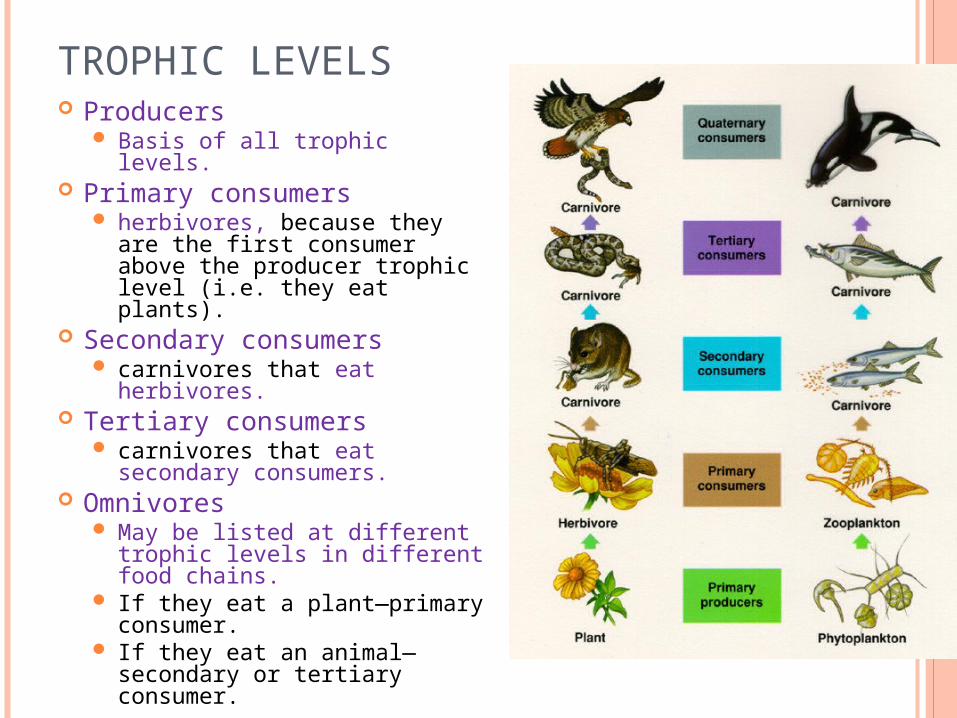
TROPHIC LEVELS Producers
Basis of all trophic levels. Primary consumers
herbivores, because they are the first consumer above the producer trophic level (i.e. they eat plants).
Secondary consumers carnivores that eat
herbivores. Tertiary consumers
carnivores that eat secondary consumers.
Omnivores May be listed at different
trophic levels in different food chains.
If they eat a plant—primary consumer.
If they eat an animal—secondary or tertiary consumer.

FOOD WEBS
A food web is a model that shows the complex network of feeding relationships (matter) and the flow of energy within and sometimes beyond an ecosystems.
At each link in a food web, some energy is stored within an organism, and some energy is dissipated into the environment.

PYRAMID MODELS

PYRAMID MODELS SHOW THE DISTRIBUTION OF ENERGY AMONG TROPHIC LEVELS.
Sunlight provides the energy for producers to perform photosynthesis and make carbohydrates, a high-quality form of energy. That energy flows up the food chain when herbivores eat the plants. Along the way, some of the energy is burned, dissipated, or lost as heat. Carnivores then eat the herbivores, but again lose energy as heat.
The dissipation, or loss, of energy from one trophic level to the next may be as much as 90%.
Only 10% of the available energy is left to transfer from one trophic level to the next.

LOSS OF AVAILABLE ENERGY Reasons for energy loss•Energy used by animal to grow•Fuel for cell processes•Remains undigested•Dissipated as heat

ENERGY PYRAMIDS Because energy is lost
at each stage of a food chain, the longer the chain is, the more energy is lost overall. An energy pyramid is a
diagram that compares the energy used by producers, primary consumers, and other trophic levels. The pyramid illustrates
how available energy is distributed among trophic levels in an ecosystem.
energy transferredenergylost

BIOMASS PYRAMID Biomass is a measure of the total dry mass of
organisms in a given area Biomass pyramid models illustrate an
ecosystem’s biomass and distribution of organisms.
The conversion of biomass from a producer into biomass of the consumer is inefficient.
tertiaryconsumers
secondaryconsumers
primaryconsumers
producrs
75 g/m2
150g/m2
675g/m2
2000g/m2

PYRAMID OF NUMBERS A pyramid of numbers shows the numbers of
individual organisms at each trophic level in an ecosystem. A vast number of producers are required to support
even a few top level consumers.
tertiaryconsumers
secondaryconsumers
primaryconsumers
producers
5
5000
500,000
5,000,000

IN CLASS HOMEWORK
Read section13.6 in the GREEN Biology text book.
Using the GREEN Biology text book answer questions 1-5 on page 419.
Use complete sentences please!

QUESTIONS
1. How does an energy pyramid help to describe energy flow in a food web?
2. What is the difference between a biomass pyramid and a pyramid of numbers?
3. How would you draw a pyramid of numbers for a dog with fleas? What shape would the pyramid take?
4. If each level in a food chain typically loses 90% of the energy it takes in, and the producer level uses 1000kcal of energy, how much of that energy is left after the third trophic level?
5. Why is an herbivorous diet more energy efficient than a carnivorous diet? Explain your answer.

ANSWERS
1. An energy pyramid shoes the relative contribution to energy flow made by each trophic level.
2. A biomass pyramid compares the mass of organisms that make up each trophic level in an ecosystem; a pyramid of numbers compares the number of individual organisms that make up each trophic level.

ANSWERS CONTINUED 3. The bottom of the pyramid would be the
dog, and the leas would be the top level. This would be an inverted pyramid because there are many fleas to just one dog.

ANSWERS CONTINUED
4. The first trophic level uses 1000 kcal; the second trophic level uses 100 kcal; the third trophic level uses 10 kcal, leaving 1 kcal.
5. A herbivorous diet is more energy efficient because it is the closest trophic level to the producers, meaning there is more available energy to use.