c o n s u m e r & c o m m u n i t y b a n k i n g · c o n s u m e r & c o m m u n i t y b...
TRANSCRIPT

C O N S U M E R & C O M M U N I T Y B A N K I N G
Gordon Smith, Chief Executive Officer Consumer & Community Banking
February 28, 2017

Page
Agenda
CO
NS
UM
ER
&
C
OM
MU
NIT
Y
BA
NK
IN
G
Consumer & Community Banking 1
Payments 13
Mortgage Banking 24
Banking 37
Appendix 57

We remain focused on a consistent set of strategic priorities
CO
NS
UM
ER
&
C
OM
MU
NIT
Y
BA
NK
IN
G
Deepen relationships with our customers, simplify and improve customer experience
Increase digital engagement by delivering differentiated experiences
Continue in our unwavering commitment to build and maintain an effective and efficient control
environment
Lead payments innovation by delivering solutions that address merchant and consumer needs
Execute structural expense management strategies while continuing to invest for the future
Protect the Firm, its clients/customers, investors, and employees from cyber attacks, as well as
protecting the privacy of their data and transactions
Attract, train, develop, and retain the best, diverse talent
1

Performance targets
2015 2016
Medium-term
guidance (+/-)
2016 Investor Day
Medium-term
guidance (+/-)
Business
Banking Net charge-off rate 0.66% 0.61% 0.60% 0.70%
Mortgage
Banking Net charge-off rate1 0.18% 0.10% 0.10% 0.15%
Card Services Net charge-off rate 2.51% 2.63% 3-3.25% 2.50%
Net revenue rate 12.33% 11.29% 11.25% 11.25%
Auto Finance Net charge-off rate 0.38% 0.45% 0.50% 0.45%
Total CCB ROE 18% 18% 20% 20%
Consumer & Community Banking targets
CCB 2016 ($B) % of JPMC
Net revenue $44.9 45%
Net income $9.7 39%
1 Excludes the impact of purchased credit-impaired (PCI) loans
CO
NS
UM
ER
&
C
OM
MU
NIT
Y
BA
NK
IN
G
2

We have continued strong momentum across key business drivers, driven by
consistent investment strategy
CO
NS
UM
ER
&
C
OM
MU
NIT
Y
BA
NK
IN
G
Key business drivers ($B, except ratios and where otherwise noted)
2016 YoY ∆
Consumer &
Community Banking
Households1 (mm) 60.0 4%
Active mobile customers (mm) 26.5 16%
Consumer Banking Average deposits $461 11%
Client investment assets (end of period) $235 7%
Business Banking
Average deposits $110 9%
Average loans2 $22 7%
Loan originations $7 8%
Net charge-off rate 0.61% (5) bps
Mortgage Banking
Total mortgage origination volume $104 (3%)
Foreclosure units (K, end of period) 47 (36%)
Average loans $232 14%
Net charge-off rate3 0.10% (8) bps
Credit Card
New accounts opened4 (mm) 10.4 20%
Sales volume4 $545 10%
Average loans $131 4%
Net charge-off rate 2.63% 12 bps
Commerce Solutions Merchant processing volume $1,063 12%
Auto Finance
Loan and lease originations $35 9%
Average loan and leased assets $75 16%
Net charge-off rate 0.45% 7 bps 1 Reflects data as of November 2016 2 Includes predominantly Business Banking loans as well as deposit overdrafts 3 Excludes the impact of PCI loans 4 Excludes Commercial Card
3

Consumer & Community Banking avg. loans1 ($B)
We continue to see strong growth in deposits and core loans
CO
NS
UM
ER
&
C
OM
MU
NIT
Y
BA
NK
IN
G
Consumer & Community Banking avg. deposits ($B)
$414 $453
$487 $531
$587
2012 2013 2014 2015 2016
$109 $110 $114 $118 $125
$53 $57 $69
$108
$151 $48 $51
$53
$56
$63
$15 $16 $18
$20
$22
$184 $159 $137
$115
$96
2012 2013 2014 2015 2016
Card Mortgage Banking
Auto Business Banking/Other
Non-core loans (all LOBs)
$409 $393 $391
2012 – 2016
CAGR
Non-core
loans:
(15%)
Core
loans:
+13%
Total:
+3%
2
Total: +10%
Core: +20%
3
$417
$457
CAGR
+9%
Note: Numbers may not sum due to rounding 1 Includes held-for-sale loans 2 Non-core loans include runoff portfolios, discontinued portfolios and portfolios the Firm has an intent to exit 3 Other includes securities-based lending of $1.5B in 2016, $1.4B in 2015, $0.8B in 2014, and $0.2B in 2013
4

Business drivers have supported revenue growth, with offsets in Card
investments and deposit margin compression
CO
NS
UM
ER
&
C
OM
MU
NIT
Y
BA
NK
IN
G
CCB revenue ($B)
Note: Numbers may not sum due to rounding; chart not to scale 1 Excludes Auto lease income, new Card origination costs, and Card co-brand renewals 2 Reflects new account origination costs and Sapphire Reserve travel credits
5
$43.8
$44.9
$1.8 $0.6
$0.6
($0.9)
($0.7) ($0.4)
2015Revenue
NII (excl. depositmargin compression)
NIR¹ Auto leaseincome
New Cardorigination costs²
Card co-brandrenewals
Deposit margincompression
2016Revenue

We have invested heavily in technology and marketing – and we are seeing
strong returns
Select investments Results
~$550mm pre-tax benefit in current annual run-rate
~4.3mm new accounts
~$44.4B annual spend
~$8.2B average outstandings
Credit Card
new account marketing1
Consumer Banking
new account marketing
~670K new households
~$5.2B in average deposits
Branch operating model
Digital
Chase Pay
Control and infrastructure
~$200mm pre-tax benefit in current annual run-rate
Digital engagement leads to higher retention – attrition improvement
since 2014 equal to 100K customers, or production of 211 branches
Significant future benefits expected
Continue to uplift standards – cybersecurity, KYC, and data
Cumulative spend
(2015 and 2016)
~$1.0B
~$1.7B1
Select investments Results (steady state)3 Incremental spend
over 2 years2
1 Credit Card new account marketing reflects spend before the reduction for new account origination costs, which are amortized against revenue 2 Incremental spend over 2 years calculated as the 2015 incremental versus 2014 plus the 2016 incremental versus 2014 3 Steady state reflects year 3 performance for Card and year 1 for Consumer Banking
Technology investments
Marketing investments1
CO
NS
UM
ER
&
C
OM
MU
NIT
Y
BA
NK
IN
G
6

4Q12 4Q16 All other households Digitally-engagedhouseholds
Our growing digitally-engaged customer base delivers strong performance metrics
CO
NS
UM
ER
&
C
OM
MU
NIT
Y
BA
NK
IN
G
Consumer Bank households – impact of digitally-engaged households1
% of households who are digitally-engaged Attrition2
Digitally-engaged population is growing Retention rates are higher (FY16)
+18ppt (11ppt)
Spending is higher (FY16)3
All other households Digitally-engagedhouseholds
Credit + debit card spend per household
+91%
Teller QuickDeposit
Cost of digital transactions is lower (FY16)
Cost per check deposit by channel
(96%)
Note: For footnoted information, refer to appendix
7

CCB has experienced strong growth across key business drivers, outpacing
operational volumes, while unit costs significantly decreased
CO
NS
UM
ER
&
C
OM
MU
NIT
Y
BA
NK
IN
G
Strong momentum across key business drivers1…
Average deposit
growth
9%
Average core
loan growth
16%
Card
new accounts2
13%
Card
sales volumes2
9%
Merchant
processing volume
12%
…while continuing to improve unit costs
Operations Volume CAGR1 Unit cost CAGR1
Customer service (inbound calls) 2% (3%)
Collections (2%) (9%)
Merchant processing transactions3 11% 0%
1 Reflects CAGR from 2013 – 2016 2 Excludes Commercial Card 3 Excludes network licensing fees for ChaseNet
8

We have substantially reduced expense, while continuing to prudently invest
CO
NS
UM
ER
&
C
OM
MU
NIT
Y
BA
NK
IN
G
CCB expense ($B)
Overhead 58% 55%4
Headcount3 148.2K 141.0K
~$2.4B
CCB structural expense5
~225 bps
CCB overhead ratio6
~7K
CCB headcount3
$25.6 $25.0
($2.4)
$1.0 $0.7
2014 Structuralexpense
Auto leasegrowth
Incrementalinvestments and
growth¹
2016exit²
Overall progress since 2014
Note: For footnoted information, refer to appendix
9

Our structural expense reduction initiatives are substantially complete, but work
to eliminate waste will always continue
CO
NS
UM
ER
&
C
OM
MU
NIT
Y
BA
NK
IN
G
Structural expense initiatives overview
Select initiatives Structural savings
(2016 exit vs. 2014) Accomplishments since 2014
Mortgage transformation1 ~$1.2B
Process streamlining
Overall delinquency rate2 approaching lowest level in a decade
Product simplification (e.g., sale of USDA business)
Branch transformation ~$0.5B
Reduced teller transactions by ~130mm
Decreased transactional staff by ~15%
Continued rolling out next generation of ATMs
Technology efficiencies ~$0.2B Rationalized technology spend
Reduced consumables
Digital adoption and
paperless ~$0.1B
Grew active digital customers by ~20%3
Reduced number of paper statements by 24%
Various initiatives4 ~$0.5B
Vendor rationalization
Real estate/location strategy
Marketing efficiencies
Total structural
expense reduction ~$2.4B
Note: Numbers may not sum due to rounding; 2016 exit reflects 4Q16 annualized 1 Includes mortgage operating losses, in large part foreclosure-related 2 Based on total mortgage and home equity loans serviced, as reported to Inside Mortgage Finance (IMF) as of December 2016 3 Users of all web and/or mobile platforms who have logged in within the past 90 days 4 Includes non-core items
10

We are focused on executing the next wave of expense reduction strategies
CO
NS
UM
ER
&
C
OM
MU
NIT
Y
BA
NK
IN
G
Focus areas Planned strategies
Operations integration ■ Increase data sharing with partners to reduce fraud
■ Reduce the cost of metal and plastic cards
Branch transformation
■ Modernize teller staffing tools
■ Data driven sales leads
■ Digital account opening and digital wealth management
Technology efficiencies ■ Agile development and cloud-based technology
■ Consolidate internal applications
Support customers’
transition to digital
channels
■ Digital mortgage pilot
■ E-letters and bill pay merchant directory
■ Increase paperless new checking accounts
Expense reduction strategies
11

We expect to achieve a ~50% overhead ratio in the medium-term
CO
NS
UM
ER
&
C
OM
MU
NIT
Y
BA
NK
IN
G
CCB overhead ratio
1 Excludes incremental auto lease income 2 Includes marketing, investments in payments and digital innovation and technology, and business growth
12
55%
~50%
(~5%)
~1%
~2.5%
(~2.5%) (~1%)
2016overhead ratio
Revenue growth(excl. interestrate impact)¹
Growth inauto leasebusiness
Incrementalinvestmentsand growth²
Efficiencies Interest rateimpact
Targetoverhead ratio

Page
Agenda
CO
NS
UM
ER
&
C
OM
MU
NIT
Y
BA
NK
IN
G
Payments 13
Consumer & Community Banking 1
Mortgage Banking 24
Banking 37
Appendix 57

Key business drivers ($B, except ratios and where otherwise noted)
2015 2016 YoY ∆
Payments
Card average loans $126 $131 4%
Card end of period loans $131 $142 8%
Credit card sales volume1 $496 $545 10%
Debit & credit card sales volume1 $754 $818 9%
Merchant processing volume $949 $1,063 12%
Card new accounts opened (mm)1 8.7 10.4 20%
Card Services net revenue rate 12.33% 11.29% (104) bps
Card net charge-off rate 2.51% 2.63% 12 bps
Payments has seen strong metric growth driven by investments in the business
4Q16 sales1 growth showed significant improvement of 14% year-over-year
1 Credit card data excludes Commercial Card
PA
YM
EN
TS
13

Our strong business performance has resulted in leading market positions
PA
YM
EN
TS
07/20/11
General purpose credit card sales market share1
General purpose credit card EOP outstandings
market share1
Source: Company filings; internal JPMorgan Chase estimates
Note: Numbers may not sum due to rounding 1 Based on 4Q16 sales volume and loans outstanding disclosures by peers and internal JPMorgan Chase estimates. Sales volume excludes private label and Commercial
Card. Outstandings exclude private label, AXP Charge Card, and Citi Retail Cards 2 AXP reflects the U.S. Consumer segment and internal JPMorgan Chase estimates for AXP’s U.S. small business sales
20.9% 21.7%
7.8% 11.5%
24.3% 19.9%
9.4% 8.9%
5.1% 4.7%
11.0% 11.0%
21.6% 22.3%
4Q15 4Q16
Chase C AXP BAC DFS COF Other
▲80 bps
▼77 bps
▼47 bps
▼32 bps
▲ 6 bps
▲69 bps
YoY ∆
2
16.4% 16.7%
8.4% 10.1%
8.3% 6.9%
11.2% 10.9%
7.2% 7.2%
9.7% 10.1%
38.8% 38.2%
4Q15 4Q16
Chase C AXP BAC DFS COF Other
YoY ∆
2
▼33 bps
▲ 1 bp
▲39 bps
▼ 61 bps
▲28 bps
▲ 27 bps
14

Payments strategy
Integrated Merchant
Experience
Core acquiring and
processing services
ChaseNet closed loop
system
Integrated merchant loyalty
Consumer to
Business
Deliver superior consumer
value by launching new and
enhanced products
Lead payments innovation
with unique solutions
Our overall card and payments strategy balances a focus on core business growth
with future investment
Person-to-Person
Build simplified, real-time
person-to-person (P2P)
payment solution
Ensure Chase cards can be used everywhere our customers shop
PA
YM
EN
TS
15

2012 2016
New product launches and a broad investment in marketing have generated
strong customer engagement and return on our investment
PA
YM
EN
TS
2012 2016
2012 2016
2012 2016
Acquisition vintage in-year performance Total portfolio performance
~2x +7% CAGR
>2x +7ppt
Vintage in-year sales
Vintage in-year outstandings
Average sales per account
Average % of accounts with sales activity
Note: Data excludes Commercial Card and certain terminated partner portfolios
16

The new Sapphire Reserve customers we are acquiring have attractive
characteristics
PA
YM
EN
TS
Early adopter profile of Sapphire Reserve customers as of December 2016
Average FICO score >785
Lift in On Chase spend2 >50%
Average Deposit & Investment wallet >$800K
1 Reflects self-reported income at time of application 2 Compares July 2016 and December 2016 credit card spend (Pre-Reserve vs. Post-Reserve acquisition for existing Chase card customers only). Excludes December
acquisitions
Average income1 >$180K
17

Chase Card has modest exposure to FICO <660, and is lowest in the 640 – 720 range
28% 29% 30% 31% 34%
38%
Chase AXP DFS C COF BAC
Chase vs. competitors – FICO <660 portfolio mix1
Chase vs. competitors FICO (640 – 720) portfolio
mix2
15% 15%
34% 36%
25% 25%
17% 18%
16% 15%
14% 14%
1Q15 2Q15 3Q15 4Q15 1Q16 2Q16 3Q160%
6%
12%
18%
24%
30%
36%
Chase COF WFC DFS C BAC
1 Source: “U.S. Cards Subprime Plateau,” Autonomous sell-side research report, 11/3/2016. Leveraged peers’ Form10-Q/K disclosures and incorporates their own internal
estimates. Credit card loans without a FICO score included in FICO <660 category 2 Based on Lightspeed Behavioral Tracking Panel data for sample of existing portfolios’ customers polled during 3Q16. Data represents FICO scores from 640 – 719
PA
YM
EN
TS
18

Digital 77%
Branch 13%
Direct mail 8%
Other 2%
Increased efficiencies within our acquisition channels
PA
YM
EN
TS
Acquisitions are moving to lower cost channels
2016 new credit card accounts by channel1
Increased mobile acquisitions
1 Data excludes Commercial Card and certain terminated partner portfolios 2 Represents applications from smartphone and tablet visitors in Chase-hosted digital channels; excludes applications hosted on partner sites
2012 2016
% of total digital credit card applications sourced
from mobile devices2
19
+28ppt

Our investments in Payments extend into P2P, an important emerging segment, and
we continue to enhance and grow our P2P offering with Chase QuickPay
We are well positioned to succeed in P2P
Active mobile CBB households1
$28B 2016 Chase
QuickPay volume
94mm 2016 Chase
QuickPay
transactions
15mm 90 day active as of
4Q16
4mm 90 day active as of
4Q16
PA
YM
EN
TS
Chase QuickPay user households2
P2P volume and growth3 Annual P2P transactions3
1 CBB households with a user of all mobile platforms who has logged in within the past 90 days 2 Represents figures for CBB households only who have agreed to the Chase QuickPay legal agreements and sent a payment via Chase QuickPay during the selected time
frame (as of December 2016) 3 Includes Chase QuickPay transactions from CBB households
+38% YoY growth
20

Chase Pay, our proprietary digital solution, expands the capabilities of our
successful core business with an innovative product
PA
YM
EN
TS
Track purchases
Pay securely
Easy digital checkout Keep cards updated
Order/pay ahead1
Automatic savings
Key
Features
Key
Partners LevelUp
1 Order/pay ahead is not available at Starbucks locations within the Chase Pay app
21

$655
$1,063
2012 2016
PA
YM
EN
TS
Commerce Solutions surpassed $1 trillion in processing volume
Commerce Solutions total processing volume ($B)
+13% CAGR
New company relationships by referral source1
Internal >55%
External <45%
Deal closure rate by relationship1
Prospects Existing JPMclients
+20ppt
1 Data represents full-year 2016. Sales lead classification based on internal JPMorgan Chase data
22

#1 position in both credit card sales and
outstandings market share1
Surpassed $1T in merchant processing volume
Successfully launched new partner and branded
products
Renewed 80% of co-brand sales volume in the
last two years
Launched Chase Pay with Starbucks and Best
Buy
What we’ve accomplished Where we’re headed
Lead payments innovation and transform the
payment experience
Provide superior customer value
Deliver overall financial returns
1
2
3
Create lifelong, engaged relationships by serving all spending and borrowing needs of our
targeted customer segments
We made significant progress in 2016, and our go-forward strategy remains consistent
PA
YM
EN
TS
1 Based on 4Q16 sales volume and loans outstanding disclosures by peers (C, BAC, COF, AXP, DFS) and internal JPMorgan Chase estimates. Sales volume excludes private
label and Commercial Card. AXP reflects the U.S. Consumer segment and internal JPMorgan Chase estimates for AXP’s U.S. small business sales. Outstandings exclude
private label, AXP Charge Card, and Citi Retail Cards
23

Page
Agenda
CO
NS
UM
ER
&
C
OM
MU
NIT
Y
BA
NK
IN
G
Mortgage Banking 24
Payments 13
Consumer & Community Banking 1
Banking 37
Appendix 57

We continue to execute against our strategy of building a higher quality and less
volatile mortgage business
MO
RT
GA
GE
B
AN
KIN
G
Maximize our share of
high quality
originations
Improve quality of
servicing portfolio
and de-risk the
business
Deliver a great
customer experience
Progress
Improved J.D. Power originations and servicing rankings
Expanded affordable lending programs
Increased our share of jumbo originations
Attractive returns and outstanding quality
Overall delinquency rate1 approaching lowest level in a decade
Sale of USDA business
1 Based on total mortgage and home equity loans serviced, as reported to IMF as of December 2016
24

The underlying performance of the business is strong
Key business drivers ($B, except ratios and where otherwise noted)
2015 2016 YoY Δ
Mortgage
Production
Total mortgage origination volume $106 $104 (3%)
Consumer origination volume $36 $44 23%
Correspondent origination volume $70 $59 (16%)
Home equity origination volume $5 $7 40%
Mortgage
Servicing
Total loans serviced (end of period) $910 $847 (7%)
Third-party mortgage loans serviced (end of period) $674 $592 (12%)
Foreclosure units (K, end of period) 73 47 (36%)
Loan balances and
credit performance
Mortgage Banking loans (average) $204 $232 14%
Mortgage Banking net charge-off rate1 0.18% 0.10% (8) bps
Note: Numbers may not sum due to rounding 1 Excludes the impact of PCI loans
MO
RT
GA
GE
B
AN
KIN
G
25

We have seen improvement in internal and external measurements of customer
satisfaction
J.D. Power Mortgage surveys2 Annual Net Promoter Score1
2012 2013 2014 2015 2016
Chase rank
2015
2016
’15 – ’16
change
Originations Servicing
7 10
5 6
+2 +4
2010 12 13
1 Net Promoter Score = % promoters minus % detractors. Survey started in August 2012. Survey methodology changed in 3Q14 2 Source: "U.S. Primary Mortgage Origination and Servicer Satisfaction Studies,” J.D. Power, 2010, 2015, and 2016
MO
RT
GA
GE
B
AN
KIN
G
26

We are focused on high-quality originations…
1 Source: IMF. Firmwide mortgage originations for top 5 ranked banks. Includes Conventional, Government, Jumbo, and excludes Home Equity 2 Source: IMF and JPMorgan Chase internal data. Mortgage Banking only originations. Excludes Private Bank and Home Equity 3 Data as of 12/31/2016. Based on unpaid principal balance of loans serviced. Includes foreclosures and excludes real estate owned (“REO”) inventory 4 Excludes PCI loans and private label securities
Mortgage companies and small banks have gained
share from large banks
The largest share gain for mortgage companies and
small banks has been in government lending
Chase originations market share by product type2
We have shifted our origination mix toward high
quality jumbo, consistent with our strategy of building
a less volatile mortgage business
The 30+ delinquency rate3 for jumbo is 1.05%4,
compared to 13.15% for government products
54%
25%
46%
75%
2011 2016
Top 5 banks by originations All Other1
Total originations market share
MO
RT
GA
GE
B
AN
KIN
G
9%
3% 2%
12%
Government Jumbo
2011 2016
27

…and continue to see strong core loan growth
$51 $53 $57 $69
$108
$151
$174 $152
$132 $114
$96
$81
$225
$205
$189 $183
$204
$232
2011 2012 2013 2014 2015 2016
2011 – 2016
CAGR
Non-core:
(14%)
Core: +24%
Total: +1%
Mortgage Banking average loan balances ($B)
% of
originations
retained3
3% 4% 11% 33% 66% 49%
Non-core1
Core2
1 Non-core loans include runoff portfolios, which are predominantly discontinued products no longer originated and PCI loans 2 Core loans primarily include loans held in Real Estate Portfolios, as well as loans residing in Mortgage Production and Mortgage Servicing, which are predominantly prime
mortgage loans repurchased from Government National Mortgage Association (“Ginnie Mae”) pools, which are insured by U.S. government agencies 3 Excludes Home Equity and Private Bank loans
MO
RT
GA
GE
B
AN
KIN
G
28

2.37%
0.85%
0.37%
0.18% 0.10%
FY12 FY13 FY14 FY15 FY16
Mortgage Banking net charge-off rate2 trend
We continue to maintain strong credit performance
(227) bps
0.0%
1.0%
2.0%
3.0%
4.0%
5.0%
4Q12 4Q13 4Q14 4Q15 4Q16
Mortgage Banking1 30+ delinquency rate (%)
3
1 Excludes PCI loans and mortgage loans insured by U.S. government agencies that are 30 or more days past due. These amounts have been excluded based upon the
government guarantee 2 Excludes the impact of PCI loans 3 Includes the effect of incremental net charge-offs based on regulatory guidance
MO
RT
GA
GE
B
AN
KIN
G
29

We are actively managing our servicing book by bringing in high-quality new
originations while reducing our volume of low-quality units
2014 – 2016 Chase servicing book activity
Units 30+ delinquency rate
New originations ~790K 0.02%
Acquired servicing ~235K 0.10%
Total “in flows” ~1,025K 0.04%
Units 30+ delinquency rate
Run-off ~1,850K 7.65%
Sales ~350K 29.94%
Total “out flows” ~2,200K 11.19%
“Coming In” Dec 2014 through Dec 2016
“Going Out” Dec 2014 through Dec 2016
30+ delinquency rate1 for Chase servicing book
6.23%
4.70%
December 2014 December 2016
Units in
servicing
book
6.5mm 5.4mm
1 Based on number of loans serviced. Includes foreclosures and second liens and excludes REO inventory
MO
RT
GA
GE
B
AN
KIN
G
30

Our default inventory continues to decline, driving lower overall servicing expense
Non-Performing Performing
Servicing cost per unit1
Note: Numbers may not sum due to rounding 1 2015 Chase data as defined by the Mortgage Bankers Association (MBA) in the Stratmor survey 2 Credit costs excluded from all time periods 3 FY12 includes ~$1B of additional expense for foreclosure-related matters
(25 – 30x)
Servicing expense2 ($B)
$4.7
$3.0
$2.3 $2.0
$1.7
FY12 FY13 FY14 FY15 FY163
Foreclosure inventory (K)
312
167
93 73 47
FY12 FY13 FY14 FY15 FY16
(85%)
>$3.0
MO
RT
GA
GE
B
AN
KIN
G
31

We are through a significant portion of home equity interest-only recast risk for
the legacy Chase book, with performance in line with expectations
Note: Excludes PCI portfolio. Data as of December 2016 1 Based on carrying value; excludes home equity balloon loans that maintain an interest only payment after the draw period ends 2 Includes modifications which no longer exhibit recast risk based on modified terms 3 Current estimated combined LTV for junior lien home equity loans considers all available lien positions, as well as unused lines, related to the property
MO
RT
GA
GE
B
AN
KIN
G
HELOC portfolio1 balance ($B)
$13.1
$15.0
$0.6 $0.2
Past recast Future recast
HELOC balance 30+ day delinquent balance
2
Loans with CLTV3 > 80%
27%
12%
Past recast Future recast
703
743
600
650
700
750
800
Past recast Future recast
Average FICO
32

We anticipate a smaller, purchase-driven market, with tightening primary and
secondary spreads
1 Source: IMF 2014 through 2016; 2017F reflects average of forecasts from Fannie Mae (1/10/17), Freddie Mac (1/30/17), and MBA (1/19/17) 2 Source: Freddie Mac Primary Mortgage Market Survey (PMMS). Represents 30-yr fixed rate 3 Source: JPMorgan Chase Securitized Products Group (SPG) Research. Represents Fannie Mae 30-yr current coupon rate 4 Source: JPMorgan Chase SPG Research
Mortgage origination market1 ($B) Primary2 and secondary3 mortgage rates
4.17%
3.85% 3.65%
4.25%
3.19%
2.84% 2.59%
3.28%
0.98% 1.01% 1.06% 0.97%
2014 2015 2016 2017F
Primary Secondary Spread
MO
RT
GA
GE
B
AN
KIN
G
$783 $924
$1,060 $1,077
$517
$811
$1,005
$468 $1,300
$1,735
$2,065
$1,545
2014 2015 2016 2017F
Purchase Refinance
4
33

We are piloting a digital mortgage experience to address the needs of an
increasingly tech-centric customer base
Transparent – customers always know where they stand in the process
Convenient – customers can securely upload documents to the platform
Connected – customers can e-sign documents
Customers empowered with real-time information and transparency
Efficiency gains for Chase through automation of manual handoffs
Ongoing enhancements to the platform
…resulting in benefits for customers and Chase
Our mobile-enabled customer portal will be…
MO
RT
GA
GE
B
AN
KIN
G
34

We have a tremendous growth opportunity within our own Chase customer base – our
performance with CPC1 customers shows the power of a differentiated experience
CCB household distribution by homeownership
~5mm2,4
Chase mortgage
% of Chase customers originating a mortgage with
Chase by relationship type, FY2016 ($ basis)
~30mm3
With mortgage
60mm2
CCB households
Card Checking CPC
>4x
MO
RT
GA
GE
B
AN
KIN
G
1 Chase Private Client
2 Reflects data as of November 2016
3 JPMorgan Chase internal analysis 4 JPMorgan Chase internal data
35

We remain focused on executing against our strategy
MO
RT
GA
GE
B
AN
KIN
G
Improved the customer experience
Enhanced the quality of the servicing
portfolio and de-risked the business
Substantially reduced expenses
Grown our balance sheet with high quality
originations
What we’ve accomplished
Positions us well to execute our strategy and drive future growth with our existing Chase
customer base
Where we’re headed
Enrich digital experience for increasingly tech-
centric customer base
Transform Chase customer experience by
leveraging internal and external data
Accelerate focus on deepening Chase
relationships
1
2
3
36

Page
Agenda
CO
NS
UM
ER
&
C
OM
MU
NIT
Y
BA
NK
IN
G
Banking 37
Payments 13
Mortgage Banking 24
Consumer & Community Banking 1
Appendix 57

Consumer & Business Banking strategic priorities and progress
BA
NK
IN
G
Acquire and deepen
relationships
Increase digital
engagement
Drive down
expenses
Progress
Grew Consumer & Business Banking deposits & investments by ~$250B – a
10% CAGR since 2012
Acquired ~2.7mm net new consumer checking households and ~235K net new
business households since year-end 2012
Primary bank for more than 70% of our consumer households and nearly 50%
of our business households1
More than doubled Consumer & Business Banking households using mobile
since year-end 20122
Released next generation of ATM hardware and software with enhanced ATM
functionality
Reduced structural expenses by ~$600mm3 since year-end 2014 while
reinvesting a meaningful portion of the savings in marketing and digital
Reduced teller transactions by ~130mm since year-end 2014
Decreased transactional staff by 15% since year-end 2014
1 Primary relationship based on internal JPMorgan Chase definition
2 Users defined as consumer or business households that had at least one mobile log-in in a given quarter 3 Savings from 2014 based on 2016 exit (4Q16 annualized)
37

2015 2016 YoY Δ
Relationships (mm) Consumer households 23.3 23.9 3%
Business households1 2.4 2.5 4%
Financial metrics ($B)
CBB revenue $18.0 $18.7 4%
CBB non-interest expense $11.9 $11.8 (1%)
CBB overhead ratio 66% 63% (3 ppt)
Balances ($B)
Average deposits2 $515 $571 11%
Deposit margin2 1.90% 1.81%
Client investment assets (end of period) $219 $235 7%
% managed assets 41% 40%
Average Business Banking loans3 $20.5 $21.9 7%
Distribution channels
Branches 5,413 5,258 (3%)
ATMs 17,777 18,493 4%
Average deposits/branch employee ($mm)2 $11.4 $12.5 10%
Consumer & Business Banking business drivers
Consumer & Business Banking business drivers
BA
NK
IN
G
1 Includes only Business Banking households that have either a business checking, savings, CD product or credit product on the Business Banking P&L
2 Includes Consumer & Business Banking deposits 3 Includes predominantly Business Banking loans as well as deposit overdrafts
38

9.8%
6.3%
2.7% 2.8%
Chase NationalBanks
SuperRegional
Other
Change in deposits vs. industry (2012 – 2016 CAGR)1
Industry avg.
growth = 4.0%
We continue to lead the industry in deposit balance growth
BA
NK
IN
G
Note: For footnoted information, refer to appendix
39

We have established our physical presence in faster growing markets
BA
NK
IN
G
Chase performance in top 10 Chase markets (2012 – 2016)1
Chase top 10
markets by
deposit
balances (2016)
Chase $
deposit
growth
rank
Chase
deposit
share
(2016)
Chase share
of $ deposit
growth
Chase
growth rate
vs. industry
ex-Chase
1 New York, NY 1 21% 35% 2.3x
2 Los Angeles, CA 1 17% 29% 2.2x
3 Chicago, IL 1 19% 53% 5.7x
4 Houston, TX 1 21% 27% 1.5x
5 Dallas-Fort Worth, TX 1 19% 28% 1.8x
6 San Francisco, CA 3 13% 19% 1.8x
7 Miami, FL 2 12% 23% 2.7x
8 Phoenix, AZ 1 26% 29% 1.2x
9 Detroit, MI 1 20% 35% 2.5x
10 San Diego, CA 1 19% 29% 2.0x
Note: For footnoted information, refer to appendix
4.6%
3.0%
Chase markets Non-Chase markets
Industry deposit growth (2012 – 2016
CAGR)1
Industry avg.
growth = 4.0%
40

Three-quarters of our growth has come from customers who use our branches
BA
NK
IN
G
Chase Consumer Bank deposit growth attribution
by channel usage segment (2012 – 2016)1
Digitally-centric 18%
Multi-channel
60%
Branch-centric
16%
Other 6%
Households across generations continue to use the
branch2
57%
64%
70%
71%
Millennials
Gen X
BabyBoomers
SilentGeneration
% of households using
the branch (4Q16)
Avg. visits/quarter3
3
4
5
5
Note: For footnoted information, refer to appendix
41

Digital engagement embeds us in our customers’ daily lives – on average, mobile
banking users have 5 mobile log-ins per week
BA
NK
IN
G
Chase leadership positions
#1 rated mobile banking app and #1 in active mobile users among large bank peers1
#1 most visited banking portal in the U.S.2
#1 ATM network in the U.S.3
CBB Chase QuickDeposit
usage CBB Chase QuickPay usage
+19% households using
QuickDeposit vs. 2015
+30% households using
QuickPay vs. 2015
Key engagement metrics4
CBB mobile usage
+12% households using
mobile vs. 2015
74mm transactions in 2016
94mm transactions in 2016
5 log-ins per week in 2016
1 Source: “2016 Mobile Banking Financial Institution Scorecard,” Javelin Strategy & Research, May 2016. Ranking is among large banks. Active mobile users based on
disclosures by peers in 4Q16 2 Source: SimilarWeb.com as of December 2016 (formerly compete.com) 3 Based on competitor filings 4 Households using mobile defined as households that have at least one log-in through the Chase Mobile app or via mobile browser in 4Q16. Households using QuickDeposit or
QuickPay are defined as households that complete at least one of the specified transactions in 4Q16
42

2012 2013 2014 2015 2016All other households Digitally-engagedhouseholds
Digital engagement is a contributing factor to our record low attrition
BA
NK
IN
G
4Q12 4Q16
Digitally-engaged households All other households
Digitally-engaged households are growing rapidly…1
HH growth
(2012 – 2016
CAGR)
11%
(7%)
Consumer Bank household attrition rates3
(4ppt)
1 Digitally-engaged households include digitally-centric and multi-channel households. All other households include branch-centric and other households 2 Net Promoter Score = % promoters minus % detractors. Based on Net Promoter Score data collected from January – November 2016 3 Attrition rates are based on Consumer Bank households with deposit products and include households that closed all of their deposit products with Chase. Attrition rate
calculated by taking an average of the annualized monthly rates for the 12 months of each year
…and exhibit higher Net Promoter Scores1,2
~+20%
43

2014 2016
2014 2016
While delivering this winning experience, we have also reduced structural
expenses
BA
NK
IN
G
Annual teller transactions (mm)
(~130mm)
Annual self-service/digital transactions (mm)2
Online
Mobile
ATM
% change
+118%
+1%
(39%)
~+180mm
Today, ~80% of transactions are completed through self-service channels; going forward, we
will continue to drive transaction migration
Example: branch transformation
Branch
transformation
~55%
1 2016 represents 2016 exit (4Q16 annualized) 2 Excludes mobile and online log-ins
Branch and ATM
consolidation
~20%
Paperless ~15%
Business Banking ~10%
Distribution of structural expense reductions
CBB structural expense reduction (2014 – 2016)1
Branch
transformation
~50% Branch and ATM
consolidation / other
~25%
44
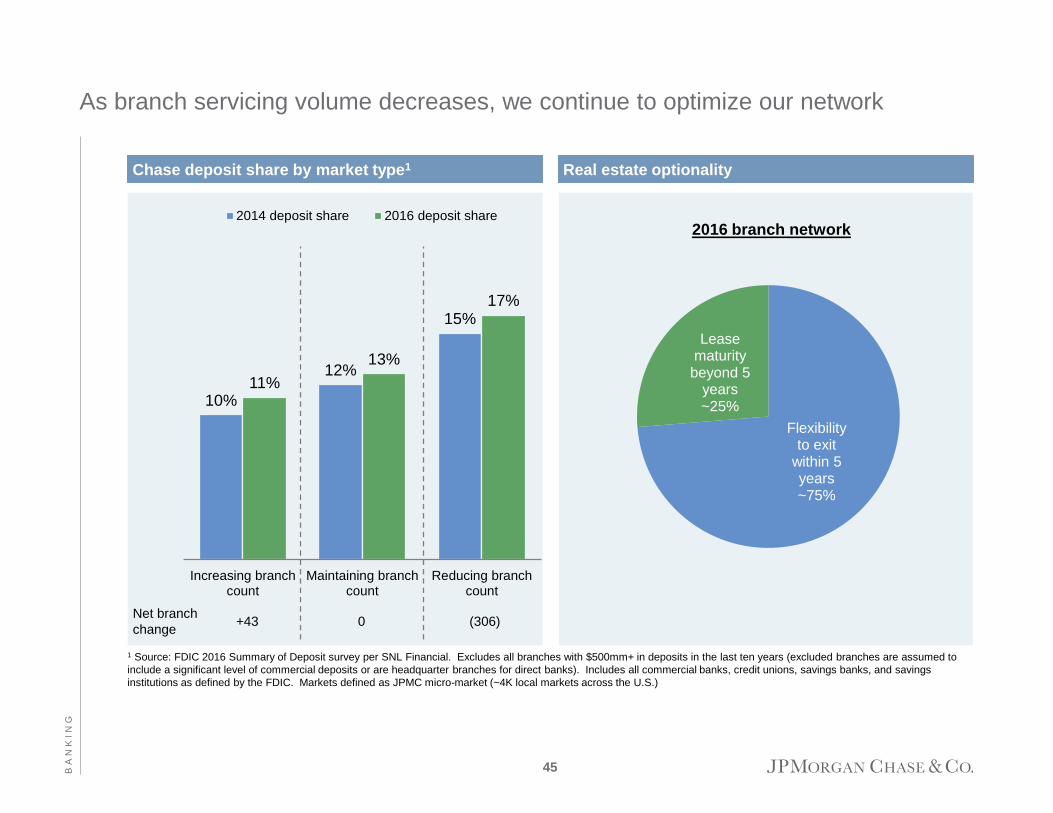
Flexibility to exit
within 5 years ~75%
Lease maturity beyond 5
years ~25%
2016 branch network
As branch servicing volume decreases, we continue to optimize our network
BA
NK
IN
G
Real estate optionality
10%
12%
15%
11%
13%
17%
Increasing branchcount
Maintaining branchcount
Reducing branchcount
2014 deposit share 2016 deposit share
Chase deposit share by market type1
Net branch
change +43 0 (306)
1 Source: FDIC 2016 Summary of Deposit survey per SNL Financial. Excludes all branches with $500mm+ in deposits in the last ten years (excluded branches are assumed to
include a significant level of commercial deposits or are headquarter branches for direct banks). Includes all commercial banks, credit unions, savings banks, and savings
institutions as defined by the FDIC. Markets defined as JPMC micro-market (~4K local markets across the U.S.)
45

We have a clear, focused strategy
BA
NK
IN
G
Primary bank for more than 70% of our consumer
households1
Leading brand perception in trust and advice
Leading physical presence and digital capabilities
Strong positioning with Millennials
Success in promoting self-service options for
everyday transactions
What we’ve accomplished Where we’re headed
Promote operational excellence across our
organization
Continue to evolve our leading multi-channel
experience
Develop lifelong relationships with our clients by delivering a powerful
combination of a trusted brand, leading multi-channel access, advice and financial
solutions to meet their evolving needs
Enhance financial solutions and advice
1
2
3
1 Primary relationship based on internal JPMorgan Chase definition
46

Chase has built a powerful small business franchise
BA
NK
IN
G
Chase for Business assets
Business card #2 small business credit card issuer by purchase volume4
Merchant services #2 merchant acquirer5
Deposits #3 primary bank market share3
Mobile offering
Branches
#1 rated mobile app for a large bank2
~5,250 branches and 10K+ specially-trained bankers
Online experience #1 most visited banking portal in the U.S.1
1 Source: SimilarWeb.com as of December 2016 (formerly compete.com) 2 Source: “2016 Mobile Banking Financial Institution Scorecard,” Javelin Strategy & Research, May 2016. Ranking is among large banks 3 Source: Barlow Research Associates, Primary Bank Market Share Database as of 4Q16. Rolling eight quarter average of small businesses with revenues of $100K – <$25mm 4 Source: The Nilson Report, Issue 1089, June 2016. Data as of 2015 and AXP quarterly financial reports and presentations 5 Source: The Nilson Report, Issue 1082, March 2016. Data as of 2015. Chase is the #1 wholly-owned merchant acquirer in the U.S. When volume from JVs and revenue share
arrangements are included in First Data’s volume, First Data holds #1 share position in the U.S. 6 Source: "U.S. Small Business Satisfaction Study,” J.D. Power, 2016
We rank among the top 3 providers across all regions according to J.D. Power6
47

The JPMC platform offers a unique value proposition to small businesses
~75% of customers have a
Consumer Banking account1
~30% of customers use Chase
Card Services1
15% of Relationship Managed
customers use Commerce
Solutions products1
200+ customers grew into
Commercial Banking clients in
2016, migrating ~$1B in
deposits
Business Banking customers
use multiple Treasury
Services products
Business Banking customers leverage product offerings across the firm
Business Banking
Consumer Banking
Card Services
Commerce Solutions
Commercial Banking
Treasury Services
1 As of December 2016. U.S. customers only
BA
NK
IN
G
48

4Q14 4Q16
Omni-channel capabilities enable Chase to meet the needs of small businesses
BA
NK
IN
G
Small businesses increasingly interact digitally, leading to a decrease in teller transactions
Small businesses continue to rely upon the branch network, particularly for complex interactions
55%
29% 16%
Branch Majority online Entirely online
Branch active Non-branch active
# of teller transactions
(19%)
Total branch activity in 4Q16 Industry-wide channel preference for account opening3
2
~70% of
businesses
transact at a
branch at least
once per quarter
# of mobile log-ins per business1
4Q14 4Q16
Blue +31%
1 Channel usage per customer active in channel 2 Branch active defined by at least one branch transaction per quarter 3 Source: “Digital Account Opening Study: New Customer Experience,” Barlow Research Associates, October 2016. Small businesses with revenues of $100K – <$25mm. New
checking accounts only
49

2014 2016
Core markets Expansion markets
We have had strong performance since 2014 led by our expansion markets
BA
NK
IN
G
2014 2016
Core markets Expansion markets
Deposits average daily balance Loan average daily balance
2014 – 2016
CAGR
▲ 18%
▲ 8%
2014 – 2016
CAGR
▲ 21%
▲ 2%
+10% CAGR 6% CAGR
50

The small business market is fragmented, creating an opportunity for Chase to
consolidate primary bank share and deepen product penetration
Small business primary bank market share1 Small business product usage
81%
48% 43%
10%
Businesscard
Merchantservices
Deposit +Card +
Merchantservices
All three -Relationship
Managed
28mm3 small businesses contribute ~$120B4 to financial services revenue in the U.S.
3% 6%
9%
9%
10% 64%
US Bank Credit Unions
Chase Bank of America
Wells Fargo Other
Industry2 Chase
Business
Banking
10% of Relationship Managed customers
have all three products with Chase
Opportunity
1 Source: Barlow Research Associates, Primary Bank Market Share Database as of 3Q16. Rolling eight quarter average of small businesses with revenues of $100K – <$25mm.
Numbers may not sum due to rounding 2 Source: “Oliver Wyman Survey of Small Business Owners,” Oliver Wyman, 2Q14. Based on surveys of small businesses with checking accounts and revenues of $100K+. Card
includes either credit or charge card 3 Source: “Small Business Profiles for the States and Territories,” U.S. Small Business Administration, 2014 4 Source: “Digital Models for a Digital Age: Transition and Opportunity in Small Business Banking,” McKinsey & Co., 2013. Based on 2011 data of small businesses with
revenues of <$20mm BA
NK
IN
G
51

Deepening engagement with Relationship Managed customers through multi-
product relationships leads to stronger deposit and revenue growth
Impact of small businesses choosing Chase for multiple products
Business Banking +
Chase Card1
21% higher
deposit balances
43% higher
deposit balances
Business Banking +
Chase Card +
Merchant services1
Higher revenue2 Lower attrition3
Note: “Relationship Managed” includes customers assigned to Business Banking Relationship Manager portfolios. They typically have larger balances, more complex products, and
larger credit relationships. “Business Banking” includes Business deposits and Business loans/lines 1 Deposits as of December 2016 2 Revenue annualized from December 2016 3 Attrition based on P&L aligned bookends for December 2015 and December 2016 and Relationship Managed customers that closed all business accounts in the time period
BA
NK
IN
G
BusinessBanking Only
Deposit, Card,and Merchant
services
BusinessBanking Only
Deposit, Card,and Merchant
services
(4ppt) 2.3x
52

We continue to invest for further growth
BA
NK
IN
G
Deposits and
business loans
Business card
Merchant services
Chase Business Quick Capital (OnDeck)
Next-day funding and product simplification
Expanded product set and improved credit decision time
Investment initiatives
Digital platform New Chase Business Online integrating Deposit, Payments,
and Lending
Customer onboarding Common application and underwriting
53

Fintech collaboration can accelerate our growth
BA
NK
IN
G
Chase Business Quick Capital
2012 2016
1.6
9.6
+57% CAGR
Small business online lending
in the U.S. ($B)1
1 Loan originations derived from internal JPMorgan Chase estimates using select financial reporting of online marketplace lenders and “Global Marketplace Lending: Disruptive
Innovation in Financials,” Morgan Stanley, May 2015
54

9.5%
8.8%
9.6% 9.7%
6.2%
8.5%
4%
8%
12%
2012 2013 2014 2015 2016
Bank of America Wells Fargo Chase
Our Net Promoter Score and primary bank market share show the momentum we
have to build upon
Primary bank market share of top 3 banks2
We have grown primary bank market share from ~6% to ~9% over the past four years
Net Promoter Score1
29
34 36
36
40
25
35
45
2012 2013 2014 2015 2016
1 Net Promoter Score = % promoters minus % detractors. Survey transitioned from phone to email in September 2015. Survey design changed in 3Q16 2 Source: Barlow Research Associates, Primary Bank Market Share Database as of 4Q16. Rolling eight quarter average of small businesses with revenues of $100K – <$25mm
BA
NK
IN
G
55
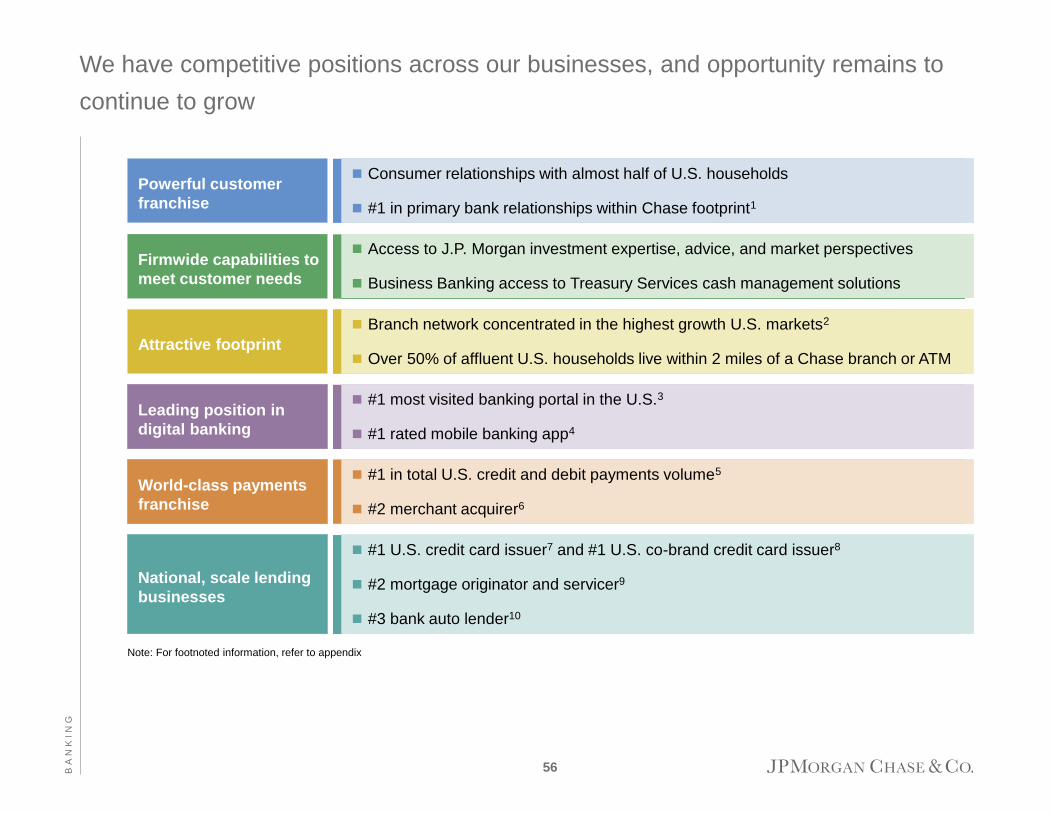
We have competitive positions across our businesses, and opportunity remains to
continue to grow
Consumer relationships with almost half of U.S. households
#1 in primary bank relationships within Chase footprint1
Powerful customer
franchise
Access to J.P. Morgan investment expertise, advice, and market perspectives
Business Banking access to Treasury Services cash management solutions
Firmwide capabilities to
meet customer needs
Branch network concentrated in the highest growth U.S. markets2
Over 50% of affluent U.S. households live within 2 miles of a Chase branch or ATM Attractive footprint
#1 most visited banking portal in the U.S.3
#1 rated mobile banking app4
Leading position in
digital banking
#1 in total U.S. credit and debit payments volume5
#2 merchant acquirer6
World-class payments
franchise
#1 U.S. credit card issuer7 and #1 U.S. co-brand credit card issuer8
#2 mortgage originator and servicer9
#3 bank auto lender10
National, scale lending
businesses
BA
NK
IN
G
Note: For footnoted information, refer to appendix
56

Page
Agenda
CO
NS
UM
ER
&
C
OM
MU
NIT
Y
BA
NK
IN
G
Appendix 57
Payments 13
Mortgage Banking 24
Banking 37
Consumer & Community Banking 1

1. Consumer Bank household channel segments are defined based on the tenure of the household as of the respective time period. For
households with tenure of greater than 12 months, we use the following thresholds calculated over a year: Digitally-centric – <=4 branch
visits and 12+ digital transactions or 100+ digital log-ins or 24+ external ACH transactions per year; Multi-channel – >4 branch visits and 12+
digital transactions or 100+ digital log-ins or 24+ external ACH transactions per year; Branch-centric – >4 branch visits and <12 digital
transactions and <100 digital log-ins and <24 external ACH transactions per year; Other – <=4 branch visits and <12 digital transactions and
<100 digital log-ins and <24 external ACH transactions per year. For households that are less than 12 months on books, we reduce the
thresholds by 75% and track the household activity over a 3 month time period. Digitally-engaged households includes Digitally-centric
households and Multi-channel households. All other households includes Branch-centric households and Other households
2. Attrition rates are based on Consumer Bank households with deposit products and includes households that closed all of their deposit
products with Chase. Attrition rate for each Consumer Bank household channel segment is calculated by reclassifying households into
segments each month based on their channel activity and by taking an average of the annualized monthly rates for the 12 months of 2016
3. Includes households that had at least one credit transaction and one debit transaction in 2016. Normalized for number of customers per
household
Notes on slide 7 – Our growing digitally-engaged customer base delivers strong
performance metrics
AP
PE
ND
IX
57

Notes on slide 9 – We have substantially reduced expense, while continuing to
prudently invest
AP
PE
ND
IX
Note: Numbers may not sum due to rounding; 2016 exit reflects 4Q16 annualized
1. Includes marketing, investments in select payments and digital projects, and select business growth and technology investments
2. Excludes non-core items, FDIC surcharge, and normalized legal expense at 2014 levels given the legal benefit in 2016
3. Includes employees and contractors
4. Reflects full-year 2016
5. Reflects 2016 exit vs. 2014
6. Reflects full-year 2016 vs. 2014
58

1. FDIC 2016 Summary of Deposits survey per SNL Financial. Excludes all branches with $500mm+ in deposits in any of the last ten
years (excluded branches are assumed to include a significant level of commercial deposits or are headquarter branches for direct banks).
Includes all commercial banks, credit unions, savings banks, and savings institutions as defined by the FDIC. National banks include Wells
Fargo, Bank of America, Citi, and U.S. Bancorp. Super regional banks include all other top 50 banks by retail deposits (excluding deposits
from branches with over $500mm in any of the last ten years)
Notes on slide 39 – We continue to lead the industry in deposit balance growth
AP
PE
ND
IX
59

1. FDIC 2016 Summary of Deposits survey per SNL Financial. Excludes all branches with $500mm+ in deposits in any of the last ten
years (excluded branches are assumed to include a significant level of commercial deposits or are headquarter branches for direct banks).
Includes all commercial banks, credit unions, savings banks, and savings institutions as defined by the FDIC. National banks include Wells
Fargo, Bank of America, Citi, and U.S. Bancorp. Super regional banks include all other top 50 banks by retail deposits (excluding deposits
from branches with over $500mm in any of the last ten years). Chase markets are defined as core based statistical areas (CBSAs) with a
Chase branch. Non-Chase markets are defined as CBSAs without a Chase branch. Chase top 10 markets defined as top ten markets by
deposit balances in 2016. Chase $ deposit growth rank based on total dollar increase in deposits from 2012-2016. Chase share of $
deposit growth represents 2012-2016 increase in Chase deposits as a percentage of 2012-2016 total increase in deposits in each specified
market. Chase growth rate versus the industry ex-Chase represents Chase annual growth rate from 2012-2016 in the specified market
divided by the specified market ex-Chase annual growth rate from 2012-2016
Notes on slide 40 – We have established our physical presence in faster growing
markets
AP
PE
ND
IX
60

1. Represents growth from 4Q12 to 4Q16. Consumer Bank household channel segments are defined based on the tenure of the household as
of the respective time period. For households with tenure of greater than 12 months, we use the following thresholds calculated over a year:
Digitally-centric – <=4 branch visits and 12+ digital transactions or 100+ digital log-ins or 24+ external ACH transactions per year. Multi-
channel – >4 branch visits and 12+ digital transactions or 100+ digital log-ins or 24+ external ACH transactions per year. Branch-centric –
>4 branch visits and <12 digital transactions and <100 digital log-ins and <24 external ACH transactions per year. Other – <=4 branch visits
and <12 digital transactions and <100 digital log-ins and <24 external ACH transactions per year. For households with fewer than 12
months on books, we reduce the thresholds by 75% and track the household activity over a 3 month time period
2. Generations defined by head of household birth years: Millennials – born 1981 – 1997. Gen X – born 1965 – 1980. Baby Boomers – born
1946 – 1964. Silent Generation – born 1928 – 1945
3. Average visits per quarter for those who used the branch in 4Q16
Notes on slide 41 – Three-quarters of our growth has come from customers who
use our branches
AP
PE
ND
IX
61

Notes on slide 56 – We have competitive positions across our businesses, and
opportunity remains to continue to grow
AP
PE
ND
IX
1. Kantar TNS 4Q16 Retail Banking Monitor. Data is based on total U.S. (5K surveys per quarter) and Chase footprint (~2.8K surveys per
quarter); Calculations derived from the following questions: "With which banks do you currently do business?" and "Which do you consider to
be your main or primary bank?“
2. Highest growth U.S. markets refers to top 30 core based statistical areas by deposit balance growth from 2012 to 2016, per SNL Financial
3. SimilarWeb.com as of December 2016 (formerly compete.com)
4. “2016 Mobile Banking Financial Institution Scorecard,” Javelin Strategy & Research, May 2016. Ranking is among large banks
5. The Nilson Report, Issue 1086, May 2016. Data as of 2015
6. The Nilson Report, Issue 1082, March 2016. Data as of 2015. Chase is the #1 wholly-owned merchant acquirer in the U.S. When volume
from JVs and revenue share arrangements are included in First Data’s volume, First Data holds #1 share position in the U.S.
7. Based on 4Q16 sales volume and loans outstanding disclosures by peers (C, BAC, COF, AXP, DFS) and internal JPMorgan Chase
estimates. Sales volume excludes private label and Commercial Card. AXP reflects the U.S. Consumer segment and internal JPMorgan
Chase estimates for AXP’s U.S. small business sales. Outstandings exclude private label, AXP Charge Card, and Citi Retail Cards
8. “Credit Card Monitor 2016: Cobrand Market Shares by Issuer,” Phoenix, for 12-month period ending October 2016. Based on card accounts,
revolving balance dollars and spending dollars
9. Inside Mortgage Finance as of 4Q16 for Servicer and Originator rankings
10. Experian AutoCount data for full-year 2016; bank auto lenders are non-captive auto lenders
62

Forward-looking statements
AP
PE
ND
IX
This presentation contains forward-looking statements within the meaning of the Private Securities
Litigation Reform Act of 1995. These statements are based on the current beliefs and expectations
of JPMorgan Chase & Co.’s management and are subject to significant risks and uncertainties.
Actual results may differ from those set forth in the forward-looking statements. Factors that could
cause JPMorgan Chase & Co.’s actual results to differ materially from those described in the
forward-looking statements can be found in JPMorgan Chase & Co.’s Annual Report on Form 10-K
for the year ended December 31, 2016, filed with the Securities and Exchange Commission and
available on JPMorgan Chase & Co.’s website https://www.jpmorganchase.com/corporate/investor-
relations/investor-relations and on the Securities and Exchange Commission’s website
(www.sec.gov). JPMorgan Chase & Co. does not undertake to update the forward-looking
statements to reflect the impact of circumstances or events that may arise after the date of the
forward-looking statements.
63