c opart, i nc. by brandon lee and xiaoting yang. presentation outline: company background company...
TRANSCRIPT
COPART, INC.by Brandon Lee and Xiaoting Yang

PRESENTATION OUTLINE: Company Background
Company Overview Business Strategy Competition Acquisition History Recent Events
Stock & Portfolio Recent performance Portfolio positioning Correlation matrix
Valuation Business Analysis Key Assumption Model & Calculation
Conclusion & Recommendation Appendix: Macroeconomic Effects

PART I: COMPANY BACKGROUND
Company Overview
Business Strategy
Competition
Acquisition History
Competition
Recent Events

COMPANY OVERVIEW
A leading provider of vehicle remarketing services in the United States (US) and the United Kingdom (UK)
Provide vehicle suppliers with a full range of remarketing services to process and sell salvage vehicles
Sales are done primarily over the Internet through their Virtual Bidding Second Generation Internet auction-style sales technology (VB2)

COMPANY OVERVIEW – TWO MODELS
Revenues:
U.S. and Canada: CPRT acts primarily as an agent Derives revenue through fees from buyer, seller,
and services
U.K.: CPRT acts primarily as a principal Derives revenue by purchasing vehicles outright
from insurance companies and reselling them to buyers through live auctions and internet sales
Intend to implement VB2 in 2008
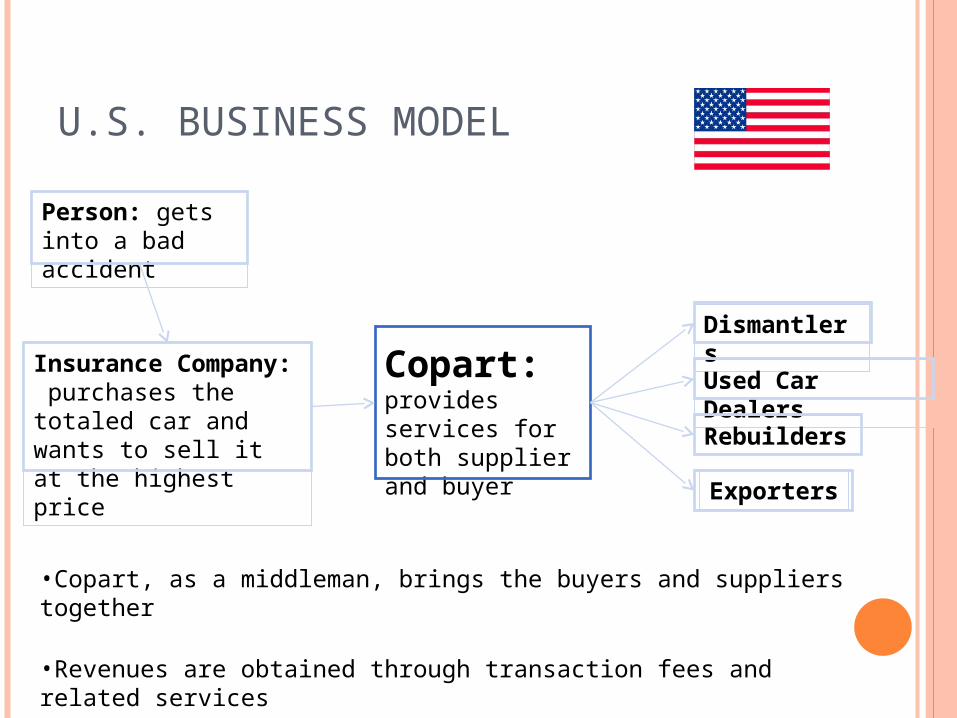
U.S. BUSINESS MODEL
Person: gets into a bad accident
Insurance Company: purchases the totaled car and wants to sell it at the highest price
Copart: provides services for both supplier and buyer
DismantlersUsed Car DealersRebuilders
Exporters
•Copart, as a middleman, brings the buyers and suppliers together
•Revenues are obtained through transaction fees and related services

U.K. BUSINESS MODEL
Person: gets into a bad accident
Insurance Company: purchases the totaled car and wants to sell it at the highest price
Copart: Buys the vehicle from the insurance company and sells it to the buyers
DismantlersUsed Car DealersRebuilders
Exporters
•Copart purchases the vehicle and actively looks for buyers.
•Revenues are obtained from the capital gains, but sustains all the transaction fees and devaluation risks.

BUSINESS STRATEGY
Acquisitions
Development of new facilities
Increasing buyer base
Implementing value-added services for both buyers and suppliers

ACQUISITION HISTORY - USD
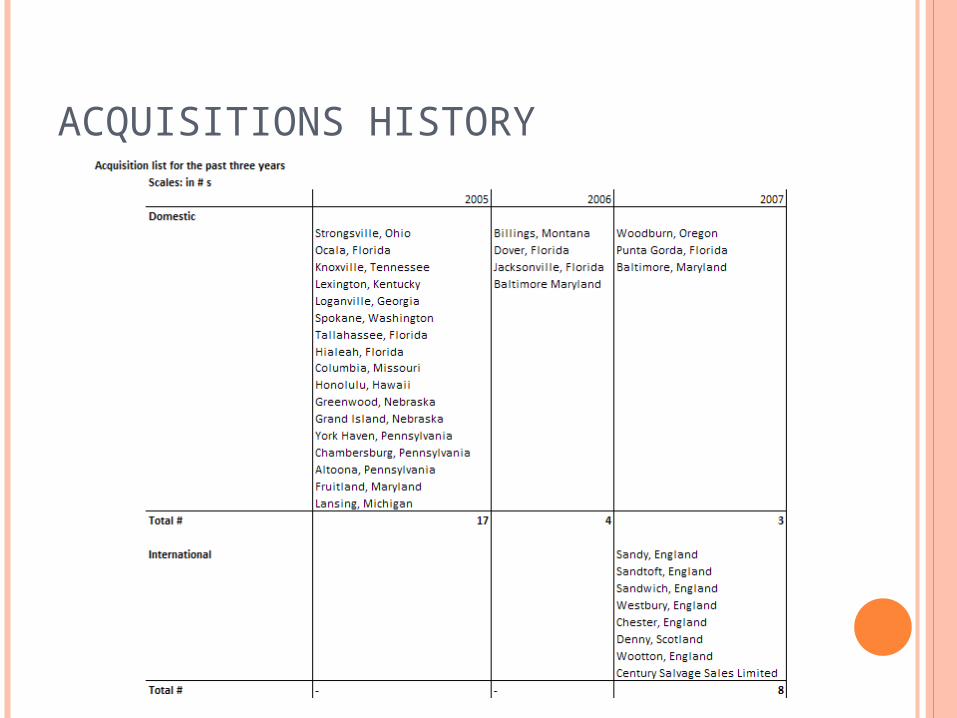
ACQUISITIONS HISTORY

CURRENT AND ONGOING ACQUISITIONS
U.S. and Canada Acquisitions (till April 8th): London, Ontario Windsor, New Jersey Walton, Kentucky
U.K. Acquisitions: Simpson Bros. Salvage AG Watson Auto Salvage & Motors Spares (2 yards)
With the closing of these transactions, Copart will operate 15 locations in the UK and 143 locations worldwide.

COMPETITION U.S. and Canada Competitors:
Vehicle auctioneers: the ADESA Corporation Auction Broadcasting Company Insurance Auto Auctions, Inc. Manheim Auctions SADISCO
Dismantlers: Greenleaf LKQ Corporation
Trade Groups: American Recycling Association United Recyclers Group
U.K. Principal competitors are privately held independent
salvage companies
RECENT EVENTS:
In October 2007, Copart announced a 20-million share increase in the company’s stock repurchase program, bringing the total number to 29 million shares.
March 6, 2008, Copart entered into a $200 million revolving line of credit with Bank of America.

PART II: STOCK & PORTFOLIOCurrent Holding
Last year Stock Performance
Current Portfolio fit
Correlation matrix

RCMP CURRENT HOLDINGS
Purchased 1,000 shares on February 28, 2003 at $7.82 per share
Sold 300 shares on November 6, 2007 at $36.20 per share (overvaluation)
Currently own 700 shares at $40.76 per share.
For past five years Copart has appreciated over 420% at approximately 38% annualized gain.
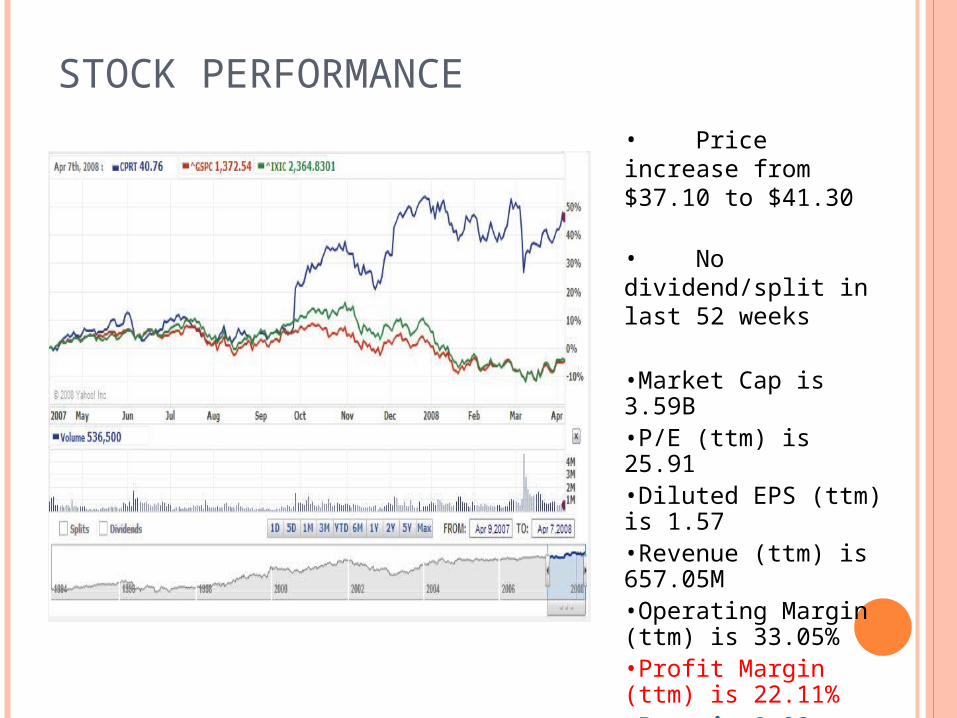
STOCK PERFORMANCE
• Price increase from $37.10 to $41.30
• No dividend/split in last 52 weeks
•Market Cap is 3.59B•P/E (ttm) is 25.91•Diluted EPS (ttm) is 1.57•Revenue (ttm) is 657.05M •Operating Margin (ttm) is 33.05%•Profit Margin (ttm) is 22.11% •Beta is 0.93, we changed to 1.300•52 week range: $27.42 -$43.27
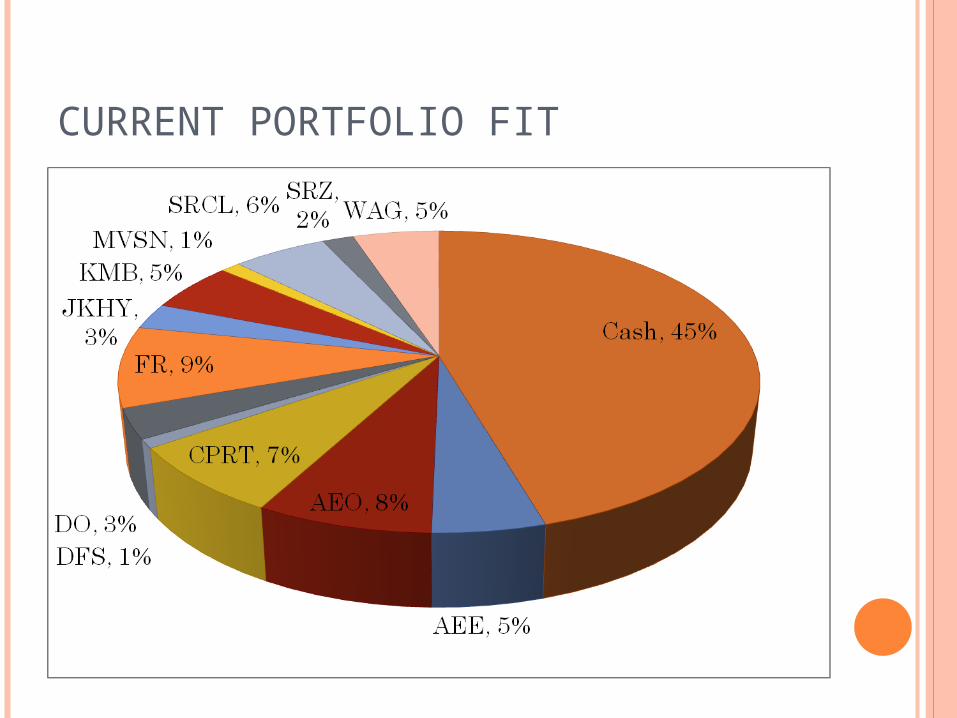
CURRENT PORTFOLIO FIT
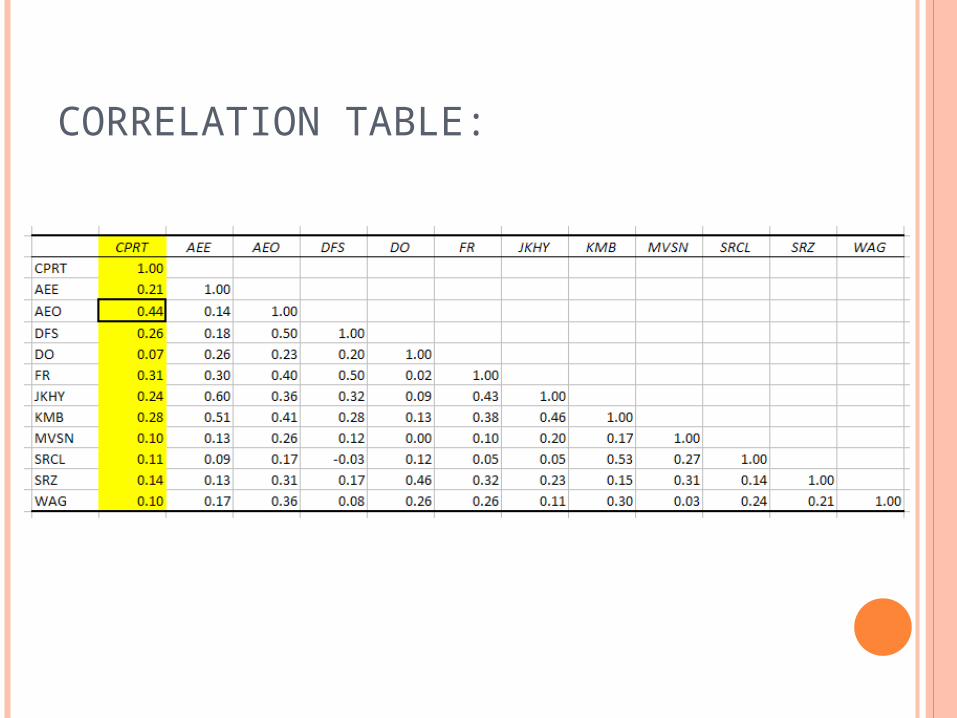
CORRELATION TABLE:

PART III: VALUATION (DCF)
Business Analysis
Key Assumption
Model & Calculation

BUSINESS ANALYSIS-REVENUE GROWTH MODE AND DEPENDENCE ANALYSIS
2003 2004 2005 2006 2007Y--2-Y
growth rate - 12.55% 14.50% 18.07% 3.29%
Past five year compound
Growth rate is 10.05%

GROSS P.P.E HISTORICAL GROSS MODE
2003 2004 2005 2006 2007Y-2-Y
growth rate - 12.13% 17.35% 14.91% 22.87%
Past Five year compound growth rate: 13.2%

REVENUE BREAK DOWN-SEASONAL EFFECT

REVENUE BREAK DOWN- SEGMENT
2008E FY 2008 E
Q1
% of total
period Q2% of total
period Q3 E% of total
period Q4 E% of total
period Total % of totalOct.-2007 Jan.-2008 Apr.-2008 July.-2008
140.17 76.20% 137.65 79.36%
171.61 77%
161.89 77.00% 611.32 77.33%
43.78 23.80% 35.81 20.64%
51.26 23%
48.36 23.00% 179.21 22.67%
183.95 100.00
% 173.46 100.00%
222.87 100.00%
210.25 100.00% 790.52 100.00%

INTRINSIC REVENUE GROWTH RATE CALCULATION
Expect Growth Rate Calculation Step 1: Calculate the Reinvestment Rate = 100% Step 2: Calculate Return on Equity = 11.26% Step 3: Calculate the Expect Growth Rate = 11.26%
Expect Growth Rate = ROE * Reinvestment Rate * this is the internal growth rate

KEY ASSUMPTION:
2008 E 2009 E 2010 E 2011 E 2012 EUS & CA Revenue 622.44 722.03 844.78 971.49 1097.79
Y--2-Y growth rate 14.00% 16.00% 17.00% 15.00% 13.00%% of SALES SEGMENT 77.65% 77.20% 76.75% 76.29% 75.81%
UK revenue 179.21 213.26 255.91 301.97 350.29Y-2--Y growth rate - 19.00% 20.00% 18.00% 16.00%
% of SALES SEGMENT 22.35% 22.80% 23.25% 23.71% 24.19%
Total Revenue 801.65
935.29
1,100.68
1,273.46
1,448.07
Y-2-Y growth rate 42.97% 16.67% 17.68% 15.70% 13.71%COGS 432.89 533.11 627.39 700.40 753.00
% of sales 54.00% 57.00% 57.00% 55.00% 52.00%Gross Profit 368.76 402.17 473.29 573.06 695.07
% of sales 46.00% 43.00% 43.00% 45.00% 48.00%

DCF: CAPM & WACC CALCULATIONAssumption:Stable Growth Rate 4%
Scales : Thousands 1 2 3 4 5 6
2008E 2009E 2010E 2011E 2012ETerminal
Value EBIT(1-TAX) $118.91 $120.61 $151.25 $219.33 $261.52 + Dep./Amortization $60.15 $70.18 $82.59 $95.55 $95.55 - CAPEX $240.93 $170.45 $206.68 $225.19 $95.55 - ∆NWC -$97.21 $15.94 $17.02 $17.27 $18.43 Terminal value, gross $3,304.77
-Terminal year lease
obligation $38.68 Terminal value, net $3,266.09 FCFF: $35.34 $4.40 $10.13 $72.42 $243.09 $3,266.09 PV of FCF $31.65 $3.53 $7.28 $46.60 $140.11 $1,686.07 SUM of PV $1,915.25

CAPM
rf 4.50% Rm 10.00% rm - rf 6% Adjusted Beta 1.300 Re = rf + Beta * (rm-rf) 11.650% Bloomberg Beta is 0.946, we changed it to 1.1 to capture the risk acusing from the oversea Mergers & Acquisitions.

WACC
Capital Structure:
Q2 2008 Equity Debt Pref.Eqty
Weight 100% 0.00% 0.00%
Cost 9.90% 0.00% 0.00%
WXC 9.90% 0.00% 0.00%
Wd 0.00% We 100.00% Rd 0.000% Re 11.650% WACC = We* Re + Wd * (1-t)* Rd 11.6500%

INTRINSIC VALUE CALCULATION
Scales : millions
= Enterprise Value $ 1,915.25
(USD millions)
* the company right now doest not have debt *
/ Shares outstanding 80.30(millions) Adjustments
= Price per share $ 23.85 10% Up 10% Down
$ 26.24
$ 21.47

SENSITIVITY ANALYSIS
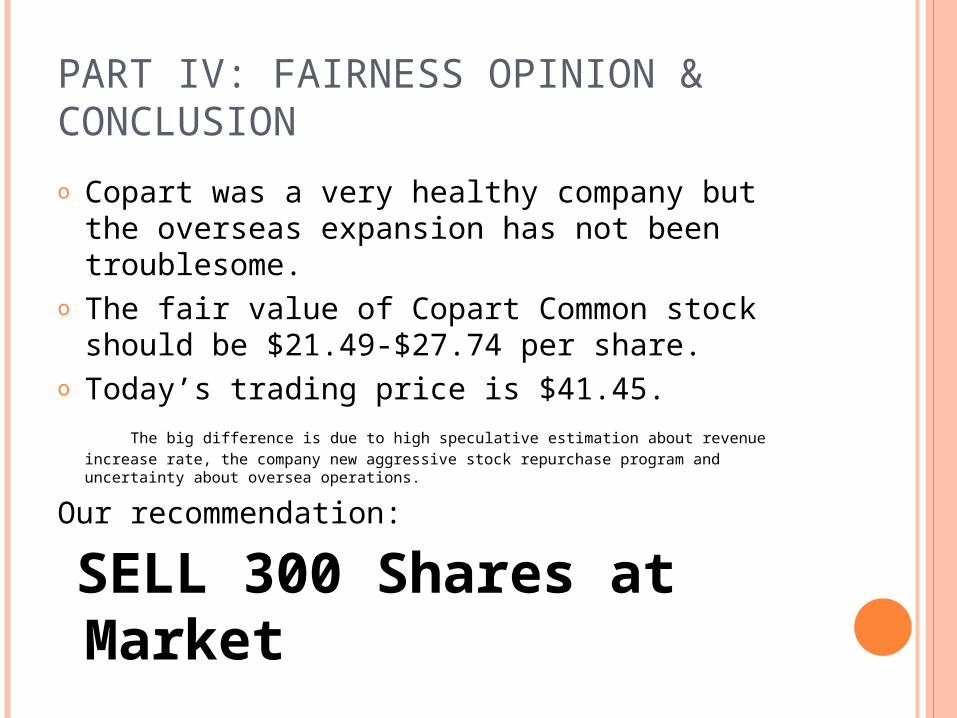
PART IV: FAIRNESS OPINION & CONCLUSION
o Copart was a very healthy company but the overseas expansion has not been troublesome.
o The fair value of Copart Common stock should be $21.49-$27.74 per share.
o Today’s trading price is $41.45. The big difference is due to high speculative estimation about revenue increase rate, the
company new aggressive stock repurchase program and uncertainty about oversea operations.
Our recommendation:
SELL 300 Shares at Market

Q & A:
Any Questions
?

APPENDIX: MACROECONOMIC EFFECTS- Oil
The increased oil price would negatively influence Copart profits:
Increased operating related costs(transportation, utility, etc.) In the long run changes people driving habits (driving slow or using Bus)

APPENDIX: CURRENCY EFFECTS
The decreased value of USD to Euro would increase Copart value :
•Domestically, Copart as a exporter, foreign customers would feel cars relatively cheap and increase the volume of VB2.
•In UK, since Copart as a principle, the currency effect is not material. (both buy side and sell side deal business using the same currency. )

APPENDIX: RECESSION EFFECTS

NOTICE: GROSS PROFIT MARGIN DECREASE
1) the cost of purchased cars of $48.3 million2) a charge of $0.6 million for the acceptance of fraudulent buyer credit card
payments for cars sold on behalf of our suppliers,