c103-e101 uv-vis-nir spectrophotometer uv-3600 plusfourier transform infrared (ftir)...
TRANSCRIPT

www.shimadzu.com/an/
For Research Use Only. Not for use in diagnostic procedures. This publication may contain references to products that are not available in your country. Please contact us to check the availability of these products in your country.Company names, products/service names and logos used in this publication are trademarks and trade names of Shimadzu Corporation, its subsidiaries or its affiliates, whether or not they are used with trademark symbol “TM” or “®”.Third-party trademarks and trade names may be used in this publication to refer to either the entities or their products/services, whether or not they are used with trademark symbol “TM” or “®”.Shimadzu disclaims any proprietary interest in trademarks and trade names other than its own.
The contents of this publication are provided to you “as is” without warranty of any kind, and are subject to change without notice. Shimadzu does not assume any responsibility or liability for any damage, whether direct or indirect, relating to the use of this publication.
© Shimadzu Corporation, 2016
New Product
UV-VIS-NIR Spect rophotometer
UV-3600 Plus
Large 150 mm Integrat ing Sphere At tachment for UV-3600 P lus Spect rophotometers
ISR-1503/ISR-1503F
UV-3600 Plus System with an ISR-1503 Large 150 mm Integrating Sphere Installed
This extra large 150 mm diameter integrating sphere is used to measure the re�ectance spectra of solid samples, such as powders, paper, or fabrics, or the transmittance spectra of liquid or solid samples.
It enables reliable measurements unaffected by factors such as the surface status of samples and is ideal for colorimetric measurements.
The ISR-1503F is a Spectralon based integrating sphere. Unaffected by moisture absorption, it is capable of high sensitivity measurements in the near infrared region.
A Look Back at Shimadzu Infrared Spectrophotometers—From Birth to Current Day— ------- 02
Automating the Measurement of Spectral Emissivity ------- 06
Tips for Successful Spectrum Searches—Part 2—Limiting the Wavenumber Ranges and Libraries in Searches— ------- 09
ISR-1503/ISR-1503FLarge 150 mm Integrating Sphere Attachment
for UV-3600 Plus Spectrophotometers ------- 12
Vol. 25 TALK LETTER
C103-E101
Fourier transform infrared (FTIR) spectrophotometers are currently used in a wide range of applications, including foreign substance analysis, veri�cation testing, functional group identi�cation, and quantitative analysis. FTIR spectrophotometers came into widespread use in Japan about 30 years ago between the late 1980s and the early 1990s. Before this time, dispersive infrared spectrophotometers were in widespread use, a technique that measures the infrared spectrum through optical dispersion of infrared light. This article will follow the history of infrared spectrophotometers at Shimadzu, from the birth of dispersive infrared spectrophotometers that use a prism to disperse infrared light through to the present day.
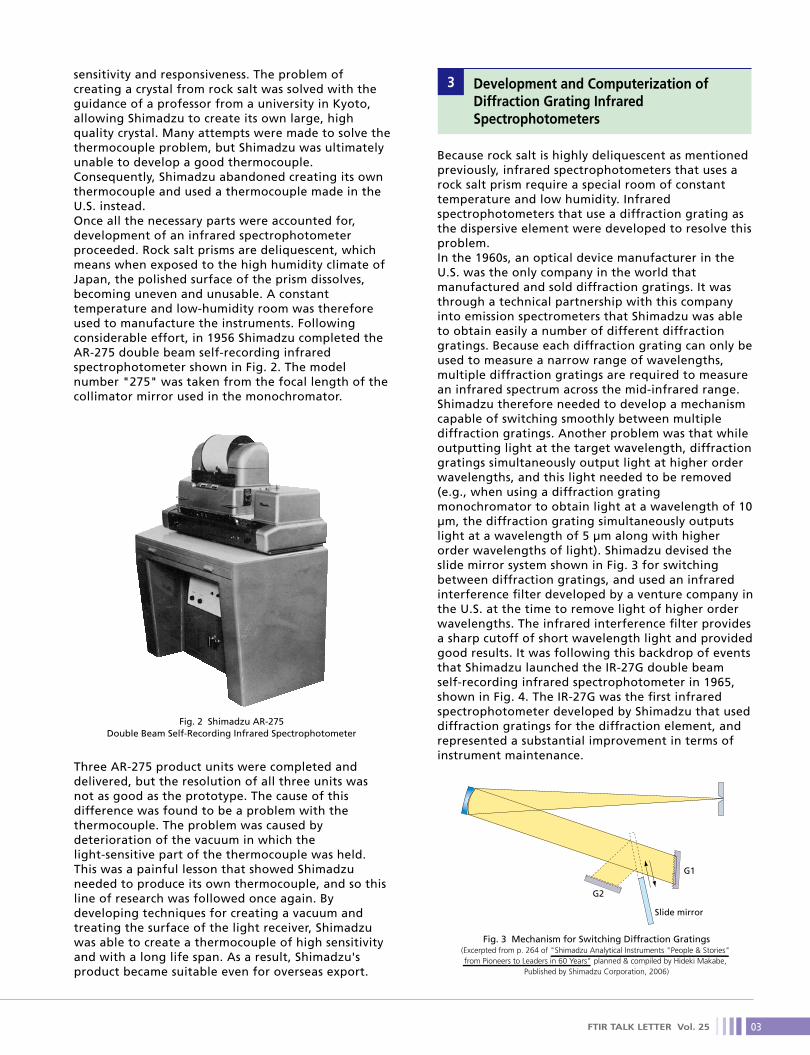
sensitivity and responsiveness. The problem of creating a crystal from rock salt was solved with the guidance of a professor from a university in Kyoto, allowing Shimadzu to create its own large, high quality crystal. Many attempts were made to solve the thermocouple problem, but Shimadzu was ultimately unable to develop a good thermocouple. Consequently, Shimadzu abandoned creating its own thermocouple and used a thermocouple made in the U.S. instead.Once all the necessary parts were accounted for, development of an infrared spectrophotometer proceeded. Rock salt prisms are deliquescent, which means when exposed to the high humidity climate of Japan, the polished surface of the prism dissolves, becoming uneven and unusable. A constant temperature and low-humidity room was therefore used to manufacture the instruments. Following considerable effort, in 1956 Shimadzu completed the AR-275 double beam self-recording infrared spectrophotometer shown in Fig. 2. The model number "275" was taken from the focal length of the collimator mirror used in the monochromator.
Three AR-275 product units were completed and delivered, but the resolution of all three units was not as good as the prototype. The cause of this difference was found to be a problem with the thermocouple. The problem was caused by deterioration of the vacuum in which the light-sensitive part of the thermocouple was held. This was a painful lesson that showed Shimadzu needed to produce its own thermocouple, and so this line of research was followed once again. By developing techniques for creating a vacuum and treating the surface of the light receiver, Shimadzu was able to create a thermocouple of high sensitivity and with a long life span. As a result, Shimadzu's product became suitable even for overseas export.
Fig. 2 Shimadzu AR-275Double Beam Self-Recording Infrared Spectrophotometer
1 Introduction
The �rst dispersive element used to disperse light in spectrophotometers was the prism. In UV-visible light spectrophotometers, this prism was made out of crystal, and in infrared spectrophotometers, this prism was made out of rock salt. Rock salt is a crystal of sodium chloride. Sodium chloride transmits light in the mid-infrared spectrum that appears after infrared absorption by organic materials. Rock salt was used as the prism material because it was possible to create a high quality crystal from sodium chloride arti�cially.
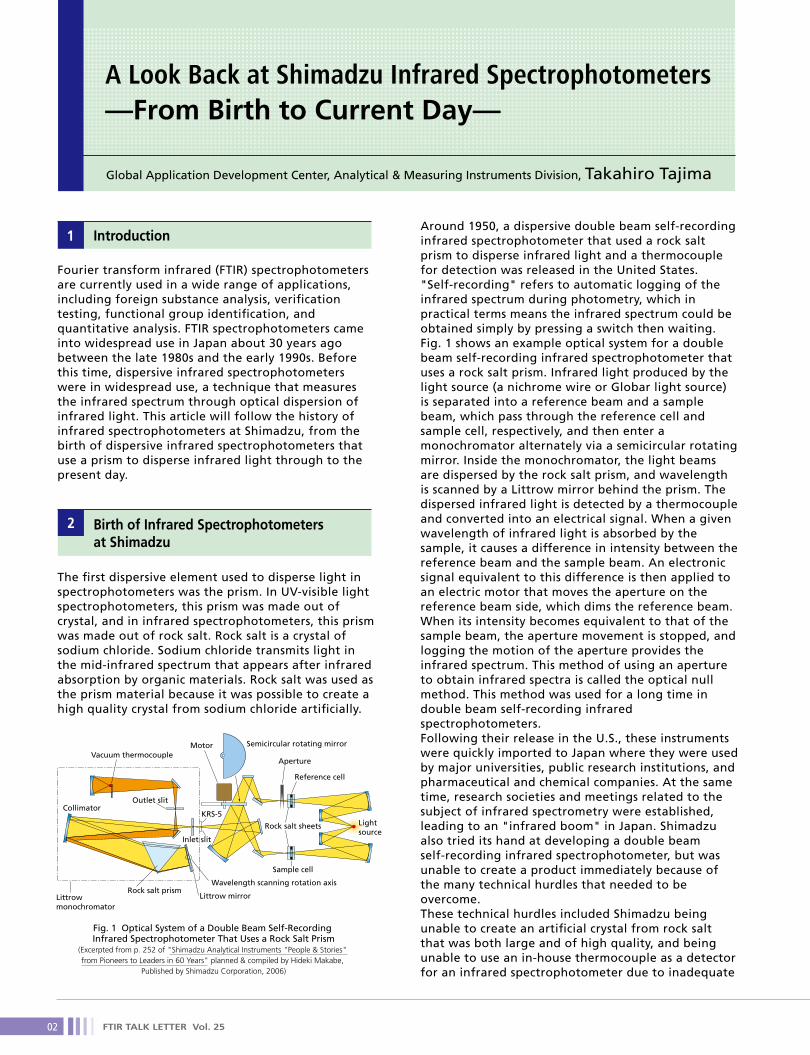
Around 1950, a dispersive double beam self-recording infrared spectrophotometer that used a rock salt prism to disperse infrared light and a thermocouple for detection was released in the United States. "Self-recording" refers to automatic logging of the infrared spectrum during photometry, which in practical terms means the infrared spectrum could be obtained simply by pressing a switch then waiting. Fig. 1 shows an example optical system for a double beam self-recording infrared spectrophotometer that uses a rock salt prism. Infrared light produced by the light source (a nichrome wire or Globar light source) is separated into a reference beam and a sample beam, which pass through the reference cell and sample cell, respectively, and then enter a monochromator alternately via a semicircular rotating mirror. Inside the monochromator, the light beams are dispersed by the rock salt prism, and wavelength is scanned by a Littrow mirror behind the prism. The dispersed infrared light is detected by a thermocouple and converted into an electrical signal. When a given wavelength of infrared light is absorbed by the sample, it causes a difference in intensity between the reference beam and the sample beam. An electronic signal equivalent to this difference is then applied to an electric motor that moves the aperture on the reference beam side, which dims the reference beam. When its intensity becomes equivalent to that of the sample beam, the aperture movement is stopped, and logging the motion of the aperture provides the infrared spectrum. This method of using an aperture to obtain infrared spectra is called the optical null method. This method was used for a long time in double beam self-recording infrared spectrophotometers.Following their release in the U.S., these instruments were quickly imported to Japan where they were used by major universities, public research institutions, and pharmaceutical and chemical companies. At the same time, research societies and meetings related to the subject of infrared spectrometry were established, leading to an "infrared boom" in Japan. Shimadzu also tried its hand at developing a double beam self-recording infrared spectrophotometer, but was unable to create a product immediately because of the many technical hurdles that needed to be overcome.These technical hurdles included Shimadzu being unable to create an arti�cial crystal from rock salt that was both large and of high quality, and being unable to use an in-house thermocouple as a detector for an infrared spectrophotometer due to inadequate
2 Birth of Infrared Spectrophotometers at Shimadzu
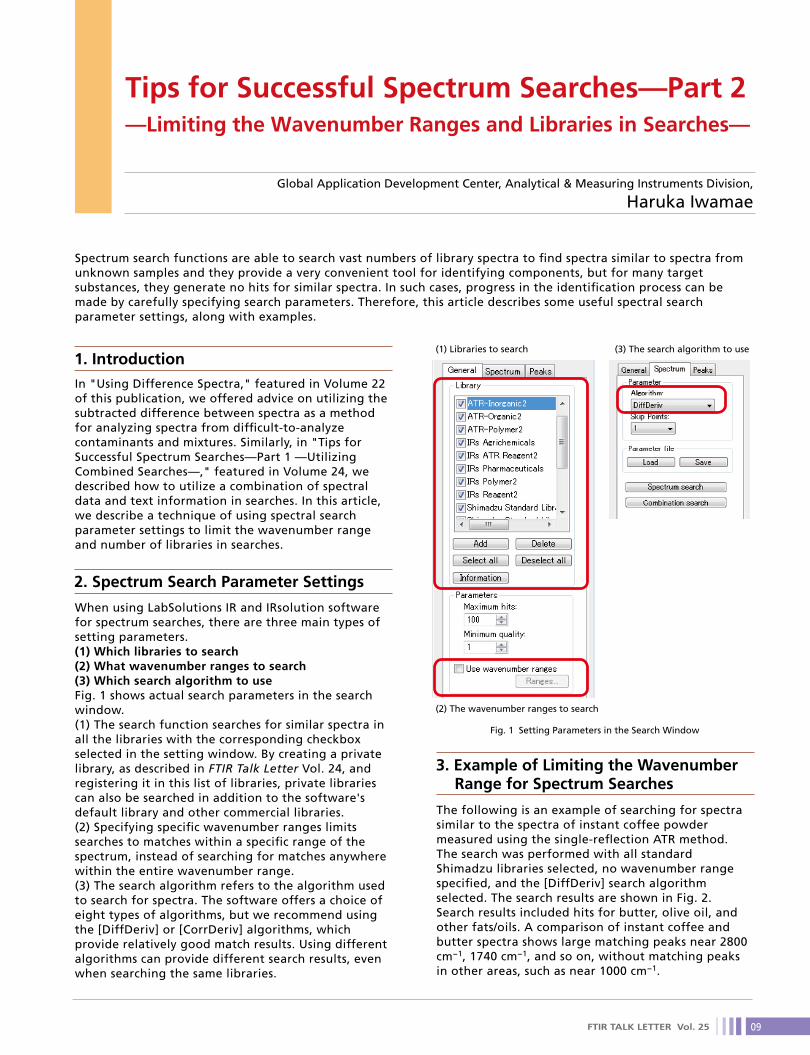
Because rock salt is highly deliquescent as mentioned previously, infrared spectrophotometers that uses a rock salt prism require a special room of constant temperature and low humidity. Infrared spectrophotometers that use a diffraction grating as the dispersive element were developed to resolve this problem.In the 1960s, an optical device manufacturer in the U.S. was the only company in the world that manufactured and sold diffraction gratings. It was through a technical partnership with this company into emission spectrometers that Shimadzu was able to obtain easily a number of different diffraction gratings. Because each diffraction grating can only be used to measure a narrow range of wavelengths, multiple diffraction gratings are required to measure an infrared spectrum across the mid-infrared range. Shimadzu therefore needed to develop a mechanism capable of switching smoothly between multiple diffraction gratings. Another problem was that while outputting light at the target wavelength, diffraction gratings simultaneously output light at higher order wavelengths, and this light needed to be removed (e.g., when using a diffraction grating monochromator to obtain light at a wavelength of 10 µm, the diffraction grating simultaneously outputs light at a wavelength of 5 µm along with higher order wavelengths of light). Shimadzu devised the slide mirror system shown in Fig. 3 for switching between diffraction gratings, and used an infrared interference �lter developed by a venture company in the U.S. at the time to remove light of higher order wavelengths. The infrared interference �lter provides a sharp cutoff of short wavelength light and provided good results. It was following this backdrop of events that Shimadzu launched the IR-27G double beam self-recording infrared spectrophotometer in 1965, shown in Fig. 4. The IR-27G was the �rst infrared spectrophotometer developed by Shimadzu that used diffraction gratings for the diffraction element, and represented a substantial improvement in terms of instrument maintenance.
3 Development and Computerization of Diffraction Grating Infrared Spectrophotometers
A Look Back at Shimadzu Infrared Spectrophotometers—From Birth to Current Day—
Global Application Development Center, Analytical & Measuring Instruments Division, Takahiro Tajima
Vacuum thermocouple
Collimator
Littrow monochromator
Rock salt prismLittrow mirror
Wavelength scanning rotation axis
Sample cell
Light source
Motor
KRS-5
Semicircular rotating mirror
Inlet slit
Rock salt sheets
Aperture
Reference cell
Outlet slit
Slide mirror
G1
G2
Fig. 1 Optical System of a Double Beam Self-Recording Infrared Spectrophotometer That Uses a Rock Salt Prism
(Excerpted from p. 252 of "Shimadzu Analytical Instruments "People & Stories" from Pioneers to Leaders in 60 Years" planned & compiled by Hideki Makabe,
Published by Shimadzu Corporation, 2006)
Fig. 3 Mechanism for Switching Diffraction Gratings(Excerpted from p. 264 of "Shimadzu Analytical Instruments "People & Stories" from Pioneers to Leaders in 60 Years" planned & compiled by Hideki Makabe,
Published by Shimadzu Corporation, 2006)
FTIR TALK LETTER Vol. 25 FTIR TALK LETTER Vol. 25 0302
Fourier transform infrared (FTIR) spectrophotometers are currently used in a wide range of applications, including foreign substance analysis, veri�cation testing, functional group identi�cation, and quantitative analysis. FTIR spectrophotometers came into widespread use in Japan about 30 years ago between the late 1980s and the early 1990s. Before this time, dispersive infrared spectrophotometers were in widespread use, a technique that measures the infrared spectrum through optical dispersion of infrared light. This article will follow the history of infrared spectrophotometers at Shimadzu, from the birth of dispersive infrared spectrophotometers that use a prism to disperse infrared light through to the present day.
sensitivity and responsiveness. The problem of creating a crystal from rock salt was solved with the guidance of a professor from a university in Kyoto, allowing Shimadzu to create its own large, high quality crystal. Many attempts were made to solve the thermocouple problem, but Shimadzu was ultimately unable to develop a good thermocouple. Consequently, Shimadzu abandoned creating its own thermocouple and used a thermocouple made in the U.S. instead.Once all the necessary parts were accounted for, development of an infrared spectrophotometer proceeded. Rock salt prisms are deliquescent, which means when exposed to the high humidity climate of Japan, the polished surface of the prism dissolves, becoming uneven and unusable. A constant temperature and low-humidity room was therefore used to manufacture the instruments. Following considerable effort, in 1956 Shimadzu completed the AR-275 double beam self-recording infrared spectrophotometer shown in Fig. 2. The model number "275" was taken from the focal length of the collimator mirror used in the monochromator.
Three AR-275 product units were completed and delivered, but the resolution of all three units was not as good as the prototype. The cause of this difference was found to be a problem with the thermocouple. The problem was caused by deterioration of the vacuum in which the light-sensitive part of the thermocouple was held. This was a painful lesson that showed Shimadzu needed to produce its own thermocouple, and so this line of research was followed once again. By developing techniques for creating a vacuum and treating the surface of the light receiver, Shimadzu was able to create a thermocouple of high sensitivity and with a long life span. As a result, Shimadzu's product became suitable even for overseas export.
Fig. 2 Shimadzu AR-275Double Beam Self-Recording Infrared Spectrophotometer
1 Introduction
The �rst dispersive element used to disperse light in spectrophotometers was the prism. In UV-visible light spectrophotometers, this prism was made out of crystal, and in infrared spectrophotometers, this prism was made out of rock salt. Rock salt is a crystal of sodium chloride. Sodium chloride transmits light in the mid-infrared spectrum that appears after infrared absorption by organic materials. Rock salt was used as the prism material because it was possible to create a high quality crystal from sodium chloride arti�cially.
Around 1950, a dispersive double beam self-recording infrared spectrophotometer that used a rock salt prism to disperse infrared light and a thermocouple for detection was released in the United States. "Self-recording" refers to automatic logging of the infrared spectrum during photometry, which in practical terms means the infrared spectrum could be obtained simply by pressing a switch then waiting. Fig. 1 shows an example optical system for a double beam self-recording infrared spectrophotometer that uses a rock salt prism. Infrared light produced by the light source (a nichrome wire or Globar light source) is separated into a reference beam and a sample beam, which pass through the reference cell and sample cell, respectively, and then enter a monochromator alternately via a semicircular rotating mirror. Inside the monochromator, the light beams are dispersed by the rock salt prism, and wavelength is scanned by a Littrow mirror behind the prism. The dispersed infrared light is detected by a thermocouple and converted into an electrical signal. When a given wavelength of infrared light is absorbed by the sample, it causes a difference in intensity between the reference beam and the sample beam. An electronic signal equivalent to this difference is then applied to an electric motor that moves the aperture on the reference beam side, which dims the reference beam. When its intensity becomes equivalent to that of the sample beam, the aperture movement is stopped, and logging the motion of the aperture provides the infrared spectrum. This method of using an aperture to obtain infrared spectra is called the optical null method. This method was used for a long time in double beam self-recording infrared spectrophotometers.Following their release in the U.S., these instruments were quickly imported to Japan where they were used by major universities, public research institutions, and pharmaceutical and chemical companies. At the same time, research societies and meetings related to the subject of infrared spectrometry were established, leading to an "infrared boom" in Japan. Shimadzu also tried its hand at developing a double beam self-recording infrared spectrophotometer, but was unable to create a product immediately because of the many technical hurdles that needed to be overcome.These technical hurdles included Shimadzu being unable to create an arti�cial crystal from rock salt that was both large and of high quality, and being unable to use an in-house thermocouple as a detector for an infrared spectrophotometer due to inadequate
2 Birth of Infrared Spectrophotometers at Shimadzu
Because rock salt is highly deliquescent as mentioned previously, infrared spectrophotometers that uses a rock salt prism require a special room of constant temperature and low humidity. Infrared spectrophotometers that use a diffraction grating as the dispersive element were developed to resolve this problem.In the 1960s, an optical device manufacturer in the U.S. was the only company in the world that manufactured and sold diffraction gratings. It was through a technical partnership with this company into emission spectrometers that Shimadzu was able to obtain easily a number of different diffraction gratings. Because each diffraction grating can only be used to measure a narrow range of wavelengths, multiple diffraction gratings are required to measure an infrared spectrum across the mid-infrared range. Shimadzu therefore needed to develop a mechanism capable of switching smoothly between multiple diffraction gratings. Another problem was that while outputting light at the target wavelength, diffraction gratings simultaneously output light at higher order wavelengths, and this light needed to be removed (e.g., when using a diffraction grating monochromator to obtain light at a wavelength of 10 µm, the diffraction grating simultaneously outputs light at a wavelength of 5 µm along with higher order wavelengths of light). Shimadzu devised the slide mirror system shown in Fig. 3 for switching between diffraction gratings, and used an infrared interference �lter developed by a venture company in the U.S. at the time to remove light of higher order wavelengths. The infrared interference �lter provides a sharp cutoff of short wavelength light and provided good results. It was following this backdrop of events that Shimadzu launched the IR-27G double beam self-recording infrared spectrophotometer in 1965, shown in Fig. 4. The IR-27G was the �rst infrared spectrophotometer developed by Shimadzu that used diffraction gratings for the diffraction element, and represented a substantial improvement in terms of instrument maintenance.
3 Development and Computerization of Diffraction Grating Infrared Spectrophotometers
A Look Back at Shimadzu Infrared Spectrophotometers—From Birth to Current Day—
Global Application Development Center, Analytical & Measuring Instruments Division, Takahiro Tajima
Vacuum thermocouple
Collimator
Littrow monochromator
Rock salt prismLittrow mirror
Wavelength scanning rotation axis
Sample cell
Light source
Motor
KRS-5
Semicircular rotating mirror
Inlet slit
Rock salt sheets
Aperture
Reference cell
Outlet slit
Slide mirror
G1
G2
Fig. 1 Optical System of a Double Beam Self-Recording Infrared Spectrophotometer That Uses a Rock Salt Prism
(Excerpted from p. 252 of "Shimadzu Analytical Instruments "People & Stories" from Pioneers to Leaders in 60 Years" planned & compiled by Hideki Makabe,
Published by Shimadzu Corporation, 2006)
Fig. 3 Mechanism for Switching Diffraction Gratings(Excerpted from p. 264 of "Shimadzu Analytical Instruments "People & Stories" from Pioneers to Leaders in 60 Years" planned & compiled by Hideki Makabe,
Published by Shimadzu Corporation, 2006)
FTIR TALK LETTER Vol. 25 FTIR TALK LETTER Vol. 25 0302

This article was written using "Shimadzu Analytical Instruments "People & Stories" from Pioneers to Leaders in 60 Years" planned & compiled by Hideki Makabe, published by Shimadzu Corporation, 2006 as a reference.
currently in the FTIR era with the infrared spectrophotometer an essential analytical instrument for foreign substance analysis and veri�cation testing, Shimadzu will continue to develop its products further in response to user needs.
Meanwhile, in 1986 Shimadzu launched the IR-460 double beam self-recording infrared spectrophotometer, a dispersive infrared spectrophotometer. While measurements were previously based on the optical null method, this model used the ratio measurement method that increased measurement precision by obtaining the infrared spectrum through calculation of the ratio of light intensity between the reference beam and sample beam. Furthermore, in 1988 color CRT screen monitors became available, and the IR-470 shown in Fig. 8 was launched with improved functionality. Nevertheless, infrared spectrophotometry had already transitioned to the era of FTIR, and in 1995 sales of the IR-470 were discontinued. This was last of Shimadzu's dispersive infrared spectrophotometers.
that point onwards, all FTIR spectrophotometers launched by Shimadzu were PC-controlled, which includes Shimadzu's Fourier transform infrared spectrophotometer models that are sold today: the IRAf�nity-1S and IRTracer-100.
The FTIR-4000 model shown in Fig. 6 was Shimadzu's �rst Fourier transform infrared spectrophotometer, and was launched in 1984. The FTIR-4000 employed an air bearing mechanism for smooth driving of the moving mirror. The FTIR-4000 could also switch automatically between measurement of the sample side beam and the reference side beam every de�ned number of times so measurements could be performed in a similar manner to the double beam self-recording infrared spectrophotometers that were used previously. Since personal computers (PC) were not yet widespread at the time, the dedicated operation units were used to control operations. The price of an FTIR spectrophotometer fell below 10 million yen, which was a breakthrough price at the time.Reductions in the size and price of FTIR spectrophotometers continued, and in 1990 Shimadzu launched the FTIR-8100 Fourier transform infrared spectrophotometer shown in Fig. 7. The FTIR-8100 model also included dedicated operation units, with keyboard function keys used to perform spectrum measurement, to zoom in or out of the spectrum display window, and to perform data processing. The FTIR-8100 cost 3 million yen, and FTIR spectrophotometers came into widespread use in Japan at the time. As PCs also reduced in price and became widespread, there was an increasing demand for PC-controlled FTIR spectrophotometers. In response to this demand, in 1994 Shimadzu launched the FTIR-8200PC and FTIR-8600PC PC-controlled Fourier transform infrared spectrophotometers. From
This problem was resolved by FTIR. The advantages of FTIR are high sensitivity compared to dispersive infrared spectrophotometer due to a relatively high percentage light throughout, and high precision in terms of wavenumber through the use of a highly stable laser for sampling of interference signals (interferogram).FTIR was launched in the U.S. in the middle of the 1970s. With FTIR, the infrared spectrum is obtained by converting an interference signal with a Fourier transform. This Fourier transform requires a vast number of calculations, and at the time was performed using large-scale computers. Combined with the high price of FTIR, this technique was only used at limited research institutions. However, the development of microcomputers mentioned in the previous section resulted in reductions in the size and price of FTIR spectrophotometers.
Fig. 6 Shimadzu FTIR-4000 Fourier Transform Infrared Spectrophotometer
Fig. 8 Shimadzu IR-470 Double Beam Self-Recording Infrared Spectrophotometer
1956 AR-275
1959 IR-27
1964 IR-27C
1965 IR-27G
1970 IR-400, IR-450
1974 IR-430
1977 IR-410
1978 IR-408, IR-420, IR-440
1981 IR-435
1984 FTIR-4000
1986 IR-460, FTIR-4100
1987 FTIR-4200, FTIR-4300
1988 IR-470
1990 IR-8100, FTIR-8100M
1991 FTIR-8500
1992 IRG-8000
1993 FTIR-8200, FTIR-8200D
FTIR-8600
1994 FTIR-8100A, FTIR-8200A,
FTIR-8200PC, FTIR-8600PC,
μIR-8000
1997 FTIR-8300, FTIR-8700
1999 FAI-6000D
2000 FTIR-8400, FTIR-8900
2002 FTIR-8400S, IRPrestige-21
2008 IRAf�nity-1
2013 IRTracer-100, IRAf�nity-1S
Fig. 4 Shimadzu IR-27G Double Beam Self-Recording Infrared Spectrophotometer
Fig. 5 Shimadzu IR-435 Double Beam Self-Recording Infrared Spectrophotometer
As the technology progressed, around 1980 microcomputers started being incorporated into analytical instruments. The IR-435 model shown in Fig. 5 was Shimadzu's �rst double beam self-recording infrared spectrophotometer to come with a built-in microcomputer, and was launched in 1981. The IR-435 performed data processing including spectra logging, differential spectra processing, and peak detection, and was a substantial improvement over previous infrared spectrophotometers in terms of functionality.
Dispersive infrared spectrophotometers have a low percentage light throughput since infrared light from the light source is diffracted by a dispersive element then passed through a slit, and the sensitivity of the thermocouple of the detector is low. These characteristics make the measurement of micro samples dif�cult for dispersive infrared spectrophotometry. Even when using an attenuated total re�ection (ATR) attachment, which is currently used for FTIR most commonly, when measuring micro samples, the scanning speed must be slowed to reduce noise in the infrared spectra, which requires a lot of time.
4 Development of FTIR and the End of Dispersive Infrared Spectrophotometers
Fig. 7 Shimadzu FTIR-8100 Fourier Transform Infrared Spectrophotometer
Model names and release dates of infrared spectrophotometers sold by Shimadzu, including the AR-275 in 1956 and present day instruments, are shown in Table 1. Over this time, the total number of Shimadzu dispersive spectrophotometers and FTIR spectrophotometers sold and used throughout the world has reached around 20,000 units. While we are
5 Conclusion
Table 1 History of Infrared Spectrophotometers
Model NameYear Launched
FTIR TALK LETTER Vol. 25 FTIR TALK LETTER Vol. 25 0504

Measuring Emissivity Manually
A spectral emissivity spectrum is obtained by using the FTIR spectrophotometer to measure the infrared radiation emitted from a sample when heated and then correcting the measurements based on the amount of infrared radiation emitted from a black body furnace set to the same temperature as the sample surface.A black body furnace is used to correct measurements to compensate for the effects of the spectral characteristics of optical components in the FTIR system and the frequency characteristics of electrical circuits (i.e. instrument functions). For manual measurements, correcting the measurements requires that the black body furnace and sample surface have the same temperature. However, due to the thickness of the sample, the sample surface temperature is lower than the temperature of the sample heating furnace. Consequently, two samples are prepared, with the surface of one sample painted with a black body paint. Then the black body furnace temperature is adjusted so that the infrared radiation power spectrum emitted from the painted sample matches the power spectrum emitted from the black body furnace. Finally, the spectral emissivity spectrum is obtained by replacing the painted sample with the unpainted sample and correcting measurements based on the power spectrum from the temperature-adjusted black body furnace.
Automating the Measurement of Spectral Emissivity
Given the extremely high levels of time and trouble required by such manual procedures, the following describes a simple method of measuring spectral emissivity using a macro program.
When the measurement program is launched, the main menu shown in Fig. 2 is displayed.
By consecutively operating each menu button in order from the left, this program makes it easy to measure spectral emissivity spectra.
Among the various measures used to combat global warming, far-infrared radiant materials are being used as heaters and furnaces in heating and insulating equipment to help save energy.Measuring the spectral emissivity of far-infrared radiant materials provides fundamental data for evaluating such materials, as described in Spectral Emissivity Measurement Using FTIR Spectrophotometry (FTIR Talk Letter Vol. 13), and provides an extremely important means of researching energy saving materials. However, manually obtaining accurate measurements requires signi�cant time and trouble for processing samples, setting the black body furnace temperature, and so on.
Fig. 2 Main Menu in the Emissivity Measurement Program
50075010001250150017502000250030003500400045001/cm
0
5
10
15
20
E
Black body furnace: 1005 °C
Each process step is described in more detail below.
(1) Measuring the Black Body Emissivity SpectrumSet the black body furnace temperature to the heating temperature of the sample being measured.After the black body furnace temperature stabilizes suf�ciently, click the [Background measurement] button to measure the infrared power spectrum emitted from the black body furnace.The sample heating temperature is generally set to 200 °C or higher, because signals for shorter wavelengths than 2000 cm−1 (�ve microns) cannot be obtained in emissivity spectra at temperatures below 200 °C, as shown in Fig. 4.
(2) Measuring the Sample Emissivity SpectrumSet the sample heating furnace to a temperature about 20 to 50 °C higher than the desired sample measurement temperature and place the sample in the sample heating furnace.After the sample heating furnace temperature stabilizes suf�ciently, click the [Sample measurement] button to measure the infrared power spectrum emitted from the sample surface.
(3) Measuring the Emissivity Spectrum from the Black Body Painted SampleRemove the measurement sample from the sample heating furnace and let the sample cool. Then paint the sample surface with black body paint.After the black body paint is thoroughly dry, place it back into the sample heating furnace. When the sample surface temperature has stabilized suf�ciently, click the [Blackbody sample measurement] button to measure the infrared power spectrum emitted from the sample surface painted with black body paint.If two identically shaped samples are available, time can be saved by painting one with black body paint and letting it dry while the other sample is used for the sample measurement.
(4) Calculating the Sample Surface TemperatureWhen �nished measuring the black body painted sample, calculate the emissivity spectrum by dividing the power spectrum from the surface of the black body painted sample by the power spectrum from the black body furnace.If there is a difference between their temperatures, the emissivity spectra will deviate from 100 %.In that case, recalculate the emissivity spectrum using a power spectrum for a separate new temperature calculated from the power spectrum for the black body furnace using Planck's radiation formula. Repeat the recalculation process several times to determine the temperature that results in an emissivity spectrum closest to 100 %.Use that temperature as the sample surface temperature (Fig. 5).
Fig. 3 Process Sequence for Emissivity Measurement Program
Fig. 4 Example of Black Body Emissivity Spectra Between 200 and 1000 °C
(1) Measure black body emissivity spectrum.
(2) Measure sample emissivity spectrum.
(3) Measure emissivity spectrum from black body painted sample.
(4) Calculate sample surface temperature.
(5) Calculate emissivity spectrum.
Sample heating furnace (external infrared radiation source)
Black body furnace
Emissivity measurement unit
IRTracer-100
Photo 1 Emissivity Measurement System
Fig. 1 System Con�guration Example
Black body furnace: 1005 °C
Black body furnace: 907 °CBlack body furnace: 808 °CBlack body furnace: 712 °CBlack body furnace: 615 °CBlack body furnace: 512 °CBlack body furnace: 420 °CBlack body furnace: 298 °CBlack body furnace: 200 °C
Fig. 5 Adjusting the Sample Surface Temperature
The program displays the corresponding emissivity spectra on the screen so that the user can adjust the temperature while visually con�rming the corresponding emissivity spectra for given user speci�ed temperatures.
Spectroscopy Business Unit, Analytical & Measuring Instruments Division, Hiroshi Ota
Automating the Measurement of Spectral Emissivity
FTIR TALK LETTER Vol. 25 FTIR TALK LETTER Vol. 25 0706

Summary
The emissivity measurement program makes it easy to adjust the black body furnace temperature, which was previously a manual process, in one degree increments. In addition, black body furnace and black body painted sample emissivity calculations are built into the program, so that spectral emissivity spectra can be calculated more accurately.By using Planck's formula, temperature-dependent differences in integrated radiation values can be compared during measurements by displaying emissivity spectra for different temperatures.Functionality of the emissivity measurement system can also be expected to improve in the future.
In "Using Difference Spectra," featured in Volume 22 of this publication, we offered advice on utilizing the subtracted difference between spectra as a method for analyzing spectra from dif�cult-to-analyze contaminants and mixtures. Similarly, in "Tips for Successful Spectrum Searches—Part 1 —Utilizing Combined Searches—," featured in Volume 24, we described how to utilize a combination of spectral data and text information in searches. In this article, we describe a technique of using spectral search parameter settings to limit the wavenumber range and number of libraries in searches.
The following is an example of searching for spectra similar to the spectra of instant coffee powder measured using the single-re�ection ATR method. The search was performed with all standard Shimadzu libraries selected, no wavenumber range speci�ed, and the [DiffDeriv] search algorithm selected. The search results are shown in Fig. 2. Search results included hits for butter, olive oil, and other fats/oils. A comparison of instant coffee and butter spectra shows large matching peaks near 2800 cm−1, 1740 cm−1, and so on, without matching peaks in other areas, such as near 1000 cm−1.
When using LabSolutions IR and IRsolution software for spectrum searches, there are three main types of setting parameters.(1) Which libraries to search(2) What wavenumber ranges to search(3) Which search algorithm to useFig. 1 shows actual search parameters in the search window.(1) The search function searches for similar spectra in all the libraries with the corresponding checkbox selected in the setting window. By creating a private library, as described in FTIR Talk Letter Vol. 24, and registering it in this list of libraries, private libraries can also be searched in addition to the software's default library and other commercial libraries.(2) Specifying speci�c wavenumber ranges limits searches to matches within a speci�c range of the spectrum, instead of searching for matches anywhere within the entire wavenumber range.(3) The search algorithm refers to the algorithm used to search for spectra. The software offers a choice of eight types of algorithms, but we recommend using the [DiffDeriv] or [CorrDeriv] algorithms, which provide relatively good match results. Using different algorithms can provide different search results, even when searching the same libraries.
Spectrum search functions are able to search vast numbers of library spectra to �nd spectra similar to spectra from unknown samples and they provide a very convenient tool for identifying components, but for many target substances, they generate no hits for similar spectra. In such cases, progress in the identi�cation process can be made by carefully specifying search parameters. Therefore, this article describes some useful spectral search parameter settings, along with examples.
1. Introduction
3. Example of Limiting the Wavenumber Range for Spectrum Searches
2. Spectrum Search Parameter Settings
(5) Calculating the Emissivity SpectrumCalculate the sample emissivity spectrum using the black body furnace power spectrum for the temperature determined by the user.Actual black body furnaces and black body paint do not have an emissivity of 1.00, but rather a value between about 0.94 and 0.98. Therefore, emissivity spectra calculations must be adjusted for this difference as well.These values can be speci�ed in advance in the [Settings] window.
Fig. 6 Various Parameter SettingsFig. 1 Setting Parameters in the Search Window
(3) The search algorithm to use(1) Libraries to search
(2) The wavenumber ranges to search
Tips for Successful Spectrum Searches—Part 2—Limiting the Wavenumber Ranges and Libraries in Searches—
Global Application Development Center, Analytical & Measuring Instruments Division,
Haruka Iwamae
FTIR TALK LETTER Vol. 25 FTIR TALK LETTER Vol. 25 0908

The two sets of search results from searching the entire wavenumber range and searching only limited wavenumber ranges indicate that the instant coffee powder presumably contains two organic components, an oil and a polysaccharide. Based on this information, we limited the number of libraries
4. Example of Limiting the List of Libraries for Spectrum Searches
Fig. 6 Search Results for Instant Coffee Powder with Limited Library List
Fig. 2 Search Results for Instant Coffee Powder
Fig. 3 Window for Setting Wavenumber Ranges
Instant coffee powder
Starch
ButterStarch
Instant coffee powder
Fig. 4 Search Results for Instant Coffee Powder with Wavenumber Range Limitations
Fig. 5 Measured Spectrum for Instant Coffee (Upper) and Library Spectra for Butter and Starch (Lower)
Instant coffee powderButter
Using the difference spectrum between the unknown sample and library spectrum can be a useful way to narrow the search for the non-matching section, but sometimes it can be dif�cult to subtract spectra successfully, due to the misalignment of peaks, and so on. However, by selecting the [Use wavenumber ranges] checkbox (2) in the search window, shown in Fig. 1, a spectrum search can be performed easily for only the speci�ed wavenumber ranges. The window for setting wavenumber ranges is shown in Fig. 3. In this case, we speci�ed searching the ranges from 600 to 1120 cm−1 and 3000 to 4000 cm−1, where the instant coffee powder spectrum did not match the butter spectrum included in the library search results. Up to ten different ranges can be speci�ed. Given the two ranges speci�ed, the search results will list spectra that have similar pro�les as the instant coffee powder spectrum in the two wavenumber ranges marked with red squares.
Results from searching within the restricted wavenumber ranges are shown in Fig. 4. Unlike the search results in Fig. 2, this time substances such as starch are included among top hits. Fig. 5 shows an overlay comparison of the measured instant coffee powder spectrum with library spectra for butter and starch. Due to matching characteristic peaks, we can assume that the powder is a mixture of fats/oils and polysaccharides. Since instant coffee powder contains both of these components, the identi�cation results can be presumed to be reasonable.
searched, so that both components would be listed near the top of search results and corresponding spectra could be overlaid with the unknown sample spectrum for comparison.Searching a limited number of libraries can move a search hit that was otherwise listed low in hit list results, due to slight differences in search scores resulting from searching a large number of library spectra, up to near the top of the hit list.In this example, three libraries were speci�ed for searching, based on the single-re�ection ATR method used for analysis and the two organic components predicted, namely the [A_FoodAdditives2], [ATROrganic2], and [ATR-Polymer2] libraries. Standard Shimadzu libraries with names starting with "ATR" or "A" include data acquired using the ATR method and libraries with names starting with "T" include data acquired using the transmittance method. Search results from limiting the number of libraries searched for instant coffee powder are shown in Fig. 6. These results include both butter, which was included in the initial search results shown in Fig. 2, and starch among the top results.
Instant coffee powder
ButterStarch
In this way, limiting the number of libraries used can be an effective way to �nd a match for the components contained in an unknown sample. For example, if the likelihood is high that a sample is an inorganic compound, such as a plastic additive, then only search libraries with spectra for inorganic compounds, such as [ATR-Inorganic2] and [T-Inorganic2] libraries. If a sample is likely to be similar to a contaminant previously registered in a private library, based on the sample appearance, shape, or other factors, then search only that private library. If only minimal search information is available about a spectrum, then all libraries can be searched to identify more candidate substances, but if a particular class of substances is suspected, it may be helpful to limit the search to relevant libraries. If more speci�c information is known about the
This article describes spectral search tips for identifying unknown sample spectra involving limiting the range of wavenumbers or libraries included in the search. Spectral data can be analyzed most effectively by taking a variety of approaches based on characteristics of the spectra being analyzed, such as by calculating difference spectra or modifying search methods.
functional group or components involved, then the combination search methods described in a previous article can be used. Furthermore, library and wavenumber limitations can be speci�ed simultaneously and also used in combination with combination search methods.
5. Conclusion
FTIR TALK LETTER Vol. 25 FTIR TALK LETTER Vol. 25 1110

www.shimadzu.com/an/
For Research Use Only. Not for use in diagnostic procedures. This publication may contain references to products that are not available in your country. Please contact us to check the availability of these products in your country.Company names, products/service names and logos used in this publication are trademarks and trade names of Shimadzu Corporation, its subsidiaries or its affiliates, whether or not they are used with trademark symbol “TM” or “®”.Third-party trademarks and trade names may be used in this publication to refer to either the entities or their products/services, whether or not they are used with trademark symbol “TM” or “®”.Shimadzu disclaims any proprietary interest in trademarks and trade names other than its own.
The contents of this publication are provided to you “as is” without warranty of any kind, and are subject to change without notice. Shimadzu does not assume any responsibility or liability for any damage, whether direct or indirect, relating to the use of this publication.
© Shimadzu Corporation, 2016
New Product
UV-VIS-NIR Spect rophotometer
UV-3600 Plus
Large 150 mm Integrat ing Sphere At tachment for UV-3600 P lus Spect rophotometers
ISR-1503/ISR-1503F
UV-3600 Plus System with an ISR-1503 Large 150 mm Integrating Sphere Installed
This extra large 150 mm diameter integrating sphere is used to measure the re�ectance spectra of solid samples, such as powders, paper, or fabrics, or the transmittance spectra of liquid or solid samples.
It enables reliable measurements unaffected by factors such as the surface status of samples and is ideal for colorimetric measurements.
The ISR-1503F is a Spectralon based integrating sphere. Unaffected by moisture absorption, it is capable of high sensitivity measurements in the near infrared region.
A Look Back at Shimadzu Infrared Spectrophotometers—From Birth to Current Day— ------- 02
Automating the Measurement of Spectral Emissivity ------- 06
Tips for Successful Spectrum Searches—Part 2—Limiting the Wavenumber Ranges and Libraries in Searches— ------- 09
ISR-1503/ISR-1503FLarge 150 mm Integrating Sphere Attachment
for UV-3600 Plus Spectrophotometers ------- 12
Vol. 25 TALK LETTER
C103-E101