c.6 sewer flooding - southern water – water and ... · internal dg5 register and to tackle causes...
TRANSCRIPT
Southern WaterFinal Business Plan 2009C.6 Sewer Flooding
C.6 Sewer Flooding
Content:
Executive summary..........................................................................................2
C.6.1 Overview .............................................................................................6
C.6.2 Scheme development and selection, Cost benefit analysis and Prioritisation System............................................................................7
C.6.2.1 Initial screening.....................................................................7C.6.2.2 Scheme Development ..........................................................8C.6.2.3 Cost-benefit Analysis and Prioritisation ................................8C.6.2.4 Final scheme selection .........................................................9
C.6.3 Proposals for AMP5 ..........................................................................11
C.6.3.1 DG5 Internal ‘At Risk’ Register ...........................................11C.6.3.2 DG5 External ‘At Risk’ Register..........................................12
C.6.4 Forecast of Additional Problems........................................................12
C.6.4.1 Internal 2:10/1:10 Register .................................................13C.6.4.2 Internal 1:20 Register .........................................................13C.6.4.3 External Flood Register ......................................................14C.6.4.4 Beyond AMP5.....................................................................15
C.6.5 Design Standards..............................................................................15
C.6.6 Cost Estimates ..................................................................................15
C.6.7 Flood Mitigation.................................................................................16
C.6.8 Integrated Urban Drainage................................................................16
C.6.9 Eastney Pumping Station ..................................................................17
C.6.10 Customer Research ..........................................................................22
C.6.10.1 Use of cost-benefit analysis for flooding schemes..............23
C.6.11 Summary...........................................................................................26
Appendix C6.1Appendix C6.2Appendix C6.3Appendix C6.4 Appendix C.6.5 Appendix C6.6
Southern WaterFinal Business Plan 2009C.6 Sewer Flooding
- 2 -
C.6 Sewer Flooding
Executive summary
Progress in AMP4
• During AMP4 we will invest over to resolve flooding issues.
• We are currently ahead of target to achieve 259 removals from the 2:10 and 1:10 internal registers, and on target to alleviate 402 external flooding problems.
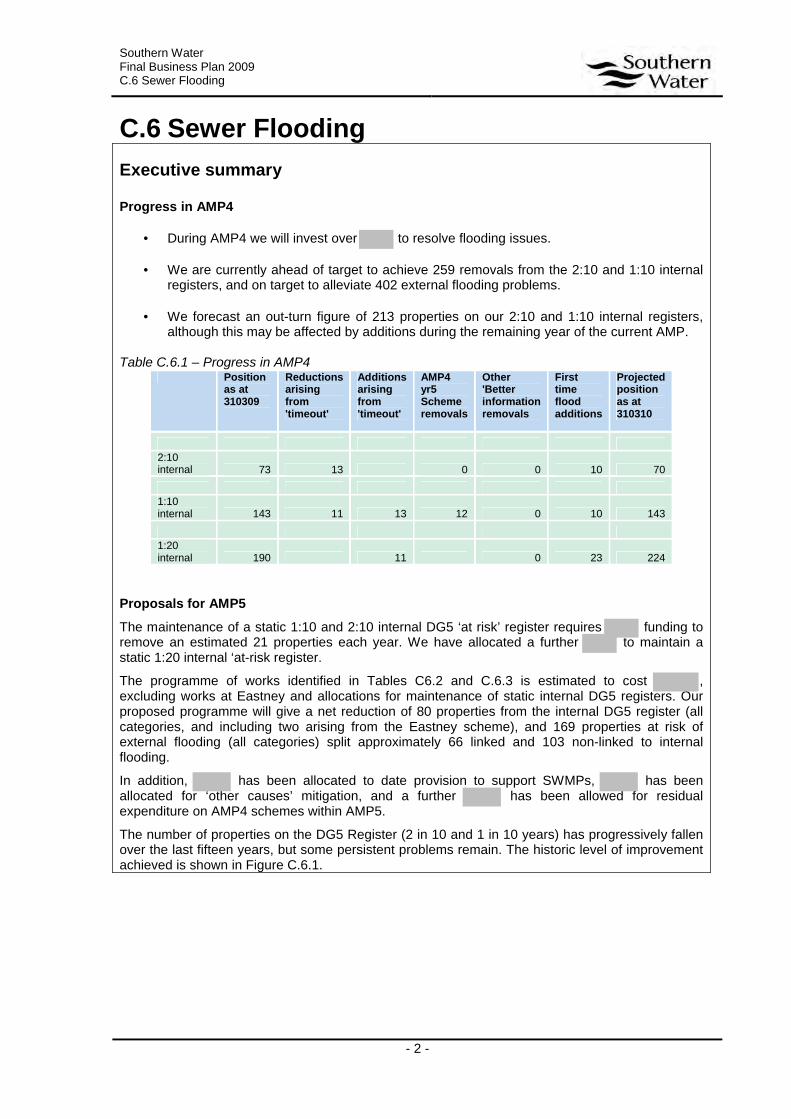
• We forecast an out-turn figure of 213 properties on our 2:10 and 1:10 internal registers, although this may be affected by additions during the remaining year of the current AMP.
Table C.6.1 – Progress in AMP4Position as at 310309
Reductions arising from 'timeout'
Additions arising from 'timeout'
AMP4 yr5Scheme removals
Other 'Better information removals
First time flood additions
Projected position as at 310310
2:10 internal 73 13 0 0 10 70
1:10 internal 143 11 13 12 0 10 143
1:20 internal 190 11 0 23 224
Proposals for AMP5
The maintenance of a static 1:10 and 2:10 internal DG5 ‘at risk’ register requires funding to remove an estimated 21 properties each year. We have allocated a further to maintain a static 1:20 internal ‘at-risk register.
The programme of works identified in Tables C6.2 and C.6.3 is estimated to cost , excluding works at Eastney and allocations for maintenance of static internal DG5 registers. Our proposed programme will give a net reduction of 80 properties from the internal DG5 register (allcategories, and including two arising from the Eastney scheme), and 169 properties at risk of external flooding (all categories) split approximately 66 linked and 103 non-linked to internal flooding.
In addition, has been allocated to date provision to support SWMPs, has been allocated for ‘other causes’ mitigation, and a further has been allowed for residual expenditure on AMP4 schemes within AMP5.
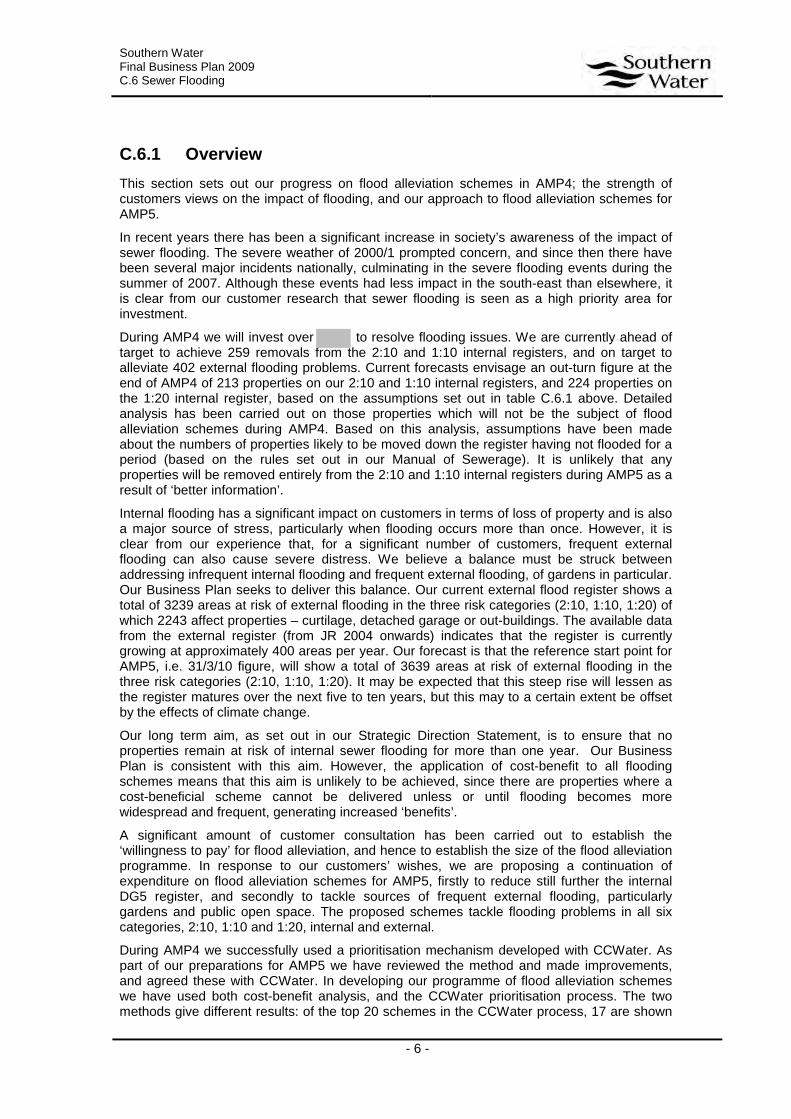
The number of properties on the DG5 Register (2 in 10 and 1 in 10 years) has progressively fallen over the last fifteen years, but some persistent problems remain. The historic level of improvement achieved is shown in Figure C.6.1.

Southern WaterFinal Business Plan 2009C.6 Sewer Flooding
- 3 -
0
100
200
300
400
500
600
700
800
1992
/93
1994
/95
1999
/00
2000
/01
2001
/02
2002
/03
2003
/04
2004
/05
2005
/06
2006
/07
2007
/08
2008
/09
2009
/10
2010
/11
2011
/12
2012
/13
2013
/14
2014
/15
Year
Nu
mb
er
of
pro
pe
rtie
s o
n D
G5
re
gis
ter
Projection
Figure C.6.1 – Number of properties on the DG5 Register (2 in 10 and 1 in 10 years)
Our proposed costs are all based upon engineered solutions and do not include solutions such as the purchasing of the affected properties or filling-in of cellars.
Portsea Island is acknowledged as a very high-risk flood area, and the proposed programme includes major works to the Eastney catchment to reduce the risk of flooding to less than 1:200 year frequency.
The package of schemes covers the wider aspects of flooding and is not solely restricted to removing properties from the internal 2:10/1:10 DG5 ‘at risk’ register. We believe that this approach reflects our customers’ wishes, and that the overall programme cost is within the increase in water charges that our customers are prepared to support.
We believe that there is sufficient customer support both from the national research and from our own Focus Groups to justify the proposed programme of works. Our scheme prioritisation system has the support of CCWater and our proposed programme is cost beneficial.
Table C.6.2 – Internal DG5 registerProjected position as at 31/03/10
Potential 'timeout removals during AMP5
Potential 'timeout' additions during AMP5
Scheme removals during AMP5
Other 'Better information removals during AMP5
First time flood additions
Maintain DG5 reductions'
Projected position as at 31/03/15
2:10 internal 70 1 23 0 50 50 46
1:10 internal 143 3 1 33 0 55 55 108
1:20 internal 224 3 24 0 115 115 203
TOTALS 437 80 220 220 357

Southern WaterFinal Business Plan 2009C.6 Sewer Flooding
- 4 -
Table C.6.3 – External DG5 registerProjected position
as at 310310
Scheme removals
during AMP5
First time flood
additions
Projected position
as at 310315
2:10 external 649 71 250 828
1:10 external 224 5 250 469
1:20 external 2766 93 1000 3673
TOTALS 3639 169 1500 4970
• Our long term aim stated in our SDS is to ensure that no properties remain at risk of internal sewer flooding for more than one year.
• In response to customer consultation to establish ‘willingness to pay’ we propose tocontinue expenditure on flood alleviation schemes for AMP5 to further reduce the internal DG5 register and to tackle causes of frequent external flooding.
• Mitigation measures to reduce the impact of flooding will be offered to customers where we cannot deliver cost-beneficial flood alleviation schemes.
• Flooding due to other causes will be mitigated through operational activity, mechanical/electrical improvements and sewer rehabilitation measures. However, a small number of properties will remain at risk of chronic, repeated ‘other causes’ flooding regardless of the level of operational effort applied. In such cases where increased maintenance is uneconomic or unachievable we propose to offer mitigation measures as a means of preventing otherwise unavoidable repeat flooding.
• We have worked with CCWater to improve the prioritisation process
Enhancements for the final submission
• Detailed analysis has been completed on those properties which will not be the subject of flood alleviation schemes during AMP4. We have identified those properties which have not flooded internally in recent years, and which may therefore move to a lower risk category during AMP5 if no further flooding occurs. An estimate of likely movement between registers is included in the table above.
• From this analysis we think it is highly unlikely that any further properties will be removed completely from the 2:10 or 1:10 internal registers as a result of better information during AMP5.
• We have completed our work on automating the external flood register (moving from the manual system used to date). This has resulted in the restating of JR08 reported numbers. We are confident that the new process will deliver a stable mechanism for analysing and reporting properties/areas at risk from external flooding.
Southern WaterFinal Business Plan 2009C.6 Sewer Flooding
- 5 -
• We have completed work on automating the data collation process from our Sewer Incident Report Form system (SIRF). This has enabled us to identify properties at risk associated with a scheme, and to automatically collate all incident reports for use in the CCW prioritisation system and the cost-benefit analysis. This system is updated on a monthly basis, and will be kept live during AMP5. It is an integral part of the Area Asset Plan (AAP) described more fully in Appendix C6.1.
• We have revised our cost-benefit calculations as referred to in section C.6.10.
• We have listed all the schemes proposed for AMP5 together with their outputs (numbers of at-risk properties and addresses). We have included a number of schemes with a benefit/cost ratio of less than one, as discussed at the Southern Water/Ofwat meeting on 10
thFebruary 2009. We have included additional supporting information for these
schemes, in appendix C6.2 Additional, more detailed, information is available on these or any other schemes.
• All proposed schemes have been subject to detailed hydraulic modelling, and an assessment of practical buildability. All schemes have been subject to detail costing. The full list of 211 schemes considered for inclusion is given in Appendix C.6.6.
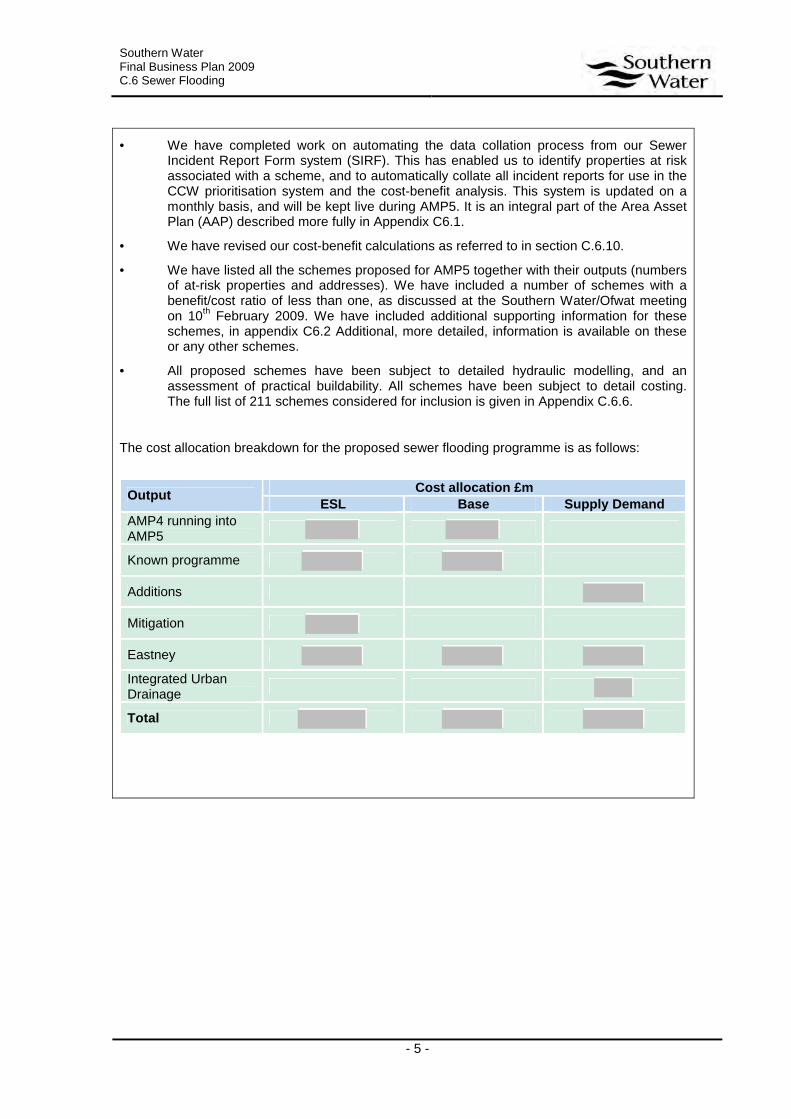
The cost allocation breakdown for the proposed sewer flooding programme is as follows:
Cost allocation £mOutput
ESL Base Supply Demand
AMP4 running into AMP5
Known programme
Additions
Mitigation
Eastney
Integrated Urban Drainage
Total
Southern WaterFinal Business Plan 2009C.6 Sewer Flooding
- 6 -
C.6.1 Overview
This section sets out our progress on flood alleviation schemes in AMP4; the strength of customers views on the impact of flooding, and our approach to flood alleviation schemes for AMP5.
In recent years there has been a significant increase in society’s awareness of the impact of sewer flooding. The severe weather of 2000/1 prompted concern, and since then there have been several major incidents nationally, culminating in the severe flooding events during the summer of 2007. Although these events had less impact in the south-east than elsewhere, it is clear from our customer research that sewer flooding is seen as a high priority area for investment.
During AMP4 we will invest over to resolve flooding issues. We are currently ahead of target to achieve 259 removals from the 2:10 and 1:10 internal registers, and on target to alleviate 402 external flooding problems. Current forecasts envisage an out-turn figure at the end of AMP4 of 213 properties on our 2:10 and 1:10 internal registers, and 224 properties on the 1:20 internal register, based on the assumptions set out in table C.6.1 above. Detailed analysis has been carried out on those properties which will not be the subject of flood alleviation schemes during AMP4. Based on this analysis, assumptions have been made about the numbers of properties likely to be moved down the register having not flooded for a period (based on the rules set out in our Manual of Sewerage). It is unlikely that any properties will be removed entirely from the 2:10 and 1:10 internal registers during AMP5 as a result of ‘better information’.
Internal flooding has a significant impact on customers in terms of loss of property and is also a major source of stress, particularly when flooding occurs more than once. However, it is clear from our experience that, for a significant number of customers, frequent external flooding can also cause severe distress. We believe a balance must be struck between addressing infrequent internal flooding and frequent external flooding, of gardens in particular. Our Business Plan seeks to deliver this balance. Our current external flood register shows a total of 3239 areas at risk of external flooding in the three risk categories (2:10, 1:10, 1:20) of which 2243 affect properties – curtilage, detached garage or out-buildings. The available data from the external register (from JR 2004 onwards) indicates that the register is currently growing at approximately 400 areas per year. Our forecast is that the reference start point for AMP5, i.e. 31/3/10 figure, will show a total of 3639 areas at risk of external flooding in the three risk categories (2:10, 1:10, 1:20). It may be expected that this steep rise will lessen as the register matures over the next five to ten years, but this may to a certain extent be offset by the effects of climate change.
Our long term aim, as set out in our Strategic Direction Statement, is to ensure that no properties remain at risk of internal sewer flooding for more than one year. Our Business Plan is consistent with this aim. However, the application of cost-benefit to all flooding schemes means that this aim is unlikely to be achieved, since there are properties where a cost-beneficial scheme cannot be delivered unless or until flooding becomes more widespread and frequent, generating increased ‘benefits’.
A significant amount of customer consultation has been carried out to establish the ‘willingness to pay’ for flood alleviation, and hence to establish the size of the flood alleviation programme. In response to our customers’ wishes, we are proposing a continuation ofexpenditure on flood alleviation schemes for AMP5, firstly to reduce still further the internal DG5 register, and secondly to tackle sources of frequent external flooding, particularly gardens and public open space. The proposed schemes tackle flooding problems in all sixcategories, 2:10, 1:10 and 1:20, internal and external.
During AMP4 we successfully used a prioritisation mechanism developed with CCWater. As part of our preparations for AMP5 we have reviewed the method and made improvements, and agreed these with CCWater. In developing our programme of flood alleviation schemes we have used both cost-benefit analysis, and the CCWater prioritisation process. The two methods give different results: of the top 20 schemes in the CCWater process, 17 are shown
Southern WaterFinal Business Plan 2009C.6 Sewer Flooding
- 7 -
as not cost-beneficial. The principal reason for this is the different relative weightings between internal and external flooding in the two systems. The CCWater method gives a relatively higher weighting to external flooding than C-B analysis.
We have made significant progress in reducing the numbers of properties at risk from internal flooding during AMP4, and propose further reductions in AMP5. The external register however continues to grow, and it is evident from complaints received about external flooding that this can be the cause of great stress for those affected (particularly when relatively frequent) but this does not appear to be reflected in the ‘willingness to pay’ data collected for CBA. For CBA, the relative ratio of internal to external is about 12:1. In other words a property would have to flood externally every month to generate the same value of ‘benefits’ as a property which floods internally once a year.
Schemes for both internal and external flood alleviation will aim at a minimum design target of once in 30 year flood frequency. In a small number of cases it may be uneconomic, or impractical to provide a solution to this standard. It seems unreasonable to deny a customer an improvement in flood risk where the full 30 year design standard cannot be met. A small number of schemes may therefore be implemented to a lower standard, to reduce flood frequency to less than once in ten years although not meeting the standard of less than once in thirty years.
Where we cannot deliver flood alleviation schemes within AMP5 because of issues of either funding or practicality, we will consider mitigation measures, so that the impact of flooding can be reduced. In these circumstances properties/ areas will remain on the at-risk register. We envisage that mitigation will be offered to customers with properties on the at-risk register (all categories) and also to customers flooded internally more than once as a result of severe weather.
In addition to resolving flooding caused by hydraulic overload, we will also be seeking to reduce flooding due to chronic other causes. This will be tackled primarily through operational activity, mechanical/electrical improvements and sewer rehabilitation measures. However, a small number of properties will remain at risk of chronic, repeated ‘other causes’ flooding regardless of the level of operational effort applied. In such cases where increased maintenance is uneconomic or unachievable we propose to offer mitigation measures as a means of preventing otherwise unavoidable repeat flooding.
During the course of the production of our Business Plan we have been working with CCWater to improve the prioritisation process used in AMP4, and to ensure that we have their full support for the flooding programme.
C.6.2 Scheme development and selection, Cost benefit analysis and Prioritisation System
This section sets out the process we have used to develop and select schemes for inclusion in AMP5, using cost-benefit analysis and the CCWater prioritisation methodology.
C.6.2.1 Initial screening
We have a comprehensive database of known flooding problems (both internal and external) and their flood history. We also have good coverage of models and DAPs to enable solutions to be developed for each known problem. Whilst outline solutions have previously been developed for most internal flooding problems, the larger number of external flood problems has to date meant that a similar strategy for external flooding problems has not been viable.
To arrive at a balanced programme for AMP5 flooding schemes, including both internal and external problems, we applied a screening process to identify areas with significant flood problems (in terms of numbers of flooded properties/areas and frequency). Our region was sub-divided into catchment areas of no greater than 1000 population per area. We then applied the CCWater priority formula from AMP4 to each area using data held in the sewer incident reports database. The problem areas were then ordered by nuisance score and reviewed with County Engineers and Operations staff to ensure that the priority areas from
Southern WaterFinal Business Plan 2009C.6 Sewer Flooding
- 8 -
the automated process matched Operations’ perception of problem hierarchy, and adjustments were made where necessary.
Of the areas identified through this screening process, we selected approximately 200 for further detailed analysis. These areas were grouped by catchment so that analysis could be undertaken in an efficient and sustainable manner. For example all problems in the Brighton and Hove catchment were assessed together so that the interaction of one scheme on another could be determined. Our existing suite of hydraulic models was used to either review existing flood alleviation schemes or to develop new proposals.
Each scheme has been subject to detailed modelling, to explore available options. Models have been run with known development, and an uplift of 20% in storm intensity to allow for climate change.
The screened list contains all properties which were on the DG5 internal register at the time of the analysis and which are likely to remain on the register at the end of the AMP4 period. Properties which flooded more than twelve years ago, but which have not flooded since, have been excluded on the assumption that they are likely to be moved to the 1:20 register within the AMP4 period.
In preparation for the Final Business Plan, the list of schemes has been reviewed, and a small number of schemes added for analysis. The resulting list of 211 schemes was tabulated with known drivers (type of flooding, frequency etc) and cost. The full list of schemes is given in Appendix C.6.6.
For the Final Business Plan, the process of collating and analysing data for use in cost-benefit analysis and scheme prioritisation has been fully automated using the ‘Area Asset Plan’ (AAP) developed in conjunction with Atkins. This process is more fully described in Appendix C6.1.
C.6.2.2 Scheme Development
Each of the 211 schemes has been subject to detailed modelling and optioneering to develop one or more solutions. Site visits have been undertaken to establish the practicality of the selected option, and other utilities records (particularly water and gas) have been reviewed as part of this process. Other construction risks have been identified and assessed.
All schemes have been costed to a level of detail using standard cost curves. All data is recorded using our standard Scheme Definition Form.
The process has resulted in a programme of 211 costed schemes, from which the AMP5 programme has been selected.
C.6.2.3 Cost-benefit Analysis and Prioritisation
The principal tool for selection of schemes for AMP5 has been cost-benefit analysis. Detailed customer research has been carried out to determine customers’ willingness to pay for flood alleviation schemes as summarised in section C.6.10 below. The values obtained from the research were applied to the screened list of schemes both at programme level and individual scheme level.
Using a minimum benefit-cost ratio of 0.8 results in a programme of:
• 32 schemes with a value of • 44 ‘company action’ removals from the 2:10 and 1:10 internal registers• 13 ‘company action’ removals from the 1:20 internal register• 37 ‘company action’ removals from the external register
Whilst this makes significant inroads into the numbers remaining on the internal at-risk register, it does not provide a balanced programme to continue with our programme of tackling external flooding.
Southern WaterFinal Business Plan 2009C.6 Sewer Flooding
- 9 -
There are several reasons for including schemes which appear to be non-cost-beneficial:
• Those on the margins of being cost-beneficial
• Problems with high political and public interest, where for example councils have expressed concern over the severity or frequency of flooding
• Relatively infrequent but wide area external flooding
• Apparent under reporting of flooding incidents (often associated with the points above)
• Previous promises given to customers
• High on CCWater priority listing (primarily external flooding)
The final programme includes all schemes shown to be cost-beneficial as well as a number which are not cost-beneficial, as described in more detail in section C.6.3 below. The results show that at programme level (ie transferring benefits from high benefit/cost schemes to lower benefit/cost schemes) our proposed programme has total benefits greater than total costs.
In addition to the customer research that has been used to calculate willingness to pay and to inform the cost benefit analysis, we have sought the opinion of those directly affected by flooding. The responses from the customers, councillors and Members of Parliament are in overwhelming support of our proposed flood programme. Copy of the letters received are included in the supporting information to the Business Plan.
C.6.2.4 Final scheme selection
Whilst it is important that the overall programme has to deliver the best level of improvement for the least cost, it should not be the case that some customers are left without any resolution to their flooding problem solely on the grounds of costs. A balance has therefore to be struck between nuisance value, and cost-benefit, which we believe is achieved by the process described above. CCWater supports this approach.
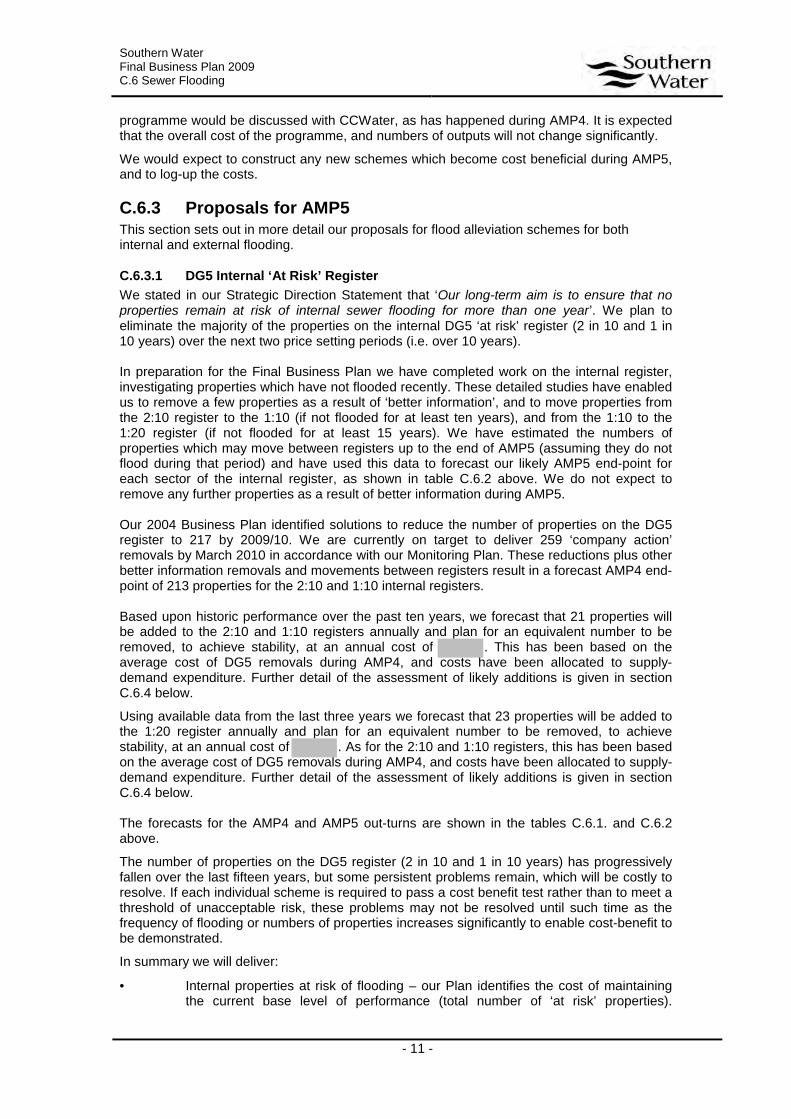
For the final programme 26 schemes have been included which have a benefit/cost ratio of less than 1. They are:
Scheme ref Scheme title

Southern WaterFinal Business Plan 2009C.6 Sewer Flooding
- 10 -
Six of these have a benefit cost ratio of between 0.8 and 1:
Scheme ref Scheme title
Detailed explanations and supporting evidence for the remaining 20 schemes is given in Appendix C6.2.
This results in a programme of:
• 52 schemes with a value of (excluding the Eastney schemes)• 54 ‘company action’ removals from the 2:10 and 1:10 internal registers (excluding two
removals as a result of the Eastney schemes)• 24 ‘company action’ removals from the 1:20 internal register• 169 ‘company action’ removals from the external register• 3 schemes driven primarily by pollution as a result of hydraulic overload. These
schemes have a positive benefit-cost ratio.
Scheme ref Scheme title
At programme level our research shows that customers are willing to pay for the service level improvements proposed.
It is inevitable that further flooding will occur between the Final Business Plan submission, and the end of AMP5, affecting both new and existing properties/areas. We intend to keep the cost-benefit analysis and prioritisation mechanisms ‘live’ during AMP5, so that new flooding incidents can be recorded, and priorities reassessed. This may result in changes to the programme of schemes ultimately delivered (deferring some, and substituting others). We anticipate that the number of schemes affected by such new information will be relatively small and that the changes to the proposed programme will be limited. Any changes to the
Southern WaterFinal Business Plan 2009C.6 Sewer Flooding
- 11 -
programme would be discussed with CCWater, as has happened during AMP4. It is expected that the overall cost of the programme, and numbers of outputs will not change significantly.
We would expect to construct any new schemes which become cost beneficial during AMP5, and to log-up the costs.
C.6.3 Proposals for AMP5This section sets out in more detail our proposals for flood alleviation schemes for both internal and external flooding.
C.6.3.1 DG5 Internal ‘At Risk’ Register
We stated in our Strategic Direction Statement that ‘Our long-term aim is to ensure that no properties remain at risk of internal sewer flooding for more than one year’. We plan to eliminate the majority of the properties on the internal DG5 ‘at risk’ register (2 in 10 and 1 in 10 years) over the next two price setting periods (i.e. over 10 years).
In preparation for the Final Business Plan we have completed work on the internal register, investigating properties which have not flooded recently. These detailed studies have enabled us to remove a few properties as a result of ‘better information’, and to move properties from the 2:10 register to the 1:10 (if not flooded for at least ten years), and from the 1:10 to the 1:20 register (if not flooded for at least 15 years). We have estimated the numbers of properties which may move between registers up to the end of AMP5 (assuming they do not flood during that period) and have used this data to forecast our likely AMP5 end-point for each sector of the internal register, as shown in table C.6.2 above. We do not expect to remove any further properties as a result of better information during AMP5.
Our 2004 Business Plan identified solutions to reduce the number of properties on the DG5 register to 217 by 2009/10. We are currently on target to deliver 259 ‘company action’ removals by March 2010 in accordance with our Monitoring Plan. These reductions plus other better information removals and movements between registers result in a forecast AMP4 end-point of 213 properties for the 2:10 and 1:10 internal registers.
Based upon historic performance over the past ten years, we forecast that 21 properties will be added to the 2:10 and 1:10 registers annually and plan for an equivalent number to be removed, to achieve stability, at an annual cost of . This has been based on the average cost of DG5 removals during AMP4, and costs have been allocated to supply-demand expenditure. Further detail of the assessment of likely additions is given in section C.6.4 below.
Using available data from the last three years we forecast that 23 properties will be added to the 1:20 register annually and plan for an equivalent number to be removed, to achieve stability, at an annual cost of . As for the 2:10 and 1:10 registers, this has been based on the average cost of DG5 removals during AMP4, and costs have been allocated to supply-demand expenditure. Further detail of the assessment of likely additions is given in section C.6.4 below.
The forecasts for the AMP4 and AMP5 out-turns are shown in the tables C.6.1. and C.6.2 above.
The number of properties on the DG5 register (2 in 10 and 1 in 10 years) has progressively fallen over the last fifteen years, but some persistent problems remain, which will be costly to resolve. If each individual scheme is required to pass a cost benefit test rather than to meet a threshold of unacceptable risk, these problems may not be resolved until such time as the frequency of flooding or numbers of properties increases significantly to enable cost-benefit to be demonstrated.
In summary we will deliver:
• Internal properties at risk of flooding – our Plan identifies the cost of maintaining the current base level of performance (total number of ‘at risk’ properties).

Southern WaterFinal Business Plan 2009C.6 Sewer Flooding
- 12 -
Additional funding will reduce the number of properties on the internal risk register, all categories, by 80 (23 no. 2:10; 33 no..1:10 and 24 no. 1:20, including two properties removed as a result of the Eastney schemes) by 2014/15, managed through a uniform profile of improvements. The removal of 23 properties in the most severe risk category would cut the residual properties on the 2 in 10 register to around 46 properties, many of which have mitigation measures applied, and which have not flooded for several years.
Our proposed programme of work will deal with properties where the cost is estimated to be up to per property (excluding schemes driven by pollution). The average cost per problem for the proposed programme is (again excluding pollution schemes), compared with an average cost of approximately per problem for AMP4 schemes. The increase in average cost/problem between AMP4 and AMP5 is to be expected, given that the most economic solutions have been completed during AMP4.
For those properties that will remain on the list we will continue with our customer care package, offering assistance should flooding occur. We will also continue with our policy of utilising interim solutions such as the installation of non-return valves where the hydraulics of the sewerage system allow.
Properties once on the ‘at risk’ registers are only removed if,
• They are proved not to be at risk by the collation of better information; or
• There has been investment in a permanent solution.
We do not remove properties from the DG5 register following the installation of mitigation measures, neither will we completely remove properties from the register that have not flooded for a number of years (timed out). However, we will move properties from the 2:10 to the 1:10 register after 10 years, or from the 1:10 to the 1:20 register after 15 years, in line with our current policy.
C.6.3.2 DG5 External ‘At Risk’ Register
We believe that internal DG5 improvements, although valuable, do not cover a wide enough spectrum of persistent customer flooding problems. Very significant customer service improvement will be achieved by addressing garden, garage and curtilage flooding, restricted toilet use and other more widespread flooding impacts. These issues are often faced repeatedly by customers and only tackling internal DG5 at risk properties would lead to considerable dissatisfaction.
To start to address this issue, we took a pro-active stance to this issue in the AMP3 period, and have continued this through AMP4 with a target to resolve 402 external flooding problemsover the five year period.
We anticipate that the proposed sewer flooding programme will alleviate flooding in 169external areas (curtilage, public open space, highways) split approximately 66 linked to internal flooding schemes, and 103 not linked.
• External properties at risk of flooding – Additional funding will remove 169areas/properties from the external risk register (71 no. 2:10; 5 no. 1:10 and 93 no. 1:20) by 2014/15, managed through a uniform profile of improvements.
C.6.4 Forecast of Additional Problems
The number of properties added to the registers in a given year is very sensitive to rainfall distribution and intensity, particularly short duration summer storms in urban catchments or longer duration winter events with high ground water levels in rural catchments. It is difficult to determine, with any degree of accuracy, the number of properties that may be added to the list in any one year. The future prediction is therefore based upon an assessment of historic trends.
Southern WaterFinal Business Plan 2009C.6 Sewer Flooding
- 13 -
C.6.4.1 Internal 2:10/1:10 Register
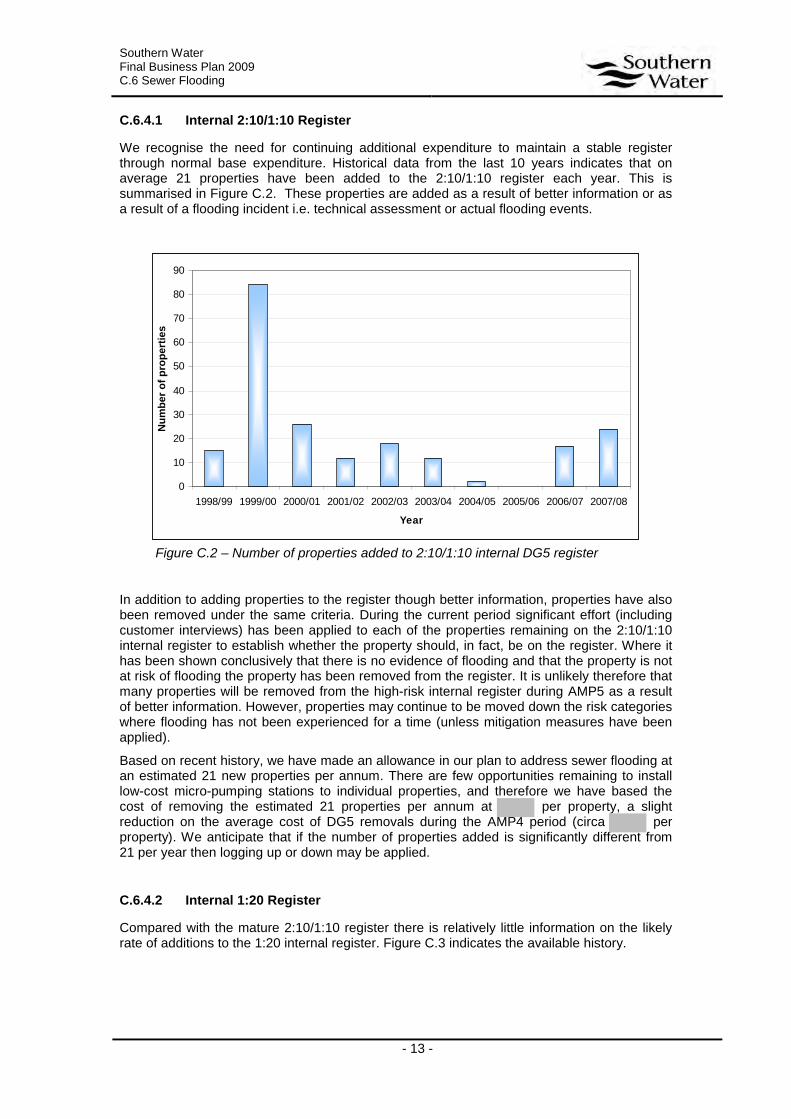
We recognise the need for continuing additional expenditure to maintain a stable register through normal base expenditure. Historical data from the last 10 years indicates that on average 21 properties have been added to the 2:10/1:10 register each year. This is summarised in Figure C.2. These properties are added as a result of better information or as a result of a flooding incident i.e. technical assessment or actual flooding events.
0
10
20
30
40
50
60
70
80
90
1998/99 1999/00 2000/01 2001/02 2002/03 2003/04 2004/05 2005/06 2006/07 2007/08
Year
Nu
mb
er
of
pro
pert
ies
Figure C.2 – Number of properties added to 2:10/1:10 internal DG5 register
In addition to adding properties to the register though better information, properties have also been removed under the same criteria. During the current period significant effort (including customer interviews) has been applied to each of the properties remaining on the 2:10/1:10 internal register to establish whether the property should, in fact, be on the register. Where it has been shown conclusively that there is no evidence of flooding and that the property is not at risk of flooding the property has been removed from the register. It is unlikely therefore that many properties will be removed from the high-risk internal register during AMP5 as a result of better information. However, properties may continue to be moved down the risk categories where flooding has not been experienced for a time (unless mitigation measures have been applied).
Based on recent history, we have made an allowance in our plan to address sewer flooding at an estimated 21 new properties per annum. There are few opportunities remaining to install low-cost micro-pumping stations to individual properties, and therefore we have based the cost of removing the estimated 21 properties per annum at per property, a slight reduction on the average cost of DG5 removals during the AMP4 period (circa per property). We anticipate that if the number of properties added is significantly different from 21 per year then logging up or down may be applied.
C.6.4.2 Internal 1:20 Register
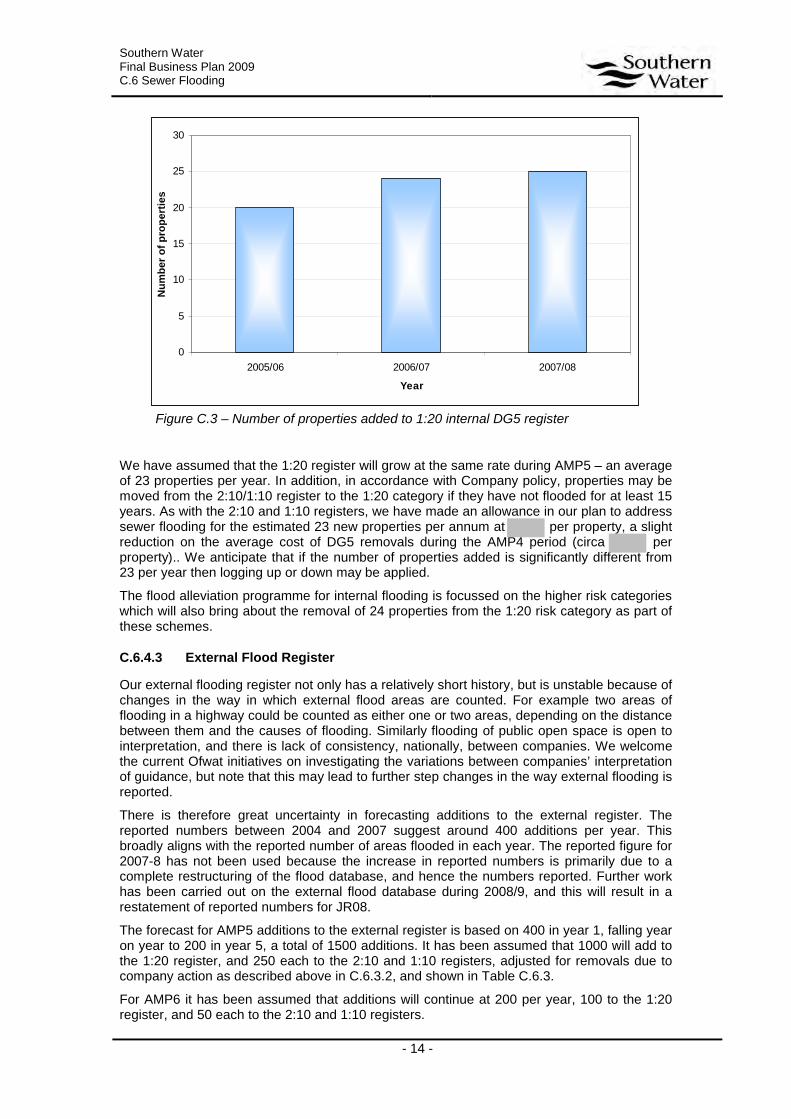
Compared with the mature 2:10/1:10 register there is relatively little information on the likely rate of additions to the 1:20 internal register. Figure C.3 indicates the available history.
Southern WaterFinal Business Plan 2009C.6 Sewer Flooding
- 14 -
0
5
10
15
20
25
30
2005/06 2006/07 2007/08
Year
Nu
mb
er
of
pro
pert
ies
Figure C.3 – Number of properties added to 1:20 internal DG5 register
We have assumed that the 1:20 register will grow at the same rate during AMP5 – an average of 23 properties per year. In addition, in accordance with Company policy, properties may be moved from the 2:10/1:10 register to the 1:20 category if they have not flooded for at least 15years. As with the 2:10 and 1:10 registers, we have made an allowance in our plan to address sewer flooding for the estimated 23 new properties per annum at per property, a slight reduction on the average cost of DG5 removals during the AMP4 period (circa per property).. We anticipate that if the number of properties added is significantly different from 23 per year then logging up or down may be applied.
The flood alleviation programme for internal flooding is focussed on the higher risk categorieswhich will also bring about the removal of 24 properties from the 1:20 risk category as part ofthese schemes.
C.6.4.3 External Flood Register
Our external flooding register not only has a relatively short history, but is unstable because of changes in the way in which external flood areas are counted. For example two areas of flooding in a highway could be counted as either one or two areas, depending on the distance between them and the causes of flooding. Similarly flooding of public open space is open to interpretation, and there is lack of consistency, nationally, between companies. We welcome the current Ofwat initiatives on investigating the variations between companies’ interpretation of guidance, but note that this may lead to further step changes in the way external flooding is reported.
There is therefore great uncertainty in forecasting additions to the external register. The reported numbers between 2004 and 2007 suggest around 400 additions per year. Thisbroadly aligns with the reported number of areas flooded in each year. The reported figure for 2007-8 has not been used because the increase in reported numbers is primarily due to a complete restructuring of the flood database, and hence the numbers reported. Further work has been carried out on the external flood database during 2008/9, and this will result in a restatement of reported numbers for JR08.
The forecast for AMP5 additions to the external register is based on 400 in year 1, falling year on year to 200 in year 5, a total of 1500 additions. It has been assumed that 1000 will add to the 1:20 register, and 250 each to the 2:10 and 1:10 registers, adjusted for removals due to company action as described above in C.6.3.2, and shown in Table C.6.3.
For AMP6 it has been assumed that additions will continue at 200 per year, 100 to the 1:20 register, and 50 each to the 2:10 and 1:10 registers.
Southern WaterFinal Business Plan 2009C.6 Sewer Flooding
- 15 -
C.6.4.4 Beyond AMP5
The Government’s planning strategy to significantly increase the population in the South East, (see Part B1 for detail), will place significant additional demands upon the existing sewerage system over the next two decades at least. The details within the Supply/Demand section (Part C4) highlight the interventions required to accommodate this growth. We consider it essential that Ofwat allows adequate funding to address this issue, in order to prevent growth causing an increase in flooding problems.
We recognise that it will take several AMP periods to address all flooding problems and some flooding problems may never be resolved due to the disproportionate costs of resolution. For those flooding problems that remain, we will continue to lessen the impact to customers by our swift response to such problems, and other material assistance. Our long term aim, as stated in our SDS, is that no properties remain at risk of internal flooding for more than one year.
Most of the residual internal 2:10 and a number of the 1:10 DG5 properties have identified solutions and could be implemented, depending on funding availability. Some of the external flooding problems have identified solutions, but many do not. During AMP5 we will endeavour to use the DAP process to identify solutions for all properties remaining on the internal register (all categories) as well as the more serious external problems, with a view to continuing with the flood programme through AMP6 and beyond.
C.6.5 Design Standards
All schemes included in our Business Plan have been subject to hydraulic modelling to develop a solution to reduce flood risk to a 1:30 year standard as a minimum. Broadly practical schemes have been developed based on an initial assessment of other utilities’ services, planning requirements, highway authority conditions etc. Such considerations may change prior to scheme implementation leading to changes in the scheme design during the detailed design process during AMP5.
To accommodate climate change, rainfall profiles have been uplifted by 20% in accordancewith current Defra guidance. UKWIR is currently undertaking research into the use of rainfall profiles for sewer design, using the results for UKCIP09 Climate Change Model, and the associated weather generator. The timing of the UKCIP09 output means that the research isnot available in time for the Final Business Plan. However, all schemes will be reappraised, and subject to more detailed modelling, prior to implementation, and will take account of the results of the research.
C.6.6 Cost Estimates
The cost estimate associated with each scheme is based upon an engineered solution, normally sewer upsizing, in line storage, off line storage or increased pass forward rates of in-line pumping stations. We have not considered the option of purchasing the properties affected by flooding.
We have not considered solutions involving retrofitting of sustainable urban drainage systems (SuDS), due to the uncertainties, such as long term maintenance, land availability and continued ownership. However, we anticipate that new development will be designed to minimise surface water inflow to sewers. We strongly support the proposed amendments to S106 of the Water Industry Act, which will give companies greater control over the disposal of surface water on new development sites.
The cost estimates are, in the main, based upon solutions identified in DAPs, with additional, more detailed, modelling to include key factors such as climate change uplift. A review of practicality and buildability has also been carried out by specialist consultants. Costs associated with the solutions have been derived by a consortium of specialist design engineers, construction engineers and cost estimators. This has allowed the cost for the schemes to be individually estimated with due recognition of the risks involved in construction.
Southern WaterFinal Business Plan 2009C.6 Sewer Flooding
- 16 -
Operational costs arising from our capital investment in flood alleviation schemes have been calculated using a detailed opex model for each scheme. The total additional opex cost by the end of the AMP5 period is calculated to be
C.6.7 Flood Mitigation
Where we cannot deliver flood alleviation schemes within AMP5 because of issues of either funding or practicality, we will consider mitigation measures, so that the impact of flooding can be reduced. A variety of flood mitigation schemes have been delivered during AMP4 including the installation of non-return valves on lateral connections; the installation of watertight flood barriers and flow diversion channels. In these circumstances properties/ areas will remain on the at-risk register. We envisage that mitigation will be offered to customers with properties on the at-risk register (all categories) and also to customers flooded internally more than once as a result of severe weather.
The average costs for mitigation measures (internal and external) during AMP4 areapproximately per property mitigated. This figure has been used for the AMP5 mitigation programme. Our programme includes 300 properties mitigated (200 internals and 100 externals) at a total cost of , allocated to ESL.
In addition to resolving flooding caused by hydraulic overload, we will also be seeking to reduce flooding due to chronic other causes. This will be tackled primarily through operational activity, mechanical/electrical improvements and sewer rehabilitation measures. However, a small number of properties will remain at risk of chronic, repeated ‘other causes’ flooding regardless of the level of operational effort applied. In such cases where increased maintenance is uneconomic or unachievable we propose to offer mitigation measures as a means of preventing otherwise unavoidable repeat flooding. The programme includes 200 properties mitigated at a total cost of , allocated to ESL. Because these mitigation measures do not relate to hydraulic overload, they are not included in table B6.5 Sewer flooding output projections.
C.6.8 Integrated Urban Drainage
With the publication of the Pitt Review, and the Government’s response it is clear that the majority of effort on the production of Surface Water Management Plans will fall to the upper tier and unitary authorities. However, it is equally clear that WaSCs will be expected to contribute significantly to the SWMPs.
For the purposes of AMP5 we have assumed that the focus for local authorities will be the production of SWMPs rather than specific engineering schemes to resolve flooding. We have therefore included only items relating modelling of flood risk, and provision of data to LAs in our plan. We have not included any engineering schemes driven by the output from SWMPs.
The majority of connected properties are covered by hydraulic models. These have been regularly updated and improved as required for modelling of flood schemes, and new development.
However, these models represent only the underground piped systems. They are capable of predicting the location of discharge points, and the volumes of flood water for the modelled rainfall events. The current suite of models does not include any above ground features or topography, and cannot therefore predict above ground flow paths and the consequential flood risk.
Recent advances in software and data availability (particularly LiDAR data) mean that fully integrated above and below-ground modelling is now becoming possible. This is a major step forward, and will contribute significantly to the understanding of flood mechanisms, and the underlying causes of flooding. It will be particularly helpful in the context of Surface Water Management Plans, since it will enable modelling of all aspects of urban drainage, including highway drainage and land drainage.
Southern WaterFinal Business Plan 2009C.6 Sewer Flooding
- 17 -
The ability to model overland flow paths will therefore enable complex causes of flooding (where multiple agencies have responsibility for drainage) to be disentangled, allowing proper allocation of expenditure to relieve flooding.
C.6.9 Eastney Pumping Station
This section is an overview of our proposals for works in the Eastney catchment. Further detail is provided appendix C6.3. The full suite of reports compiled by our consultant is available, and has been seen by our Reporter.
Eastney Pumping Station acts as the sewerage pumping station for the whole of the Portsmouth peninsula, a population of approximately 200,000. The sewerage network is almost wholly combined, and virtually all flows gravitate towards the pumping station and are either pumped to Budds Farm for treatment, or under storm conditions to sea. There is no gravity outlet, due to the low lying nature of the catchment. If, for any reason, these storm flows cannot be pumped to sea the resultant flooding impact back in the catchment is inevitable.
If the pumping station is beaten (because of either severe weather, or mechanical/electrical breakdown) the flooding is likely to be significant (potentially several hundred houses), and for this reason the pumping station needs to be designed for a lower probability of failure than usual. This applies both to available standby facilities and capability for dealing with less frequent rainfall events (up to at least 1:200 Level of Service).
The proposed schemes for Eastney in AMP5 are split into the three elements below. The Strategic CSO achieves the stated 1:200 year level of service, whilst the surface water separation schemes and Fort Cumberland enhancements provide capacity for new development and climate change impacts without compromising this enhanced level of protection. Further detail on each element is provided herein and in Appendix C.6.3.:
• Provision of a Strategic CSO to reduce peak flows arriving at the terminal pumping station and providing significant reduction in flood risk -
• Enhancement of screen handling at Fort Cumberland storage facility plus an early severe weather warning system -
• Surface water separation schemes to reduce peak flows arriving at the terminal pumping station and to make capacity available within the catchment for planned new development. -
Due to the current risk of catastrophic flooding and lessons learned nationally as a result of the floods of 2007 which culminated in the Pitt Review, our AMP5 proposals have the full support from the EA. A letter from the EA in support of our proposals is included as Appendix C.6.4. Whist this letter provides support for our proposals, it is clear that the agency expect all three elements to be implemented as a package, with the implication that the discharge consent determination for the Strategic CSO may be dependent on delivery of the other elements (CSO improvements and surface water separation).
Letters of support from Portsmouth City Council are included in Appendix C.6.5
The PR04 Business Plan proposed three complementary components, in order of priority, for improving the resilience of this asset:
a) AMP4 - The construction of an additional duty/standby pumping station. This will come into operation at times of peak and/or partial standby to the existing station. This new pumping station could be constructed a few hundred yards from the existing one at Eastney.

Southern WaterFinal Business Plan 2009C.6 Sewer Flooding
- 18 -
b) AMP5 - The reduction of storm flows arriving at Eastney by the separation of part of thecatchment into separate surface water and foul systems. This would be undertaken in the Southsea/Morass sewer area. A surface water pumping station with new outfall would also be constructed, to pump the surface water to sea during storms.
c) AMP6 - Provide an additional emergency foul overflow from the Western Interceptor sewer (the sewer conveying a large part of the flow arriving at Eastney Pumping Station). This overflow would be pumped and act as a relief during exceptional circumstances.
The AMP4 Final Determination included an expenditure allowance for the first element, to provide a sister pumping station sized for capability of approximately 50% of the existing station. Construction has now started on site and will be functionally complete before March 2010. This new sister station will be equipped with electrically driven pumps (as opposed to diesel driven pumps in the existing station) such that in addition to providing the required standby capacity, the new station will also be operable as ‘first duty’, thus improving the operational reliability of the system.
In our Final Determination Ofwat required that further work be carried out to justify the second and third elements. During AMP4 we have undertaken a very significant volume of investigation and analysis to develop a robust and economic solution to providing additional security for the Eastney network. A series of studies was undertaken by some of the leading consultants and experts in the industry, summarised in the report ‘Protecting Portsmouth from Flooding’ (ref: RT-HW-854). Further more detailed reports are available covering each of the individual studies in depth.
The summary report recommends the following schemes:
• Strategic CSO
The preferred option selected involves connecting the Pier Road CSO chamber to a new CSO/PS at Burgoyne Road. This could be achieved via a 1.8m ID pipe jacked sewer or a 2.87m ID tunnel. This would allow abandonment of the Pier Road PS and outfall and would use the existing Burgoyne Road Sewer as the link between the Southern Low and the Western Interceptor.
The new Burgoyne Road CSO/PS would include a 16m wide x 24m long x 11m deep shaft leading to a 2.87m ID outfall tunnel constructed on the southern side of Clarence Esplanade. The outfall would extend approximately 600m offshore to discharge below MLWS. Under storm conditions the Burgoyne Road sewer would back up from the Western Interceptor and the new CSO would provide relief. The new CSO would have a capacity to spill 9 m3/s (based on model results), 2 m3/s of which would be screened to 6mm to meet the AMP2 guidelines and standards with respect to aesthetic control. The estimated cost of the preferred option for this asset is .
For the draft business plan we did not undertake cost-benefit analysis for the Eastney Strategic CSO scheme. For the final business plan we have undertaken a significant amount of analysis to enable the benefits of the scheme to be evaluated, including a re-assessment of the current and proposed flood standards, and modelling to give a better understanding of the area at risk (as opposed to the area actually flooded. The assessment shows that that the Strategic CSO is cost-beneficial.
We reiterate that the motivation for this scheme is to avoid catastrophic flooding in Portsmouth, where as well as household and area flooding, business and public life would be disrupted for an extended period by a flood. Neither the avoidance of the widespread catastrophic effects on households nor the disruptions to non-households are well captured by the per-property sewer flooding valuations we have available. This means that the benefit estimate we have shown is a lower band.
Southern WaterFinal Business Plan 2009C.6 Sewer Flooding
- 19 -
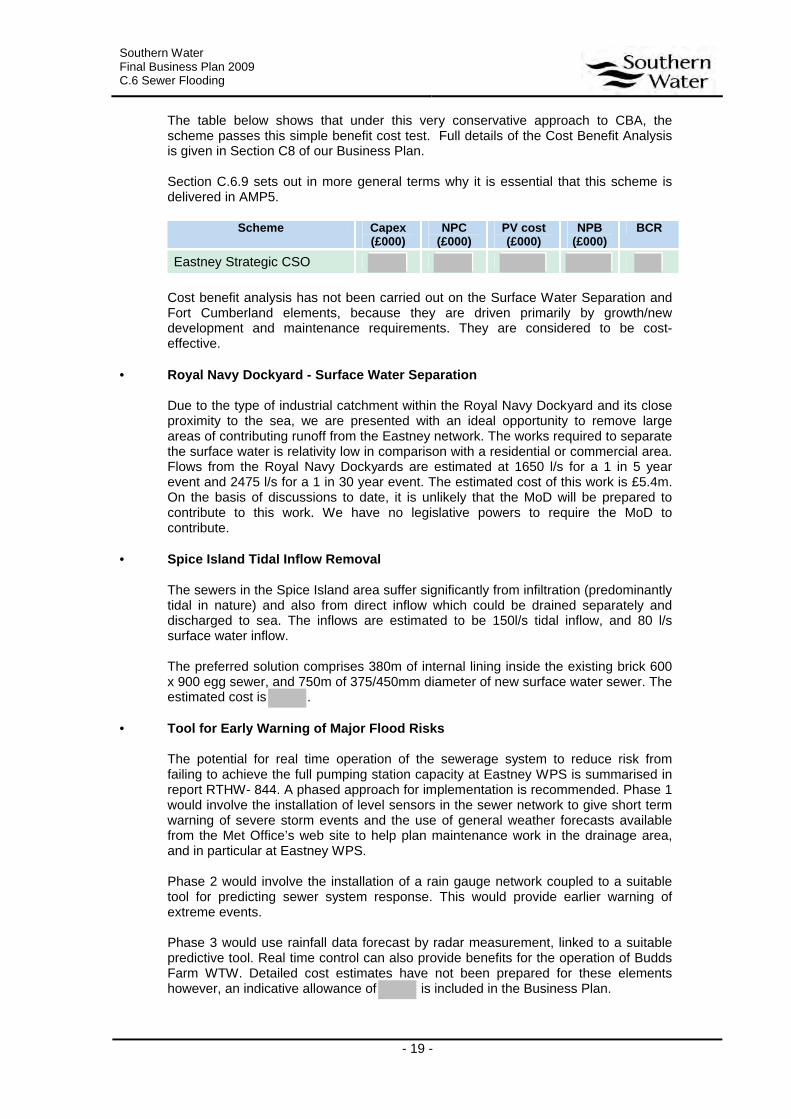
The table below shows that under this very conservative approach to CBA, the scheme passes this simple benefit cost test. Full details of the Cost Benefit Analysis is given in Section C8 of our Business Plan.
Section C.6.9 sets out in more general terms why it is essential that this scheme is delivered in AMP5.
Scheme Capex(£000)
NPC(£000)
PV cost(£000)
NPB(£000)
BCR
Eastney Strategic CSO
Cost benefit analysis has not been carried out on the Surface Water Separation and Fort Cumberland elements, because they are driven primarily by growth/new development and maintenance requirements. They are considered to be cost-effective.
• Royal Navy Dockyard - Surface Water Separation
Due to the type of industrial catchment within the Royal Navy Dockyard and its close proximity to the sea, we are presented with an ideal opportunity to remove large areas of contributing runoff from the Eastney network. The works required to separate the surface water is relativity low in comparison with a residential or commercial area. Flows from the Royal Navy Dockyards are estimated at 1650 l/s for a 1 in 5 year event and 2475 l/s for a 1 in 30 year event. The estimated cost of this work is £5.4m.On the basis of discussions to date, it is unlikely that the MoD will be prepared to contribute to this work. We have no legislative powers to require the MoD to contribute.
• Spice Island Tidal Inflow Removal
The sewers in the Spice Island area suffer significantly from infiltration (predominantly tidal in nature) and also from direct inflow which could be drained separately and discharged to sea. The inflows are estimated to be 150l/s tidal inflow, and 80 l/s surface water inflow.
The preferred solution comprises 380m of internal lining inside the existing brick 600 x 900 egg sewer, and 750m of 375/450mm diameter of new surface water sewer. The estimated cost is .
• Tool for Early Warning of Major Flood Risks
The potential for real time operation of the sewerage system to reduce risk from failing to achieve the full pumping station capacity at Eastney WPS is summarised in report RTHW- 844. A phased approach for implementation is recommended. Phase 1 would involve the installation of level sensors in the sewer network to give short term warning of severe storm events and the use of general weather forecasts available from the Met Office’s web site to help plan maintenance work in the drainage area, and in particular at Eastney WPS.
Phase 2 would involve the installation of a rain gauge network coupled to a suitable tool for predicting sewer system response. This would provide earlier warning of extreme events.
Phase 3 would use rainfall data forecast by radar measurement, linked to a suitable predictive tool. Real time control can also provide benefits for the operation of Budds Farm WTW. Detailed cost estimates have not been prepared for these elementshowever, an indicative allowance of is included in the Business Plan.
Southern WaterFinal Business Plan 2009C.6 Sewer Flooding
- 20 -
• Surface Water Separation projects
Eight Surface Water Separation projects have been considered within the study. Six were recommended based on the surface water removal rate as shown below, at a total estimated cost of :
− )−−−−−
Two other projects were considered not to provide good value and have not been included in the Business Plan:
−−
• Gruneison Road Surface Water PS
Gruneison Road Surface Water Pumping Station receives flows from six of the Portsea Island CSOs. In normal circumstances flows discharge through a gravity outfall but when the outfall becomes tide locked flows overflow into the wet well and are pumped. The model predicts incoming flows of 2.75 m
3/s arriving at the station,
which is greater than the 600 l/s calculated capacity of the rising main that passes to the outfall. A full survey of the PS would be needed to ascertain potential improvements. An indicative allowance of has been included (based on limited information).
• Kirtley Road CSO
Kirtley Road CSO on the mainland appears to act as an overflow from the surface water system into the foul/combined system draining to Mainland PS when the surface water system becomes tide-locked. This CSO should be investigated further to determine an appropriate solution to discharge the surface water flows allowing the CSO to discharge effectively. An indicative sum of has been included (based on limited information).
• Fort Cumberland Screen Enhancements
The existing below ground screens at Fort Cumberland have a significant effect on the capacity and performance of the main storm pumps at Eastney WPS. Improvements to the screens will have the effect of increasing the capacity of the pumps by reducing the pumping head that they operate against. The estimated cost of this facility is .
• Morass Sewer Rehabilitation
The Morass area remains in a state of dereliction which is contributing to the serviceability problems and potentially pollution of the bathing beach. Rehabilitation of the network is considered essential to resolve these issues. The estimated cost of this work is . This work has been deferred to AMP6.
The total cost of these works in AMP5 is estimated a , with a further in AMP6 for the Morass sewer rehabilitation works. The costs associated with the AMP5 work are allocated as follows:
Southern WaterFinal Business Plan 2009C.6 Sewer Flooding
- 21 -
Element Allocation Cost (£m)
Enhanced level of serviceEastney Strategic CSO
Base maintenance
GrowthFort Cumberland screen enhancements and Tool
for Early Warning of Major Flood Risks Base maintenance
GrowthSurface water separation
schemesBase maintenance
Total
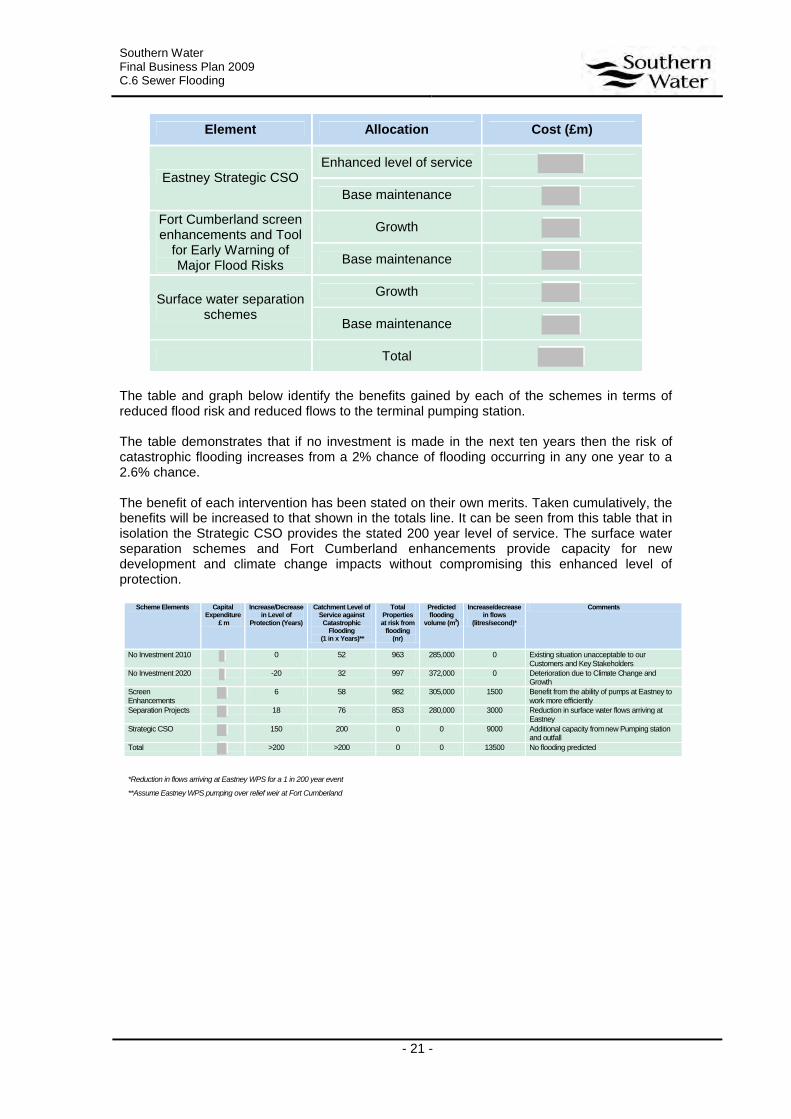
The table and graph below identify the benefits gained by each of the schemes in terms of reduced flood risk and reduced flows to the terminal pumping station.
The table demonstrates that if no investment is made in the next ten years then the risk of catastrophic flooding increases from a 2% chance of flooding occurring in any one year to a 2.6% chance.
The benefit of each intervention has been stated on their own merits. Taken cumulatively, the benefits will be increased to that shown in the totals line. It can be seen from this table that in isolation the Strategic CSO provides the stated 200 year level of service. The surface water separation schemes and Fort Cumberland enhancements provide capacity for new development and climate change impacts without compromising this enhanced level of protection.
Scheme Elements Capital Expenditure
£ m
Increase/Decrease in Level of
Protection (Years)
Catchment Level of Service against
Catastrophic Flooding
(1 in x Years)**
Total Properties at risk from
flooding (nr)
Predicted flooding
volume (m3)
Increase/decrease in flows
(litres/second)*
Comments
No Investment 2010 0 52 963 285,000 0 Existing situation unacceptable to our Customers and Key Stakeholders
No Investment 2020 -20 32 997 372,000 0 Deterioration due to Climate Change and Growth
Screen Enhancements
6 58 982 305,000 1500 Benefit from the ability of pumps at Eastney to work more efficiently
Separation Projects 18 76 853 280,000 3000 Reduction in surface water flows arriving at Eastney
Strategic CSO 150 200 0 0 9000 Additional capacity fromnew Pumping station and outfall
Total >200 >200 0 0 13500 No flooding predicted
*Reduction in flows arriving at Eastney WPS for a 1 in 200 year event
**Assume Eastney WPS pumping over relief weir at Fort Cumberland
Southern WaterFinal Business Plan 2009C.6 Sewer Flooding
- 22 -
C.6.10 Customer Research
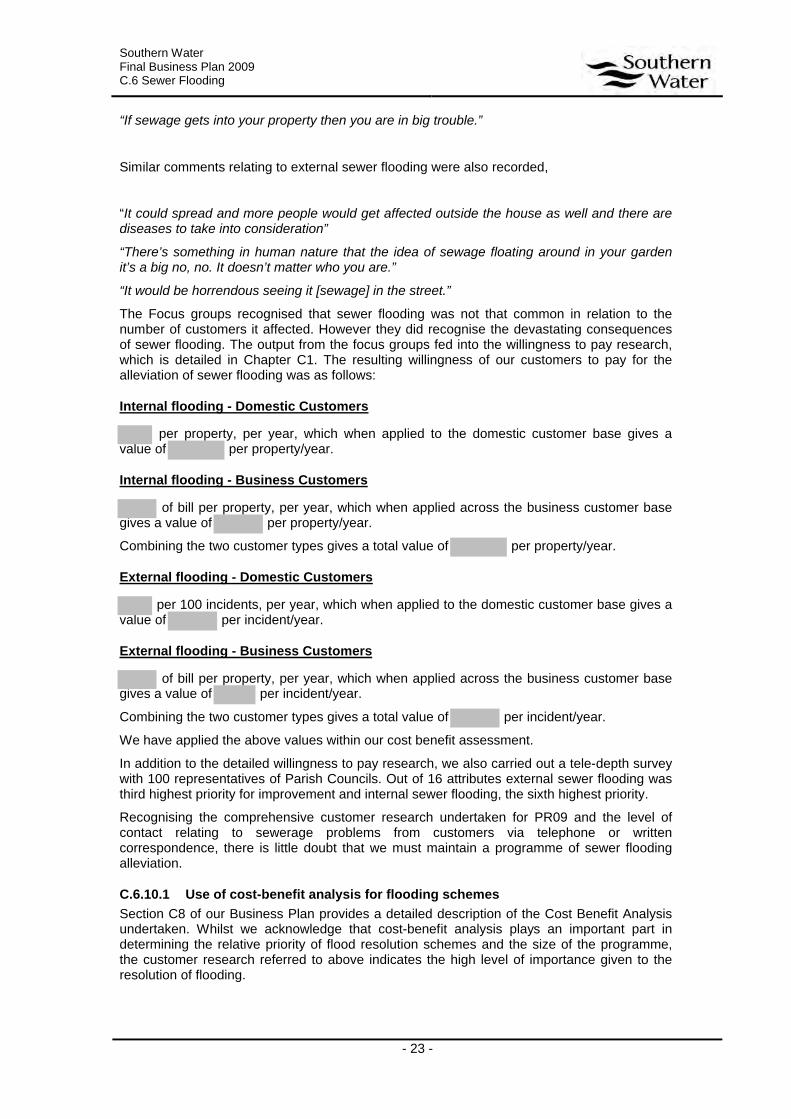
We have carried out extensive willingness to pay research for the Business Plan. This research included customers views on internal and external sewer flooding. Research was carried out to determine our customers’ priorities for improvement in the services we offer.
Figure C.4 – Areas of priority for improvement to customers
We initially sought the views of domestic customers at a series of focus groups where comments relating to internal sewer flooding, such as the following, were voiced:
“I do think it is a very, very high priority it doesn’t matter whether you have been affected or not”.
“I spoke to a chap last week and he said you don’t understand the trauma it causes. It’s something you take years to get over, he’s lost everything”.
Southern WaterFinal Business Plan 2009C.6 Sewer Flooding
- 23 -
“If sewage gets into your property then you are in big trouble.”
Similar comments relating to external sewer flooding were also recorded,
“It could spread and more people would get affected outside the house as well and there are diseases to take into consideration”
“There’s something in human nature that the idea of sewage floating around in your garden it’s a big no, no. It doesn’t matter who you are.”
“It would be horrendous seeing it [sewage] in the street.”
The Focus groups recognised that sewer flooding was not that common in relation to the number of customers it affected. However they did recognise the devastating consequences of sewer flooding. The output from the focus groups fed into the willingness to pay research, which is detailed in Chapter C1. The resulting willingness of our customers to pay for the alleviation of sewer flooding was as follows:
Internal flooding - Domestic Customers
per property, per year, which when applied to the domestic customer base gives a value of per property/year.
Internal flooding - Business Customers
of bill per property, per year, which when applied across the business customer base gives a value of per property/year.
Combining the two customer types gives a total value of per property/year.
External flooding - Domestic Customers
per 100 incidents, per year, which when applied to the domestic customer base gives a value of per incident/year.
External flooding - Business Customers
of bill per property, per year, which when applied across the business customer base gives a value of per incident/year.
Combining the two customer types gives a total value of per incident/year.
We have applied the above values within our cost benefit assessment.
In addition to the detailed willingness to pay research, we also carried out a tele-depth survey with 100 representatives of Parish Councils. Out of 16 attributes external sewer flooding was third highest priority for improvement and internal sewer flooding, the sixth highest priority.
Recognising the comprehensive customer research undertaken for PR09 and the level of contact relating to sewerage problems from customers via telephone or written correspondence, there is little doubt that we must maintain a programme of sewer flooding alleviation.
C.6.10.1 Use of cost-benefit analysis for flooding schemes
Section C8 of our Business Plan provides a detailed description of the Cost Benefit Analysis undertaken. Whilst we acknowledge that cost-benefit analysis plays an important part in determining the relative priority of flood resolution schemes and the size of the programme, the customer research referred to above indicates the high level of importance given to the resolution of flooding.
Southern WaterFinal Business Plan 2009C.6 Sewer Flooding
- 24 -
CCWater have given their view that cost-benefit analysis could be used to prioritise schemes, but should not be used as an absolute means of excluding non-cost-beneficial schemes. We agree with this view.
There are several reasons why a scheme might be included in the programme, even though it is not cost-beneficial in its own right:• Cost-benefit is not a precise science, and schemes where the C-B ratio is marginal
should be included where other factors indicate.• Cost-benefit does not take account of the longevity of the problem, so a long-
standing relatively low impact problem may not get resolved. The CCWaterprioritisation (used for AMP4) takes account of ‘persistency’ in calculating nuisance points.
• It is recognised that under-reporting of flooding will give an artificially low C-B ratio. There are several schemes where representations have been made through channels other than normal customer reporting (parish or district councils for example).
• Cost-benefit analysis does not at present take account of the severity of flooding problems (ie the impact of flooding). Some flexibility should be considered where particular severity can be demonstrated.
Experiences of our own employees attending meetings with customers who have suffered flooding, support the fact that sewer flooding is particularly distressing for those involved and the risk of such events must be reduced.
The following are examples of some of the experiences of a former operational manager responsible for sewerage issues.
1. Attending a basement flat in Folkestone less than an hour after it had suffered internal flooding from the combined sewerage system, to witness personnel possessions such as books, papers and photographs floating in the then dropping sewage level. The husband of the couple was trying in vain to salvage some of the items, his wife would not come out of the kitchen area as she did not wish to see the devastation, although her crying could be clearly heard.
2. At a public meeting held three years after major flooding events at similar locations,
an elderly lady addressed the SWS manager and the audience (some 100+) to tell them that each time there was heavy rain she began to move her furniture and possessions in the belief that a repeat flooding event would occur. If the rainfall was in the evening or during the night then she did not go to bed. Unfortunately before she could finish what she intended to say she was overcome by emotion and burst into tears. She then had to be helped out of the room and escorted home.
3. On attending a public meeting to discuss flooding that had occurred the previous week, the SWS manager was addressed by a member of the audience who was fairly aggressive towards the manager and SWS in general. These views were expressed by a well spoken and articulate gentleman who probably would not normally be so aggressive but was at the end of his tether. On the closure of the meeting the gentleman asked the manger to come to see the damage caused to his home, which he, his wife and children had had to vacate. On reaching the house the gentleman reached into his pocket for the keys and immediately burst into tears, he explained that he could not face opening the front door and seeing (and smelling) the after effects of the flooding. He also went on to say that he now had reliance on prescription anti-depressants.
4. Attending a public meeting several weeks after a flooding event where the views and opinions expressed by the audience were so emotional and aggressive that on leaving the meeting the manager genuinely had concerns over his own personal safety.
Southern WaterFinal Business Plan 2009C.6 Sewer Flooding
- 25 -
5. Having to apologise to a newly retired couple who had been internally flooded several months earlier and had to vacate their house for repairs to be effected and on the day prior to moving back into their home, a repeat flooding event occurred, creating a similar level of damage
Whilst these are five experiences of a particular manager, they are not unique and all operational managers will be able to relate similar experiences.
It is clear from these descriptions that sewer flooding has a significant impact on people, their lives and that it remains with them for a considerable time. It is with this in mind that we believe it inappropriate that proposals for future investment in flood alleviation are judged purely on a cost benefit approach.
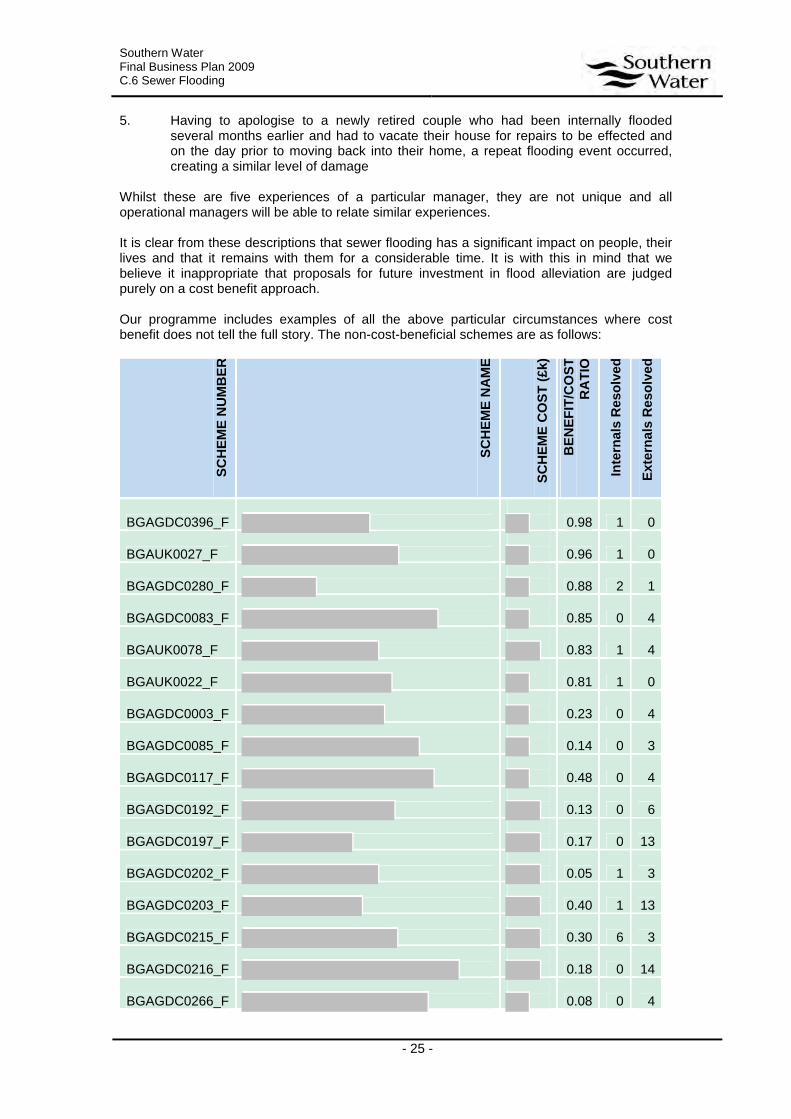
Our programme includes examples of all the above particular circumstances where cost benefit does not tell the full story. The non-cost-beneficial schemes are as follows:
SC
HE
ME
NU
MB
ER
SC
HE
ME
NA
ME
SC
HE
ME
CO
ST
(£k)
BE
NE
FIT
/CO
ST
R
AT
IO
Inte
rnals
Reso
lved
Exte
rnals
Reso
lved
BGAGDC0396_F 0.98 1 0
BGAUK0027_F 0.96 1 0
BGAGDC0280_F 0.88 2 1
BGAGDC0083_F 0.85 0 4
BGAUK0078_F
0.83 1 4
BGAUK0022_F 0.81 1 0
BGAGDC0003_F 0.23 0 4
BGAGDC0085_F 0.14 0 3
BGAGDC0117_F 0.48 0 4
BGAGDC0192_F
0.13 0 6
BGAGDC0197_F
0.17 0 13
BGAGDC0202_F
0.05 1 3
BGAGDC0203_F
0.40 1 13
BGAGDC0215_F
0.30 6 3
BGAGDC0216_F
0.18 0 14
BGAGDC0266_F 0.08 0 4

Southern WaterFinal Business Plan 2009C.6 Sewer Flooding
- 26 -
BGAGDC0282 F
0.45 2 1
BGAGDC0283 F
0.12 0 7
BGAGDC0289 F 0.09 0 9
BGAGDC0316 F 0.77 1 1
BGAUK0005 F
0.21 4 6
BGAUK0051 F 0.64 0 1
BGAUK0082 F 0.58 1 3
BGAUK0296 F
Biddenden 0.12 0 21
BGAUK0301 F
0.28 5 14
BGAUK0306 F 0.39 0 1
Full details of these schemes and the reasons for including them in the programme are given in Appendix C6.2. Considered as a programme of work, the overall benefits exceed the overall costs.
C.6.11 Summary
We believe that there is sufficient customer support both from the national research and from our own Focus Groups to justify the proposed programme of works. Our scheme prioritisation system has the support of CCWater and our proposed programme is cost beneficial.
The maintenance of a static 1:10 and 2:10 internal DG5 ‘at risk’ register requires funding to remove an estimated 21 properties each year. We have allocated a further to maintain a static 1:20 internal ‘at-risk register.
The programme of works identified in tables C6.2 and C.6.3 is estimated to cost excluding works at Eastney, and allocations for maintenance of static internal DG5 registers. Our proposed programme will give a net reduction of 80 properties from the internal DG5 register (all categories, and including two arising from the Eastney schemes), and 169properties at risk of external flooding (all categories) split approximately 66 linked and 103non-linked to internal flooding.
Our proposed costs are all based upon engineered solutions and do not include solutions such as the purchasing of the affected properties or filling-in of cellars.
Portsea Island is acknowledged as a very high-risk flood area, and the proposed programme includes major works to the Eastney catchment to reduce the risk of flooding to less than 1:200 year frequency.
The package of schemes covers the wider aspects of flooding and is not solely restricted to removing properties from the internal 2:10/1:10 DG5 ‘at risk’ Register. We believe that this approach reflects our customers’ wishes, and that the overall programme cost is within the increase in water charges that our customers are prepared to support.
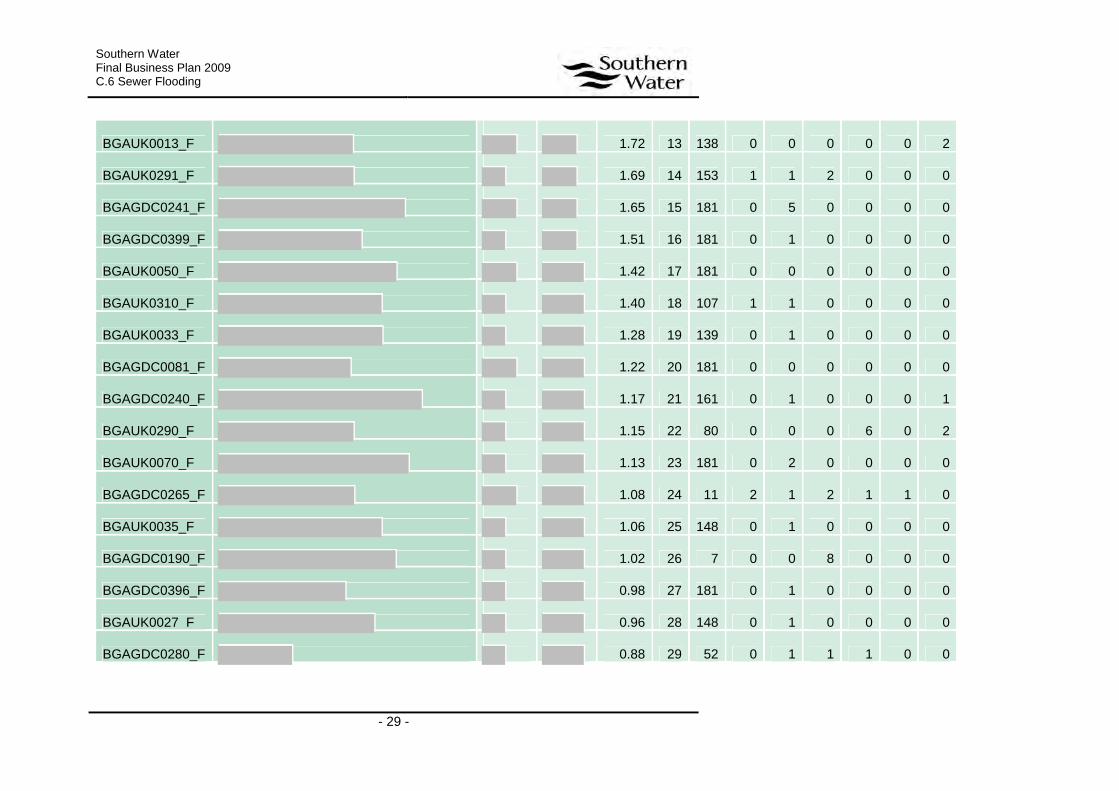
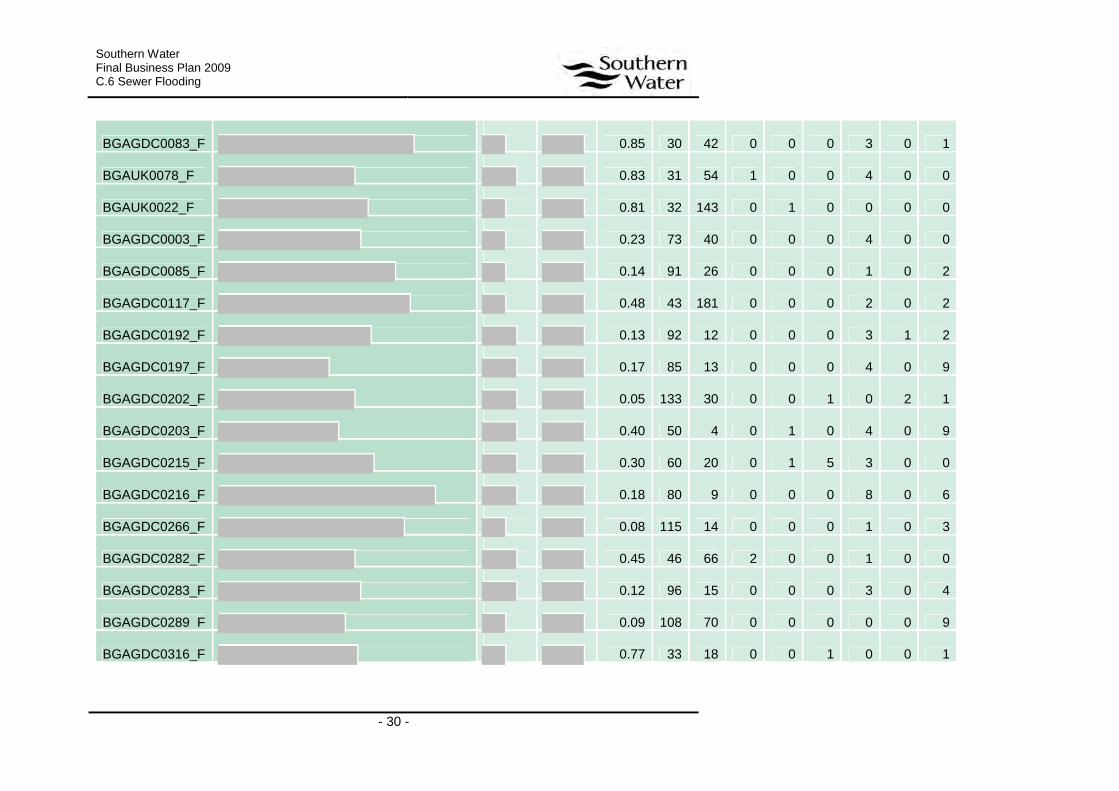
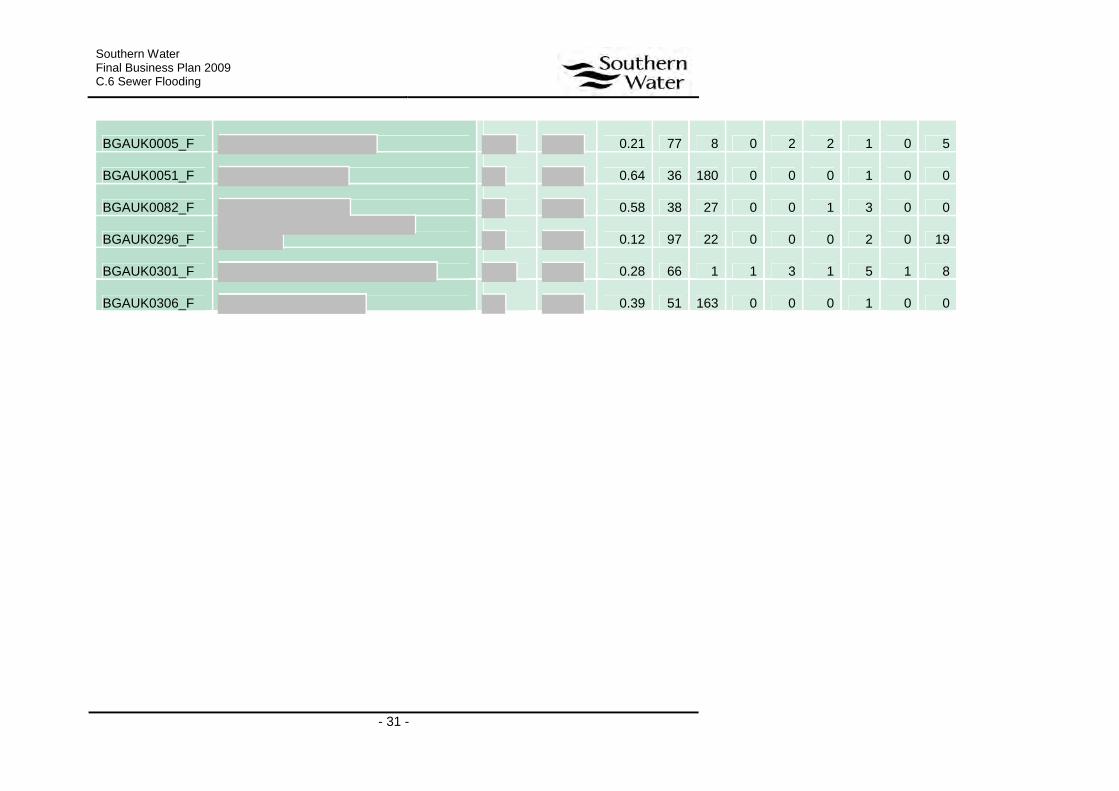
The table below shows the full list of flood alleviation schemes, with cost-benefit ratios, scheme costs, and outputs in terms of DG5 removals. Two of the schemes with pollution drivers (Old Roar Ghyll and Danes Stream) do not have drivers associated with them. The CCWater ranking is also given.

Southern WaterFinal Business Plan 2009C.6 Sewer Flooding
- 27 -

Southern WaterFinal Business Plan 2009C.6 Sewer Flooding
- 28 -
SC
HE
ME
NU
MB
ER
SC
HE
ME
NA
ME
SC
HE
ME
CO
ST
CU
MU
LA
TIV
E
PR
OG
RA
MM
E C
OS
T
BE
NE
FIT
/CO
ST
R
AT
IO
CB
A R
AN
K
CC
W R
AN
K
DG
5_In
t_2in
10
DG
5_In
t_1in
10
DG
5_In
t_1in
20
DG
5_E
xt_
2in
10
DG
5_E
xt_
1in
10
DG
5_E
xt_
1in
20
BGAGDC0318_F
10.03 1 87 1 0 0 1 0 1
BGAUK0079_F
4.68 2 126 0 1 0 0 0 0
BGAUK0023_F
4.09 3 151 1 0 0 0 0 0
BGAGDC0325_F
4.07 4 95 0 2 0 0 0 0
BGAGDC0309_F
3.84 5 72 5 0 0 0 0 1
BGAUK0012_F
3.45 6 145 1 0 0 0 0 0
BGAGDC0397_F
2.77 7 140 0 1 0 0 0 1
BGAGDC0119_F
2.52 8 181 0 1 0 0 0 0
BGAUK0009_F
2.40 9 57 2 0 0 0 0 3
BGAUK0304_F
2.34 10 181 0 1 0 0 0 0
BGAGDC0274_F
2.25 11 6 5 0 0 7 0 0
BGAGDC0292_F
2.02 12 134 0 0 0 1 0 1
Southern WaterFinal Business Plan 2009C.6 Sewer Flooding
- 29 -
BGAUK0013_F
1.72 13 138 0 0 0 0 0 2
BGAUK0291_F
1.69 14 153 1 1 2 0 0 0
BGAGDC0241_F
1.65 15 181 0 5 0 0 0 0
BGAGDC0399_F
1.51 16 181 0 1 0 0 0 0
BGAUK0050_F
1.42 17 181 0 0 0 0 0 0
BGAUK0310_F
1.40 18 107 1 1 0 0 0 0
BGAUK0033_F
1.28 19 139 0 1 0 0 0 0
BGAGDC0081_F
1.22 20 181 0 0 0 0 0 0
BGAGDC0240_F
1.17 21 161 0 1 0 0 0 1
BGAUK0290_F
1.15 22 80 0 0 0 6 0 2
BGAUK0070_F
1.13 23 181 0 2 0 0 0 0
BGAGDC0265_F
1.08 24 11 2 1 2 1 1 0
BGAUK0035_F
1.06 25 148 0 1 0 0 0 0
BGAGDC0190_F
1.02 26 7 0 0 8 0 0 0
BGAGDC0396_F
0.98 27 181 0 1 0 0 0 0
BGAUK0027 F
0.96 28 148 0 1 0 0 0 0
BGAGDC0280_F
0.88 29 52 0 1 1 1 0 0
Southern WaterFinal Business Plan 2009C.6 Sewer Flooding
- 30 -
BGAGDC0083_F
0.85 30 42 0 0 0 3 0 1
BGAUK0078_F
0.83 31 54 1 0 0 4 0 0
BGAUK0022_F
0.81 32 143 0 1 0 0 0 0
BGAGDC0003_F
0.23 73 40 0 0 0 4 0 0
BGAGDC0085_F
0.14 91 26 0 0 0 1 0 2
BGAGDC0117_F
0.48 43 181 0 0 0 2 0 2
BGAGDC0192_F
0.13 92 12 0 0 0 3 1 2
BGAGDC0197_F
0.17 85 13 0 0 0 4 0 9
BGAGDC0202_F
0.05 133 30 0 0 1 0 2 1
BGAGDC0203_F
0.40 50 4 0 1 0 4 0 9
BGAGDC0215_F
0.30 60 20 0 1 5 3 0 0
BGAGDC0216_F
0.18 80 9 0 0 0 8 0 6
BGAGDC0266_F
0.08 115 14 0 0 0 1 0 3
BGAGDC0282_F
0.45 46 66 2 0 0 1 0 0
BGAGDC0283_F
0.12 96 15 0 0 0 3 0 4
BGAGDC0289 F
0.09 108 70 0 0 0 0 0 9
BGAGDC0316_F
0.77 33 18 0 0 1 0 0 1
Southern WaterFinal Business Plan 2009C.6 Sewer Flooding
- 31 -
BGAUK0005_F
0.21 77 8 0 2 2 1 0 5
BGAUK0051_F
0.64 36 180 0 0 0 1 0 0
BGAUK0082_F
0.58 38 27 0 0 1 3 0 0
BGAUK0296_F
0.12 97 22 0 0 0 2 0 19
BGAUK0301_F
0.28 66 1 1 3 1 5 1 8
BGAUK0306_F
0.39 51 163 0 0 0 1 0 0