c6nr03217f 13627..13637
TRANSCRIPT

Nanoscale
PAPER
Cite this: Nanoscale, 2016, 8, 13627
Received 19th April 2016,Accepted 24th June 2016
DOI: 10.1039/c6nr03217f
www.rsc.org/nanoscale
Hafnia (HfO2) nanoparticles as an X-ray contrastagent and mid-infrared biosensor
Tracie L. McGinnity,a,c Owen Dominguez,b,d Tyler E. Curtis,a
Prakash D. Nallathamby,a,c Anthony J. Hoffmanb,d and Ryan K. Roeder*a,b,c,d
The interaction of hafnium oxide (HfO2) nanoparticles (NPs) with X-ray and mid-infrared radiation was
investigated to assess the potential as a multifunctional diagnostic probe for X-ray computed tomography
(CT) and/or mid-infrared biosensing. HfO2 NPs of controlled size were prepared by a sol–gel process and
surface functionalized with polyvinylpyrrolidone, resulting in relatively spherical and monodispersed NPs
with a tunable mean diameter in the range of ∼7–31 nm. The X-ray attenuation of HfO2 NPs was
measured over 0.5–50 mM concentration and compared with Au NPs and iodine, which are the most
prominent X-ray contrast agents currently used in research and clinical diagnostic imaging, respectively.
At clinical CT tube potentials >80 kVp, HfO2 NPs exhibited superior or similar X-ray contrast compared to
Au NPs, while both exhibited significantly greater X-ray contrast compared to iodine, due to the favorable
location of the k-shell absorption edge for hafnium and gold. Moreover, energy-dependent differences in
X-ray attenuation enabled simultaneous quantitative molecular imaging of each agent using photon-
counting spectral (multi-energy) CT. HfO2 NPs also exhibited a strong mid-infrared absorption in the
Reststrahlen band from ∼250–800 cm−1 and negative permittivity below 695 cm−1, which can enable
development of mid-infrared biosensors and contrast agents, leveraging surface enhanced mid-infrared
and/or phonon polariton absorption.
Introduction
Hafnium oxide or hafnia (HfO2) nanoparticles (NPs) and thinfilms have been investigated for various applications includinghigh-k gate dielectrics,1,2 scintillators,3,4 radiosensitizers,5,6
optical waveguides7,8 and optical coatings,9,10 due to exhibitinga high dielectric constant (ε = 25), high melting point(2758 °C), high atomic number (Z = 72), high density (9.7g cm−3), high index of refraction, transparency to visible light(5.3–5.9 eV band gap), and chemical stability. In particular, thehigh atomic number and electron density of HfO2 NPs pro-motes efficient X-ray absorption for use as a radioluminescentscintillator3,4 or radiosensitizer in cancer radiotherapy.5,6
Moreover, the polar crystalline structure and optical phononenergies of HfO2 result in a negative permittivity in the mid-
infrared enabling localized surface phonon polaritons for useas optical sensors and materials.11,12 Therefore, HfO2 NPsmight also be expected to be useful as an X-ray contrast agentin computed tomography (CT) and phononic material forsurface enhanced mid-infrared absorption.
NPs comprising high-Z metals, such as gold,13–15
bismuth,16,17 tantalum,18,19 and tungsten,20 have gainedrecent interest as X-ray contrast agents due to enabling thedelivery of a greater mass payload compared with molecularcontrast agents (e.g., iodinated molecules and Gd-chelates)used clinically. Interestingly, simulations of the contrast-to-noise ratio and X-ray dose for contrast-enhanced CT with anumber of prospective high-Z contrast agents – includingiodine, gold, bismuth, gadolinium, and tungsten, amongothers – suggested that hafnium provided the best overall per-formance at clinical CT tube potentials.21,22 The k-shellabsorption edge of hafnium (65.4 keV) is favorably locatednear the mean photon energy (and highest count rate) of thephoton energy spectrum in clinical CT systems, which rangesfrom ∼20 keV to peak tube potentials of 80–140 kVp (Fig. 1).Thus, HfO2 could provide improved X-ray contrast comparedwith current clinical contrast agents (iodine) and a lower-costalternative to Au NPs (0.56 USD g−1 Hf vs. 39.47 USD g−1 Au23).However, there has been no previous experimental investi-gation of HfO2 NPs as an X-ray contrast agent.
aDepartment of Aerospace and Mechanical Engineering, Bioengineering Graduate
Program, University of Notre Dame, Notre Dame, IN 46556, USA.
E-mail: [email protected]; Tel: +1 (574) 631-7003bDepartment of Electrical Engineering, University of Notre Dame, Notre Dame,
IN 46556, USAcHarper Cancer Research Institute, University of Notre Dame, Notre Dame, IN 46556,
USAdNotre Dame Center for Nanoscience and Nanotechnology (NDnano), University of
Notre Dame, Notre Dame, IN 46556, USA
This journal is © The Royal Society of Chemistry 2016 Nanoscale, 2016, 8, 13627–13637 | 13627

Noble metal NPs are able to scatter and absorb visible andinfrared frequencies of light, enabling photonic and bio-photonic applications in these frequency ranges.26–28 Opticalapplications can benefit from using mid-infrared wavelengthsbecause many molecules exhibit strong, characteristic absorp-tion at these wavelengths. Coupling the benefits of strong andspecific mid-infrared absorption with nanomaterials is promis-ing for a new generation of photonic and biophotonic devicesand applications, including biosensors and single moleculespectroscopy. However, the large permittivity of noble metalNPs, limits utility beyond the near-infrared. The excitation ofsurface phonon polariton modes in polar dielectrics enablesapplications in the mid-infrared that are analogous to plasmo-nic applications.11,12 The permittivity of HfO2 NPs is negativein the mid-infrared between the longitudinal and transverseoptical phonon wavelengths,29 allowing excitation of sub-dif-fraction surface phonon polariton modes that are similar tothose used in plasmonics, but at mid-infrared frequencies.Thus, HfO2 NPs could play an important role in the develop-ment of mid-infrared sensors based on surface enhanced mid-infrared absorption or phonon polariton absorption, and ascontrast agents for mid-infrared imaging.
Therefore, the objective of this study was to investigate theinteraction of HfO2 NPs with X-ray and mid-infrared radiationto assess potential as a multifunctional diagnostic probe forX-ray CT and mid-infrared biosensing, respectively. HfO2 NPsof controlled size were prepared by a sol–gel process andsurface functionalized to promote colloidal stability. The X-rayattenuation of HfO2 NPs was measured and compared with AuNPs and iodine (iohexol) over a range of concentrations andX-ray tube potentials. Mid- to far-infrared transmission spectra
were measured for HfO2 NPs and fit using a Lorentz multipleoscillator model to estimate the permittivity.
Results and discussionHfO2 NP synthesis, surface modification, and characterization
HfO2 NPs of controlled size were prepared by a sol–gel process,calcining a polymerized complex at 500, 575, 650, 800, and950 °C. The crystallographic phase and crystallite size wascharacterized by X-ray diffraction (XRD). All XRD peaks corre-sponded to monoclinic HfO2 (JCPDS 34-0104)30 with no evi-dence of second phases at the calcination temperaturesinvestigated (Fig. 2). The crystallite size measured by XRD peakbroadening increased with increased calcination temperature(Table 1), as expected due to particle growth. However, trans-mission electron microscopy (TEM) revealed that the as-prepared HfO2 NPs were highly agglomerated (Fig. 3). Moreover,the hydrodynamic diameter measured by dynamic light scat-tering (DLS) for as-prepared HfO2 NPs calcined at 575 °C was225 (±74) nm, which reflected the presence of multi-particleagglomerates.
As-prepared HfO2 NPs were dispersed by surfacefunctionalization with polyvinylpyrrolidone (PVP) and ultra-sonication. The hydrodynamic diameter measured by DLS forPVP–HfO2 NPs calcined at 575 °C was 133 (±74) nm. TEMmicrographs showed that PVP–HfO2 NPs were spherical andwell-dispersed (Fig. 4). The measured NP diameter increasedwith increased calcination temperature (p < 0.0001, ANOVA)from ∼7 nm at 500 °C to ∼31 nm at 950 °C, and the size distri-bution was relatively monodispersed (Table 1). Differences
Fig. 1 The X-ray mass attenuation coefficient of iodine (I), hafniumoxide (HfO2), gold (Au), cortical bone tissue, and soft tissue versusphoton energy showing the location of k-shell absorption edges foriodine, hafnium and gold at 33.2, 65.4, and 80.7 keV. X-ray mass attenu-ation coefficients were calculated from NIST databases.24,25 Note thatthe k-shell absorption edge of hafnium (65.4 keV) is favorably locatednear the mean photon energy (and highest count rate) of the photonenergy spectrum in clinical CT systems, which ranges from ∼20 keV topeak tube potentials of 80–140 kVp.
Fig. 2 Powder XRD patterns for HfO2 NPs prepared from a polymerizedcomplex at a calcination temperature of 500, 575, 650, 800, and 950 °C.All peaks correspond to monoclinic HfO2 (JCPDS 34-0104).30 The 110,011, 1̄11, 111, 200, 020, and 002 reflections were used for crystallite sizemeasurements (Table 1).
Paper Nanoscale
13628 | Nanoscale, 2016, 8, 13627–13637 This journal is © The Royal Society of Chemistry 2016

between the mean NP size measured by TEM and XRD werenot statistically significant for each calcination temperature(p > 0.49, t-test). The measured NP aspect ratio decreasedslightly with increased calcination temperature (p < 0.005,ANOVA) from 1.3 at 500 °C to 1.2 at 950 °C (Table 1). Thus, theHfO2 NPs were ellipsoidal, but nearly spherical, and becamemore spherical with increased calcination temperature.
Control of NP size and dispersion is crucial for both X-raycontrast agents and optical biosensors used either in vivo andin vitro. HfO2 NPs have been synthesized using varioushydrothermal,31–34 solvothermal,35,36 and sol–gel37–39
methods. Sol–gel methods are advantageous for economical,low temperature synthesis of oxide NPs and thin films withcontrolled composition, size, and morphology. Previousstudies for sol–gel derived HfO2 NPs investigated reactant andsurfactant concentrations,37–39 but, surprisingly, had not inves-tigated the ability to tune the NP size via the calcination temp-erature. The results of the present study showed an ability totailor the HfO2 NP size over a four-fold range of ∼7–31 nm at500–950 °C (Table 1). Importantly, NPs in this size range aresuitable for in vitro labeling, in vivo delivery and cellularinternalization.15,40,41 Sol–gel derived HfO2 NPs were pre-viously surface modified by chemisorption of oleic acid tocreate hydrophobic instead of hydrophilic surfaces,38,42 butthese studies appear to be the only that have investigatedsurface modification. The results of the present study showedthat PVP served as an effective non-ionic, steric dispersant forHfO2 NPs.
X-ray contrast
The X-ray attenuation of HfO2 NPs calcined at 575 °C andsurface functionalized with PVP was compared with Au NPsand iodine (iohexol). Au NPs have become the most prominentNP X-ray contrast agent used in research and iodine is themost prominent X-ray contrast agent used in clinical diagnos-tic imaging.13–15 Imaging phantoms were prepared comprisingHfO2 NPs, Au NPs, and iodine at concentrations ranging from0.5 to 50 mM, as well as air and water controls for internal cali-bration of linear attenuation coefficients to Hounsfield units(HU). Each composition and concentration was dispersed in1% agarose to maintain homogeneity and stability for imagingby multiple CT instruments over a period of months.
The phantoms were first imaged using a conventionallaboratory micro-CT (Scanco µCT-80) operating at relatively lowtube potentials (45 and 70 kVp) and high spatial resolution
Fig. 3 Representative TEM micrographs of as-prepared HfO2 NPs cal-cined at 500 and 800 °C showing highly agglomerated NPs.
Fig. 4 Representative TEM micrographs of HfO2 NPs calcined at 500, 575, 650, 800, and 950 °C after surface functionalization with PVP showingdispersed NPs and increased NP size with increased calcination temperature. NP size and morphology measurements are shown in Table 1.
Table 1 The effect of calcination temperature on the size andmorphology of HfO2 NPs. The crystallite size was measured frompowder XRD reflections for as-prepared HfO2 NPs (Fig. 2). The mean(±standard deviation) NP diameter and aspect ratio were measured fromTEM micrographs of PVP–HfO2 NPs (Fig. 4). Pairwise comparisons ofmeasurements not connected by the same superscript letter exhibitedstatistically significant differences between calcination temperatures(p < 0.05, Tukey–Kramer HSD). Differences between the mean NP sizemeasured by XRD and TEM were not statistically significant for eachcalcination temperature (p > 0.49, t-test)
Temperature(°C)
XRDTEM
Crystallitesize(nm)
Diameter(nm) Aspect ratio
500 7.2 (0.8)a 7.4 (1.6)a 1.3 (0.2)a,b
575 8.4 (1.0)a 9.1 (2.3)a 1.3 (0.2)a
650 12.3 (1.0)b 12.5 (3.2)b 1.2 (0.2)b
800 21.2 (2.0)c 22.5 (5.6)c 1.2 (0.1)b
950 32.8 (1.3)d 31.0 (8.2)d 1.2 (0.1)a,b
Nanoscale Paper
This journal is © The Royal Society of Chemistry 2016 Nanoscale, 2016, 8, 13627–13637 | 13629
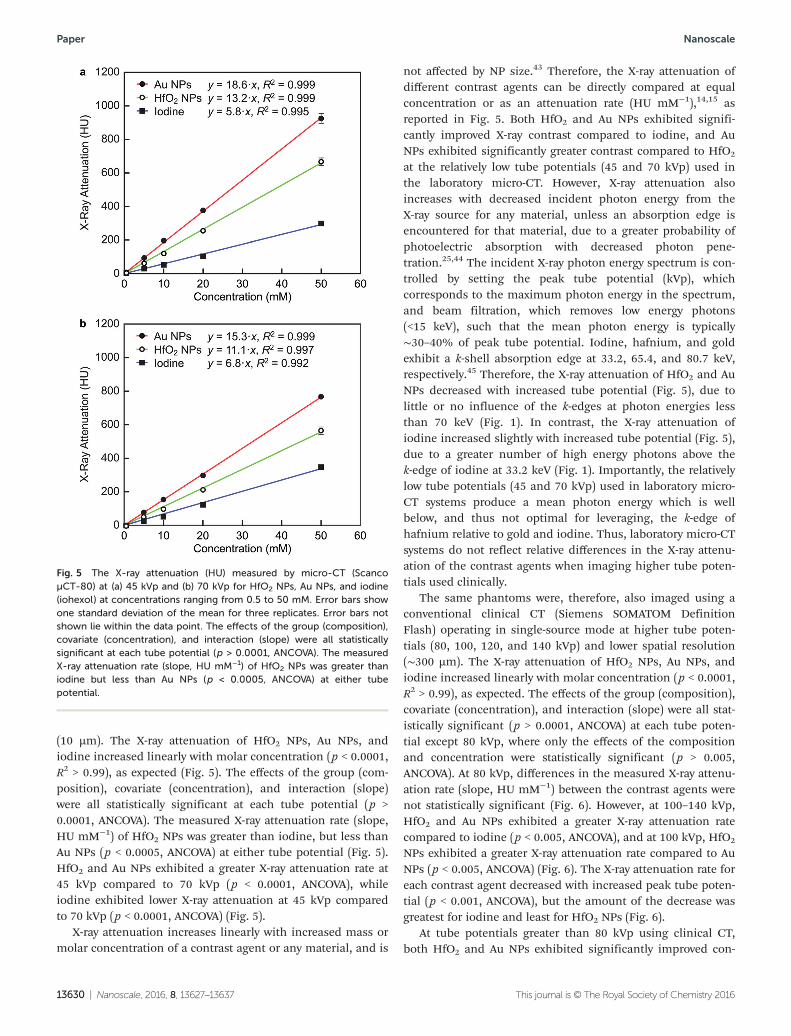
(10 µm). The X-ray attenuation of HfO2 NPs, Au NPs, andiodine increased linearly with molar concentration (p < 0.0001,R2 > 0.99), as expected (Fig. 5). The effects of the group (com-position), covariate (concentration), and interaction (slope)were all statistically significant at each tube potential (p >0.0001, ANCOVA). The measured X-ray attenuation rate (slope,HU mM−1) of HfO2 NPs was greater than iodine, but less thanAu NPs (p < 0.0005, ANCOVA) at either tube potential (Fig. 5).HfO2 and Au NPs exhibited a greater X-ray attenuation rate at45 kVp compared to 70 kVp (p < 0.0001, ANCOVA), whileiodine exhibited lower X-ray attenuation at 45 kVp comparedto 70 kVp (p < 0.0001, ANCOVA) (Fig. 5).
X-ray attenuation increases linearly with increased mass ormolar concentration of a contrast agent or any material, and is
not affected by NP size.43 Therefore, the X-ray attenuation ofdifferent contrast agents can be directly compared at equalconcentration or as an attenuation rate (HU mM−1),14,15 asreported in Fig. 5. Both HfO2 and Au NPs exhibited signifi-cantly improved X-ray contrast compared to iodine, and AuNPs exhibited significantly greater contrast compared to HfO2
at the relatively low tube potentials (45 and 70 kVp) used inthe laboratory micro-CT. However, X-ray attenuation alsoincreases with decreased incident photon energy from theX-ray source for any material, unless an absorption edge isencountered for that material, due to a greater probability ofphotoelectric absorption with decreased photon pene-tration.25,44 The incident X-ray photon energy spectrum is con-trolled by setting the peak tube potential (kVp), whichcorresponds to the maximum photon energy in the spectrum,and beam filtration, which removes low energy photons(<15 keV), such that the mean photon energy is typically∼30–40% of peak tube potential. Iodine, hafnium, and goldexhibit a k-shell absorption edge at 33.2, 65.4, and 80.7 keV,respectively.45 Therefore, the X-ray attenuation of HfO2 and AuNPs decreased with increased tube potential (Fig. 5), due tolittle or no influence of the k-edges at photon energies lessthan 70 keV (Fig. 1). In contrast, the X-ray attenuation ofiodine increased slightly with increased tube potential (Fig. 5),due to a greater number of high energy photons above thek-edge of iodine at 33.2 keV (Fig. 1). Importantly, the relativelylow tube potentials (45 and 70 kVp) used in laboratory micro-CT systems produce a mean photon energy which is wellbelow, and thus not optimal for leveraging, the k-edge ofhafnium relative to gold and iodine. Thus, laboratory micro-CTsystems do not reflect relative differences in the X-ray attenu-ation of the contrast agents when imaging higher tube poten-tials used clinically.
The same phantoms were, therefore, also imaged using aconventional clinical CT (Siemens SOMATOM DefinitionFlash) operating in single-source mode at higher tube poten-tials (80, 100, 120, and 140 kVp) and lower spatial resolution(∼300 µm). The X-ray attenuation of HfO2 NPs, Au NPs, andiodine increased linearly with molar concentration (p < 0.0001,R2 > 0.99), as expected. The effects of the group (composition),covariate (concentration), and interaction (slope) were all stat-istically significant (p > 0.0001, ANCOVA) at each tube poten-tial except 80 kVp, where only the effects of the compositionand concentration were statistically significant (p > 0.005,ANCOVA). At 80 kVp, differences in the measured X-ray attenu-ation rate (slope, HU mM−1) between the contrast agents werenot statistically significant (Fig. 6). However, at 100–140 kVp,HfO2 and Au NPs exhibited a greater X-ray attenuation ratecompared to iodine (p < 0.005, ANCOVA), and at 100 kVp, HfO2
NPs exhibited a greater X-ray attenuation rate compared to AuNPs (p < 0.005, ANCOVA) (Fig. 6). The X-ray attenuation rate foreach contrast agent decreased with increased peak tube poten-tial (p < 0.001, ANCOVA), but the amount of the decrease wasgreatest for iodine and least for HfO2 NPs (Fig. 6).
At tube potentials greater than 80 kVp using clinical CT,both HfO2 and Au NPs exhibited significantly improved con-
Fig. 5 The X-ray attenuation (HU) measured by micro-CT (ScancoµCT-80) at (a) 45 kVp and (b) 70 kVp for HfO2 NPs, Au NPs, and iodine(iohexol) at concentrations ranging from 0.5 to 50 mM. Error bars showone standard deviation of the mean for three replicates. Error bars notshown lie within the data point. The effects of the group (composition),covariate (concentration), and interaction (slope) were all statisticallysignificant at each tube potential (p > 0.0001, ANCOVA). The measuredX-ray attenuation rate (slope, HU mM−1) of HfO2 NPs was greater thaniodine but less than Au NPs (p < 0.0005, ANCOVA) at either tubepotential.
Paper Nanoscale
13630 | Nanoscale, 2016, 8, 13627–13637 This journal is © The Royal Society of Chemistry 2016

trast compared to iodine (Fig. 6). The greater X-ray attenuationof both HfO2 and Au NPs compared to iodine at clinical tubepotentials was due to the presence of a k-shell absorption edgefor hafnium and gold at 65.4 and 80.7 keV, respectively, whichaffects a greater proportion of incident photons at higher tubepotentials (Fig. 1). The improved contrast of Au NPs comparedto iodine was previously reported and attributed to this sameeffect.14 However, in the present study, we report the first datashowing superior contrast from HfO2 compared to Au NPs at100 kVp, and comparable contrast at 80, 120, 140 kVp (Fig. 6).The greater X-ray attenuation of HfO2 compared to Au NPs wasalso due to the favorable location of the k-shell absorptionedge for hafnium compared to the mean photon energy (andhighest count rate) of the photon energy spectrum in clinicalCT systems, which ranges from ∼20 keV to peak tube poten-tials of 80–140 kVp (Fig. 1). This potential advantage ofhafnium at clinical CT tube potentials was previously pre-dicted by simulations21,22 and measured for hafnium chloridesolutions,22 but was demonstrated in this study using HfO2
NPs. Thus, the results of this study suggest that HfO2 NPs may
provide a lower cost alternative to Au NPs as an X-ray contrastagent which also outperforms iodine and performs compar-ably, if not advantageously, to Au NPs. Furthermore, energy-dependent differences in the X-ray attenuation of contrastagents can also enable multi-agent imaging using nascentspectral CT imaging methods.46,47
The same phantoms were, therefore, also imaged using anovel preclinical spectral CT (MARS Bioimaging) operating at120 kVp and ∼300 µm spatial resolution, but utilizing aphoton-counting detector (Medipix3RX)48 to enable multi-energy imaging.49 Energy bins were set to 7.0–14.8, 14.8–33.1,33.1–65.0, 65.0–80.1, and 80.1–120 keV in order to leverage thek-shell absorption edge of iodine (33.2 keV), hafnium (65.4keV), and gold (80.7 keV). An excised rabbit femur was alsoembedded in agarose as an additional control to demonstratethe decomposition of the contrast agents versus bone.
Spectral CT enabled simultaneous color delineation andquantitative molecular imaging of the HfO2 NPs, Au NPs, andiodine contrast agents at 50 mM concentration, which is notpossible using conventional CT due to relatively similar overallattenuation (Fig. 7). Thus, multi-energy imaging within thefive selected energy bins enabled multi-agent or multi-materialimaging due to differences in the energy-dependent X-rayattenuation of each material (Fig. 1). The contrast agents werealso able to be clearly distinguished from bone and water,although there was a small amount of erroneous gold signalimmediately adjacent to the bone likely due to beam harden-ing (Fig. 7). Note that a Au NP concentration of 50 mM can bereadily achieved by targeted delivery and has been widelyreported to be nontoxic, suggesting that these concentrationsare suitable for in vivo preclinical imaging.15 Thus, novel con-trast agents like HfO2 NPs and spectral CT may act synergisti-cally to transform CT into a molecular imaging modality.
The combined results using a laboratory micro-CT, clinicalCT, and novel photon-counting spectral CT suggest that HfO2
NPs have considerable potential as an X-ray contrast agent.However, future work must investigate surface functionali-zation strategies for biostability and active targeting, as well ascytocompatibility. An in vitro toxicological assessment ofindustrial HfO2 NPs concluded that HfO2 NPs are relativelynon-toxic to living cells.50 An evaluation of the cytotoxicity ofthe HfO2 NPs prepared in this study is currently underway.Importantly, the utility of HfO2 NPs is not limited to X-ray con-trast, but also includes strong mid-infrared absorption forpotential photonic biosensing.
Optical properties
Transmission spectra of as-prepared HfO2 NPs calcined at575 °C were measured under vacuum from the far- (red curve)to mid-infrared (blue curve) using FTIR (Fig. 8a). The NPs weresandwiched between two 2.5 µm-thick Mylar films for wide-band measurements; therefore, the transmission spectrum ofthe Mylar films is shown for comparison in the inset and theabsorption bands characteristic of polyethylene terephthalate(Mylar) are indicated by gray shading. The HfO2 NP spectrawas obtained by dividing the spectra obtained with and
Fig. 6 (a) Representative grayscale image slices and (b) the X-rayattenuation rate (HU mM−1) measured by clinical CT (Siemens SomatomDefinition Flash) at 80, 100, 120, and 140 kVp for phantoms comprisingHfO2 NPs, Au NPs, and iodine (iohexol) at concentrations ranging from0.5 to 50 mM. The scale bar shows 10 mm. Error bars show one stan-dard error from linear least-squares regression of the X-ray attenuationvs. concentration. The effects of the group (composition), covariate(concentration), and interaction (slope) were all statistically significant(p > 0.0001, ANCOVA) at each tube potential except 80 kVp, where onlythe effects of the composition and concentration were statisticallysignificant (p > 0.005, ANCOVA). Asterisks show statistically significantdifferences between contrast agents at a given tube potential (p <0.005, ANCOVA).
Nanoscale Paper
This journal is © The Royal Society of Chemistry 2016 Nanoscale, 2016, 8, 13627–13637 | 13631

without NPs to remove absorption from the thin Mylar films.Nonetheless, some artifacts remained in the NP spectra due tostrong absorption in the thin films and are shown by grayshading (Fig. 8a). Importantly, the low transmittance from∼250 to 800 cm−1 was due to strong optical absorption in theReststrahlen band of HfO2 (Fig. 8a). In this spectral region, thepermittivity of the NPs can be negative.
The mid-infrared transmission spectra of HfO2 NPs wasalso measured by sandwiching NPs between two KBr windowsto enable the observation of absorptions due to opticalphonon modes. HfO2 NPs exhibited five minima in the trans-mission spectra at 421, 521, 596, 679, and 766 cm−1 (Fig. 8b).The transmission spectrum was fit using a multiple-oscillatormodel (dashed red curve),29 which showed good agreementbetween the model and experimental data (Fig. 8b). The fit para-meters were also in agreement with FTIR measurements ofmonoclinic HfO2 thin films and density functional perturbationtheory calculations.29,51 The permittivity of HfO2 NPs was sub-sequently determined using the multiple-oscillator model(Fig. 8b, inset) and was negative below 695 cm−1 (14.4 µm). There-fore, HfO2 NPs were predicted to support local surface phononpolariton modes (Re(ε) ≈ −2) at several frequencies, which maybe useful for optical biosensing applications leveraging surfaceenhanced mid-infrared or phonon polariton absorption.11
Conclusions
HfO2 NPs exhibited strong absorption of X-ray and mid-infra-red radiation suggesting utility as a multifunctional diagnosticprobe for X-ray CT and/or mid-infrared biosensing. Sphericaland monodispersed HfO2 NPs with a tunable mean diameter
in the range of ∼7–31 nm, which is suitable for in vitro labelingand in vivo delivery, were prepared by a sol–gel process, calcin-ing a polymerized complex at 500–950 °C, and were surfacefunctionalized with polyvinylpyrrolidone. The X-ray attenu-ation (HU) of HfO2 NPs was measured over 0.5–50 mM con-centration and compared with Au NPs and iodine, which arethe most prominent X-ray contrast agents currently used inresearch and clinical diagnostic imaging, respectively. In alaboratory micro-CT operating at relatively low tube potentials(<80 kVp), both HfO2 and Au NPs exhibited significantlygreater contrast (HU mM−1) compared to iodine, and Au NPsalso exhibited significantly greater contrast compared to HfO2,but the relatively low tube potentials used in a laboratorymicro-CT did not take advantage of the k-edge of hafnium andwere not reflective of clinical CT. In a clinical CT operating athigher tube potentials (>80 kVp,) HfO2 NPs exhibited superioror similar contrast compared to Au NPs, while both exhibitedsignificantly greater contrast compared to iodine, due to thefavorable location of the k-shell absorption edge for hafniumand to a lesser extent gold. Therefore, HfO2 NPs offer analternative to Au NPs as an X-ray contrast agent which also out-performs iodine and performs comparably, if not advanta-geously, to Au NPs. Additionally, in a novel spectral CToperating at 120 kVp and utilizing a photon-counting detector,multi-energy imaging enabled simultaneous quantitativemolecular imaging of HfO2 NPs, Au NPs, and iodine due toenergy-dependent differences in the X-ray attenuation of eachagent. HfO2 NPs also exhibited a strong mid-infrared absorp-tion in the Reststrahlen band from ∼250 to 800 cm−1 and nega-tive permittivity below 695 cm−1, which can support localizedsurface phonon polariton modes at several frequencies. There-fore, HfO2 NPs may also enable development of mid-infrared
Fig. 7 Spectral CT (MARS Bioimaging) images of (clockwise from top) water, 50 mM Au NPs (red), 50 mM iodine (blue), a rabbit femur (white), and50 mM HfO2 NPs (green). (a) A representative 2D grayscale image slice showing the inability of a conventional CT image to distinguish NP compo-sitions, and the greater signal of bone compared to 50 mM concentrations. (b) A representative 2D spectral CT image slice showing clear, color deli-neation and quantitative molecular imaging of the contrast agent compositions at 50 mM concentration versus bone and water. (c) A 3D spectral CTreconstruction showing NP compositions versus bone.
Paper Nanoscale
13632 | Nanoscale, 2016, 8, 13627–13637 This journal is © The Royal Society of Chemistry 2016

biosensors and contrast agents, leveraging surface enhancedmid-infrared and/or phonon polariton absorption.
Experimental methodsHfO2 nanoparticle (NP) synthesis and surface modification
HfO2 NPs were prepared by a sol–gel process using a polymer-ized complex, adapting previously established methods.38
Aqueous reaction solutions were prepared by adding 0.208 Mhafnium(IV) chloride, HfCl4 (99.9%, Alfa Aesar, Ward Hill, MA),to 24 mL of 2.08 M citric acid (ACS reagent, Fisher Scientific,Pittsburgh, PA) and stirring overnight to ensure complete dis-solution. 0.2 M ethylene glycol (ACS reagent, BDH Chemicals,Radnor, PA) was added to the solution under continuous stir-ring for 3 h at 90 °C to boil off excess water. The resulting gelwas subsequently calcined for 2 h in a preheated furnace at500, 575, 650, 800, and 950 °C to pyrolize the remaining organ-ics and crystallize HfO2 NPs. The resulting HfO2 powder wasground using a mortar and pestle prior to further preparationsand characterization. As-prepared HfO2 NPs were surface func-tionalized by adding 1 wt% polyvinylpyrrolidone (PVP,Mw = 40 000, Sigma-Aldrich, St Louis, MO) to solutionscontaining 50–100 mM HfO2 NPs and stirring overnight.
X-ray diffraction (XRD)
The crystallographic phase and crystallite size of as-preparedHfO2 NPs was characterized by powder X-ray diffraction (XRD)(D8 Advance with Da Vinci, Bruker Corp., Madison, WI) usingCu Kα radiation generated at 40 kV and 40 mA. Powdersamples were examined over 20–42° two-theta with a 0.01° stepsize, 2.0 s step time, and continuous sample rotation. Theprimary crystallite size was measured from peak broadening ofthe 110, 011, 1̄11, 111, 200, 020, and 002 reflections using theScherrer equation,
τ ¼ Kλβ cosðθÞ
where τ is the crystallite size (nm), K is a shape factor set equalto 0.9, λ is the X-ray wavelength (1.5406 nm), β is the full-widthat half maximum (FWHM) peak intensity, and θ is the Braggangle.52 The FWHM was measured after background subtrac-tion and peak fitting with a Pearson 7 function (OriginPro2016, OriginLab Corp., Northampton, MA). Instrument broad-ening was corrected using Warren’s method as,
β ¼ffiffiffiffiffiffiffiffiffiffiffiffiffiffiffiffiffiffiffiffiffiffiffiffiffiβexp2 � βstd2
q
where β is the corrected peak broadening, βexp is the measuredFWHM of the HfO2 NP sample, and βstd is the measuredFWHM of a microscale HfO2 powder standard (99.95% purity,Materion Advanced Chemicals Inc., Milwaukee, WI).52 Hall–Williamson analysis53 revealed that the effect of lattice strainwas not statistically significant by least squares linearregression (JMP® 11.0, SAS Institute, Inc., Cary, NC) for eachcalcination temperature (p > 0.27); therefore, the crystallitesize was measured as the mean (±standard deviation) from allXRD reflections.
Transmission electron microscopy (TEM)
TEM samples were prepared from dispersions of as-preparedHfO2 NPs and PVP–HfO2 NPs. As-prepared HfO2 NPs wereredispersed in deionized (DI) water at 25 mM. PVP–HfO2 NPswere collected by centrifugation (Sorvall RC 6 Plus, ThermoScientific, Wilmington, DE) at ∼17 000g for 1 h, redispersed in
Fig. 8 (a) Far- (red) and mid-infrared (blue) transmission spectrum for∼22.5 nm HfO2 NPs between two thin (2.5 µm) Mylar films. The insetshows the measured transmission spectrum for the Mylar films withoutNPs and the gray shading indicates regions of strong absorption thatcause artifacts in the NP transmission spectrum. The low transmittancefrom ∼250 to 800 cm−1 is due to strong optical absorption in the Rest-strahlen band of HfO2, where the permittivity can be negative. (b) Aportion of the measured mid-infrared transmission spectrum for HfO2
NPs between two KBr windows showing the measured spectrum (blue)and the best fit calculated by nonlinear least squares regression (dashedred). The inset shows the real (solid red) and imaginary (dot-dash red)parts of the multiple-oscillator permittivity extracted via the fittingprocess.
Nanoscale Paper
This journal is © The Royal Society of Chemistry 2016 Nanoscale, 2016, 8, 13627–13637 | 13633

10 mL of ethanol at 5 mM, and subjected to ultrasonication(model 500, Fisher Scientific, Pittsburgh, PA) twice for 1.5 minpulsed at 40 cycles per min with a 67% duty cycle and 25%amplitude. TEM samples were prepared by pipetting a 10 µLaliquot onto a carbon-coated, copper grid (Model 01813-F, TedPella, Redding, CA) which was placed in an oven at 60 °C toevaporate the solvent, followed by pipetting and evaporating asecond 10 µL aliquot. As-prepared and PVP–HfO2 NP sampleswere imaged by TEM (JEOL 2011T, JEOL, Peabody, MA) at anaccelerating voltage of 200 kV and a beam current of 102 mA.NP diameter and aspect ratio were calculated as the mean andratio, respectively, of the measured prolate and equatorial par-ticle diameter. The mean (±standard deviation) NP diameterand aspect ratio was measured for a sample of 100 NPs perexperimental group.
Dynamic light scattering (DLS)
The hydrodynamic particle diameter distribution of as-prepared HfO2 NPs and PVP–HfO2 NPs calcined at 575 °C wasmeasured using dynamic light scattering (DLS, Zetasizer NanoZS90, Malvern Instruments Ltd, Worcestershire, UK). As-prepared HfO2 NPs were dispersed in DI water at 5 mM concen-tration and allowed to settle overnight such that the stablesupernatant was characterized by DLS. PVP–HfO2 NPs weredispersed in DI water at 0.25 mM concentration and incubatedin 2 mL of 4 M NaOH in DI water at 60 °C for 72 h followed byultrasonication for 2 min pulsed at 35 cycles per min with a60% duty cycle and 40% amplitude. Aliquots from this dis-persion were subsequently diluted 100×, filtered (0.2 µm cell-ulose acetate membrane syringe filter, VWR, Radnor, PA),ultrasonicated again as described above, and characterized byDLS. The mean hydrodynamic diameter and standard devi-ation of the distribution were measured as the mean of threesamples.
NP characterization statistical methods
Differences in the mean NP crystallite size (XRD), diameter(TEM), and aspect ratio (TEM) between calcination tempera-tures were compared using one-way analysis of variance(ANOVA) (JMP® 11.0). A log transform was applied to theaspect ratio data to provide a normal distribution for statisticalanalysis. Post hoc comparisons were performed using Tukey–Kramer HSD tests. Differences between the mean NP crystallitesize (XRD) and diameter (TEM) at the same calcination temp-erature were compared using t-tests. The level of significancefor all tests was set at p < 0.05.
Imaging phantom preparation
Imaging phantoms were prepared from PVP–HfO2 NPs cal-cined at 575 °C and dispersed in DI water at 100 mM concen-tration by ultrasonication (model 500, Fisher Scientific,Pittsburgh, PA) for 1.5 min pulsed at 40 cycles per min with a67% duty cycle and 20% amplitude. Serial dilutions contain-ing 40, 20, 10, and 1 mM PVP–HfO2 NPs were prepared fromthe 100 mM stock solution. A 2% agarose solution was pre-pared by dissolving agarose (molecular biology grade, Thermo
Scientific, Rockford, IL) in DI water under microwave heatingfor 2 min. PVP–HfO2 NP solutions were mixed with the 2%agarose solution in equal parts by volume to create solutionscontaining 0.5, 5, 10, 20, and 50 mM PVP–HfO2 NPs dispersedin 1% agarose. Three 1 mL aliquots for each concentrationwere pipetted into separate 1.5 mL Eppendorf tubes and solidi-fied rapidly on ice.
Imaging phantoms were also prepared from solutions of AuNPs and iodine for comparison to HfO2 NPs. Au NPs were pre-pared with a mean particle diameter of ∼13 nm using thecitrate reduction, as described in detail elsewhere.43 As-pre-pared Au NPs were surface functionalized by adding 1 wt%polyvinylpyrrolidone (PVP, Mw = 40 000, Sigma-Aldrich) to a0.5 mM solution under stirring overnight and concentrated toa ∼100 mM stock solution by centrifugation at ∼19 000g for1 h. A 100 mM iodine stock solution was prepared by dissol-ving iohexol (EP reference standard, Sigma-Aldrich) in DIwater. Note that 1 mole of iohexol contains 3 moles of iodine.PVP–Au NP or iodine solutions were mixed with the 2%agarose solution in equal parts by volume to create solutionscontaining 0.5, 5, 10, 20, and 50 mM PVP–Au NPs or iodinedispersed in 1% agarose. Three 1 mL aliquots for each concen-tration were pipetted into separate 1.5 mL Eppendorf tubesand solidified rapidly on ice.
Gold concentrations in stock solutions and the accuracy ofserial dilutions was verified using inductively coupled plasma-optical emission spectroscopy (ICP-OES, Optima 7000, PerkinElmer) after digesting samples in 3% aqua regia (3 parts HClto 1 part HNO3). Calibration curves were created by dilutingcertified standard gold solutions (Assurance Grade, SPEXCertiPrep, Metuchen, NJ). Gold concentrations targeted by serialdilution and those measured by ICP-OES were highly corre-lated by linear least squares regression (R2 = 0.999) and differ-ences were not statistically significant (p > 0.83, paired t-test).
X-ray computed tomography (CT)
Phantoms were imaged using a laboratory micro-CT (µCT-80,Scanco Medical AG, Brüttisellen, Switzerland) with a conebeam X-ray source, 0.5 mm thick aluminum filter, and circularscan at 800 ms integration time, 10 µm isotropic resolution,and two energy levels: 45 kVp at 177 µA and 70 kVp at 113 µA.X-ray attenuation was measured for each contrast agent com-position and concentration, as well as air and water controlsamples, within a cylindrical volume-of-interest (VOI), 0.72 cmin diameter, over 10 image slices (10 µm thickness) centeredwithin the Eppendorf tube, corresponding to a 4.1 µL samplevolume.
The same phantoms were also imaged using a clinical dual-energy CT (SOMATOM Definition Flash, Siemens, Malvern, PA)in single source acquisition mode with a cone beam X-raysource, bowtie filter, 0.4 mm tin filter, and helical scan at mul-tiple energy levels: 80, 100, 120, and 140 kVp at an effectivecurrent of 85 mAs. Images were acquired using the inner earultra-high resolution (InnerEarUHR) protocol with a 512 ×512 matrix, 16 × 0.3 mm field of view, and 2 mm slice thick-ness. The reconstruction kernel was U75u very sharp ASA.
Paper Nanoscale
13634 | Nanoscale, 2016, 8, 13627–13637 This journal is © The Royal Society of Chemistry 2016

X-ray attenuation was measured for each contrast agent com-position and concentration, as well as air and water controlsamples, within a cylindrical VOI, 0.32 cm in diameter, over 7image slices (2 mm thickness) centered within the Eppendorftube, corresponding to a 112.6 µL sample volume.
Measured linear attenuation coefficients (µ) were convertedto Hounsfield units (HU) using an internal sample calibrationwith the mean linear attenuation coefficients measured for air(−1000 HU) and water (0 HU). The X-ray attenuation of theHfO2 NPs, Au NPs, and iodine was reported in HU as the mean(±standard deviation) of three replicates for each concentrationand plotted as a function of concentration. Differencesbetween contrast agents and tube potentials were examined bycomparing attenuation rates (HU mM−1) calculated fromlinear least-squares regression (JMP® 11.0) of the measuredX-ray attenuation versus concentration.14,17 The effects of thecontrast agent composition, concentration, X-ray tube poten-tial, and their interactions on the measured X-ray attenuationwere examined by analysis of covariance (ANCOVA) using aBonferroni correction for multiple pairwise comparisons. Thelevel of significance for all tests was set at p < 0.05. Note thatthe background attenuation due to agarose in the samplephantoms was negligible as the difference in linear attenu-ation as a function of tube potential between water and 1%agarose was not statistically significant for either the laboratorymicro-CT or the clinical CT (p > 0.50, ANCOVA).
Photon-counting spectral X-ray CT
The same phantoms imaged by conventional X-ray CT werealso imaged using a preclinical spectral CT (MARS BioimagingLtd, Christchurch, NZ) equipped with a photon-countingdetector comprising a CdZnTe semiconductor ball-bonded tothe Medipix3RX (CERN, Geneva, Switzerland) application-specific integrated circuit.49 Images were acquired using a con-ventional polychromatic X-ray source (SB-120-350, Source-Ray,Inc., Ronkonkoma, NY) operating at 120 kVp and 18 µA with a1.96 mm thick aluminum filter, and a continuous helical scanwith a circular field of view 40 mm in diameter, 200 ms inte-gration time, and 100 µm isotropic voxel size. An excisedrabbit femur was also embedded in 1% agarose and imaged asan additional control sample for comparison. The photon-counting detector enabled simultaneous image acquisitionswithin multiple energy bins, including 7.0–14.8, 14.8–33.1,33.1–65.0, 65.0–80.1, and 80.1–120 keV. These windows werechosen to leverage the k-shell absorption edge of iodine (33.2keV), hafnium (65.4 keV), and gold (80.7 keV).45 Quantitativematerial decomposition (spectral unmixing) was performedusing a quadratic programming algorithm54 in Matlab (v8.5,Mathworks, Natick, MA) which was calibrated by the measuredX-ray attenuation of 50 mM NP concentrations, a bonemimicking composition containing 40 vol% hydroxyapatite,55
acrylic plastic, 1% agarose, and water. The fractional abun-dance of gold, hafnium, and iodine were then assigned to RGBchannels, respectively, and scaled to mM concentrations. 2Dimage slices and 3D reconstructions were produced usingMARSvision software (MARS Bioimaging Ltd).
Fourier transform infrared (FTIR) spectroscopy
The transmission spectra of as-prepared HfO2 NPs calcined at575 °C were characterized under vacuum by FTIR (Vertex 80v,Bruker Corp., Billerica, MA). Room-temperature DLaTGS detec-tors with mid-infrared and far-infrared transparent windowswere used with KBr and Mylar beamsplitters to measurespectra in the mid- and far-infrared, respectively. HfO2 NPswere sandwiched between 2.5 µm thick Mylar films and KBrwindows for broadband and mid-IR measurements, respect-ively. The average of 1000 collected spectra was reported using4 cm−1 spectral resolution. The background was measured andaccounted in the transmittance results.
The mid-infrared transmission spectra measured using theKBr windows were numerically fit via a nonlinear least-squaresprocess using a multiple-oscillator model for the frequency-dependent permittivity and transfer matrix code to simulatethe transmission. The permittivity is given by,
ε νð Þ ¼ A2 þ Cν2 þXk
νpk2
νk2 þ ν2 � iγkν
where ε is the permittivity, A and C are constants from theCauchy formula, ν is frequency, νpk is the plasma frequency,νk is the resonance frequency, γpk is the dampening coefficient,and k is the phonon mode.29
Acknowledgements
This work was supported the National Science Foundation(NSF DMR-1309587 and ECCS-1420176), Defense AdvancedResearch Projects Agency (DARPA-14-56-A2P-PA-055), and anEngineering Novel Solutions to Cancer’s Challenges at theInterdisciplinary Interface (ENSCCII) Training Grant (TLM)from the Walther Cancer Foundation. The authors acknowl-edge the Notre Dame Materials Characterization Facility forXRD, the Notre Dame Integrated Imaging Facility (NDIIF)for electron microscopy, the Notre Dame Center for Environ-mental Science and Technology (CEST) for ICP-OES, and theSt. Joseph Regional Medical Center (Mishawaka, IN) forclinical CT.
References
1 Y. Aoki, T. Kunitake and A. Nakao, Sol-gel fabrication ofdielectric HfO2 nano-films; formation of uniform, void-freelayers and their superior electrical properties, Chem.Mater., 2005, 17, 450–458.
2 L. Armelao, H. Bertagnolli, D. Bleiner, M. Groenewolt,S. Gross, V. Krishnan, C. Sada, U. Schubert, E. Tondelloand A. Zattin, Highly dispersed mixed zirconia and hafniananoparticles in a silica matrix: First example of a ZrO2-HfO2-SiO2 ternary oxide system, Adv. Funct. Mater., 2007,17, 1671–1681.
3 C. LeLuyer, M. Villanueva-Ibaflez, A. Pillonnet andC. Dujardin, HfO2:X (X=Eu3+, Ce3+, Y3+) sol gel powders for
Nanoscale Paper
This journal is © The Royal Society of Chemistry 2016 Nanoscale, 2016, 8, 13627–13637 | 13635

ultradense scintillating materials, J. Phys. Chem. A, 2008,112, 10152–10155.
4 C. Liu, T. J. Hajagos, D. Kishpaugh, Y. Jin, W. Hu, Q. Chenand Q. Pei, Facile single-precursor synthesis and surfacemodification of hafnium oxide nanoparticles for nano-composite γ-ray scintillators, Adv. Funct. Mater., 2015, 25,4607–4616.
5 L. Maggiorella, G. Barouch, C. Devaux, A. Pottier,E. Deutsch, J. Bourhis, E. Borghi and L. Levy, Nanoscaleradiotherapy with hafnium oxide nanoparticles, FutureOncol., 2012, 8, 1167–1181.
6 J. Marill, N. M. Anesary, P. Zhang, S. Vivet, E. Borghi andL. Levy, Hafnium oxide nanoparticles: Toward an in vitropredictive biological effect?, Radiat. Oncol., 2015, 9, 150(11 pages).
7 S. J. L. Ribeiro, Y. Messaddeq, R. R. Gonçalves, M. Ferrari,M. Montagna and M. A. Aegerter, Low optical loss planarwaveguides prepared in an organic–inorganic hybridsystem, Appl. Phys. Lett., 2000, 77, 3502–3504.
8 R. R. Gonçalves, G. Carturan, M. Montagna, M. Ferrari,L. Zampedri, S. Pelli, G. C. Righini, S. J. L. Ribeiro andY. Messaddeq, Erbium-activated HfO2-based waveguides forphotonics, Opt. Mater., 2004, 25, 131–139.
9 R. Chow, S. Falabella, G. E. Loomis, F. Rainer, C. J. Stolzand M. R. Kozlowski, Reactive evaporation of low-defectdensity hafnia, Appl. Opt., 1993, 32, 5567–5574.
10 A. J. Waldorf, J. A. Dobrowolski, B. T. Sullivan andL. M. Plante, Optical coatings deposited by reactive ionplating, Appl. Opt., 1993, 32, 5583–5593.
11 J. D. Caldwell, L. Lindsay, V. Giannini, I. Vurgaftman,T. L. Reinecke, S. A. Maier and O. J. Glembocki, Infraredand terahertz nanophotonics using surface phonon polari-tons, Nanophotonics, 2015, 4, 44–68.
12 K. Feng, W. Streyer, Y. Zhong, A. J. Hoffman andD. Wasserman, Photonic materials, structures and devicesfor Reststrahlen optics, Opt. Express, 2015, 23, A1418–A1433.
13 J. F. Hainfeld, D. N. Slatkin, T. M. Focella andH. M. Smilowitz, Gold nanoparticles: A new X-ray contrastagent, Brit. J. Radiol., 2006, 79, 248–253.
14 M. W. Galper, M. T. Saung, V. Fuster, E. Roessl, A. Thran,R. Proksa, Z. A. Fayad and D. P. Cormode, Effect of computedtomography scanning parameters on gold nanoparticle andiodine contrast, Invest. Radiol., 2012, 47, 475–481.
15 L. E. Cole, R. D. Ross, J. Tilley, T. Vargo-Gogola andR. K. Roeder, Gold nanoparticles as contrast agents inX-ray imaging and computed tomography, Nanomedicine,2015, 10, 321–341.
16 O. Rabin, J. Manuel Perez, J. Grimm, G. Wojtkiewicz andR. Weissleder, An X-ray computed tomography imagingagent based on long-circulating bismuth sulphide nano-particles, Nat. Mater., 2006, 5, 118–122.
17 A. L. Brown, P. C. Naha, V. Benavides-Montes, H. I. Litt,A. M. Goforth and D. P. Cormode, X-ray opacity, and bio-logical compatibility of ultra-high payload elementalbismuth nanoparticle X-ray contrast agents, Chem. Mater.,2014, 26, 2266–2274.
18 P. J. Bonitatibus Jr., A. S. Torres, G. D. Goddard,P. F. FitzGerald and A. M. Kulkarni, Synthesis, characteriz-ation, and computed tomography imaging of a tantalumoxide nanoparticle imaging agent, Chem. Commun., 2010,46, 8956–8958.
19 M. H. Oh, N. Lee, H. Kim, S. P. Park, Y. Piao, J. Lee,S. W. Jun, W. K. Moon, S. H. Choi and T. Hyeon, Large-scale synthesis of bioinert tantalum oxide nanoparticles forX-ray computed tomography imaging and bimodal image-guided sentinel lymph node mapping, J. Am. Chem. Soc.,2011, 133, 5508–5515.
20 A. Jakhmola, N. Anton, H. Anton, N. Messaddeq,F. Hallouard, A. Klymchenko, Y. Mely and T. F. Vandamme,Poly-ε-caprolactone tungsten oxide nanoparticles as a con-trast agent for X-ray computed tomography, Biomaterials,2014, 35, 2981–2986.
21 T. Nowak, M. Hupfer, R. Brauweiler, F. Eisa andW. A. Kalender, Potential of high-Z contrast agents in clini-cal contrast-enhanced computed tomography, Med. Phys.,2011, 38, 6469–6482.
22 A.-C. Roessler, M. Hupfer, D. Kolditz, G. Jost, H. Pietschand W. A. Kalender, High atomic number contrast mediaoffer potential for radiation dose reduction in contrast-enhanced computed tomography, Invest. Radiol., 2016, 51,249–254.
23 U.S. Geological Survey Scientific Investigations Report2012-5188, Metal prices in the United States through 2010,U.S. Geological Survey, Reston, VA, 2013. Available athttp://pubs.usgs.gov/sir/2012/5188.
24 M. J. Berger, J. H. Hubbell, S. M. Seltzer and J. Chang,XCOM: Photon cross section database (version 1.5), NationalInstitute of Standards and Technology, Gaithersburg, MD,2010. Available at http://physics.nist.gov/xcom.
25 J. H. Hubbell and S. M. Seltzer, Table of X-ray mass attenu-ation coefficients and mass energy-absorption coefficients(version 1.4), National Institute of Standards and Techno-logy, Gaithersburg, MD, 2004. Available at http://physics.nist.gov/xaamdi.
26 P. K. Jain, K. S. Lee, I. H. El-Sayed and M. A. El-Sayed,Calculated absorption and scattering properties of goldnanoparticles of different size, shape, and composition:Applications in biological imaging and biomedicine,J. Phys. Chem. B, 2006, 110, 7238–7248.
27 J. N. Anker, W. P. Hall, O. Lyandres, N. C. Shah, J. Zhao andR. P. Van Duyne, Biosensing with plasmonic nanosensors,Nat. Mater., 2008, 7, 442–453.
28 K. A. Willets and R. P. Van Duyne, Localized surfaceplasmon resonance spectroscopy and sensing, Annu. Rev.Phys. Chem., 2007, 58, 267–297.
29 T. J. Bright, J. I. Watjien, Z. M. Zhang, C. Muratore andA. A. Voevodin, Optical properties of HfO2 thin filmsdeposited by magnetron sputtering: From the visibleto the far-infrared, Thin Solid Films, 2012, 520, 6793–6802.
30 Powder Diffraction File 34-0104, HfO2, Hafnium oxide,Joint Committee on Powder Diffraction Standards (JCPDS),
Paper Nanoscale
13636 | Nanoscale, 2016, 8, 13627–13637 This journal is © The Royal Society of Chemistry 2016

International Center for Diffraction Data (ICDD), NewtonSquare, PA, 2001.
31 M. Yoshimura and S. Somiya, Hydrothermal synthesis ofcrystallized nano-particles of rare earth-doped zirconia andhafnia, Mater. Chem. Phys., 1999, 61, 1–8.
32 P. E. Meskin, F. Y. Sharikov, V. K. Ivanov, B. R. Churagulovand Y. D. Tretyakov, Rapid formation of nanocrystallineHfO2 powders from amorphous hafnium hydroxide underultrasonically assisted hydrothermal treatment, Mater.Chem. Phys., 2007, 104, 439–443.
33 A. Sahraneshin, S. Takami, D. Hojo, K. Minami, T. Aritaand T. Adschiri, Synthesis of shape-controlled and organic-hybridized hafnium oxide nanoparticles under sub- andsupercritical hydrothermal conditions, J. Supercrit. Fluids,2012, 62, 190–196.
34 A. Sahraneshin, S. Asahina, T. Togashi, V. Singh,S. Takami, D. Hojo, T. Arita, K. Minami and T. Adschiri,Surfactant-assisted hydrothermal synthesis of water-disper-sible hafnium oxide nanoparticles in highly alkalinemedia, Cryst. Growth Des., 2012, 12, 5219–5226.
35 J. Buha, D. Arčon, M. Niederberger and I. Djerdj, Solvo-thermal and surfactant-free synthesis of crystalline Nb2O5,Ta2O5, HfO2, and co-doped HfO2 nanoparticles, Phys.Chem. Chem. Phys., 2010, 12, 15537.
36 A. Lauria, I. Villa, M. Fasoli, M. Niederberger and A. Vedda,Multifunctional role of rare earth doping in opticalmaterials: Nonaqueous sol–gel synthesis of stabilized cubicHfO2 luminescent nanoparticles, ACS Nano, 2013, 7, 7041–7052.
37 J. Tang, J. Fabbri, R. D. Robinson, Y. Zhu, I. P. Herman,M. L. Steigerwald and L. E. Brus, Solid-solution nano-particles: Use of a nonhydrolytic sol–gel synthesis toprepare HfO2 and HfxZr1−xO2 nanocrystals, Chem. Mater.,2004, 16, 1336–1342.
38 R. Ramos-González, L. A. García-Cerda, H. N. Alshareef,B. E. Gnade and M. A. Quevedo-López, Study of hafnium(IV) oxide nanoparticles synthesized by polymerizedcomplex and polymer precursor derived sol-gel methods,Mater. Sci. Forum, 2010, 644, 75–78.
39 R. Ramos-González, L. A. García-Cerda and M. A. Quevedo-López, Study of the surface modification with oleic acid ofnanosized HfO2 synthesized by the polymerized complexderived sol–gel method, Appl. Surf. Sci., 2012, 258, 6034–6039.
40 J. H. West and N. J. Halas, Engineered nanomaterials forbiophotonics applications: Improving sensing, imaging,and therapeutics, Annu. Rev. Biomed. Eng., 2003, 5, 285–292.
41 E. Oh, J. B. Delehanty, K. E. Sapsford, K. Susumu,R. Goswami, J. B. Blanco-Canosa, P. E. Dawson, J. Granek,M. Shoff, Q. Zhang, P. L. Goering, A. Huston andI. L. Medintz, Cellular uptake and fate of PEGylated goldnanoparticles is dependent on both cell-penetration pep-tides and particle size, ACS Nano, 2011, 5, 6434–6448.
42 N. Dahal and V. Chikan, Synthesis of hafnium oxide-goldcore–shell nanoparticles, Inorg. Chem., 2012, 51, 518–522.
43 R. D. Ross, L. E. Cole, J. Tilley and R. K. Roeder, Effects offunctionalized gold nanoparticle size on X-ray attenuationand substrate binding affinity, Chem. Mater., 2014, 26,1187–1194.
44 J. H. Hubbell, H. A. Gimm and I. Overbo, Pair, triplet, andtotal atomic cross sections (and mass attenuation coeffi-cients) for 1 MeV-100 GeV photons in elements Z=1 to 100,J. Phys. Chem. Ref. Data, 1980, 9, 1023–1147.
45 R. D. Deslattes, E. G. Kessler Jr., P. Indelicato, L. de Billy,E. Lindroth and J. Anton, X-ray transition energies: Newapproach to a comprehensive evaluation, Rev. Mod. Phys.,2003, 75, 35–99.
46 N. G. Anderson and A. P. Butler, Clinical applications ofspectral molecular imaging: Potential and challenges,Contrast Media Mol. Imaging, 2014, 9, 3–12.
47 X. Wang, D. Meier, K. Taguchi, D. J. Wagenaar, B. E. Pattand E. C. Frey, Material separation in X-ray CT with energyresolved photon-counting detectors, Med. Phys., 2011, 38,1534–1546.
48 R. Ballabriga, M. Campbell, E. Heijne, X. Llopart,L. Tlustos and W. Wong, Medipix3: A 64 k pixel detectorreadout chip working in single photon counting mode withimproved spectrometric performance, Nucl. Instrum.Methods Phys. Res., Sect. A, 2011, 633, S15–S18.
49 M. F. Walsh, S. J. Nik, S. Procz, M. Pichotka, S. T. Bell,C. J. Bateman, R. M. N. Doesburg, N. De Ruiter,A. I. Chernoglazov, R. K. Panta, A. P. H. Butler andP. H. Butler, Spectral CT data acquisition with Medipix3.1,J. Instrum., 2013, 8, P10012.
50 J. A. Field, A. Luna-Velasco, S. A. Boitano, F. Shadman,B. D. Ratner, C. Barnes and R. Sierra-Alvarez, Cytotoxicityand physicochemical properties of hafnium oxide nano-particles, Chemosphere, 2011, 84, 1401–1407.
51 B. Zhou, H. Shi, X. D. Zhang, Q. Su and Z. Y. Jiang, Thesimulated vibrational spectra of HfO2 polymorphs, J. Phys.D: Appl. Phys., 2014, 47, 115502.
52 B. D. Cullity, Elements of X-Ray Diffraction, Addison-WesleyPublishing Company, Inc., Reading, MA, 1978, pp.284–285.
53 G. K. Williamson and W. H. Hall, X-ray line broadeningfrom filed aluminium and wolfram, Acta Metall., 1953, 1,22–31.
54 K. Themelis and A. A. A. Rontogiannis, A soft constrainedMAP estimator for supervised hyperspectral signal unmix-ing, Proc. Eur. Signal Proc. Conf. (EUSIPCO), Lausanne,Switzerland, 2008.
55 J. M. Deuerling, D. J. Rudy, G. L. Niebur and R. K. Roeder,Improved accuracy of cortical bone mineralizationmeasured by polychromatic micro-computed tomographyusing a novel high mineral density composite calibrationphantom, Med. Phys., 2010, 37, 5138–5145.
Nanoscale Paper
This journal is © The Royal Society of Chemistry 2016 Nanoscale, 2016, 8, 13627–13637 | 13637