~c:;90) analliical l~id- ex~ebibental and n11-32s03 steel ... · csc! 13l experimental and ... in...
TRANSCRIPT

(NASA-TM-X-7 ~C:;90) ANALliICAL L~iD- "EX~EBIBENTAL AND STEEL SPUR GFARSL~::S~)ElA2TI7CN FOB AISI 9310
P HC A03/M.F A01
NASA TECHNICAL MEMORANDUM
CSC! 13l
EXPERIMENTAL AND ANALYTICAL LOAD-LIFE RELATION
FOR AISI 9310 STEEL SPUR GEARS
by D. P. Townsend, J. "J. Coy, and E. V. Zaretsky Lewis Research Center Cleveland, Ohio 44135
TECHNICAL PAPER to be presented at the 1977 International Gear Conference sponsored by the American Society of Mechanical Engineers Chicago, Illinois, September 28 -30, 1977
G3/37
N11-32S03
Unclas ~90B6
NASA TM X-73590
;'1", ; ~
li \:
https://ntrs.nasa.gov/search.jsp?R=19770025559 2018-08-06T14:23:48+00:00Z
EXPERIMENTAL AND ANALYTICAL LOAD-LIFE RELATION
FOR AISI 9310 STEEL SPUR GEARS
by D. P. Townsend, J. J. Coy, and E. V. Zaretsky
National Aeronautics and Space Administration Lewis Research Center Cleveland, Ohio 44135
ABSTRACT
Life tests were conducted at three different loads with three groups
of 8. 9 cm (3. 5 in. ) pitch diameter spur gears made of vacuum arc re
melted VAR AlSI 9310 steel. Life was found to vary inversely with load
to the 4.3 and 5.1 power at the L10 and L50 life levels, respectively.
The Weibull slope varied linearly with maximum Hertz contact stress,
having an average value of 2.5. The test data when compared to AGMA
standards showed a steeper slope for the load-life diagram.

EXPERIMENTAL AND ANALYTICAL LOAD-LIFE RELATION
FOR AISI 9310 STEEL SPUR GEARS
by D. P. Townsend, J. J. Coy, and E. V. Zaretsky
National Aeronautics and Space Administration Lewis Research Center
Cleveland, Ohio 44135
SUMMARY
Experiments were conducted to determine the influence of load on life
for vacuum arc remelted (VAR) AISI 9310 steel spur gears. The results
were used to modify the NASA life prediction method for surface en
durance of gears. The test gears had a 200 involute profile and a 8.89-
centimeter (3. 5-in. ) pitch diameter. Three groups of 19 gears were
tested at transmitted tangential loads of 463X103, 578X1Q3, and 694Xl03
N/M (2645, 3305, and 3966 lb/in. ) which produced maximum Hertz stresses
at 1531Xl06, 1710X106, and 1875X106 N/M2 (222 000, 248 000, and 272 000
psi). The gears were run at 10 000 rpm and a temperature of 350 K
(1700 F). The lubricant was a superrefined naphthenic mineral oil with
an additive package.
Life was found to be inversely proportional to load to the 4.30 and
5. 1 power at the L 10 and L50 life levelS, r-espectively. The dispersion
of the fatigue data as measured by the Weibull slope increased with load,
varying linearly with contact stress. The average value for the Weibull
slope was 2.5. The load-life relation developed has a steeper slope than
the load-life relation given by the American Gear Manufacturers Association
standards.
STAR Category 37
i: , .

c
e
f
h
K2
L
l
. 2
SYMBOLS
orthogonal shear stress exponent
Weibull's exponent
face width of tooth in contact, m (in.)
depth to critical stress exponent
constant of proportionality
pitting fatigue life, millions of revolutions
involute profile arc length, m (in. )
length of contact line, m (in. )
number of teeth
load-life exponent
probability of survival
maximum Hertz stress
transmitted tangential load, N (lb)
dynamic capacity of gear-pinion mesh, N (lb)
curvature sum, m- 1 (in. -1)
transverse pressure angle, rad
base helix angle, rad
Subs cri pts :
1 driving member
2 driven member

3
INTROD UCTION
High quality aircraft gears may fail in several different ways. The most
common modes of failure are sco{:ing, tooth breakage, and surface fatigue.
If the gears are properly lubricated and if the bending stresses are within
reasonable limits, then scoring and tooth breakage will not be a problem.
However, surface fatigue failure cannot be eliminated. It is a natural event
that is brought about by cumulative damage to the gear material caused by
repeated applications of contact stress.
Recently an equation for predicting surface fatigue life of gears was
developed [1 to 3). The theory was based on a modification of the Lundberg
Palmgren theory [4 to 6 J which has been widely used for predicting roll-
ing element bearing life. The new life equation includes the effect on life due
to stress, stressed volume, and depth beneath the surface at which the max
imum critical shearing stresses occur. In [31 the life equation was used to
determine the 10-percent life for a group of AISI 9310 test gears. The load life
exponent used in [3] was 1. 5. In the discussion to [3], it was suggested that
the exponent 1. 5 was too small.
In hardened steel gears it may be reasonably expected that the inverse
load-life exponent would be close to that for roller bearings. The industry
standard for roller bearings is 10/3 and for ball bearings it is 3 [7]. In the
work of [8] the life of automotive transmission gears was found to be pro
portional to the inverse 3.38 power of load. Others have shown similar re
sults [9]. In AGMA standards [10] a load-life exponent of approximately
8.5 to 9.5 is used. The correctness of any life prediction method for gears,
as well as bearings, is dependent upon the accuracy of the relationship be
tween load and life. It is apparent that there is a large variance in the load-
life exponent used by different investigators. It, therefore, becomes an objective
4
of the research reported herein to (a) experimentally determine the load-life
relationship for AISI 9310 steel gears, and (b) to amend the gear life predic
tion formula of [3].
In order to accomplish the aforesaid, three groups of AISI 9310 steel 3 3 3 gears were tested at 463X10 , 578x10 , and 694xlO N (2645, 3305, 3966
lb/in. ) which produced maximum Hertz stresses of 153X106 N/M2,
1710X106 N/cm2 , and 187 500 N/cm2 (222 000 psi, 248 000 psi, and 272 000
psi), respectively. The gears were manufactured from a single lot of
vacuum-arc-remelted AISI 9310 steel (AMS 6265). Pitch diameter was 8.89
cm (3.5 in.), test temperature was 350 K (1700 F), and speed was 10 000
rpm. All tests were roo using a superrefined napthenic mineral oil from
one lubricant batch having a proprietary additive package plus a 5-percent
extreme pressure additive.
BACKGROUND
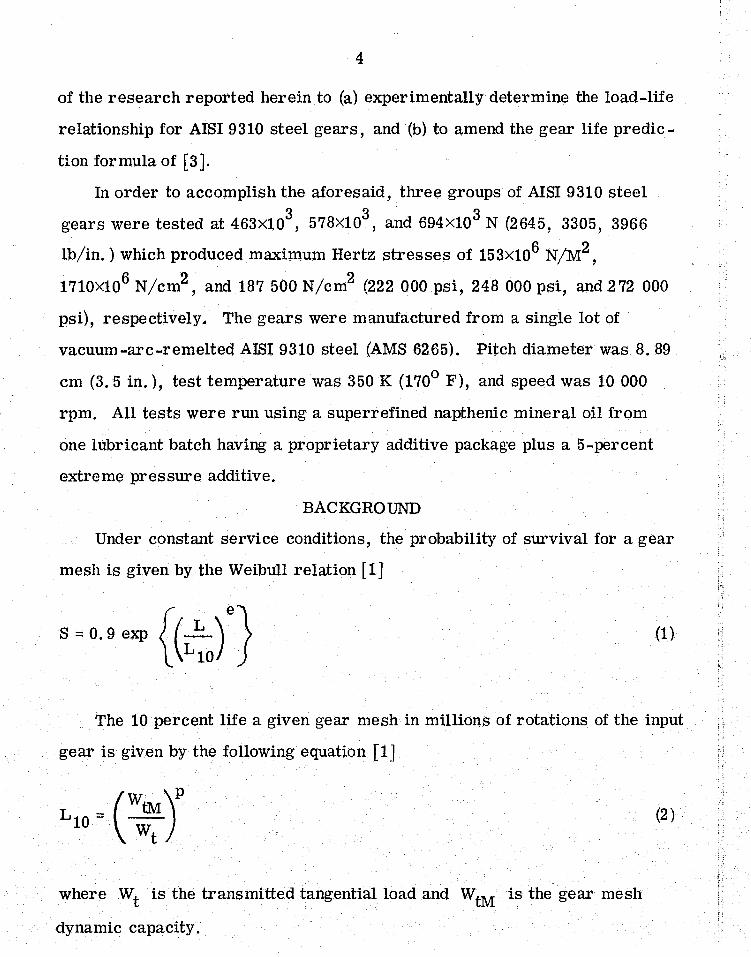
Under constant service conditions, the probability of survival for a gear
mesh is given by the Weibull relation [1]
(1 )
The 10 percent life a given gear mesh in millions of rotations of the input
gear is given by the following equation [1 ]
where Wt is the transmitted tangential load and WtM is the gear mesh
dynamic capacity.
(2)
" "

, J
5
The gear mesh dynamic capacity W tM is defined as the load which may
be carried for one million revolutions and 90 percent probability of survival.
The dynamic capacity of the gear is given by the following equation [2]
which applies to helical gears and may be used for spur gears by setting
tJlb = 0 and l c == f.
h-c-3 h-c-l
WtM = K2 l c cos 'Pt(cos tJlb)
h+c-l
(Bpr-C
-
l
[flNl {l +
2
(3)
The Weibull slope e and the load-life exponent p may be directly de
termined by conducting life tests under several load conditions for a given
group of gears. But to determine the exponents c and h the gear size must
be varied. This is more difficult to do since gear testers normally will ac
cept only a single size of gear. In addition, it is too expensive to conduct
large numbers of fatigue tests with very large gears.
,In [3] the values of ~, c and h used were identical to those for
rolling-element bearings in [4]. The value of e was taken as 3 based on
NASA gear tests conducted at a maximum Hertz stress of 1896X106 N/m2
(275 000 psi). Using these values in the relation
c-h+1 p=----2e
from Lundberg-Palmgren theory [4], gave an inverse load-life exponent
of 1. 5. This value of p is about 1/2 of that for rolling-element bearings
[4 - 7] and up to 6 times smaller than reported elsewhere for gears
[8 - 10].
(4)

6
APPARATUS, SPECIMENS, AND PROCEDURE
Gear Test Apparatus
The gear fatigue tests were performed in the NASA Lewis Research
Center's gear -fatigue test apparatus (fig. l(a)). This gear testing machine
uses the four-square principle of applying the test-gear load so that the in
put drive need only overcome tlle frictional losses in the system.
A schematic of the gear testing machine is shown in figure 1(b). Oil
pressure and leakage flow are supplied to the load vanes through a shaft
seal. As the oil pressure is increased on the load vanes inside the slave
gear, torque is applied to the shaft. This torque is transmitted through the
test gears back to the slave gear, where an equal but opposite torque is main
tained by the oil pressure. This torque on the test gears, which depends on
the hydraulic pressure applied to the load vanes, loads the gear teeth to the
desired stress level. The two identical test gears can be started under no
load; and the load can be applied gradually, without changing the running
track on the gear teeth. By testing both faces of the gears, a total of four
fatigue tests can be run for each set of gears.
Separate lubrication systems are provided for the test gears and the
main gearbox. The two lubrication systems are separated at the gearbox
shafts by pressurized labyrinth seals, with nitrogen as the seal gas. The
test-gear lubricant is filtered through a 5 -micron nominal fiberglass filter.
The test lubricant can be heated electrically with an immersion heater. The
skin temperature of the heater is closely controlled to prevent a "hot spot"
condition that would overheat the test lubricant.
A vibration transducer mounted on the gearbox is used to automatically
shut off the test rig when gear-surface fatigue occurs. The gearbox is also
automatically shut off if there is a loss of oil flow to either the main gearbox

7
or the test gears, if the test gear oil overheats, or if there is a loss of
seal gas pressurization.
The test rig is belt driven and can be operated at several fixed speeds
by changing pulleys. The operating speed for the tests repnrted herein
was 10 000 rpm which gave a pitch-line velocity of 46. 55 meters per sec-
0nd (9163 ft/min).
Test Gears and Lubricant
The AISI 9310 gears were manufactured from a single lot of vacuum
arc remelted (VAR) AISI 9310. The chemical composition of the AISI 9310
gears is given in table I. The heat treatment for the AISI 9310 gears is
given in table ll. A photomicrograph of etched and poHshed surface of the
AISI 9310 gear is shown in figure 2. The case hardness of thE; gears was
Rockwell C 62 to 64. The core hardness was Rockwell C 35 to 40.
Dimensions for the test gears are given in table Ill. All gears have
a nominal surface finish on the tooth face of 0.406 micrometer (16 J.Lin.)
rms and a standard 200 involute profile with tip relief. Tip relief was
O. 0013 centimeter (0.005 in. ) starting at the last 30 percent of the active
profile. The gears were also crowned to prevent excessive edge loading.
All tests were conducted with a single batch of superrefined naphthenic
mineral oil lubricant having proprietary additives (antiwear, antioxidant, and
antifoam), The physical properties of this lubricant are summarized in
table IV. Five percent of an extreme pressure additive, designated
Anglamol 81 (partial chemical analysis given in table V), was added to the
lubricant. A nitrogen cover gas was used throughout the test as a baseline
condition which allowed testing at the same conditions at much higher tem
peratures without oii degradation. By excluding oxygen the cover gas also
reduced the effect of the oil additives on the gear surface boundary lubrica
tion by reducing the chemical reactivity of the additive-metal system (ref. 11).

8
Test Procedure and Conditions
The test gears were cleaned to remove the preservative and then as
sembled on the test rig. All test specimens were run-in for one hour at a
load of 7584Xl06 N/M2 (110 000 psi) maximum Hertz stress. The load was
then increased to the test condition which for the three loads used resulted
in maximum Hertz stresses of 1531Xl06, 1710XI06, and 1875x106 N/M2
(222 000, 248 000, and 272 000 psi). Table VI summarizes the load-stress
conditions.
The tests were continued 24 hours a day until they were shut down auto
matically by the vibration-detection transducer located on the gearbox,
adjacent to the test gears.
The lubricant flow rate was held constant at 800 cubic centimeters per
minute, and lubrication was supplied to the inlet mesh of the gear set by jet
lubrication. The lubricant was circulated through a 5-micron fiber glass
filter to remove wear particles. A total of 3800 cubic centimeters (1 gal)
of lubricant was used and was discarded, along with the filter element, after
each test. Inlet and outlet oil temperatures were continuously recorded on a
strip-chart recorder. The lubricant inlet temperature was constant at
319±6 K (1150 ±100 F), and the lubricant outlet temperature was constant at
350±3 K (1700 ±5° F). The outlet temperature was measured at the outlet of
the test-gear cover.
The test gears were run in an offset condition with aD. 030-centimeter
(0. 120-in. ) tooth-surface overlap to give a load surface on the gear face of
0.28 centimeter (0.110 in. ) of the 0.635-centimeter (0. 250-in.) wide gear,
thereby allowing for edge radius of the gear teeth. This offset loading causes
a slight twisting in the gear tooth. However, the mating tooth twists in the
, '

.L
,Ib ...
9
opposite direction approximately the same amount which, along with the
crown radius, prevents edge loading.
The test gear shaft deflection resulting from the overhung load gives
a tooth mismatch of 1. 5X10⁻⁴ centimeter (6X10⁻⁵ in. ) across the O.2S
centimeter (0. 11-in.) contact face width. This amoWlts to approximately
10 percent of the Hertz deflection of 1. 3x10 -3 centimeter (5X10 -4 in. ).
This could cause some edge loading effects. However, the crown radius
in the tooth face prevents edge loading.
At the pitch-line load, the tooth bending stress was 2. 4Sx10Snewtons
per square meter (30 000 psi) at the intermediate load condition if plain
bending is assumed. However, because there is an offset load there is an
additional stress superimposed on the tooth bending stress. Combining
the bending and torsional moments gives a maximum stress of 2. 67x10S
newtons per square meter (3S 700 psi). For this research, the dynamic
load factor was assumed equal to unity.
The pitch-line elastohydrodynamic (EHD) film thickness was calculated
by the method of Grubin [12]. It was assumed, for this film thickness
calculation, that the gear temperature at the pitch line was equal to the out
let oil temperature and that the inlet oil temperature to the contact zone was
equal to the gear temperature, even though the oil inlet temperature was con
siderably lower. It is probable that the gear surface temperature could be
even higher than the oil outlet temperature, especially at the end points of
sliding contact. The EHD film thickness for these conditions was computed
to be 0.65 micrometer (26 j.Lin. ), which gave a ratio of film thickness to
composite surface rouglmess (bla) of 1. 13. According to [13] the
life adjustment factor for surface fatigue would be approximately one -half.
10
RESULTS AND DISCUSSION
Three groups of vacuum arc remelted (VAR) AISI 9310 case carburized
and hardened steel gears were fatigue tested under loads of 463X103,
578X103, and 694X103 N/m (2645, 3305, and 3966 lb/in. ) which produced
maximum Hertz stresses of 1531X106, 1710X106, and 1875X106 N/cm2
(222 000, 248 000, and 272 000 lb/in. 2). The lubricant was a super-refined
naphthenic mineral oil with a 5 percent extreme-pressure additive package.
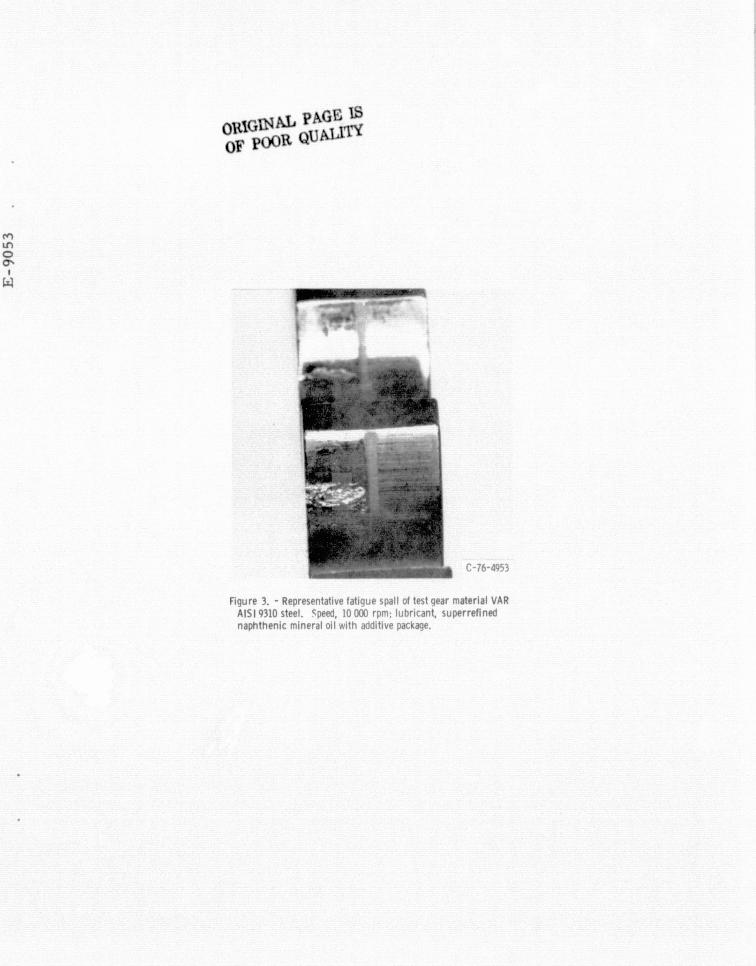
A representative fatigue spall is shown in figure 3.
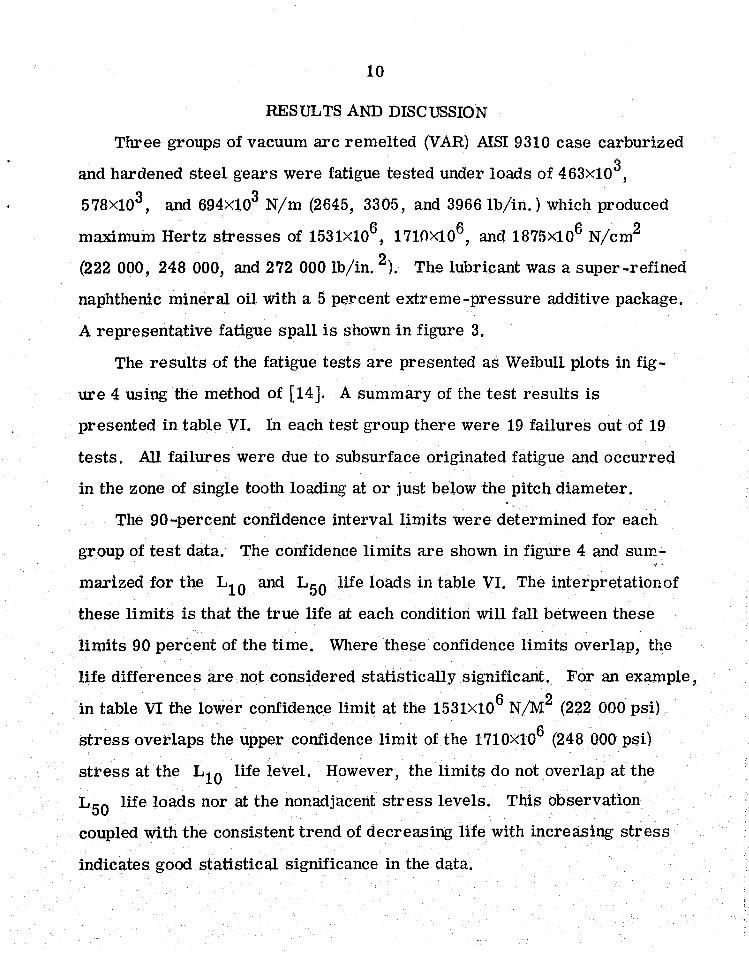
The results of the fatigue tests are presented as Weibull plots in fig
ure 4 using the method of [14]. A summary of the test results is
presented in table VI. In each test group there were 19 failures out of 19
tests. All failures were due to subsurface originated fatigue and occurred
in the zone of single tooth loading at or just below the pitch diameter.
The 90-percent confidence interval limits were determined for each
group of test data. The confidence limits are shown in figure 4 and sum-, -
marized for the L10 and L50 life loads in table VI. The interpretationof
these limits is that the true life at each condition will fall between these
limits 90 percent of the time. Where these confidence limits overlap, the
life differences are not considered statistically significant. For ,an example,
in table VI the lower confidence limit at the 1531X106 N/M2 (222 000 psi)
stress overlaps the upper confidence limit of the 1710X106 (248 000 psi)
stress at the L10 life level. However, the limits do not overlap at the
L50 life loads nor at the nonadjacent stress levels. This observation
coupled with the consistent trend of decreasing life with increasing stress
indicates good statistical significance in the data.

11
The slopes e of the Weibull plots of figure 4 which are summarized in
table VI, are a measure of the dispersion of the fatigue data. The Weibull
slopes increased with increased stress. That is, there was less dispersion
of the data as the contact stress was increased. The average value of the
slope for the plot8 of figure 4 is 2. 5.
The L 10 and L50 lives for each set of data of figure 4 are plotted
against load in figure 5. For convenience, the gO-percent confidence bands
are shown on each data point. From the slope of the least squares fit, the
life was inversely proportional to load to the 4.3 and 5. 1 power at the L 10
and L50 life levels, respectively. Using standard methods of variance
analysis [14], the gO-percent confidence interval limits for the load-
life exponents were calculated as (3.5 to 5. 1) at the L 10 life level and
(4.8 to 5.5) at the L50 life level. The values of K2 , p, and e in equa
tions (1) to (3)) are determined from the experimental results reported here
in. The value of K2 Was determined as 8. 73x10 7 when 81 units (newtons
and meters) are used in equation (3) and 21 800 when using English units
(poWlds, inches). If the effect of the life correction factor due to thin lubri
cant film is to be treated separately then the corresponding valu.~ .of K2 is
1. 03xI08 (25 700). The stressed volume for the zone of si~le tooth contact
was used in determining K2 . As a result (and using the values of c and h
from rolling element bearing experience), equations (1) to (3) may be ,WI'itten
as follows
s = O. g exp (4)
(5)
12
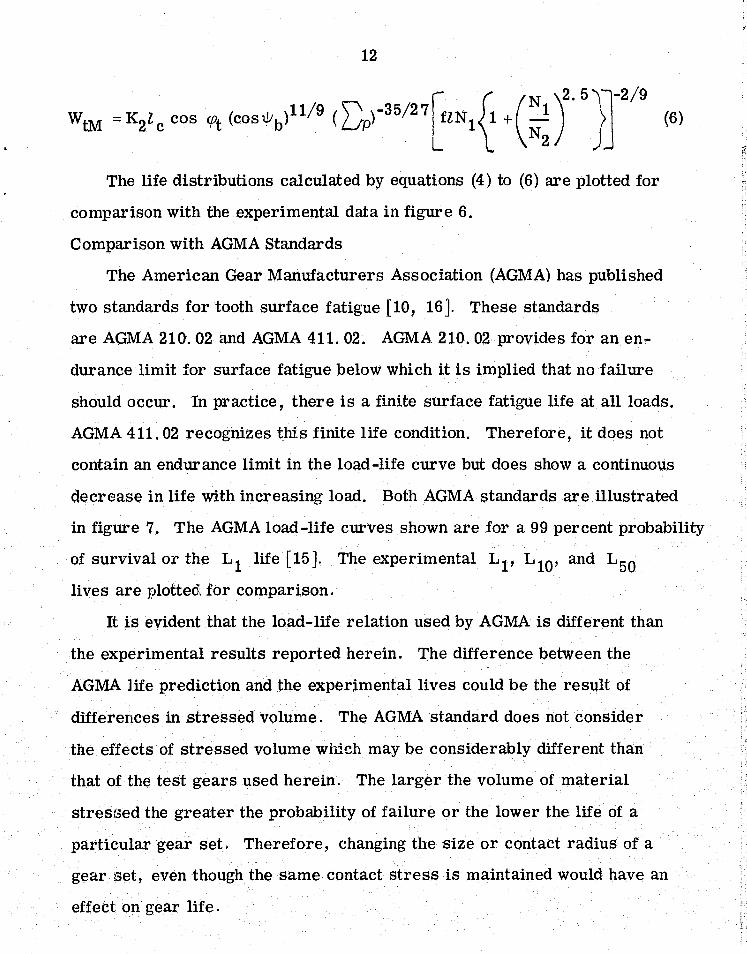
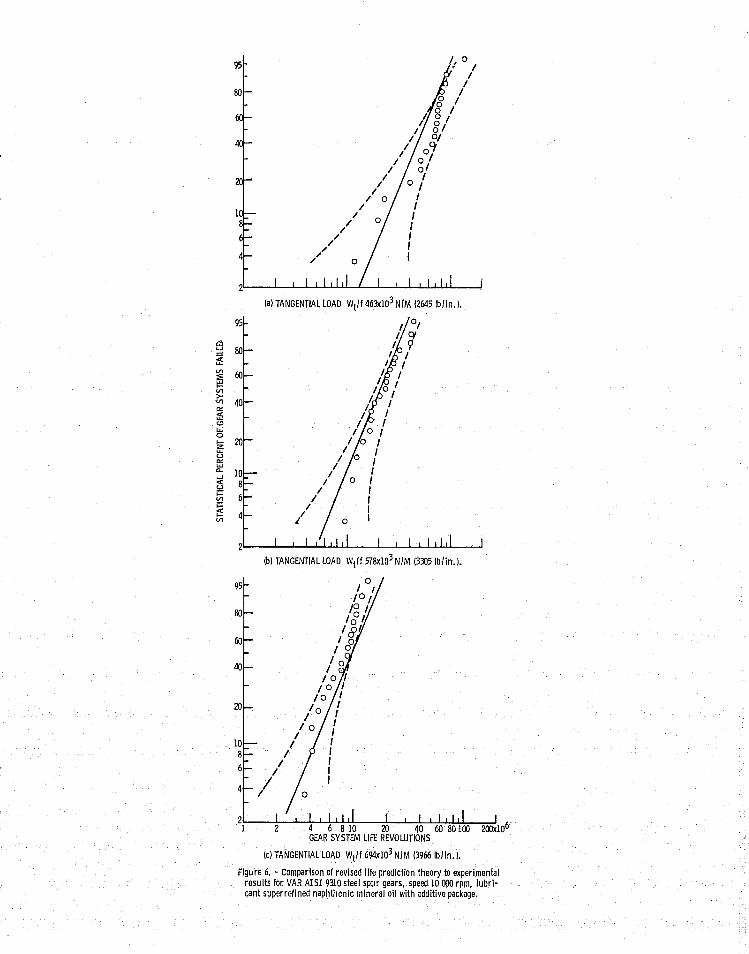
The life distributions calculated by equations (4) to (6) are plotted for
comparison with the experimental data in figure 6.
Comparison with AGMA Standards
The American Gear Manufacturers Association (AGMA) has published
two standards for tooth surface fatigue [10, 16]. These standards
are AGMA 210.02 and AGMA 411. 02. AGMA 210.02 provides for an en
durance limit for surface fatigue below which it is implied that no failure
should occur. In practice, there is a finite surface fatigue life at all loads.
AGMA 411. 02 recognizes this finite life condition. Therefore, it does not
contain an endurance limit in the load-life curve but does show a continuous
decrease in life with increasing load. Both AGMA standards are illustrated
in figure 7. The AGMA load-life curves shown are for a 99 percent probability
of survival or the L1 life [15]. The experimental Ll' L 10, and L50
lives are plotted for comparison.
It is evident that the load-life relation used by AGMA is different than
the experimental results reported herein. The difference between the
AGMA life prediction and the experimental lives could be the result of
differences in stressed volume. The AGMA standard does not consider
the effE!cts of stressed volume which may be considerably different than
that of the test gears used herein. The larger the volume of material
stresf3ed the greater the probability of failure or the lower the life of a
particular gear set. Therefore, changing the size or contact radius of a
gear set, even though the same contact stress is maintained would have an
effect on gear life. , , , Ii i;

13
SUMMARY OF RESULTS
Experiments were conducted to determine the influence of load on life
for vacuum arc remelted (VAR) AlSI 9310 steel spur gears. The results
were used to amend the NASA gear life prediction equation for surface en
durance of gears. The test gears had a 200 involute profile and a 8.89-
centimeter (3. 5 -in. ) pitch diameter. Three groups of 19 gears were tested
at transmitted tangential loads of 463Xl03, 578Xl03, and 694Xl03 (2645,
3305, and 3966 lb/~.n. ) which produced maximum Hertz stress of 1531xl06,
1710xl06, and 187!1x10⁶ N/M2 (222 000, 248 000, arid 272 000 psi). The
gears were run at 10 000 rpm and a temperature of 350 K (1700 F). The
lubricant was a superrefined naphthenic miner al oil with an additive pack
age. The following results were obtained.
1. Life was inversely proportional to load to the 4. 3 and 5. 1 power
at the L 10 and L50 life levels, respectively.
2. The dispersion of the iatigue data as measured by the Weibull slope
was increased with load, varying linearly with contact stress. The average
value for the Weibull slope was 2.5.
3. The load-life relation developed has a higher slope than the load-life
relation given by AGMA, that is, the life increases less with decreasing
load than the AGMA standard would predict.

14
REFERENCES
1. Coy, J. J., Townsend, D. P., and Zaretsky, E. V., "Analysis of
Dynamic Capacity of Low-Contact-Ratio Spur Gears Using
Lundberg-Palmgren Theory, " NASA TN D-B029, Aug. 1975.
2. Coy, J. J. and Zaretsky, E. V., "Life Analysis of Helical Gear
Sets Using Lundberg-Palmgren Theory, " NASA TN D-B045, 1975.
3. Coy, J .. J., Townsend, D. P., and Zaretsky, E. V., "Dynamic
Capacity and Surface Fatigue Life for Spur and Helical Gears. "
Journal of Lubrication Technology, Trans. ASME, Series F,
Vol. 9B, 1976, pp. 267-276.
4. Lundberg, G. and Palmgren, A., "Dynamic Capacity of Rolling
Bearings, " Acta Polytechnica, Mechanical Engineering Series,
Vol. 1, No.3, 1947.
5. Lundberg, G. and Palmgren, A., "Dynamic Capacity of Rolling
Bearings, " Journal of Applied Mechanics, Trans. AS ME , Series
E, Vol. 16, 1949, pp. 165-172.
6. Lundberg, G. and Palmgren, A., "Dynamic Capacity of Roller
Bearings, " Acta Polytechnica, Mechanical Engineering Series,
Vol. 2, No.3, 1952.
7. "American Standard Method of Evaluating Load Ratings for B all and
Roller Bearings, " Mechanical Standards Board, American Standards
Association, B3-11-1959, 1959.
B. Huffaker, G. E., "Compressive Failures in Transmission Gearing, "
SAE TranSitions, vol. 6B, 1960, pp. 53-59.

I ;
,"
15
9. Schilke, W. E., "The Reliability Evaluation of Transmission Gears, "
SAE Paper No. 670725, Sept. 1967.
10. "Design Procedure for Aircraft Engine and Power Take-off Spur
and Helical Gears, " AGMA Standard No. 411. 02, Sept. 1966.
11. Fein, R. S. and Kreuz, K. L., "Chemistry of Boundary Lubrication
of Steel by Hydrocarbons, " ASLE Transition, Vol. 8, 1965, pp. 29-38.
12. Dow son, D. and Higginson, G. R., Elasto-Hydrodynamic Lubrication,
Pergamon Press, New York, 1966.
13. Bamberger, E. N.; et al., Life Adjustment Factors for Ball and
Roller Bearings. An Engineering Design Guide, AS ME , New York,
1971.
14. Young, H. D., Statistical Treatment of Experimental Data, McGraw
Hill, New York, 1962.
15. Johnson, L. G., The Statistical Treatment of Fatigue Experiments,
Elsevier, New York, 1964.
16. "Surface Durability (Pitting) of Spur Gear Teeth, " AGMA Standard
No. 210.02, Jan. 1965.

TABLE 1. - CHEMICAL COMPOSITION OF VAR AISI 9310
GEAR MATERIALS BY PERCENT WEIGHT
Element C Mn Si Ni Cr Mo Cu P and S
Weight o. 10 0.63 0.27 3.22 1. 21 O. 12 0.13 0.005 percent
TABLE II. - HEAT TREATMENT PROCESS FOR
VACUUM ARC REMELTED (VAR) AISI 9310
Step Process Temperature Time,
of hr
K
1 Carburize 1172 1650 8 2 Air cool to room temperature ---- ---- ---3 Copper plate allover ---- ---- ---4 Reheat 922 1200 2.5 5 Air cool to room temperature ---- ---- ---6 Austenitize 1117 1550 2.5 7 Oil quench ---- ---- ---8 Subzero cool 189 -120 3.5 9 Double temper 450 350 2 each
10 Finish grind ---- ---- ---11 Stress relieve 450 350 2
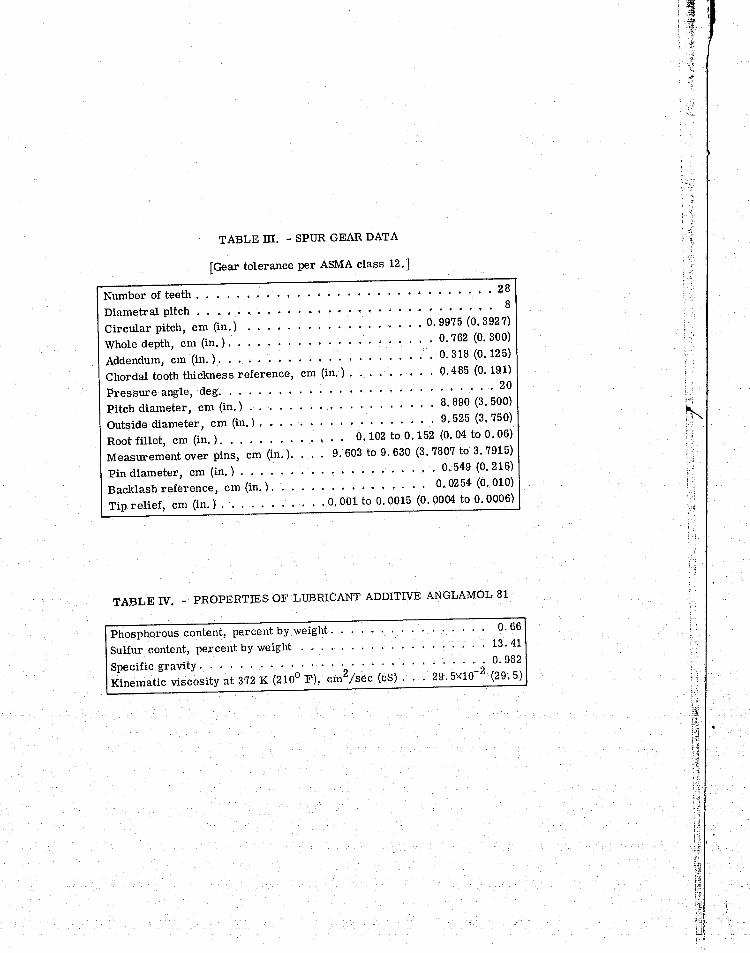
TABLE m. - SPUR GEAR DATA
[Gear tolerance per ASMA class 12.]
Number of teeth .
Diametral pitch .
Circular pitch, cm (in.)
Whole depth, cm (in.). .
Addendum, cm (in.) ...
Chordal tooth thickness reference, cm (in. ) .
Pressure angle, deg. . . . .
Pitch diameter, cm (in.) . .
Outside diameter, cm (in. ) .
· ....... 28
· • • . • . •. 8
· 0.9975 (0.3927)
0.762 (0. 300)
0.318 (0.125)
0.485 (0. 191)
...... 20
8. 890 (3. 500)
9.525 (3.750)
Root fillet, cm (in. ). . . . .
Measurement over pins, cm (in. ).
Pin diameter, cm (in.) . . . .
Backlash reference, cm (in. ).
Tip relief, cm (in. ). . . . . .
0.102 to 0.152 (0.04 to 0.06)
9.603 to 9.630 (3.7807 to 3.7915)
........... 0.549 (0.216)
.......... 0.0254 (0.010)
• O. 001 to 0.0015 (0.0004 to 0.0006)
TABLE IV. - PROPERTIES OF LUBRICANT ADDITIVE ANGLAMOL 81
Phosphorous content, percent by weight.
Sulfur content, percent by weight . . . .
Specific gravity. . . . . . . . . . . . . .. .. .
Kinematic viscosity at 372 K (2100 F), cm2/sec (cS) .
0.66
13.41
...... 0.982
29.5x10-Z (29.5)
, ' ~ -:

E-9053
TABLE V. - PROPERTIES OF SUPERREFINED NAPHTHENIC
MINERAL OIL USED AS TEST LUBRICANT
Kinematic viscosity, cm2/sec (cS), at-
266 K (20° F) .
311 K (100° F)
372 K (210° F)
478 K (400° F)
Flashpoint, K (oF)
Autoignition temperature, K (oF) .
Pour point, K tF) . . . . . . . .
Density at 289 K (60° F), g/cm3 .
Vapor pressure at 311 K (100° F), mm Hg (or torr).
Thermal conductivity at 311 K (100° F), J/(m)(sec)(K) (Btu/(hr)(ft)(oF)) .
Specific heat at 311 K (100° F), J/(kg)(K) (Btu/(lb)(oF» ......... .
2812XIO- 2 (2812)
. 73x10- 2 (73)
7.7X10- 2 (7.7)
1. 6X10- 2 (1. 6)
489 (420)
664 (735)
236 (-35)
. 0.8899
0.01
0.04 (0.0725)
. 581 (0. 450)

TABLE VI. - SUMMARY OF FATIGUE LIFE RESULTS WITH 8. 89-CM (3. 5-IN.)
PITCH DIAMETER SPUR GEARS AT THREE LOADS
fMaterial, VAR AISI 9310 steel; speed, 10000 rpm; lubricant, superrefined naphthenic mineral oil with additive package. ]
Transmitted Maximum Gear set life, millions of revolutions (hrs) tangential Hertz
load, stress, LIO L50
wt N/M2 Lower 90 - Experi - Upper 90- Lower 90- Experi- Upper 90-
(lb/in. ) (lb/in.2) percent mental percent percent mental percent
confidence confidence confidence confidence
limit limit limit limit
463><103 1531x106 12.4 23.6 44.8 47.9 63.8 85 (2645) (222)<103) (20.7) (39.3) (74.6) (79.9) (106.4) (141. 6)
578x103 1710X106 7.1 11.4 18.2 19.2 23.8 29.3 (3305) (248)<103) (11.8) (19) (30.4) (32) (39.6) (48.8)
694><103 1875X106 2.8 4.3 6.4 6.7 8.1 9.8 (3966) (272)<103) (4.6) (7.1) (10.7) (11.2} (13.5) (16.3)
Weibull Failure slope index
1.9 19 out
of 19
2.6 19 out of 19
2.9 19 out
of 19
"-,,J;,,!li~

r Test \ gears 7
outlet temperature measure-ment location "
Slave-system oil inlet '7
/
(al Cutaway view.
Slave gear
Drive shaft i
I
CD-1l124-15
/ r~s==, r Drive shaft I
I I r Belt pulley
I
CD-1142H5
(b) Schematic diagram.
, , , , ,
/ Shaft torque~ \ I "- load pressure
View A-A
Figure 1. - NASA lewis Research Center's gear fatigue test apparatus.

(a) Carburized and hardened case of the VAR AISI 9310 gear showing hiph carbon fine grain martensitic structure.
(b) Core structure of VAR AISI9310 gear showing low carbon refmed austenitic grain size.
Figure 2 .• Photomicrographs of case and core regions of test p,ears.
M I.t)
o I
~
C-76-4953
Figure 3. - Representative fatigue spall of test gear material VAR AISI9310 steel. ~peed, 10000 rpm; lubricant, superrefined naphthenic mineral oil with additive package.

95
80
60
40
20
10 § 8 ~ 6 VI
~ 4
VI >VI 2~~~~~~~~~ 346810 -20---4060--io0200xlOo34 6810 20 4060x106
~
i5 (,!)
u.. o IZ LI.I U
ffi 0... ....J 95 ~ i;; 80 i= ~ 60 VI
40
20
10 8 6 4
GEAR SYSTEM LIFE REVOLUTIONS
ta) TANG~NTlAL LOAD Wt/f 463xl0 NI M (2645 Ibl in.).
(b) TANG~NTIAL LOAD Wt/f 578xlO N/M (3305 Ib/in.).
21~~~~~~~r---
(d) SUMMARY.
Figure 4. - Effect of load on the life of 8. 39 cm (3.5 in. ) pitch diameter spur gears, material, VAR AISI 9310 steel, speed 10 000 rpm lubricant superrefined naphthenic mineral oil with additive package.
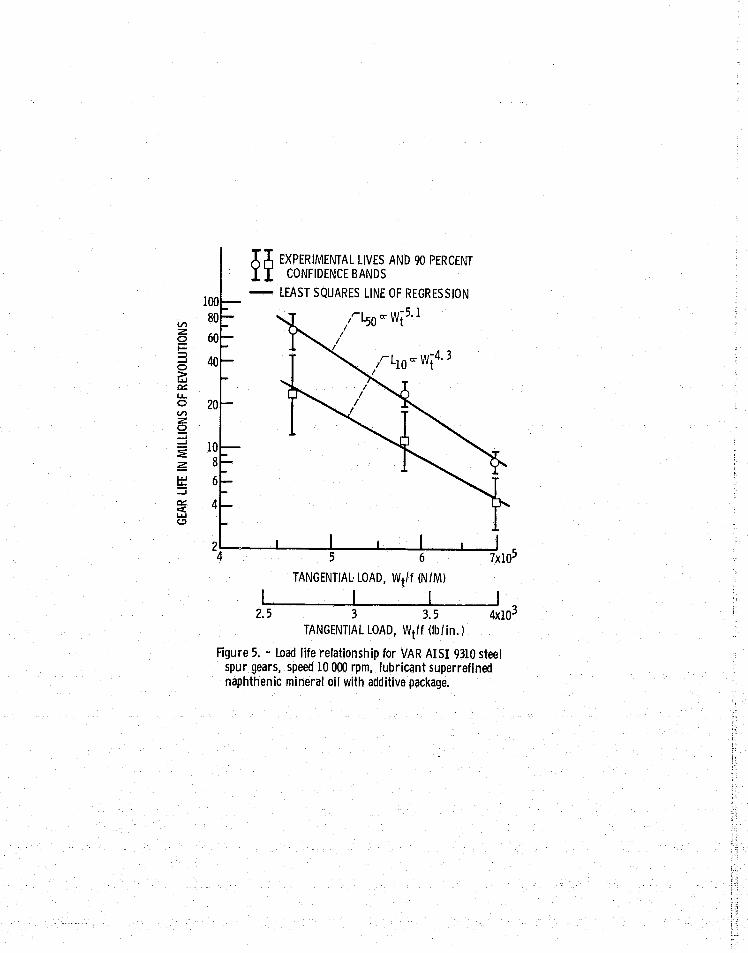
A;:r; EXPERIMENTAL LIVES AND 90 PERCENT r l CONFIDENCE BANDS - LEAST SQUARES LINE OF REGRESSION
rL cr W-4. 3 I 10 t
I
I I I 2 4'--~---'----..I.5--..J--......L6--'-----'7X10⁵
TANGENTIAL- LOAD, Wt/f (N/M)
I I 2.5 3 3.5
TANGENTIAL LOAD, Wt/f(lb/in.)
Figure 5. - Load life relationship for VAR AISI 9310 steel spur gears, speed 10 000 rpm, lubricant superrefined naphthenic mineral oil with additive package.
95 I 0 ( I
I I
80 0
1 0 1
I 8 1 I 0 1
I 01 I 01
I 0'1 / 0 1
I 0 1 I 0 I
/ I I 0 I
I I I I
I I / / I
/ I 4 /' I /
(a) TANGENTIAL LOAD Wtlf 463X103 N/M (2645 Ib/ln.).
95
§ 80 ~ VI 60 rEl VI >-VI
'" 4D
15 '" W-0
!z 20 UJ u
'" UJ "- 10 ..... <C 8 u ;= 6 VI ;= ~ 4 VI
(b) TANGENTIAL LOAD Wtlf 578>:103 N/M (3305 Ib/in.).
95
80
60
4D
20
10 8
6
4
2 I
(c) TANGENTIAL LOAD Wtll 694x103 N/M (3966 Ib/in.).
Figure 6. - Comparison of revised life prediction theory to experimental results for VAR AISI 9310 steel spur gears, speed 10000 rpm, lubri-cant superrefined naphthenlc minerai 011 with additive package.

":t 'e ......
~ z ..... ~ Q « 53 ...J
s 3 I-
to C z 2 ~
0 l50 EXPERIMENTAL LIFE 0 llO EXPERIMENTAL LIFE 0 II EXPERIMENTAL LIFE
c: '£ :::" 4 -:s: (FROM AGMA STANDARD 0 3 « , 210.02 REF. 15) 53
2 " ...J , « .... i= (FROM AGMA ;-., z STANDARD 411. 02 REF. 16)...-/ ', .... L&.I C z .... ~ 1
104
Figure 7. - Comparison of experimental life for VAR AISI 9310 spur gears with AGMA life prediction. Speed 10 000 rpm, lubricant superrefined naphthenic mineral oil with additive package.