ca netmaster network management for tcp/ip quick reference ... mainframe network management...
TRANSCRIPT
Quick Reference Guide
r12
CA NetMaster® Network
Management for TCP/IP
This documentation and any related computer software help programs (hereinafter referred to as the
"Documentation") are for your informational purposes only and are subject to change or withdrawal by CA at any time.
This Documentation may not be copied, transferred, reproduced, disclosed, modified or duplicated, in whole or in part,
without the prior written consent of CA. This Documentation is confidential and proprietary information of CA and may
not be used or disclosed by you except as may be permitted in a separate confidentiality agreement between you and
CA.
Notwithstanding the foregoing, if you are a licensed user of the software product(s) addressed in the Documentation,
you may print a reasonable number of copies of the Documentation for internal use by you and your employees in
connection with that software, provided that all CA copyright notices and legends are affixed to each reproduced copy.
The right to print copies of the Documentation is limited to the period during which the applicable license for such
software remains in full force and effect. Should the license terminate for any reason, it is your responsibility to certify
in writing to CA that all copies and partial copies of the Documentation have been returned to CA or destroyed.
TO THE EXTENT PERMITTED BY APPLICABLE LAW, CA PROVIDES THIS DOCUMENTATION "AS IS" WITHOUT
WARRANTY OF ANY KIND, INCLUDING WITHOUT LIMITATION, ANY IMPLIED WARRANTIES OF MERCHANTABILITY,
FITNESS FOR A PARTICULAR PURPOSE, OR NONINFRINGEMENT. IN NO EVENT WILL CA BE LIABLE TO THE END USER
OR ANY THIRD PARTY FOR ANY LOSS OR DAMAGE, DIRECT OR INDIRECT, FROM THE USE OF THIS DOCUMENTATION,
INCLUDING WITHOUT LIMITATION, LOST PROFITS, LOST INVESTMENT, BUSINESS INTERRUPTION, GOODWILL, OR
LOST DATA, EVEN IF CA IS EXPRESSLY ADVISED IN ADVANCE OF THE POSSIBILITY OF SUCH LOSS OR DAMAGE.
The use of any software product referenced in the Documentation is governed by the applicable license agreement and
is not modified in any way by the terms of this notice.
The manufacturer of this Documentation is CA.
Provided with "Restricted Rights." Use, duplication or disclosure by the United States Government is subject to the
restrictions set forth in FAR Sections 12.212, 52.227-14, and 52.227-19(c)(1) - (2) and DFARS Section
252.227-7014(b)(3), as applicable, or their successors.
Copyright © 2010 CA. All rights reserved. All trademarks, trade names, service marks, and logos referenced herein
belong to their respective companies.

Contact CA
Contact Technical Support
For your convenience, CA provides one site where you can access the information
you need for your Home Office, Small Business, and Enterprise CA products. At
http://ca.com/support, you can access the following:
■ Online and telephone contact information for technical assistance and
customer services
■ Information about user communities and forums
■ Product and documentation downloads
■ CA Support policies and guidelines
■ Other helpful resources appropriate for your product
Provide Feedback
If you have comments or questions about CA product documentation, you can
send a message to [email protected].
If you would like to provide feedback about CA product documentation, complete
our short customer survey, which is also available on the CA Support website,
found at http://ca.com/docs.

Contents 5
Contents
Chapter 1: Introduction 7
About This Guide .............................................................................. 7
Chapter 2: Panel Format 9
Define Primary Menu Format ................................................................... 9
Display IP Summary Display ................................................................... 10
Chapter 3: Shortcuts 13
How to Use a Shortcut ........................................................................ 13
Address Spaces and Ports ..................................................................... 14
Alerts ........................................................................................ 15
Line Commands ........................................................................... 15
APPN/HPR Shortcuts .......................................................................... 16
APPN/HPR Commands ..................................................................... 17
Business Applications ......................................................................... 17
Connections .................................................................................. 18
CTRACE Packet Tracing ....................................................................... 19
DB2 Network Information Center .............................................................. 20
Diagnostics ................................................................................... 21
Enterprise Extender ........................................................................... 21
Line Commands ........................................................................... 23
History ....................................................................................... 24
IP Nodes ..................................................................................... 25
Line Commands ........................................................................... 25
IP Security ................................................................................... 27
Log .......................................................................................... 28
Monitors ..................................................................................... 28
OSAs ........................................................................................ 29
Line Commands ........................................................................... 30
Performance .................................................................................. 30
SmartTrace Packet Tracing .................................................................... 31
Line Commands ........................................................................... 32
Stack Interfaces and Devices .................................................................. 33
Stacks ....................................................................................... 34
Line Commands ........................................................................... 35
Summary .................................................................................... 38
6 Quick Reference Guide
Line Commands ........................................................................... 38
Telnet Servers ................................................................................ 39
VIPAs ........................................................................................ 40
Line Commands ........................................................................... 41
Chapter 4: Commands 43
How to Issue a Command ..................................................................... 43
D Command .................................................................................. 44
NETSTAT Command ........................................................................... 44
NSLOOKUP Command ......................................................................... 44
OBEYFILE Command .......................................................................... 44
PING Command .............................................................................. 45
SHOW SOCKETS Command .................................................................... 45
SHOW TCPIP Command ....................................................................... 45
SHOW TELNET Command ..................................................................... 45
SHOW USERS Command ...................................................................... 46
SYSCMD Command ........................................................................... 46
TELNET Command ............................................................................ 47
TNCMD Command ............................................................................ 47
TNDISC Command ............................................................................ 47
TNSEND Command ........................................................................... 47
TRACEROUTE Command ...................................................................... 48
TRCACT Command ............................................................................ 48
TRCINACT Command.......................................................................... 48

Chapter 1: Introduction 7
Chapter 1: Introduction
This section contains the following topics:
About This Guide (see page 7)
About This Guide
This guide provides a quick reference to useful commands and system shortcuts
that can help you to manage your IP network. It also describes how to customize
your Primary Menu so that you can view the state of your IP network quickly.
The information in this guide is brief. For more information, see the online help.


Chapter 2: Panel Format 9
Chapter 2: Panel Format
This section contains the following topics:
Define Primary Menu Format (see page 9)
Display IP Summary Display (see page 10)
Define Primary Menu Format
You can display the Primary Menu in one of the following formats:
Classic
Displays the menu options with a description to the right.
Example: Classic Display
PROD---------------------- NetMaster : Primary Menu --------------------------- Select Option ===> M - Monitors Userid USER1 H - Historical Data LU CA11000 D - IP Network Diagnosis Time 01:25:42 U - User Services TUE 08-APR-2008 O - Operator Console Services OPSYS z/OS A - Administration and Definition Window 1 X - Terminate Window/Exit
Expanded
Displays a hierarchical format with the first-level initially visible.
Example: Expanded Display
Collapsed
Displays a hierarchical format with no options initially visible.
Example: Collapsed Display

Display IP Summary Display
10 Quick Reference Guide
To define the format of your Primary Menu
1. Enter PROFILE at prompt on the Primary Menu.
The Primary Menu Format Control panel appears.
2. Enter the type of format you want in the Menu Format on Entry field.
3. Press F3 (File).
The format is saved.
Display IP Summary Display
The IP Summary Display provides a snapshot of the most useful information
about your IP environment. It provides the following complementary
perspectives:
Condition Summary
Provides an exception-based perspective of your IP environment. It
compares a set of IP characteristics with preset conditions. It charts the
values of those conditions and reflects their values through the following
statuses: OK, WARNING, and PROBLEM.
IP Traffic Summary
Provides an activity-based perspective of your IP environment. It provides
traffic throughput statistics and identifies the most active application, port,
and addresses.
EE Traffic Explorer
Graphs recent and cumulative Enterprise Extender (EE) traffic throughput.
Alert Summary
Provides a graphical representation of how many alerts are outstanding for
each alert severity.
To display the IP Summary Display on its own panel, enter /IPSUM at the
prompt.

Display IP Summary Display
Chapter 2: Panel Format 11
To display the IP Summary Display on the Primary Menu
1. Enter PROFILE at the prompt on the Primary Menu.
The Primary Menu Format Control panel appears.
2. Complete the fields in the IP Summary Display field.
Note: For information on the fields, press F1 (Help).
Press F3 (File).
The IP Summary Display appears at the bottom of the Primary Menu and
appears each time you log on to the region.


Chapter 3: Shortcuts 13
Chapter 3: Shortcuts
This section provides a quick reference to shortcuts that can help you manage
your IP network.
This section contains the following topics:
How to Use a Shortcut (see page 13)
Address Spaces and Ports (see page 14)
Alerts (see page 15)
APPN/HPR Shortcuts (see page 16)
Business Applications (see page 17)
Connections (see page 18)
CTRACE Packet Tracing (see page 19)
DB2 Network Information Center (see page 20)
Diagnostics (see page 21)
Enterprise Extender (see page 21)
History (see page 24)
IP Nodes (see page 25)
IP Security (see page 27)
Log (see page 28)
Monitors (see page 28)
OSAs (see page 29)
Performance (see page 30)
SmartTrace Packet Tracing (see page 31)
Stack Interfaces and Devices (see page 33)
Stacks (see page 34)
Summary (see page 38)
Telnet Servers (see page 39)
VIPAs (see page 40)
How to Use a Shortcut
Use shortcuts to access a panel directly.
You can enter a shortcut in one of the following ways:
■ Enter /shortcut name at the prompt.
This method retains the current panel on exit.
■ Enter =/shortcut name at the prompt.
This method closes the current panel and returns to the Primary Menu on
exit.

Address Spaces and Ports
14 Quick Reference Guide
Address Spaces and Ports
Use the following shortcuts to display information about address spaces and
ports:
/ASINFO
Displays address space information.
/ASMON
Displays address space and port management options.
/ASMON.IC
Displays the current state of active connections to the selected address
space.
/ASMON.ICF
Displays the current state of active connections to an address space
(advanced).
/ASMON.IL
Displays the current state of active TCP listeners associated with an address
space.
/ASMON.TC
Displays traffic statistics for address spaces known to Packet Analyzer.
/ASMON.TRS
Displays information about byte and packet traffic.
/ASPERF
Displays address space performance history options.
/ASPERF.H
Displays performance history for an address space.
/ASPERF.OV
Displays the address space performance overview.
/ASPERF.PC
Displays the monitored CSM attributes.
/ASPERF.PP
Displays an overview of TCP and UDP port performance.
/ASPMON
Displays the IP resource monitor, filtered to display address space resources.

Alerts
Chapter 3: Shortcuts 15
/SMARTAS
Displays the address space SmartTrace options.
/SSXP
Displays statistics on subsystem traffic.
/TELINFO
Displays address space information options for Telnet servers.
Alerts
Use the following shortcut to display information about alerts:
/ALERTS
Displays the alert monitor.
Line Commands
Use the following line commands from the alert monitor to display more
information about alerts:
A (Analyze)
Analyzes the alert condition.
S/B (Browse)
Displays alert details.
C (Close)
Closes an alert.
N (Notes)
Displays notes from the alert monitor and lets you add your own notes.
T (Track)
Displays the User ID of the person tracking the alert.
TT (Trouble Ticket)
Raises a trouble ticket.

APPN/HPR Shortcuts
16 Quick Reference Guide
APPN/HPR Shortcuts
Use the following shortcuts to display information about your APPN/HPR
resources:
/APPNHPR
Displays a list of RTP management options.
/RTP
Displays a list of RTP pipes.
/RTPCS
Displays the IP network condition summary.
/RTPE
Accesses the RTP event detector controls.
/RTPH
Displays a list of RTP pipes that indicate performance issues.
/RTPHG
Displays a list of RTP pipes from all connected systems that indicate
performance issues.
/RTPMON
Displays a list of APPN/HPR resources in the resource monitor.
/RTPV
Displays a list of VTAM commands useful in diagnosing APPN/HPR problems.
Business Applications
Chapter 3: Shortcuts 17
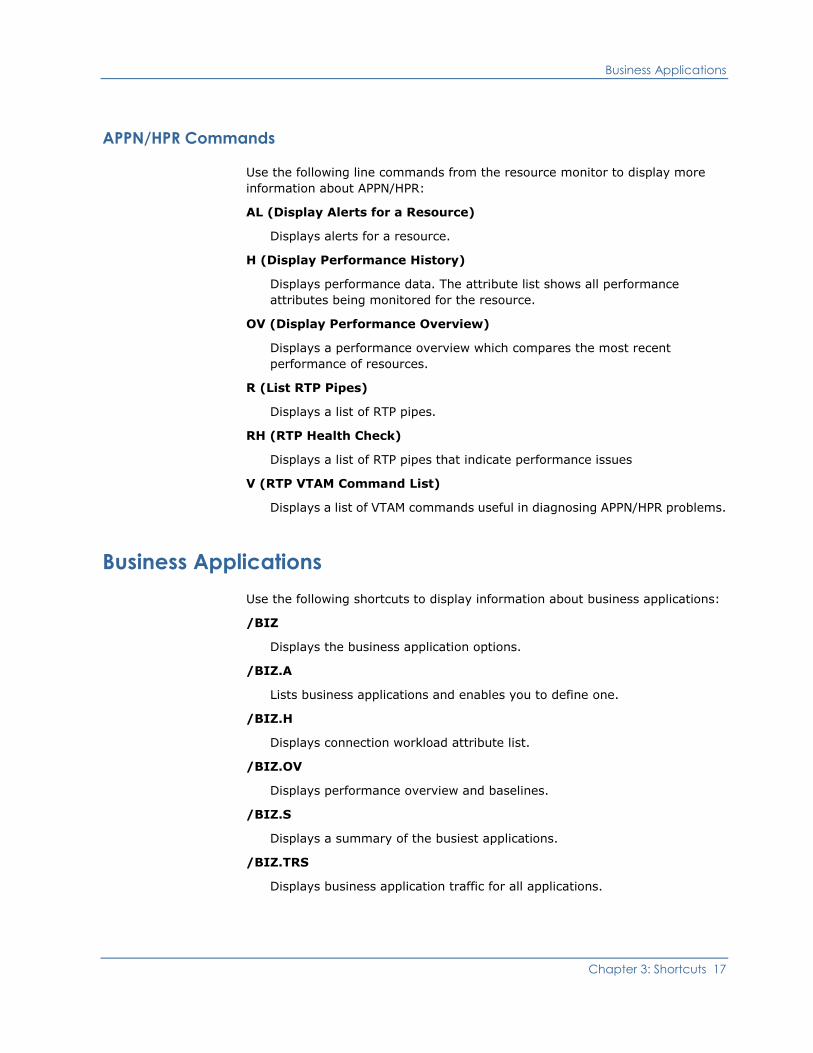
APPN/HPR Commands
Use the following line commands from the resource monitor to display more
information about APPN/HPR:
AL (Display Alerts for a Resource)
Displays alerts for a resource.
H (Display Performance History)
Displays performance data. The attribute list shows all performance
attributes being monitored for the resource.
OV (Display Performance Overview)
Displays a performance overview which compares the most recent
performance of resources.
R (List RTP Pipes)
Displays a list of RTP pipes.
RH (RTP Health Check)
Displays a list of RTP pipes that indicate performance issues
V (RTP VTAM Command List)
Displays a list of VTAM commands useful in diagnosing APPN/HPR problems.
Business Applications
Use the following shortcuts to display information about business applications:
/BIZ
Displays the business application options.
/BIZ.A
Lists business applications and enables you to define one.
/BIZ.H
Displays connection workload attribute list.
/BIZ.OV
Displays performance overview and baselines.
/BIZ.S
Displays a summary of the busiest applications.
/BIZ.TRS
Displays business application traffic for all applications.

Connections
18 Quick Reference Guide
Connections
Use the following shortcuts to display information about connections:
/CEVENTS
Lists the reports that you can select to display connection and event history.
/CONNC
Lists connections.
/CONNCF
Lists connections (advanced).
/CONNCH
Lists connections with history.
/CONNF
Lists FTP connections with information such as client and server, file being
transferred, and connection status.
/CONNL
Lists listeners with information such as local port and connection backlog.
/CONNT
Lists Telnet connections.
/CONNTF
Lists Telnet connections (advanced).
/CONNTR
Lists Telnet connections as for /CONNT but with additional information such
as response times.
/CONNTRF
Lists Telnet connections (advanced and RTM).
/IPCON
Displays TCP/IP connection options.

CTRACE Packet Tracing
Chapter 3: Shortcuts 19
CTRACE Packet Tracing
Use the following shortcuts to display information about CTRACE packet tracing:
/CTRACE
Displays CTRACE packet tracing options.
/CTRACE.L
Lists saved CTRACE traces.
/CTRACE.LA
Lists active CTRACE traces.
/CTRACE.PT
Starts CTRACE packet trace.
/CTRACE.PTC
Clears all CTRACE traces.
/CTRACE.SV
Saves CTRACE trace data.

DB2 Network Information Center
20 Quick Reference Guide
DB2 Network Information Center
Use the following shortcuts to display information about the DB2 network:
/DB2
Displays the DB2 Network Information Center menu.
/DB2.AS
Displays information about DB2 address spaces.
/DB2.D
Enables you to find information about DB2 error codes.
/DB2.IC
Lists the Distributed Data Facility (DDF) IP connections.
/DB2.ICF
Lists the DDF IP connections as for /DB2.IC but with additional information
sourced from Packet Analyzer.
/DB2.IL
Lists the DDF Transmission Control Protocol (TCP) listeners.
/DB2.S
Enables you to find information about structured query language (SQL) error
codes.
/DB2.SS
Displays statistics on subsystem traffic.
/DB2.ST
Displays Address Space SmartTrace Menu for DDF address spaces.
/DB2.TC
Displays traffic statistics for DDF address spaces known to Packet Analyzer.
/DB2.TRS
Displays the byte and packet traffic for the local server ports associated with
a DDF address space.

Diagnostics
Chapter 3: Shortcuts 21
Diagnostics
Use the following shortcuts to display diagnostic information:
/IFLIST
Displays host interface list.
/IPDIAG
Displays TCP/IP network diagnosis options.
/MIB
Displays the MIBinsight browser.
/MIBUSEC
Displays security details for the MIBinsight browser.
/NETSTAT
Displays Netstat command list.
/PING
Lets you enter the search criteria of the connection you want to ping.
/RTABLE
Lets you enter the search criteria of the routing table you want to display.
/SYSINFO
Displays host system information.
/TELNET
Starts a Telnet connection.
/TRACERT
Lets you enter the search criteria of the traceroute you want to perform.
Enterprise Extender
Use the following shortcuts to display information about Enterprise Extender
(EE):
/EE
Displays EE options.
/EECOND
Displays how your EE environment is currently performing.
/EEMON
Displays the IP resource monitor, filtered to display EE resources.

Enterprise Extender
22 Quick Reference Guide
/EEPERH.H
Displays performance data. The attribute list shows all performance
attributes being monitored for the resource.
/EEPERF.OV
Displays a performance overview, which compares the most recent
performance of resources.
/EERH
Identifies which EE Rapid Transport Protocol (RTP) Pipes have possible health
problems.
/EERTP
Displays a list of RTP pipes flowing over the EE connections.
/EETEST
Displays the route taken by EE packets for each of the five ports to the
destination host.
/EETRACE.C
Manages traces of packets bound for a selected EE remote control point.
/EETRACE.P
Manages traces of packets for a selected EE UDP port.
/EETRACE.R
Manages traces of packets for a selected RTP pipe.
/EETRACE. U
Traces all EE RTP pipes for a selected priority flowing over one EE connection.
/EETRACE.V
Manages traces of packets for a local VIPA.
/EETRALL
Lists all EE SmartTrace definitions.
/EEPERF.ST
Displays UDP port activity.
/EEUDP
Displays a list of the UDP Connections used by EE.
/EEV
Displays a list of VTAM commands useful when diagnosing problems with EE.

Enterprise Extender
Chapter 3: Shortcuts 23
/EEXCA
Displays the XCA major node summary.
/EEXP
Displays a graphical breakdown of total EE traffic.
Line Commands
Use the following line commands from the resource monitor to display more
information about EE:
AL (Display Alerts)
Displays alerts.
CT (EE Connectivity Test)
Displays the route taken by the EE packets
H (Display Performance History)
Displays performance data.
The attribute list shows all performance attributes being monitored for the
resource.
OV (Display Performance Overview)
Displays a performance overview, which compares the most recent
performance of resources.
PT (Activate Packet Trace)
Activates SmartTrace packet tracing.
PTD (Inactivate and Delete Packet Trace)
Inactivates and deletes a SmartTrace packet trace.
PTI (Inactivate Packet Trace)
Inactivates a SmartTrace packet trace.
PTV (View Packet Trace)
Displays a SmartTrace packet trace.
R (List EE RTP Pipes)
Displays a list of RTP pipes currently flowing over EE connections.
RH (RTP Health Check)
Displays RTP pipes with possible health problems.
S (Display XCA Major Node Summary)
Displays XCA major node summary.

History
24 Quick Reference Guide
ST (Display EE Stack Throughput)
Displays the UDP port activity for EE's stack.
TA (EE Traffic Analysis)
Displays cumulative EE Traffic throughput.
TRP (Real-Time EE Traffic by CP and Priority)
Displays data about byte and packet traffic priority and control point.
TRS (Real-Time EE Traffic, by CP)
Displays data about byte and packet traffic by control point.
UC (Display UDP Connections)
Displays a list of UDP connections.
V (EE VTAM Command List)
Displays a list of VTAM commands useful in diagnosing EE.
History
Use the following shortcuts to display historical information:
/IPHIST
Displays TCP/IP data history options.
/IPHIST.B
Displays connection and event history reports.
/IPHIST.CT
Displays all saved CTRACE traces.
/IPHIST.EX
Extracts all TCP/IP events to a data set.
/IPHIST.P
Prints connection and event details, and summaries.
/IPHIST.ST
Displays all saved SmartTrace traces.

IP Nodes
Chapter 3: Shortcuts 25
IP Nodes
Use the following shortcut to display information about IP nodes:
/IPNODE
Displays the IP node monitor.
Line Commands
Use the following line commands from the IP node monitor to display more
information about IP nodes:
AL (Display Alerts)
Displays alerts.
H (Display Performance History)
Displays performance data.
The attribute list shows all performance attributes being monitored for the
resource.
HI (Display Host Interface List)
Displays the host interface list.
IMM (Intensive Monitoring Mode)
Lets you define intensive monitoring parameters for an attribute.
IMR (Intensive Monitor Reset)
Resets the selected IP node to the group attribute rate, effectively switching
off intensive monitoring mode.
OV (Display Performance Overview)
Displays a performance overview, which compares the most recent
performance of resources.
P (Ping an IP Node)
Pings a foreign host to test connectivity.
PT (Activate Packet Trace)
Activates SmartTrace packet tracing.
PTD (Inactivate and Delete Packet Trace)
Inactivates and deletes a SmartTrace packet trace.
PTI (Inactivate Packet Trace)
Inactivates a SmartTrace packet trace.

IP Nodes
26 Quick Reference Guide
PTV (View Packet Trace)
Displays a SmartTrace packet trace.
RT (Display Routing Table)
Displays the routing table.
SI (Display Host System Information)
Displays information about the host system.
TN (Start a Telnet Connection)
Starts a Telnet connection to the selected IP node.
TR (Perform Trace Route)
Sends a trace route request to the selected IP node.

IP Security
Chapter 3: Shortcuts 27
IP Security
Use the following shortcuts to display information about IP security:
/IPSEC
Displays the IPSec menu.
/IPSEC.D
Lists dynamic tunnels.
/IPSEC.F
Lists IP filters.
/IPSEC.H
Displays IP security performance history.
/IPSEC.K
Lists IKE tunnels.
/IPSEC.M
Lists manual tunnels.
/IPSEC.S
Displays IP security summary.
/IPSEC.T
IP security traffic test.
/SECURE
Displays the IP Security menu.
/SECURE.A
Lists the tasks that have active connections using AT-TLS.
/SECURE.F
Lists the users that have active FTP connections.
/SECURE.S
Lists the tasks that have active connections using SSL/TLS.
/SECURE.T
Lists the VTAM applications that have active Telnet connections.
Log
28 Quick Reference Guide
Log
Use the following shortcut to display log information:
/LOG
Displays the activity log.
Monitors
Use the following shortcuts to display monitors:
/ALERTS
Displays the alert monitor.
/GMON
Displays the graphical monitor.
/IPMON
Displays the IP resource monitor.
/IPNODE
Displays the IP node monitor.
OSAs
Chapter 3: Shortcuts 29
OSAs
Use the following shortcuts to display information about Open Systems Adapters
(OSAs):
/OSA
Displays OSA management options.
/OSA.D
Displays general information.
/OSA.DL
Displays the OSA device list.
/OSA.H
Displays performance data.
The attribute list shows all performance attributes being monitored for the
resource.
/OSA.OAT
Displays the OSA address table (OAT) returned from OSA/SF.
/OSA.OV
Displays a performance overview, which compares the most recent
performance of resources.
/OSAMON
Displays the IP resource monitor, filtered to display OSA resources.

Performance
30 Quick Reference Guide
Line Commands
Use the following line commands from the resource monitor to display more
information about OSAs:
AL (Display Alerts)
Displays alerts.
CF (Display OSA Configuration Settings)
Displays OSA configuration settings.
D/S (Display General Information)
Displays general information.
DL (Display Device List)
Displays OSA device list.
H (Display Performance History)
Displays performance data.
The attribute list shows all performance attributes being monitored for the
resource.
OAT (Display OAT Table)
Displays the OSA address table returned from OSA/SF.
OV (Display Performance Overview)
Displays a performance overview, which compares the most recent
performance of resources.
Performance
Use the following shortcut to display performance information:
/PERF
Displays performance overview options.
SmartTrace Packet Tracing
Chapter 3: Shortcuts 31
SmartTrace Packet Tracing
Use the following shortcuts to display information about SmartTrace packet
tracing:
/LIBPCAP
Imports the packet trace in a libpcap file.
/SMART
Displays SmartTrace packet tracing options.
/TRACES
Lists both active and ended SmartTrace definitions.
/TRADD
Adds a SmartTrace definition.
/TRALL
Lists all SmartTrace traces.
/TRSAV
Lists all saved SmartTrace output.

SmartTrace Packet Tracing
32 Quick Reference Guide
Line Commands
Use the following line commands to display more information about SmartTrace
packet tracing:
. (Expand or Collapse)
Expands a currently collapsed definition or collapses a currently expanded
definition.
A (Activate Trace Definition)
Activates tracing for a SmartTrace tracing definition.
D (Delete Trace Definition)
Deletes a SmartTrace trace definition.
DA (Delete Trace Definition and all Saved Traces)
Deletes a saved SmartTrace trace definition and all running, ended, and
saved SmartTrace traces.
I (Inactivate Tracing for Trace Definition)
Inactivates tracing for a SmartTrace definition, including running traces.
U (Update Trace Definition)
Displays SmartTrace trace definitions so that you can change the settings.
V (View Trace Definition)
Displays the SmartTrace trace definition.
Stack Interfaces and Devices
Chapter 3: Shortcuts 33
Stack Interfaces and Devices
Use the following shortcuts to display information about stack interfaces and
devices:
/DEVLINK
Displays stack interface and device link options.
/DEVLINK.DL
Displays the devices and links configured for the stack.
/DEVLINK.H
Display stack interface performance history.
/DEVLINK.OV
Display performance overview and baselines.
/DEVLINK.S
Display the busiest interfaces summary.
/DEVLINK.TRP
Display traffic for all interfaces, by protocol.
/DEVLINK.TRS
Display traffic for all interfaces.
Stacks
34 Quick Reference Guide
Stacks
Use the following shortcuts to display information about stacks:
/CONFIG
Displays stack configuration options.
/SMARTST
Displays SmartTrace packet tracing options for stacks.
/STACK
Displays the stack management options.
/STACK.DL
Displays information about the devices and links configured for the stack.
/STACK.IC
Displays the state of active IP connections.
/STACK.ICF
Displays IP connections derived from the packet analyzer.
/STACK.IPM
Displays an analysis of the stack, which includes TCP, UDP and IP statistics.
/STACK.IT
Displays the state of active Telnet connections.
/STACK.NS
Displays the Netstat command list, which you can issue against the stack.
/STACK.RT
Displays the routing table.
/STACK.S
Displays an activity summary of the stack, in a hierarchical format.
/STACK.TRS
Displays traffic statistics for the stack.
/STKMON
Displays the IP resource monitor, filtered to display stack resources.
/STKPERF
Displays performance history options for the stack.
Stacks
Chapter 3: Shortcuts 35
Line Commands
Use the following line commands from the resource monitor to display more
information about stacks:
AL (Display Alerts)
Displays alerts.
CMD (Issue Modify to Stack)
Lets you issue modify commands to a stack.
D (Display Address Space)
Displays resource status.
DL (Display Stack Network Interfaces)
Displays information about the devices and links configured for the stack.
DP (Display Profile Configuration Libraries)
Displays information about the stack configuration.
DT (Graph TCP Connection Duration Times)
Displays the distribution of terminated connections by durations.
H (Display Performance History)
Displays performance data.
The attribute list shows only the performance attributes being monitored for
the stack address space.
IC (List IP Connections)
Displays the state of active IP connections.
ICF (Display IP Connections Advanced)
Displays IP connections derived from the packet analyzer.
IF (List FTP Connections)
Lists FTP connections with information such as client and server, file being
transferred, and connection status.
IL (List TCP Listeners)
Lists listeners with information such as local port and connection backlog.
IP (Display IP, TCP, and UDP Performance)
Displays performance data about stack IP network, TCP, and UDP protocol
activity.

Stacks
36 Quick Reference Guide
IPM (Display IP, TCP, and UDP Summary)
Displays an analysis of the stack, which includes TCP, UDP and IP statistics.
IS (Display IPSec Performance History)
Displays information about the monitored IPSec attributes.
ISD (List Dynamic Tunnels (IPSec))
List dynamic tunnels for a stack configured with IPSECURITY.
ISF (List IP Filters (IPSec))
Lists IPSec IP filters for a stack configured with IPSECURITY.
ISK (List IKE Tunnels (IPSec))
List Internet Key Exchange (IKE) tunnels for a stack configured with
IPSECURITY.
ISM (List Manual Tunnels (IPSec))
List manual tunnels for a stack configured with IPSECURITY.
ISS (Display IPSec Summary)
Displays IPSec status and statistics.
IST (IPSec Traffic Test)
List the IP filters applied to the specified traffic.
IT (List Telnet Connections)
Displays the state of active Telnet connections.
ITF (List Telnet Connections Advanced)
Displays a list of Telnet connections derived from the packet analyzer.
LA (List Applications with IP Connections)
Lists applications with IP connections.
MIB (Display MIBinsight Browser)
Enables you to browse a selected management information base (MIB).
NS (Issue NetStat Command)
Lists the Netstat commands that you can select and issue.
O (Execute Obeyfile)
Executes the OBEYFILE command to make dynamic changes to the stack
configuration.
OV (Display Performance Overview)
Displays a performance overview, which compares the most recent
performance of resources.
Stacks
Chapter 3: Shortcuts 37
PT (Activate Packet Trace)
Activates SmartTrace packet tracing.
PTD (Inactivate and Delete Packet Trace)
Inactivates and deletes a SmartTrace packet trace.
PTI (Inactivate Packet Trace)
Inactivates a SmartTrace packet trace.
PTV (View Packet Trace)
Displays a SmartTrace packet trace.
RI (List Remote IP Addresses)
Lists the remote IP addresses that have traffic with the stack.
RT (Display Routing Table)
Displays the routing table.
S (Display Stack Performance Summary)
Displays an activity summary of the stack, in a hierarchical format.
SA (Display AT-TLS Summary)
Lists the tasks that have active connections using AT-TLS.
SF (Display FTP Summary)
Lists the users that have active FTP connections.
SS (Display SSL/TLS Summary)
Lists the tasks that have active connections using SSL/TLS.
ST (Display Telnet Summary)
Lists the VTAM applications that have active Telnet connections.
TC (List TCP Application Activity)
Displays traffic statistics for address spaces known to Packet Analyzer.
TRS (Display IP Traffic Statistics)
Displays information about byte and packet traffic.
W (Display Outstanding WTORs for Job/STC)
Displays all outstanding write-to-operator with reply (WTOR) messages.
WC (Display Connection Workload Performance)
Displays performance data for connection workload.
Summary
38 Quick Reference Guide
WI (Display Network Interface Performance)
Displays performance data for stack network interface or device link.
WF (Monitor FTP Workload Performance)
Displays performance data for FTP workload.
WT (Display Telnet Workload Performance)
Displays performance data for Telnet workload.
Limits: CIP only.
Summary
Use the following shortcut to display summary information:
/IPSUM
Displays a summary of conditions, IP traffic, and alerts.
Line Commands
Use the following line commands to display more summary information:
. (Expand or Collapse)
Expands a currently collapsed definition or collapses a currently expanded
definition.
H (Help)
Displays help or additional information about the selected line.

Telnet Servers
Chapter 3: Shortcuts 39
Telnet Servers
Use the following shortcuts to display information about Telnet servers:
/TELINFO
Displays Telnet server address space options.
/TELINFO.CL
Displays Logical Units (LUs) with problems.
/TELINFO.IT
Displays Telnet connections.
/TELINFO.ITF
Displays Telnet connections (advanced).
/TELINFO.TWL
Displays Telnet workload manager status.
VIPAs
40 Quick Reference Guide
VIPAs
Use the following shortcuts to display information about Virtual IP Addresses
(VIPAs):
/VIPA
Displays VIPA management options.
/VIPA.D
Displays general information.
/VIPA.H
Displays performance data.
The attribute list shows all performance attributes being monitored for the
resource.
/VIPA.IC
Displays the state of active IP connections.
/VIPA.ICF
Displays IP connections derived from the packet analyzer.
/VIPA.IT
Displays the state of active Telnet connections.
/VIPA.ITF
Displays a list of Telnet connections derived from the packet analyzer.
/VIPA.M
Lets you modify a dynamic VIPA definition using an obeyfile.
/VIPA.OV
Displays a performance overview, which compares the most recent
performance of resources.
/VIPAMON
Displays the IP resource monitor, filtered to display VIPA resources.

VIPAs
Chapter 3: Shortcuts 41
Line Commands
Use the following line commands from the resource monitor to display more
information about Virtual IP Addresses (VIPAs):
AL (Display Alerts)
Displays alerts.
CR (Display Connection Routing Table)
Displays the connection routing table list.
D/S (Display General Information)
Displays general information.
H (Display Performance History)
Displays performance data.
The attribute list shows all performance attributes being monitored for the
resource.
IC (List IP Connections)
Displays the state of active IP connections.
ICF (Display IP Connections Advanced)
Displays IP connections derived from the packet analyzer.
IT (List Telnet Connections)
Displays the state of active Telnet connections.
ITF (List Telnet Connections Advanced)
Displays a list of Telnet connections derived from the packet analyzer.
M (Modify VIPA Definition)
Lets you modify a dynamic VIPA definition using an obeyfile.
OV (Display Performance Overview)
Displays a performance overview, which compares the most recent
performance of resources.
UM (Update Monitoring Definition)
Updates the monitoring definition.

Chapter 4: Commands 43
Chapter 4: Commands
This section provides a quick reference to commands that can help you manage
your TCP/IP network. It provides information about the purpose and syntax. For
more information about the commands, see the online help.
This section contains the following topics:
How to Issue a Command (see page 43)
D Command (see page 44)
NETSTAT Command (see page 44)
NSLOOKUP Command (see page 44)
OBEYFILE Command (see page 44)
PING Command (see page 45)
SHOW SOCKETS Command (see page 45)
SHOW TCPIP Command (see page 45)
SHOW TELNET Command (see page 45)
SHOW USERS Command (see page 46)
SYSCMD Command (see page 46)
TELNET Command (see page 47)
TNCMD Command (see page 47)
TNDISC Command (see page 47)
TNSEND Command (see page 47)
TRACEROUTE Command (see page 48)
TRCACT Command (see page 48)
TRCINACT Command (see page 48)
How to Issue a Command
You can issue commands from the prompt in Operator Console Services (OCS) or
from a Command Entry panel.
To access OCS, enter =o at the prompt.
To access command entry, enter =cmd at the prompt.
Note: If you issue a command from a command entry panel, more options are
available to you, for example, scroll and print.
D Command
44 Quick Reference Guide
D Command
The D command displays a VTAM resource.
This command has the following syntax:
D { name | keyword | NET,ID=name }
NETSTAT Command
The NETSTAT command displays the current status of TCP/IP resources.
This command has the following syntax:
NETSTAT { ? | netstat_operands }
<ADDRESS=ip_address_mask >
< LU=lu_name_mask >
< APPL=application_name_mask >
< STACK=stackname | SSID=ssid >
NSLOOKUP Command
The NSLOOKUP command finds the name or address of a remote host.
This command has the following syntax:
NSLOOKUP { ? | host_name | ip_address }
< ADDRTYPE={4 | 6 | ANY} >
OBEYFILE Command
The OBEYFILE command executes the IBM TCP/IP configuration commands.
This command has the following syntax:
OBEYFILE { ? | dataset_name }
PING Command
Chapter 4: Commands 45
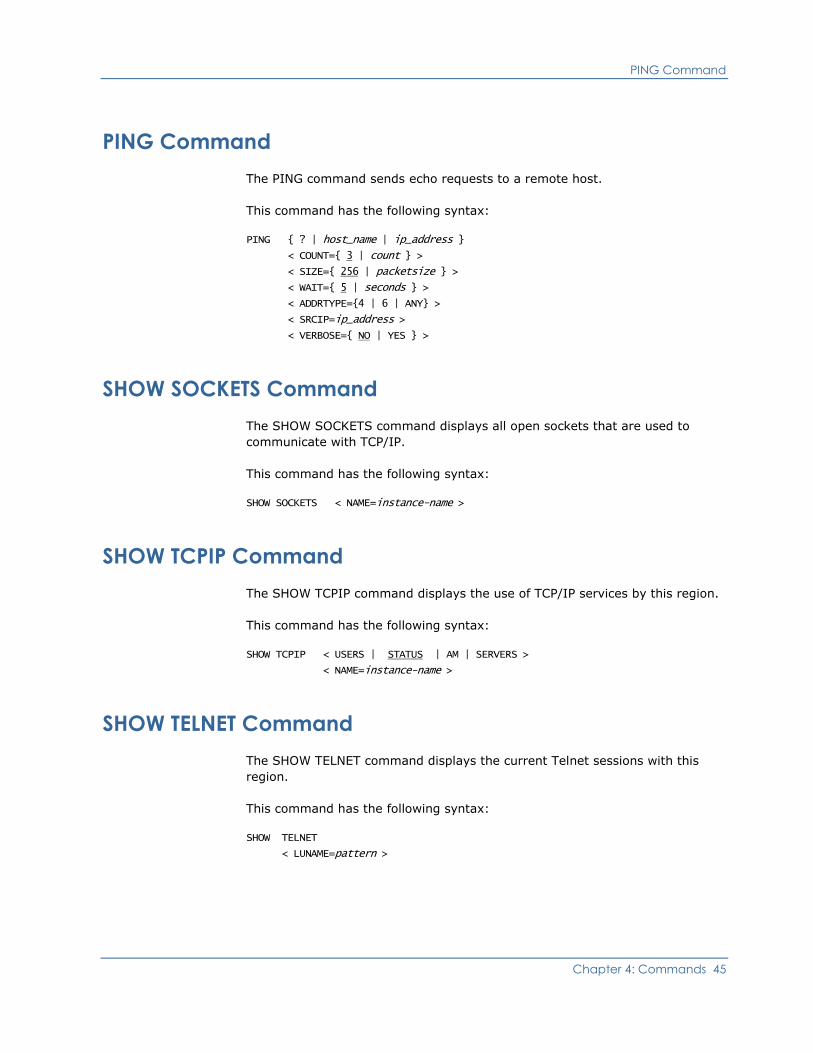
PING Command
The PING command sends echo requests to a remote host.
This command has the following syntax:
PING { ? | host_name | ip_address }
< COUNT={ 3 | count } >
< SIZE={ 256 | packetsize } >
< WAIT={ 5 | seconds } >
< ADDRTYPE={4 | 6 | ANY} >
< SRCIP=ip_address >
< VERBOSE={ NO | YES } >
SHOW SOCKETS Command
The SHOW SOCKETS command displays all open sockets that are used to
communicate with TCP/IP.
This command has the following syntax:
SHOW SOCKETS < NAME=instance-name >
SHOW TCPIP Command
The SHOW TCPIP command displays the use of TCP/IP services by this region.
This command has the following syntax:
SHOW TCPIP < USERS | STATUS | AM | SERVERS >
< NAME=instance-name >
SHOW TELNET Command
The SHOW TELNET command displays the current Telnet sessions with this
region.
This command has the following syntax:
SHOW TELNET
< LUNAME=pattern >

SHOW USERS Command
46 Quick Reference Guide
SHOW USERS Command
The SHOW USERS command displays the users currently signed on.
This command has the following syntax:
SHOW { USERS | USER } < =name >
< TYPE=usertype >
< SOURCE=source >
< IPDETAILS=YES | NO >
SYSCMD Command
The SYSCMD command issues a command to the operating system.
Note: SYSCMD is equivalent to MVS; therefore, you can substitute SYSCMD with
MVS.
This command has the following syntax:
SYSCMD < CON={ n | MASTER } >
< WAIT=nnn >
< MIGID={ * | ASIS | DEFAULT | NO | YES | EXIT } >
< DATA= > command-text
or
SYSCMD OPT=LOCK
< WAIT=nnn >
< MIGID={ * | ASIS | DEFAULT | NO | YES | EXIT } >
< DATA= > command-text
or
SYSCMD OPT=REL

TELNET Command
Chapter 4: Commands 47
TELNET Command
The TELNET command starts a Telnet session to a remote host.
This command has the following syntax:
TELNET { ? | host_name }
< PORT={ 23 | n } >
< ID={ host-name | name } >
< CTRL={ ¢ | c } >
< ENTER={ CRLF | CR } >
< MODE={ LINE | OCS | FS } >
< TRACE={ NO | YES } >
< TRTAB=name >
< COLOR=color | COLOUR=color >
< HLIGHT=highlight | HLITE=hilite >
TNCMD Command
The TNCMD command sends Telnet commands to a remote host.
This command has the following syntax:
TNCMD { ? | id }
< CMD={ IP | AO | AYT | BRK } >
TNDISC Command
The TNDISC command stops a Telnet connection immediately.
This command has the following syntax:
TNDISC { ? | id }
TNSEND Command
The TNSEND command sends data on a Telnet connection to a remote host.
This command has the following syntax:
TNSEND { ? | id }
< DATA= > message
TRACEROUTE Command
48 Quick Reference Guide
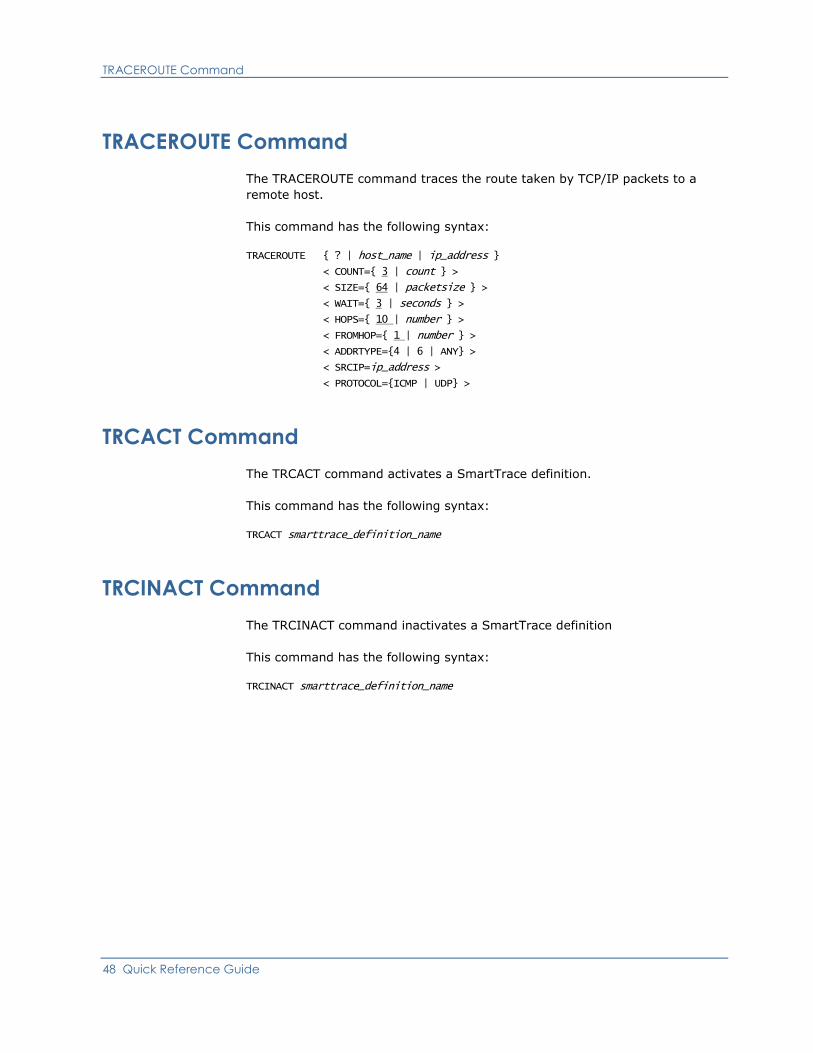
TRACEROUTE Command
The TRACEROUTE command traces the route taken by TCP/IP packets to a
remote host.
This command has the following syntax:
TRACEROUTE { ? | host_name | ip_address }
< COUNT={ 3 | count } >
< SIZE={ 64 | packetsize } >
< WAIT={ 3 | seconds } >
< HOPS={ 10 | number } >
< FROMHOP={ 1 | number } >
< ADDRTYPE={4 | 6 | ANY} >
< SRCIP=ip_address >
< PROTOCOL={ICMP | UDP} >
TRCACT Command
The TRCACT command activates a SmartTrace definition.
This command has the following syntax:
TRCACT smarttrace_definition_name
TRCINACT Command
The TRCINACT command inactivates a SmartTrace definition
This command has the following syntax:
TRCINACT smarttrace_definition_name