ca2+-induced phase separation in black lipid membranes and its effect on the transport of a...
TRANSCRIPT

Biochimica etBiophysicaActa 813 (1985) 221-229 221 Elsevier
BBA 72478
Ca 2 +-induced phase separat ion in black lipid m e m b r a n e s and its e f fect on the
t ranspor t of a hydrophobic ion
Alfred Mil ler a, Gi~nther Schmid t a, Hansj/3rg Eibl b and W o l f g a n g Kno l l a
Physik Department E22, Technische Universitht MiJnchen, James-Franck-Strasse, D-8046 Garching and b Max-Planck-lnstitutff~r Biophysikalische Chemie, Am Fassberg, D-3400 G6ttingen (F.R.G.)
(Received October 22nd, 1984)
Key words: Ion transport; Hydrophobic ion; Phase separation; Ca2+; Voltage jump-current relaxation; (Lipid bilayer)
Voltage jump-current relaxation studies have been performed with dipicrylamine-doped black membranes of binary lipid mixtures. As in the case of the carrier-mediated ion transport (Schmidt, G., Eihi, H. and Knoll, W. (1982) J. Membrane Biol. 70, 147-155) no evidence was found that the neutral lipid phosphatidyicholine (DPMPC) and the charged phosphatidic acid (DPMPA) are heterogeneously distributed in the membrane over the whole range of composition. However, besides a continuous dilution of the surface charges of DPMPA by the addition of DPMPC molecules, different structural properties of mixed membranes influence the kinetics of the dipicrylamine transport. The addition of Ca 2 + to the electrolyte induces a lipid phase separation within the membrane into two fluid phases of distinctly different characteristics of the translocation of hydrophobic ions. Thus, it is possible to determine a preliminary composition phase diagram for the D P M P A / D P M P C mixtures as a function of the Ca 2+ concentration.
Introduction
The induction of phase separation in artificial membranes of lipid mixtures is a weU-established phenomenon [1-7] although its physiological sig- nificance for biological membranes is still debated [8-13]. Particularly interesting are isothermally triggered lateral or transversal redistributions of charged lipids by ionic changes in the aqueous phase like variations of the pH and/or concentra- tions of mono- and divalent ions or by the addi- tion of charged polypeptides [2,3,5,6,14,15].
In order to address the question of how a membrane function like the transport of ions across the hydrophobic barrier is influenced by the struc-
Abbreviations: Hepes, 4-(2-hydroxyethyl)-l-piperazineethane- sulfonic acid; DPMPA, 1,2-dipentadecylmethylidene phos- phatidic acid; DPMPC, 1,2-dipentadecylmethylidenephospha- tidylclioline.
ture and the order of the lipid that surrounds the functional unit we have performed electrical mea- surements with model ionophores incorporated into bilayer membranes of binary lipid mixtures [16]. We could show that these so-called black films are well-suited to study the coupling of model transport systems to the lateral organisation of the two lipid components. By the analysis of the kinetic parameters of the carrier-mediated ion transport it was demonstrated that Ca 2÷ also in these model membranes can induce a lateral phase separation which modifies the transport characteristics con- siderably.
If the concept of the lipid-controlled function of an integral protein is more generally valid, transport systems other than carriers should also be sensitive to changes in the lateral distribution of the lipids in a mixed membrane. We have extended therefore our voltage jump-current re- laxation studies to the transport of hydrophobic
0005-2736/85/$03.30 © 1985 Elsevier Science Publishers B.V. (Biomedical Division)

222
ions. As in the case of the carrier valinomycin, the molecular details of the translocation of di- picrylamine across lipid membranes are well established [17-19]. Moreover, the analysis of the kinetic data requires the determination of only one exponential decay. A major advantage, however, is the fact that the transport of dipicrylamine across a charged membrane is distinctly different from the translocation across a neutral one. It is there- fore possible to observe even small changes of the membrane composition and determine rather ac- curately the phase boundaries in the Ca2÷-induced demixing region of the phase diagram.
Materials and Methods
The synthesis of the lipids used in this s t u d y - 1,2-dipentadecylmethylidenephosphatidyl- choline (DPMPC) and 1,2-dipentadecylmethyl- idene phosphatidic acid (DPMPA) - is described elsewhere [20]. All measurements were performed with black lipid membranes which were formed by the method of Mueller et al. [21] from 1% (w/v) lipid solutions in n-decane (Fluka, purum). Mem- brane areas were typically 10 -2. cm 2. The experi- ments were started 20-30 rain after the complete blackening of the membranes. The temperature was 36°C where all lipids are fluid [22,23]. Di- picrylamine (Fluka, puriss) was added to the buffered electrolyte solutions (1 M NaC1/10 mM Hepes (pH 6, adjusted by NaOH and HC1)) to give final concentrations between 1 • 10 -9 and 4. 10 -5 M. At that pH, DPMPA has one negative charge [23]. For the studies of the calcium effect, various amounts of CaC12 salt were added to the aqueous solutions. The relaxation behavior was independent of the way Ca 2÷ was added: in some cases, it was applied after the membrane had been formed in Ca2+-free buffer, in others (mostly for the high Ca 2+ concentrations), the Ca 2+ was al- ready in the electrolyte before the membrane was formed.
The set-up for the voltage jump-current relaxa- tion studies was similar to those described previ- ously [24,25] with some modifications: a commer- cial pulse generator (HP 8013 B) triggered via opto-coupler a self-designed pulsformer [26] which reduced the slow voltage increase during the pulse to less than 0.1% of the pulse height with only a
slight increase of the noise level. A storage oscilloscope (Tectronix 5115, with
plug-in amplifier 5 A 22 N and time-base 5 B 12 N) was used as a fast amplifier. Its output was fed into a waveform recorder (Gould Biomation 2805) whose memory could be transferred to a micro- computer by a self-designed interface. Single-shot relaxation measurements were averaged (up to 512 times) and the data finally stored on a floppy disk for later analysis.
Results and Discussion
Analysis of the current relaxation The transport of hydrophobic ions like di-
picrylamine through a lipid bilayer membrane is assumed to occur in three consecutive steps as first suggested by Ketterer et al. [17]: (i) adsorption from the aqueous phase into the potential energy minimum at the membrane interface; (ii) translo- cation across the central barrier to the opposite potential minimum; (iii) desorption into the aque- ous phase. These kinetic processes are assumed to be first-order and have been described by rate constants: Kma for the adsorption and desorption, K i for the translocation step. It has been estab- lished that for many cases the inequality g m a << g i
is well-satisfied for dipicrylamine [17,27]. Then, the electric current transient, J(t), following the application of a voltage jump mirrors the voltage-dependent redistribution of the lipophilic ions between the two potential minima at the membrane interfaces. For certain membranes, several additional effects have been reported, some of which modify the time dependence of the tran- sient current considerably. A limited number of 'binding sites' for dipicrylamine ions at the mem- brane interface are responsible for a saturation behavior of the current at high dipicrylamine con- centrations [17,27-30]. Electrostatic interaction between the hydrophobic ions in the membrane [30,31] and membrane fluidity changes [27] have been proposed as a reason for the observed di- picrylamine concentration dependence of the translocation rate c o n s t a n t K i and hence the cur- rent transients. Most seriously affected is the ex- perimental determination of the kinetic parameters of the ion relaxation across the membrane if ad- sorption and desorption and diffusive processes in

the aqueous boundary layer can no longer be ignored. As has been shown by Jordan and Stark [19] such processes can modify substantially the time dependence of the current relaxation and in some cases even prevent a determination of the translocation rate constant K i. I t turned out, how- ever, that for the lipids used in this study, even when working with the charged D P M P A it always was possible to determine a relaxation time, z, f rom the initial slope of the current relaxation after a voltage jump according to Ref. 32:
I d (In J( t ) ) , ( I) "r dt =o
The initial conductivity, ~'0 = X(t = 0), which is
given by 2~o = Jo with J0 = current at zero time, U.A
A = membrane area, is a second parameter which is highly dependent on the lipid composi t ion of the membrane.
Three examples of current relaxations after a voltage j u m p of U = 50 mV are shown in Fig. 1 for a D P M P C membrane, a D P M P A membrane and a 1 : 1 mixture of both lipids. All measuring curves are obtained by averaging 100 times. For better comparison, the curves are all scaled to unity by dividing each data point by the appropriate J0- It can be seen that indeed with sufficient accuracy for our purposes each current relaxation can be characterized by two parameters, i.e., the relaxa- t ion time and the initial conductivity.
Kinetics of dipicrylamine translocation across mixed membranes
In order to find the best experimental condi- tions that allow us to analyse the transport kinetics of dipicrylamine over the whole composi t ion range of binary lipid mixtures as membranes we first performed a set of measurements at different di- picrylamine concentrat ions in the aqueous phase. On the basis of these results, we choose for the following experiments a bulk dipicrylamine con- centrat ion of 1 . 1 0 -6 M. At that concentrat ion, the conductivities are sufficiently high and satura- tion effects that come into play for DPMPC-r i ch membranes [27,30] do not disturb yet too much. In a first series of measurements, we investigated in detail the kinetics of the dipicrylamine transloca- t ion across membranes composed of binary mix-
223
1 0 ~
l ( t ) I-7-
0.5
0.4.
0.3
0.2
i' 00 I0 2~0 3tO ~0
t/ms
Fig. 1. Semilogarithmic plots of current relaxations after the application of a voltage jump of U = 50 mV. Shown are the averaged curves (scaled to unity by dividing each data point J(t) by the current at zero time, J0) of a pure DPMPC membrane (1), pure DPMPA (2) and a 1:1 mixture of both lipids (3). From the analysis of the straight lines, the relaxation times, ~', and the initial conductivities, A0, are deduced: (1) ~- = 20.3 ms, Ao = 5.6-10 -4 ~-l-cm-2. (2) • = 2.5 ms, h0 = 9. 10 -5 ~2-1.cm -2. (3) r=3.7 ms, ~,0=7.5-10 -4 12-1.cm -2. T= 36°C; pH 6; 10 mM Hepes; 1 M NaC1; dipicrylamine concentration = 1-10- 6 M.
C/m s
2O
PC x ~A(_
10 pH
°o ols X
Fig. 2. Dependence of the relaxation time, ~', on the DPMPC content, x, in mixed membranes. Mean values-t-S.D.
224
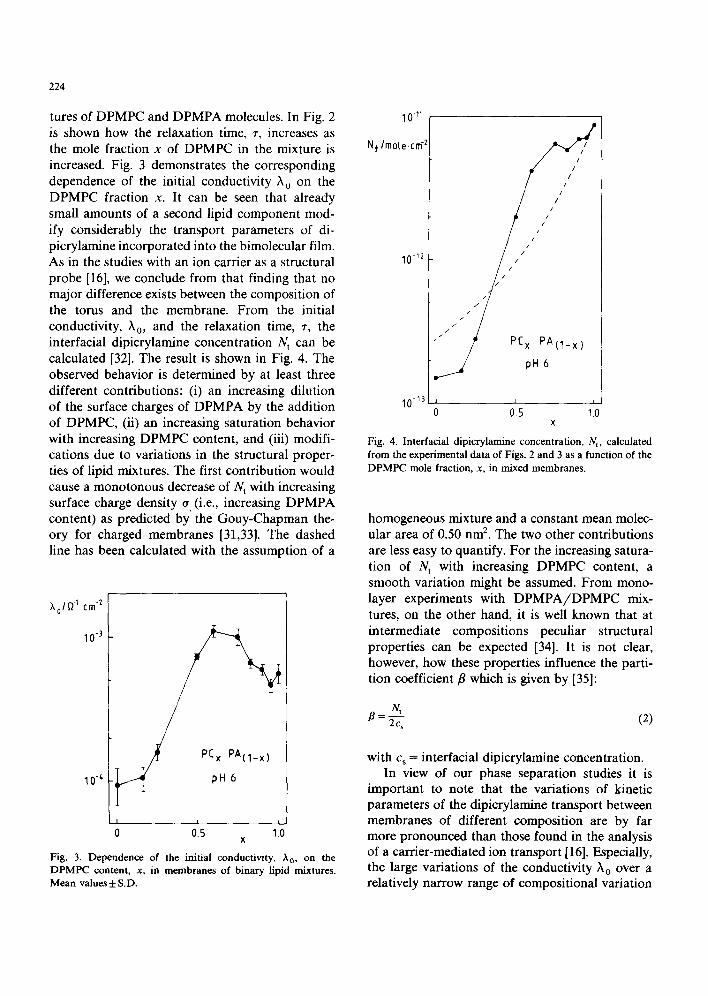
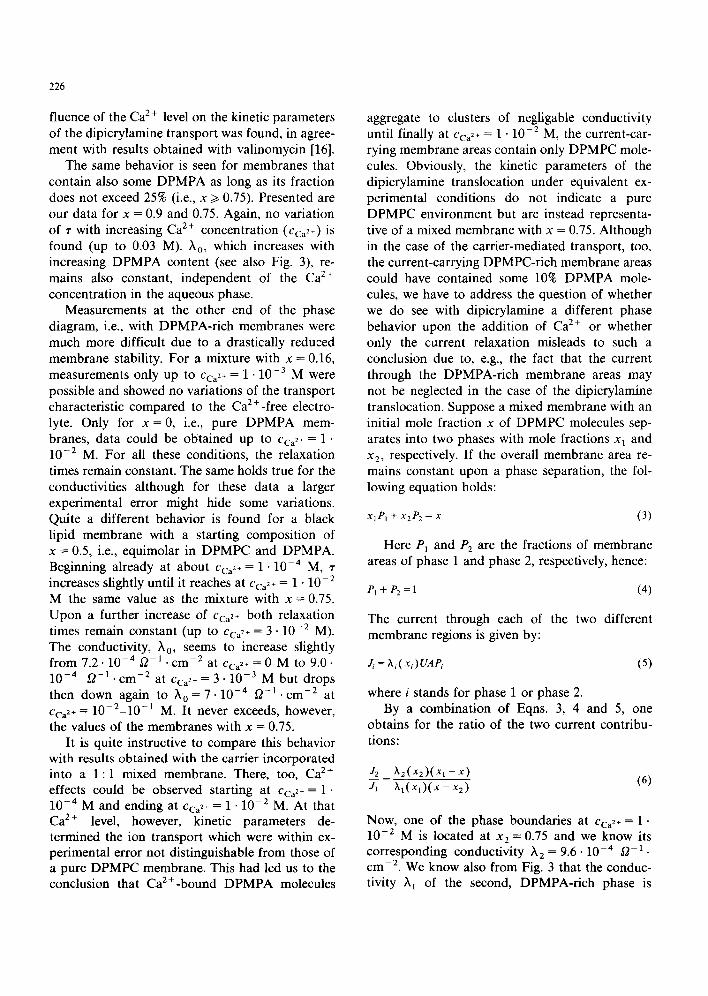
tures of DPMPC and DPMPA molecules. In Fig. 2 is shown how the relaxation time, r, increases as the mole fraction x of DPMPC in the mixture is increased. Fig. 3 demonstrates the corresponding dependence of the initial conductivity t 0 on the DPMPC fraction x. It can be seen that already small amounts of a second lipid component mod- ify considerably the transport parameters of di- picrylamine incorporated into the bimolecular film. As in the studies with an ion carrier as a structural probe [16], we conclude from that finding that no major difference exists between the composition of the torus and the membrane. From the initial conductivity, X0, and the relaxation time, ~, the interfacial dipicrylamine concentration N t can be calculated [32]. The result is shown in Fig. 4. The observed behavior is determined by at least three different contributions: (i) an increasing dilution of the surface charges of DPMPA by the addition of DPMPC, (ii) an increasing saturation behavior with increasing DPMPC content, and (iii) modifi- cations due to variations in the structural proper- ties of lipid mixtures. The first contribution would cause a monotonous decrease of N t with increasing surface charge density o (i.e., increasing DPMPA content) as predicted by the Gouy-Chapman the- ory for charged membranes [31,33]. The dashed line has been calculated with the assumption of a
X01Q ~ crn z
i0-3
3 - I / i0-~ ~ pH 6
J .
I I
0.5 10 X
Fig. 3. Dependence o f the ini t ial conductivity, I o , on the DPMPC content, x, in membranes of binary lipid mixtures. Mean values + S.D.
10 -11
Nf Imote.crn -2
i0-12
10 13
/ i I
iii / i / I
/ / /
" pc x PA(I_x)
pH6
0 0 5 1.0 X
Fig. 4. Interfacial dipicrylamine concentration, Nt, calculated from the experimental data of Figs. 2 and 3 as a function of the DPMPC mole fraction, x, in mixed membranes.
homogeneous mixture and a constant mean molec- ular area of 0.50 nm 2. The two other contributions are less easy to quantify. For the increasing satura- tion of N t with increasing DPMPC content, a smooth variation might be assumed. From mono- layer experiments with D P M P A / D P M P C mix- tures, on the other hand, it is well known that at intermediate compositions peculiar structural properties can be expected [34]. It is not clear, however, how these properties influence the parti- tion coefficient/~ which is given by [35]:
t~ = ~ (2)
with c s = interfacial dipicrylamine concentration. In view of our phase separation studies it is
important to note that the variations of kinetic parameters of the dipicrylamine transport between membranes of different composition are by far more pronounced than those found in the analysis of a carrier-mediated ion transport [16]. Especially, the large variations of the conductivity ~0 over a relatively narrow range of compositional variation

is very helpful, as it allows one in many cases to neglect the current contributions by the DPMPA- rich segregated domains.
Ca2+-induced phase separation in mixed mem- branes
The main aim of the present study was to test 'whether the results and interpretations concerning the coupling of membrane structure and function obtained by the analysis of the kinetics of the carrier-mediated ion transport are valid also for the translocation of a hydrophobic ion and might therefore be generally extended to other transport systems. For that purpose, voltage jump-current relaxation studies were performed with mem- branes of different binary lipid mixtures with in- creasing Ca 2 ÷ concentrations in the bulk aqueous phase. Typical examples of averaged current re-
225
r /ms
3O
20
PCx P A ( 1 - x ) ; pH 6
x
1.o -.~} . . . . . . . . . . . . . . . . . . . . . . . . . . . +-
0 9 - c~ ~ ) - - - ~ ) - - ¢ - -
10 07s ',+ ,+ * .~:--~ 0.5 -. . ~ - - " _o. 2s -~ $=.._~ : -7:~. : - ~ - . . . . . . . . . . . + . . . . . . . . . . . . . . . .~ .......
0 0 ...... ~ '.4 J , , i , . ,~" , . , 0 10 -~' 10 .3 10 .z 10 -~
Coo-IN
Fig. 6. Relaxation times, ~-, as a function of Ca 2 + concentrat ion in the bulk aqueous phase for membranes of different lipid composit ion: ( ( 3 - . - ( 3 ) PC, x = l ; ( [ ] - - - - n ) x = 0.9; (e e) x=0.75; (v . . . . . . v) x=0.5; (* . . . . . *) x= 0.25; (O) . . . . . . ~ ) x = 0. Data points are mean va lues+ S.D. of at least five membranes.
0.05 0 S 10 15 20 t/ms
1.0
l ( t )
T
0.5
0.2
0.1
Fig. 5. Semilogarithmic plots of current relaxations after the application of a voltage j ump of U = 50 mV. Shown are the averaged curves (scaled to unity by dividing each data point J(t) by the current value at zero time, Jo) of a 1:1 mixture of D P M P A and D P M P C with no Ca 2+ in the aqueous phase (1); with Cc,~+ = l - 1 0 - 3 M (2); and Cca2+ = 1 . 1 0 -2 M (3). The relaxation times, ¢, and initial conductivities, ;k0, are: • = 3.5 ms and h 0 = 7 . 5 - 1 0 - a 12-1-cm -2 for (1); , = 5 . 1 ms and h 0 = 8.8-10 -4 12-1 .cm-2 for (2); ~" = 8.6 ms and h 0 = 8-10 -4
- t . c m - 2 for (3), respectively. The aqueous phase contained 1 M N a C i / 1 0 m M Hepes (pH 6); T = 36°C; dipicrylamine concentrat ion = 1.10 -6 M.
laxation curves are shown in Fig. 5 for different Ca 2+ concentrations. The membrane-forming solution contained a 1 : 1 mixture of DPMPA and DPMPC. All measuriang curves could be analysed in terms of an initial slope - 1/~- = d (In l ( t ) ) /d t and an iniatial conductivity )% =Jo/(U.A). The results for all investigated mixtures are sum- marized in Fig. 6 for the relaxation times and in Fig. 7 for the conductivities, respectively.
For a pure DPMPC membrane (x = 1), no in-
10 3
X o / f l l c ~
x o 7 s
os ---+- . . . . . . ,~ " ~ - - - , # - - ~ o9 - - 5 ~ - - - - ~ - - - ¢ ~ - - ~ ~ , l o ~-~ . . . . .
PCx P A ( 1 - x ) ; p H 6
0 10 t'. 10 -+ 10 .2 10 -1
cco+dH
Fig. 7. Initial conductivities, Xo, as a function of the Ca 2+ concentrat ion in the bulk aqueous phase for membranes of different lipid composit ion. The symbols are as in Fig. 6, Data points are mean values + S.D.
226
fluence of the Ca 2 + level on the kinetic parameters of the dipicrylamine transport was found, in agree- ment with results obtained with valinomycin [16].
The same behavior is seen for membranes that contain also some DPMPA as long as its fraction does not exceed 25% (i.e., x >/0.75). Presented are our data for x = 0.9 and 0.75. Again, no variation of ~" with increasing Ca z÷ concentration (Cca2+) is found (up to 0.03 M). ~0, which increases with increasing DPMPA content (see also Fig. 3), re- mains also constant, independent of the Ca 2÷ concentration in the aqueous phase.
Measurements at the other end of the phase diagram, i.e., with DPMPA-rich membranes were much more difficult due to a drastically reduced membrane stability. For a mixture with x = 0.16, measurements only up to CCa2+ = 1 • 10 -3 M were possible and showed no variations of the transport characteristic compared to the Ca2+-free electro- lyte. Only for x = 0, i.e., pure DPMPA mem- branes, data could be obtained up to Cca2+ = 1" 10 -2 M. For all these conditions, the relaxation times remain constant. The same holds true for the conductivities although for these data a larger experimental error might hide some variations. Quite a different behavior is found for a black lipid membrane with a starting composition of x = 0.5, i.e., equimolar in DPMPC and DPMPA. Beginning already at about Cca2÷ = 1" 10 -4 M, increases slightly until it reaches at Cca~+ = 1 • 10 -2 M the same value as the mixture with x = 0.75. Upon a further increase of CCa2+ both relaxation times remain constant (up to Cca~* = 3" 10 -2 M). The conductivity, ~0, seems to increase slightly from 7.2.10 -4 $2 -1 • cm -2 at CCa2* = 0 M to 9.0- 10-4 ~-1 . cm-2 at Cca~+ = 3" 10 -3 M but drops then down again to ~0 = 7-10 -4 ~ - 1 . cm-2 at CCa2+ = 1 0 - 2 - 1 0 -1 M. It never exceeds, however, the values of the membranes with x = 0.75.
It is quite instructive to compare this behavior with results obtained with the carrier incorporated into a 1 :1 mixed membrane. There, too, Ca 2÷ effects could be observed starting at CCa2* = 1" 10 - 4 M and ending at ¢Ca2+ = 1 • 10 -2 M. At that Ca 2+ level, however, kinetic parameters de- termined the ion transport which were within ex- perimental error not distinguishable from those of a pure DPMPC membrane. This had led us to the conclusion that Ca2+-bound DPMPA molecules
aggregate to clusters of negligable conductivity until finally at CCa2+ = 1 • 10 -2 M, the current-car- rying membrane areas contain only DPMPC mole- cules. Obviously, the kinetic parameters of the dipicrylamine translocation under equivalent ex- perimental conditions do not indicate a pure DPMPC environment but are instead representa- tive of a mixed membrane with x = 0.75. Although in the case of the carrier-mediated transport, too, the current-carrying DPMPC-rich membrane areas could have contained some 10% DPMPA mole- cules, we have to address the question of whether we do see with dipicrylamine a different phase behavior upon the addition of Ca z+ or whether only the current relaxation misleads to such a conclusion due to, e.g., the fact that the current through the DPMPA-rich membrane areas may not be neglected in the case of the dipicrylamine translocation. Suppose a mixed membrane with an initial mole fraction x of DPMPC molecules sep- arates into two phases with mole fractions x I and x 2, respectively. If the overall membrane area re- mains constant upon a phase separation, the fol- lowing equation holds:
XlP1 + x2P2 = x (3)
Here P1 and P2 are the fractions of membrane areas of phase 1 and phase 2, respectively, hence:
P1 + P2 = 1 (4)
The current through each of the two different membrane regions is given by:
= x, ( x , ) UAei (5)
where i stands for phase 1 or phase 2. By a combination of Eqns. 3, 4 and 5, one
obtains for the ratio of the two current contribu- tions:
s2 x2(x:)(Xl- x) sl x l (x l ) (x- x2) (6)
Now, one of the phase boundaries at Cca2+ = 1. 10 -2 M is located at x 2 = 0.75 and we know its corresponding conductivity ?~2 = 9.6- 10 -4 /2 -1 • cm-2. We know also from Fig. 3 that the conduc- tivity 3k 1 of the second, DPMPA-rich phase is

about one order of magnitude lower. A calculation on the basis of Eqn. 6 for a mixture with x = 0.5 shows that as long as xl remains below about 0.25 the current through the demixed membrane is dominated, as in the case of the carrier transport, by the DPMPC-rich membrane areas, i.e., J2/Jl >1 10. It is therefore reasonable that for this equimolar mixture an increasing relaxation time is found upon the addition of Ca 2+ (see Fig. 6). The cur- rent through the separated DPMPA-rich domains with the faster kinetic is simply too low to be detected. The increase of • corresponds to a grad- ual change of composition of the DPMPC-rich domains from x = 0.5 to x = 0.75. By comparing these relaxation times obtained for different Ca =+ concentrations with those found for different mix- tures (see Fig. 2), it is therefore possible to quan- tify the DPMPC mole fraction of these domains, thereby obtaining one phase boundary of the coexistence region in detail.
On the other hand, Eqn. 6 also tells us that wherever the second phase boundary x 2 is located it is possible to choose the initial mole fraction, x, in such a way that the current contributions of the two membrane regions corresponding to phase 1 and 2, respectively, are comparable. One experi- mental example is given in Fig. 8. Here, the initial mole fraction was choosen at x = 0.25. (Up to a Ca 2+ concentration of 1 -10 - 4 M, no change in the kinetic parameters of the dipicrylamine translocation was found (see also Fig. 6).) At 1 • 10 -2 M Ca 2+, the relaxation process could be well-fitted by the sum of two exponentials, one with a relaxation time r2 = 9.6 ms and the second with 22 = 3.4 ms. While the longer relaxation time is nearly identical to those values found for a mixed membrane with x = 0.75, the faster process has a time constant similar to those found for the dipicrylamine translocation through a membrane rich in DPMPA (see (Fig. 2). The conductivity of a pure DPMPA membrane did not change much if Ca 2+ was added (see Fig. 7). If we assume that the same holds true for membranes with only little DPMPC, i.e., that we can approximate the con- ductivity of a DPMPA-rich membrane by its value in a Ca=+-free environment, we can correlate x 1 and k (x l ) according to the experimental data pre- sented in Fig. 3. As can be seen from Eqn. 6, the knowledge of J2/Jl allows one then to derive the
227
l(t)
0.5
02 \ \
O. \\\\ \\\\ \
\
i i
005 5 10 15 t/ms 20
Fig. 8. Semilogafithrrac plot of the current relaxation after the applicatien of a vo|tage jump of U = 50 mV. The membrane was composed of a binary nuxture of DPMPA and DPMPC with x = 0.25. The aqueous phase contained 1.10 -2 M CaCI 2 in add i t ion to 1 M N a C I and 10 m M Hepes (pH 6; T = 36°C); d ip ic ry lamine concen t ra t ion = 1 . 1 0 -6 M. The full l ine is the
averaged exper imenta l re laxa t ion curve. The broken curve is
c a l c u l a t e d a c c o r d i n g to J ( t ) = Jo,l e x p ( - t / ~ q ) + Jo,z e x p ( - t / r 2 ) with Jo, a = J0,2 = 0.5 and T 1 = 9.6 ms, z = 3.4 ms. Fo r be t te r clari ty, this fit curve is somewhat shif ted relat ive to
the exper imenta l data.
desired second phase boundary which is given by the mole fraction of DPMPC, x 1. This is il- lustrated in Fig. 9 for x = 0.25. Even if one admits large experimental errors in the determination of J2/J1, the range of possible values of x a is rather limited. For the example of Fig. 8 we estimate the range for Jz/J1 to be between 0.5 and 3 and obtain therefore a possible range for x I = 0.1-0.2. Pure DPMPA domains seem to be unlikely because J2/J1 = 5.2 is certainly outside the experimental error.
All these results are summarized in Fig. 10. For very low Ca 2+ concentrations, a homogeneous mixture of DPMPC and DPMPA over the whole range of composition is suggested. This region extends for mixtures rich in DPMPC (x >/0.75) and possibly also for mixtures with only very little DPMPC (x ~< 0.1) up to high Ca 2+ levels (CCa2+ = 3" 10 -2 M). At intermediate compositions, the

228
1211 ~
2
0 j
0
C ca,,÷ =10-2 M
X =0.25
X 2 =0.75
I
0.I 0.2 X 1
Fig. 9. Ratio of the current contributions 12/11 through the two membrane areas of different composition, xl, z, in a demixed membrane. For details see text, in particular Eqns. 3-6.
mixtures are destabilized upon the addition of Ca 2 + and separate into two coexisting fluid phases. For the upper phase boundary, rather accurate values could be deduced. For the lower one, only estimates were obtained. Completely unknown, so far, are the molecular details of the interactions that lead to that instability.
10
Homogeneous ~ o . . . .
M ix ture
0.5 .o--1 #
~,_ Two Phose Region
"." : . P [ x PA(1- x)
0 J S~ ' ' ' t 0 10 4, 10 .3 10 "2 10 -~
Cca-/M
Fig. 10. Tentative phase diagram of binary mixture of DPMPA and DPMPC as a function of the Ca 2 + concentration in the bulk aqueous phase.
References
1 Kleemann, W., Grant, C.W.M. and McConnell, H.M. (1974) J. Supramol. Struct. 2, 609-616
2 Ito, T. and Ohnishi, S. (1974) Biochim. Biophys. Acta 352, 29-37
3 Galla, H.-J. and Sackmann, E. (1975) J. Am. Chem. Soc. 97, 4114-4125
4 Luna, E.J. and McConnell, H.M. (1977) Biochim. Biophys. Acta 470, 303-316
5 Van Dijck, P.W.M., De Kruijff, B., Verkleij, A.J., Van Deenen, LL.M. and De Gier, J. (1978) Biochim. Biophys. Acta 512, 84-96
6 Tokutomi, S., Ohki, K. and Ohnishi, S. (1980) Biochim. Biophys. Acta 596, 192-200
7 Knoll, W., Ibel, K. and Sackmann, E. (1981) Biochemistry 20, 6379-6383
80vera th , P., Schairer, H.U. and Stoffel, W. (1970) Proc. Natl. Acad. Sci. USA 67, 606-612
9 Linden, C.D., Wright, K.L., McConnell, H.M. and Fox, C.F. (1973) Proc. Natl. Acad. Sci. USA 70, 2271-2275
10 Lee, A.G., Birdsall, N.J.M., Metcalfe, J.C., Toon, P.A. and Warren, G.B. (1974) Biochemistry 13, 3699-3705
11 Ruysschaert, J.M., Tenebaum, A., Berliner, C. and De- lmelle, M. (1977) FEBS Lett. 81,406-410
12 Sackmann, E. (1978) Ber. Bunsenges. Phys. Chem. 82, 891-909
13 Adam, G. (1981) Colloid Poly. Sci. 260, 124-130 14 Mayer, L.D. and Nelsestuen, G.L. (1981) Biochemistry 20,
2457-2463 15 Harmann, W. and Galla, H.-J. (1978) FEBS Lett. 78,
169-172 16 Schmidt, G., Eibl, H. and Knoll, W. (1982) J. Membrane
Biol. 70, 147-155 17 Ketterer, B., Neumcke, B. and L~tuger, P. (1971) J. Mem-
brane Biol. 5, 225-245 18 Anderson, O.S. (1978) in Membrane Transport in Biology
(Giebsch, G., Tosteson, D.C. and Ussing, H.J., eds.), Vol. I, pp. 369-446, Springer, Berlin
19 Jordan, P.C. and Stark, G. (1979) Biophys. Chem. 10, 273-287
20 Eibl, H. and Nicksch, A. (1978) Chem. Phys. Lipids 22, 1-8 21 Mueller, P., Rudin, D.O., Tien, H.T. and Wescott, W.C.
(1962) Nature (Lond.) 194, 979-980 22 Neher, E. and Eibl, H. (1977) Biochim. Biophys. Acta 464,
37-44 23 Blume, A. and Eibl, H. (1981) Biochim. Biophys. Acta 640,
609-618 24 Benz, R., Stark, G., Janko, K. and L~uger, P. (1973) J.
Membrane Biol. 14, 339-364 25 Pohl, G.W., Knoll, W., Gisin, B.F. and Stark, G. (1976)
Biophys. Struct. Mech. 2, 119-137 26 Miller, A. (1983) Diploma Thesis, Universit~tt Mtinchen 27 Bruner, L.J. (1975) J. Membrane Biol. 22, 125-141 28 Anderson, O.S. and Fuchs, M. (1975) Biophys. J. 15,
795-829 29 Benz, R., L~.uger, P. and Janko, K. (1976) Biochim. Bio-
phys. Acta 455, 701-720

30 Wulf, J., Benz, R. and Pohl, W.G. (1977) Biochim. Biophys. Acta 465, 429-442
31 McLaughlin, S. (1977) in Current Topics in Membranes and Transport (Bronner, F. and Kleinzeller, A., eds.), Vol. 9, pp. 71-144, Academic Press, New York
32 Liuger, P., Benz, R., Stark, G., Bamberg, E., Jordan, P.C., Fahr, A. and Brock, W. (1981) Quart. Rev. Biophys. 14, 513-598
229
33 L~uger, P. and Neumcke, B. (1973) in Membranes- A Series of Advances (Eisenman, G., ed.), Vol. 2, pp. 1-59, Marcel Dekker, New York
34 Albrecht, O., Gruler, H. and Sackmann, E. (1981) J. Colloid Interface Sci. 79, 319-338
35 Benz, R. and L~uger, P. (1977) Biochim. Biophys. Acta 468, 245-258