caa passenger survey report 2017
TRANSCRIPT

Business Intelligence (CAA Strategy & Policy Department)
CAA Passenger Survey Report 2017 A survey of passengers at Birmingham, East Midlands, Gatwick, Heathrow, Leeds Bradford, Liverpool, London City, Luton, Manchester, Newcastle and Stansted Airports. www.caa.co.uk

Contents Introduction History Planning for 2017 Questionnaire Tabulations Copyright Tables
Table 1 Type of passengers
Table 2 Characteristics of terminal passengers
Table 3 Characteristics of terminating passengers
Table 4 Origin/destination of terminating passengers
Table 5 Origin/destination patterns of terminating passengers by flight type
Table 6 Modes of transport used
Table 7 Main mode of transport used
Table 8 Group size of terminating air travellers
Table 9 Trip length of terminating passengers
Table 10 Income of UK and foreign passengers
Table 11 Age distribution of UK and foreign passengers
Table 12 Overall passenger experience rating
Contact Us
1

Introduction This report covers the eleven airports: Birmingham, East Midlands, Gatwick, Heathrow, Leeds Bradford, Liverpool, London City, Luton, Manchester, Newcastle and Stansted Airports.
We would like to extend our thanks to all the many people that helped ensure that the information collected during the 2017 survey met the highest possible standards. Throughout this summary report details are provided where further information can be obtained.
History
Since 1968 a series of surveys has been undertaken to obtain information about air travellers and the determinants of the travel market. These surveys have been designed to obtain information of a kind that could not be collected on a routine basis from the air transport industry.
The surveys have included questions on journey purpose, final and intermediate surface origins/destinations, means of transport to and from airports, route flown, country of residence and income. This information is used in assessing the type of market served by airports and consequently for forecasting air transport demand and for planning airport facilities.
Cycles of surveys were undertaken at major UK airports in the periods 1970-1972, 1975-1978, 1982-1987 and 1990-1996. Each cycle covered, by sample, 95% of terminal passengers in the UK and usually surveys were arranged so that airports in the same broad regions were surveyed at the same time.
Following the 1996 survey run at the five London airports, Birmingham, Manchester and four Scottish Airports demand built up for more regular survey data. After a consultation process with all interested parties, it was decided to run the survey continuously at Gatwick, Heathrow and Manchester Airports. Joining these Continuous Survey airports in 2001 were Luton and Stansted.
Over the next ten years a pattern of regional airport surveys followed, illustrated in the table and bolstered by continuous surveys at Heathrow, Gatwick, Luton, Manchester and Stansted Airports.
In 2010 both Birmingham Airport and East Midlands Airport have joined the other Continuous Airports, typically surveyed on an annual basis. In addition, in 2012, London City airport also joined this group being surveyed on a biennial basis.
Including London City Airport, the passenger surveys were now taking place continuously at eight UK airports with around 200,000 departing passengers being interviewed per annum.
Further information about survey cycles, including results from previous studies can be found on our website http://www.caa.co.uk/surveys.
2

A table showing recent passenger surveys is shown below.
Year Airports covered
2017 Birmingham, East Midlands, Gatwick, Heathrow, Luton, Manchester, Stansted, London City, Liverpool, Leeds Bradford & Newcastle
2016 Birmingham, East Midlands, Gatwick, Heathrow, Luton, Manchester, Stansted, London City & Liverpool
2015 Birmingham, East Midlands, Gatwick, Heathrow, Luton, Manchester, Stansted, London City, Liverpool, Bristol & Cardiff
2014 Birmingham, East Midlands, Gatwick, Heathrow, Luton, Manchester, Stansted, London City, Doncaster Sheffield, Leeds Bradford & Liverpool
2013 Birmingham, East Midlands, Gatwick, Heathrow, Luton, Manchester, Stansted, London City, Aberdeen, Edinburgh, Glasgow, Inverness & Newcastle
2012 Birmingham, East Midlands, Gatwick, Heathrow, Luton, Manchester, Stansted, London City, Bristol, Cardiff & Exeter
2011 Birmingham, East Midlands, Gatwick, Heathrow, Luton, Manchester & Stansted
2010 Gatwick, Heathrow, Luton, Manchester, Stansted, Birmingham, London City, Humberside, Doncaster Sheffield, East Midlands, Leeds Bradford & Liverpool
2009 Gatwick, Heathrow, Luton, Manchester, Stansted, Aberdeen, Durham Tees Valley, Edinburgh, Glasgow, Inverness, Newcastle & Prestwick
2008 Gatwick, Heathrow, Luton, Manchester, Stansted, London City, Bristol, Cardiff & Exeter
2007 Gatwick, Heathrow, Luton, Manchester, Stansted, Doncaster Sheffield, Humberside & Liverpool
2006 Gatwick, Heathrow, Luton, Manchester, Stansted, Belfast City, Belfast International, Birmingham, London City, Londonderry & East Midlands
2005 Gatwick, Heathrow, Luton, Manchester, Stansted, Aberdeen, Bournemouth, Durham Tees Valley, Edinburgh, Glasgow, Inverness, Leeds Bradford, Newcastle & Prestwick
2004 Gatwick, Heathrow, Luton, Manchester & Stansted
2003 Gatwick, Heathrow, Luton, Manchester, Stansted, Birmingham, Bristol, Cardiff, Exeter, Liverpool, London City & East Midlands
2002 Gatwick, Heathrow, Luton, Manchester & Stansted
2001 Aberdeen, Belfast City, Belfast International, Edinburgh, Glasgow, Gatwick, Heathrow, Inverness, Luton, Manchester & Stansted
3

Planning for 2017
In planning the 2017 Passenger Survey, the principal concern was to derive maximum value from the information collected, but at the same time to minimise passenger inconvenience. Therefore, it was necessary to impose a constraint on questionnaire length and content, in order to cause as little disruption as possible to passenger flow. To cause minimum delay, most passengers were interviewed whilst waiting to board their aircraft.
The Authority used its own interviewers and the survey ran throughout the whole of 2017, with shifts in each month carefully structured so that all scheduled routes and in most cases all flights within a route were regularly sampled. Further information about the sampling procedures employed can be found on our website http://www.caa.co.uk/surveys.
Questionnaire
Several interested parties were consulted over the content of the questionnaire, including government departments and airport and airline management groups. The questionnaires were similar to previous survey questionnaires in that the same basic questions appeared but a number of new questions were included specifically for the co-sponsors of the 2017 survey.
A sample questionnaire used on the survey can be found on our website http://www.caa.co.uk/surveys.
Summary Tabulations
There are twelve standard tabulations included in this summary report that examine the principal travel patterns observed at each of the nine airports surveyed throughout 2017.
Further information about the definitions used throughout this report can be found on our website http://www.caa.co.uk/surveys.
Those readers that wish to continue their analysis of traffic patterns observed at the airports covered in this report are encouraged to contact us directly at [email protected]. CAA is able to provide tailor prepared subsets of survey data, designed to answer specific questions. Our data fees start from £345.00 (GBP) + VAT. Whilst every care has been taken in producing the summary analysis found in this report, mistakes can occur. Should any reader believe that they have found any inconsistencies throughout this report we would be pleased to hear about them. Please contact us at [email protected] Totals may appear not to balance due to rounding. April 2018
4

Copyright
Where every care has been taken to ensure that all figures quoted in this publication are correct, the Authority accepts no liability for errors made and any consequential misuse or misinterpretation of the data.
Extracts from this report may be copied but appropriate accreditation should be given to the Civil Aviation Authority.
5

Table 1
About This table presents an overview of the types of passengers using each of the survey airports
Filter Notes No filters
Questions Asked What airport are you currently flying to?Where in the UK did you begin your journey to?
DERIVED Flight type based on current departure flight detailsUK/Foreign based on country of residence
6

Table 1Type of passengers using the 2017 survey airports.
Terminate * ConnectAirport International Domestic International Domestic Total
000's % 000's % 000's % 000's % 000's %
Birmingham 11,153 88.2 1,228 9.7 191 1.5 80 0.6 12,652 100.0East Midlands 4,398 90.8 399 8.3 40 0.8 5 0.1 4,842 100.0Gatwick 37,936 84.7 3,271 7.3 2,774 6.2 804 1.8 44,786 100.0Heathrow 49,199 63.5 2,074 2.7 23,538 30.4 2,726 3.5 77,537 100.0Leeds Bradford 3,506 88.5 433 10.9 23 0.6 1 0.0 3,964 100.0Liverpool 3,853 79.3 890 18.3 76 1.6 42 0.9 4,861 100.0London City 3,357 75.0 1,034 23.1 56 1.3 26 0.6 4,473 100.0Luton 14,445 90.7 1,107 6.9 322 2.0 51 0.3 15,924 100.0Manchester 23,603 88.8 1,965 7.4 609 2.3 393 1.5 26,570 100.0Newcastle 3,876 76.9 1,150 22.8 13 0.3 2 0.0 5,041 100.0Stansted 22,594 89.0 1,609 6.3 1,047 4.1 132 0.5 25,382 100.0
Total 177,920 78.7 15,161 6.7 28,688 12.7 4,263 1.9 226,033 100.0
* Includes interviews where passengers may not have answered all relevant core questions
7

CAA Passenger Survey Data - Want to know more? The information in Table 1 on International or Domestic routes can be broken down further to the immediate airport name.
To find out more contact [email protected] or 0207 453 6282.
8

Table 2About This table presents an overview of the types of passengers using each of the survey airports
Filter Notes No filters
Questions Asked In which country have you been living for most of the last 12 months?What airport are you currently flying to?Where in the UK did you begin your journey to?What is the chief purpose of your current trip?
DERIVED Flight type based on current departure flight detailsUK/Foreign based on country of residenceMain Journey Purpose based on chief purpose
9

Table 2.1Country of Residence and Journey Purpose of terminal passengers at the 2017 survey airports.
International Business International Leisure Domestic Business Domestic LeisureAirport UK Foreign UK Foreign UK Foreign UK Foreign Total
000's % 000's % 000's % 000's % 000's % 000's % 000's % 000's % 000's %
Birmingham 711 5.6 834 6.6 7,556 59.7 2,243 17.7 590 4.7 50 0.4 570 4.5 98 0.8 12,652 100.0East Midlands 81 1.7 67 1.4 3,952 81.6 338 7.0 186 3.8 2 0.1 207 4.3 9 0.2 4,842 100.0Gatwick 2,757 6.2 2,190 4.9 26,016 58.1 9,747 21.8 1,062 2.4 125 0.3 2,499 5.6 391 0.9 44,786 100.0Heathrow 6,622 8.5 11,850 15.3 21,602 27.9 32,664 42.1 1,539 2.0 366 0.5 1,946 2.5 949 1.2 77,537 100.0Leeds Bradford 83 2.1 64 1.6 2,623 66.2 759 19.2 109 2.7 18 0.5 210 5.3 98 2.5 3,964 100.0Liverpool 126 2.6 135 2.8 2,625 54.0 1,044 21.5 164 3.4 14 0.3 704 14.5 50 1.0 4,861 100.0London City 782 17.5 966 21.6 1,039 23.2 626 14.0 526 11.8 27 0.6 461 10.3 47 1.0 4,473 100.0Luton 944 5.9 616 3.9 9,302 58.4 3,904 24.5 350 2.2 16 0.1 716 4.5 75 0.5 15,924 100.0Manchester 1,922 7.2 1,397 5.3 17,330 65.2 3,563 13.4 973 3.7 95 0.4 1,032 3.9 260 1.0 26,570 100.0Newcastle 188 3.7 175 3.5 2,964 58.8 562 11.2 318 6.3 39 0.8 682 13.5 112 2.2 5,041 100.0Stansted 1,294 5.1 1,311 5.2 13,837 54.5 7,198 28.4 573 2.3 26 0.1 990 3.9 152 0.6 25,382 100.0
Total 15,508 6.9 19,604 8.7 108,846 48.2 62,650 27.7 6,389 2.8 779 0.3 10,016 4.4 2,241 1.0 226,033 100.0
Note: Excludes interviews where passengers may not have answered all relevant core questions
10

Table 2.2Country of Residence and Journey Purpose of terminal passengers at the 2017 survey airports.
Business LeisureAirport UK Foreign UK Foreign Total
000's % 000's % 000's % 000's % 000's %
Birmingham 1,301 10.3 884 7.0 8,125 64.2 2,341 18.5 12,652 100.0East Midlands 267 5.5 69 1.4 4,159 85.9 347 7.2 4,842 100.0Gatwick 3,819 8.5 2,314 5.2 28,515 63.7 10,138 22.6 44,786 100.0Heathrow 8,160 10.5 12,216 15.8 23,548 30.4 33,613 43.4 77,537 100.0Leeds Bradford 192 4.8 83 2.1 2,832 71.5 857 21.6 3,964 100.0Liverpool 289 6.0 149 3.1 3,329 68.5 1,094 22.5 4,861 100.0London City 1,308 29.2 993 22.2 1,500 33.5 673 15.0 4,473 100.0Luton 1,294 8.1 632 4.0 10,018 62.9 3,980 25.0 15,924 100.0Manchester 2,894 10.9 1,491 5.6 18,362 69.1 3,823 14.4 26,570 100.0Newcastle 507 10.1 214 4.2 3,646 72.3 674 13.4 5,041 100.0Stansted 1,867 7.4 1,338 5.3 14,827 58.4 7,351 29.0 25,382 100.0
Total 21,898 9.7 20,383 9.0 118,861 52.6 64,891 28.7 226,033 100.0
Note: Excludes interviews where passengers may not have answered all relevant core questions
11

Table 2.3Characteristics of terminal passengers at the 2017 survey airports.
International DomesticAirport UK Foreign UK Foreign Total
000's % 000's % 000's % 000's % 000's %
Birmingham 8,267 65.3 3,077 24.3 1,160 9.2 148 1.2 12,652 100.0East Midlands 4,033 83.3 405 8.4 393 8.1 11 0.2 4,842 100.0Gatwick 28,773 64.2 11,937 26.7 3,560 7.9 516 1.2 44,786 100.0Heathrow 28,223 36.4 44,514 57.4 3,485 4.5 1,315 1.7 77,537 100.0Leeds Bradford 2,706 68.3 824 20.8 318 8.0 116 2.9 3,964 100.0Liverpool 2,751 56.6 1,179 24.2 868 17.8 64 1.3 4,861 100.0London City 1,821 40.7 1,592 35.6 987 22.1 73 1.6 4,473 100.0Luton 10,246 64.3 4,521 28.4 1,067 6.7 91 0.6 15,924 100.0Manchester 19,252 72.5 4,960 18.7 2,004 7.5 354 1.3 26,570 100.0Newcastle 3,153 62.5 737 14.6 1,000 19.8 151 3.0 5,041 100.0Stansted 15,131 59.6 8,510 33.5 1,563 6.2 179 0.7 25,382 100.0
Total 124,354 55.0 82,254 36.4 16,405 7.3 3,019 1.3 226,033 100.0
Note: Excludes interviews where passengers may not have answered all relevant core questions
12

CAA Passenger Survey Data - Want to know more? The information in Table 2 on Country of Residence can be broken down further to the individual country.
To find out more contact [email protected] or 0207 453 6282.
13

Table 3.1 to 3.4About This table presents an overview of the types of passengers using each of the survey airports
Filter Notes Excludes transfer passengers with an air origin
Questions Asked In which country have you been living for most of the last 12 months?What airport are you currently flying to?Where in the UK did you begin your journey to?What is the chief purpose of your current trip?
DERIVED Flight type based on current departure flight detailsUK/Foreign based on country of residenceMain Journey Purpose based on chief purpose
14

Table 3.1
Characteristics of scheduled terminating passengers at the 2017 survey airports.
International Business International Leisure Domestic Business Domestic Leisure
Airport UK Foreign UK Foreign UK Foreign UK Foreign Total
000's % 000's % 000's % 000's % 000's % 000's % 000's % 000's % 000's %
Birmingham 696 6.2 802 7.2 6,368 56.8 2,113 18.9 586 5.2 43 0.4 530 4.7 69 0.6 11,208 100.0
East Midlands 79 1.9 67 1.6 3,416 80.1 301 7.1 184 4.3 2 0.1 205 4.8 8 0.2 4,262 100.0
Gatwick 2,661 6.9 1,883 4.9 22,531 58.7 8,059 21.0 995 2.6 103 0.3 1,931 5.0 242 0.6 38,406 100.0
Heathrow 6,076 11.9 6,763 13.2 19,859 38.8 16,398 32.0 1,125 2.2 71 0.1 724 1.4 155 0.3 51,170 100.0
Leeds Bradford 83 2.2 59 1.5 2,516 65.7 742 19.4 108 2.8 18 0.5 208 5.4 98 2.5 3,832 100.0
Liverpool 126 2.7 133 2.8 2,570 54.5 1,001 21.2 160 3.4 13 0.3 670 14.2 47 1.0 4,719 100.0
London City 751 17.1 961 21.9 1,025 23.3 619 14.1 513 11.7 24 0.6 458 10.4 39 0.9 4,391 100.0
Luton 920 6.1 579 3.8 8,862 58.5 3,678 24.3 347 2.3 15 0.1 680 4.5 64 0.4 15,147 100.0
Manchester 1,868 8.1 1,285 5.6 14,786 63.9 3,234 14.0 830 3.6 82 0.4 859 3.7 195 0.8 23,138 100.0
Newcastle 188 3.7 173 3.4 2,962 58.9 553 11.0 318 6.3 39 0.8 681 13.6 111 2.2 5,026 100.0
Stansted 1,267 5.3 1,203 5.0 13,335 55.9 6,433 27.0 564 2.4 17 0.1 923 3.9 106 0.4 23,847 100.0
Total 14,716 7.9 13,906 7.5 98,231 53.1 43,132 23.3 5,731 3.1 428 0.2 7,870 4.3 1,133 0.6 185,145 100.0
Note: Excludes interviews where passengers may not have answered all relevant core questions
15

Table 3.2
Characteristics of charter terminating passengers at the 2017 survey airports.
International Business International Leisure Domestic Business Domestic Leisure
Airport UK Foreign UK Foreign UK Foreign UK Foreign Total
000's % 000's % 000's % 000's % 000's % 000's % 000's % 000's % 000's %
Birmingham 3 0.2 3 0.3 1,141 97.2 27 2.3 0 0.0 0 0.0 0 0.0 0 0.0 1,173 100.0
East Midlands 0 0.1 0 0.0 533 99.7 1 0.3 0 0.0 0 0.0 0 0.0 0 0.0 535 100.0
Gatwick 14 0.5 0 0.0 2,769 98.8 19 0.7 0 0.0 0 0.0 0 0.0 0 0.0 2,802 100.0
Heathrow 0 0.0 0 0.0 100 96.8 3 3.2 0 0.0 0 0.0 0 0.0 0 0.0 103 100.0
Leeds Bradford 0 0.0 0 0.0 105 98.1 2 1.9 0 0.0 0 0.0 0 0.0 0 0.0 107 100.0
Liverpool 0 0.0 0 0.0 24 100.0 0 0.0 0 0.0 0 0.0 0 0.0 0 0.0 24 100.0
London City 0 - 0 - - 0 - 0 - 0 - 0 - 0 - 0 -
Luton 1 0.3 0 0.0 398 98.3 6 1.4 0 0.0 0 0.0 0 0.0 0 0.0 405 100.0
Manchester 11 0.4 1 0.0 2,395 98.5 24 1.0 0 0.0 0 0.0 0 0.0 0 0.0 2,430 100.0
Newcastle 0 - 0 - - 0 - 0 - 0 - 0 - 0 - 0 -
Stansted 8 2.2 1 0.2 342 96.1 5 1.5 0 0.0 0 0.0 0 0.0 0 0.0 356 100.0
Total 37 0.5 4 0.1 7,808 98.4 87 1.1 0 0.0 0 0.0 0 0.0 0 0.0 7,936 100.0
Note: Excludes interviews where passengers may not have answered all relevant core questions
16

Table 3.3
Characteristics of all terminating passengers at the 2017 survey airports.
International Business International Leisure Domestic Business Domestic Leisure
Airport UK Foreign UK Foreign UK Foreign UK Foreign Total
000's % 000's % 000's % 000's % 000's % 000's % 000's % 000's % 000's %
Birmingham 699 5.6 805 6.5 7,509 60.7 2,140 17.3 586 4.7 43 0.3 530 4.3 69 0.6 12,381 100.0
East Midlands 80 1.7 67 1.4 3,949 82.3 302 6.3 184 3.8 2 0.1 205 4.3 8 0.2 4,797 100.0
Gatwick 2,675 6.5 1,883 4.6 25,301 61.4 8,078 19.6 995 2.4 103 0.3 1,931 4.7 242 0.6 41,207 100.0
Heathrow 6,076 11.8 6,763 13.2 19,959 38.9 16,402 32.0 1,125 2.2 71 0.1 724 1.4 155 0.3 51,274 100.0
Leeds Bradford 83 2.1 59 1.5 2,621 66.5 744 18.9 108 2.8 18 0.5 208 5.3 98 2.5 3,939 100.0
Liverpool 126 2.7 133 2.8 2,594 54.7 1,001 21.1 160 3.4 13 0.3 670 14.1 47 1.0 4,743 100.0
London City 751 17.1 961 21.9 1,025 23.3 619 14.1 513 11.7 24 0.6 458 10.4 39 0.9 4,391 100.0
Luton 922 5.9 579 3.7 9,260 59.5 3,684 23.7 347 2.2 15 0.1 680 4.4 64 0.4 15,552 100.0
Manchester 1,879 7.3 1,285 5.0 17,181 67.2 3,258 12.7 830 3.2 82 0.3 859 3.4 195 0.8 25,568 100.0
Newcastle 188 3.7 173 3.4 2,962 58.9 553 11.0 318 6.3 39 0.8 681 13.6 111 2.2 5,026 100.0
Stansted 1,275 5.3 1,203 5.0 13,678 56.5 6,438 26.6 564 2.3 17 0.1 923 3.8 106 0.4 24,203 100.0
Total 14,753 7.6 13,911 7.2 106,038 54.9 43,219 22.4 5,731 3.0 428 0.2 7,870 4.1 1,133 0.6 193,081 100.0
Note: Excludes interviews where passengers may not have answered all relevant core questions
17

Table 3.4
Characteristics of all terminating passengers at the 2017 survey airports.
Business Leisure
Airport UK Foreign UK Foreign Total
000's % 000's % 000's % 000's % 000's %
Birmingham 1,285 10.4 848 6.8 8,039 64.9 2,209 17.8 12,381 100.0
East Midlands 264 5.5 69 1.4 4,154 86.6 310 6.5 4,797 100.0
Gatwick 3,670 8.9 1,986 4.8 27,232 66.1 8,320 20.2 41,207 100.0
Heathrow 7,201 14.0 6,833 13.3 20,683 40.3 16,557 32.3 51,274 100.0
Leeds Bradford 191 4.9 77 2.0 2,829 71.8 841 21.4 3,939 100.0
Liverpool 286 6.0 145 3.1 3,264 68.8 1,048 22.1 4,743 100.0
London City 1,265 28.8 986 22.5 1,483 33.8 657 15.0 4,391 100.0
Luton 1,269 8.2 594 3.8 9,941 63.9 3,748 24.1 15,552 100.0
Manchester 2,709 10.6 1,367 5.3 18,040 70.6 3,453 13.5 25,568 100.0
Newcastle 507 10.1 212 4.2 3,643 72.5 664 13.2 5,026 100.0
Stansted 1,838 7.6 1,220 5.0 14,601 60.3 6,544 27.0 24,203 100.0
Total 20,483 10.6 14,338 7.4 113,908 59.0 44,352 23.0 193,081 100.0
Note: Excludes interviews where passengers may not have answered all relevant core questions
18

Table 4.1 to 4.3About This table presents a regional summary of where in the UK passengers began/ended their surface journey
Filter Notes Excludes transfer passengers with an air origin
Questions Asked In which country have you been living for most of the last 12 months?Where in the UK did you begin your journey to?What is the chief purpose of your current trip?
DERIVED Flight type based on current departure flight detailsUK/Foreign based on country of residenceMain Journey Purpose based on chief purpose
19

Table 4.1a
Origin/destination of terminating scheduled passengers at the 2017 survey airports.
Region Gatwick Heathrow London City Luton Stansted
000's % 000's % 000's % 000's % 000's %
East Midlands 554 1.4 1,265 2.5 16 0.4 1,270 8.4 803 3.4
East of England 2,618 6.8 4,236 8.3 352 8.0 4,659 30.8 7,182 30.1
North East 99 0.3 86 0.2 0 0.0 24 0.2 74 0.3
North West 171 0.4 366 0.7 0 0.0 75 0.5 116 0.5
Scotland 103 0.3 101 0.2 0 0.0 7 0.0 37 0.2
South East 31,571 82.3 38,940 76.1 3,965 90.3 8,153 53.8 14,479 60.7
South West 1,958 5.1 3,502 6.8 36 0.8 322 2.1 459 1.9
Wales 409 1.1 898 1.8 5 0.1 92 0.6 103 0.4
West Midlands 586 1.5 1,266 2.5 11 0.3 433 2.9 322 1.3
Yorkshire and the Humber 309 0.8 496 1.0 5 0.1 111 0.7 273 1.1
Northern Ireland & Eire 3 0.0 13 0.0 0 0.0 0 0.0 0 0.0
Total 38,382 100.0 51,170 100.0 4,391 100.0 15,147 100.0 23,847 100.0
Note: Excludes interviews where passengers may not have answered all relevant core questions
Table 4.1b
Origin/destination of terminating scheduled passengers at the 2017 survey airports.
Region Birmingham East Midlands Leeds Bradford Liverpool Manchester Newcastle
000's % 000's % 000's % 000's % 000's % 000's %
East Midlands 1,637 14.6 2,880 67.6 41 1.1 33 0.7 945 4.1 9 0.2
East of England 72 0.6 45 1.1 1 0.0 2 0.0 31 0.1 4 0.1
North East 7 0.1 19 0.4 165 4.3 20 0.4 388 1.7 4,403 87.6
North West 74 0.7 40 0.9 83 2.2 4,025 85.4 14,735 63.7 189 3.8
Scotland 10 0.1 2 0.1 4 0.1 21 0.4 312 1.4 240 4.8
South East 405 3.6 34 0.8 1 0.0 11 0.2 100 0.4 0 0.0
South West 439 3.9 26 0.6 1 0.0 3 0.1 89 0.4 0 0.0
Wales 152 1.4 13 0.3 0 0.0 216 4.6 933 4.0 2 0.0
West Midlands 8,272 73.8 642 15.1 6 0.2 147 3.1 1,227 5.3 3 0.1
Yorkshire and the Humber 138 1.2 558 13.1 3,528 92.1 231 4.9 4,371 18.9 176 3.5
Northern Ireland & Eire 1 0.0 1 0.0 1 0.0 4 0.1 5 0.0 0 0.0
Total 11,208 100.0 4,262 100.0 3,832 100.0 4,713 100.0 23,136 100.0 5,026 100.0
Note: Excludes interviews where passengers may not have answered all relevant core questions
20

Table 4.2a
Origin/destination of terminating charter passengers at the 2017 survey airports.
Region Gatwick Heathrow London City Luton Stansted
000's % 000's % 000's % 000's % 000's %
East Midlands 54 1.9 0 0.2 0 0.0 22 5.5 13 3.5
East of England 458 16.4 17 16.6 0 0.0 231 57.1 246 69.0
North East 5 0.2 0 0.0 0 0.0 0 0.0 1 0.3
North West 14 0.5 9 8.6 0 0.0 0 0.0 2 0.5
Scotland 3 0.1 0 0.0 0 0.0 0 0.0 0 0.0
South East 1,916 68.5 54 52.6 0 0.0 125 31.0 81 22.7
South West 249 8.9 11 11.0 0 0.0 4 1.1 10 2.7
Wales 50 1.8 2 2.1 0 0.0 3 0.8 2 0.7
West Midlands 32 1.1 8 7.9 0 0.0 0 0.0 1 0.4
Yorkshire and the Humber 18 0.7 1 1.0 0 0.0 18 4.6 1 0.3
Northern Ireland & Eire 0 0.0 0 0.0 0 0.0 0 0.0 0 0.0
Total 2,799 100.0 103 100.0 0 100.0 405 100.0 356 100.0
Note: Excludes interviews where passengers may not have answered all relevant core questions
Table 4.2b
Origin/destination of terminating charter passengers at the 2017 survey airports.
Region Birmingham East Midlands Leeds Bradford Liverpool Manchester Newcastle
000's % 000's % 000's % 000's % 000's % 000's %
East Midlands 217 18.5 332 62.1 0 0.4 0 1.5 139 5.7 0 -
East of England 20 1.7 6 1.2 0 0.0 0 0.0 12 0.5 0 -
North East 1 0.1 3 0.6 2 1.5 0 0.0 63 2.6 0 -
North West 15 1.2 2 0.3 8 7.5 22 91.0 1,315 54.1 0 -
Scotland 0 0.0 0 0.1 0 0.0 1 3.8 90 3.7 0 -
South East 44 3.7 4 0.8 0 0.0 0 0.0 15 0.6 0 -
South West 56 4.7 1 0.2 0 0.0 0 0.0 27 1.1 0 -
Wales 46 4.0 2 0.4 0 0.0 0 0.0 118 4.9 0 -
West Midlands 759 64.7 88 16.5 0 0.0 1 3.7 181 7.4 0 -
Yorkshire and the Humber 15 1.3 95 17.8 97 90.6 0 0.0 468 19.3 0 -
Northern Ireland & Eire 1 0.1 0 0.0 0 0.0 0 0.0 0 0.0 0 -
Total 1,173 100.0 535 100.0 107 100.0 24 100.0 2,429 100.0 0 100.0
Note: Excludes interviews where passengers may not have answered all relevant core questions
21

Table 4.3a
Origin/destination of terminating passengers at the 2017 survey airports.
Region Gatwick Heathrow London City Luton Stansted
000's % 000's % 000's % 000's % 000's %
East Midlands 609 1.5 1,266 2.5 16 0.4 1,293 8.3 815 3.4
East of England 3,076 7.5 4,253 8.3 352 8.0 4,890 31.4 7,427 30.7
North East 104 0.3 86 0.2 0 0.0 24 0.2 75 0.3
North West 185 0.4 375 0.7 0 0.0 75 0.5 118 0.5
Scotland 105 0.3 101 0.2 0 0.0 7 0.0 37 0.2
South East 33,487 81.3 38,995 76.1 3,965 90.3 8,278 53.2 14,560 60.2
South West 2,207 5.4 3,513 6.9 36 0.8 327 2.1 469 1.9
Wales 460 1.1 901 1.8 5 0.1 95 0.6 105 0.4
West Midlands 618 1.5 1,274 2.5 11 0.3 433 2.8 323 1.3
Yorkshire and the Humber 327 0.8 497 1.0 5 0.1 129 0.8 274 1.1
Northern Ireland & Eire 3 0.0 13 0.0 0 0.0 0 0.0 0 0.0
Total 41,182 100.0 51,274 100.0 4,391 100.0 15,552 100.0 24,203 100.0
Note: Excludes interviews where passengers may not have answered all relevant core questions
Table 4.3b
Origin/destination of terminating passengers at the 2017 survey airports.
Region Birmingham East Midlands Leeds Bradford Liverpool Manchester Newcastle
000's % 000's % 000's % 000's % 000's % 000's %
East Midlands 1,854 15.0 3,213 67.0 42 1.1 33 0.7 1,084 22.9 9 0.2
East of England 92 0.7 52 1.1 1 0.0 2 0.0 43 0.9 4 0.1
North East 8 0.1 22 0.5 167 4.2 20 0.4 451 9.5 4,403 93.0
North West 89 0.7 42 0.9 91 2.3 4,046 85.4 16,050 338.9 189 4.0
Scotland 11 0.1 3 0.1 4 0.1 22 0.5 402 8.5 240 5.1
South East 449 3.6 38 0.8 1 0.0 11 0.2 115 2.4 0 0.0
South West 495 4.0 28 0.6 1 0.0 3 0.1 117 2.5 0 0.0
Wales 198 1.6 15 0.3 0 0.0 216 4.6 1,052 22.2 2 0.0
West Midlands 9,031 72.9 731 15.2 6 0.2 148 3.1 1,408 29.7 3 0.1
Yorkshire and the Humber 153 1.2 654 13.6 3,625 92.0 231 4.9 4,839 102.2 176 3.7
Northern Ireland & Eire 2 0.0 1 0.0 1 0.0 4 0.1 5 0.1 0 0.0
Total 12,381 100.0 4,797 100.0 3,939 100.0 4,736 100.0 25,565 100.0 5,026 100.0
Note: Excludes interviews where passengers may not have answered all relevant core questions
22

Table 5.1 to 5.11About This table presents a regional and county summary of the key locations where in the UK passengers began/ended
their surface journey for each survey airport
Filter Notes Excludes transfer passengers with an air origin
Questions Asked In which country have you been living for most of the last 12 months?Where in the UK did you begin your journey to?What is the chief purpose of your current trip?
DERIVED Flight type based on current departure flight detailsUK/Foreign based on country of residenceMain Journey Purpose based on chief purpose
23

Table 5.1
Origin/destination patterns of terminating passengers at Birmingham Airport in 2017 within the West Midlands Planning Region.
Region County Scheduled Charter Total
000's % 000's % 000's %
West Midlands County of Herefordshire 93 1.1 13 1.7 106 1.2
Shropshire County 308 3.7 34 4.5 342 3.8
Staffordshire County 671 8.1 88 11.6 759 8.4
Warwickshire County 1,050 12.7 106 14.0 1,156 12.8
West Midlands 5,359 64.8 432 56.9 5,791 64.1
Worcestershire County 791 9.6 86 11.4 877 9.7
Total 8,272 100.0 759 100.0 9,031 100.0
24

Table 5.2
Origin/destination patterns of terminating passengers at East Midlands Airport in 2017 within the East Midlands Planning Region.
Region County Scheduled Charter Total
000's % % 000's %
East Midlands Derbyshire County 722 25.1 95 28.7 817 25.4
Leicestershire County 791 27.5 97 29.2 888 27.6
Lincolnshire County 259 9.0 28 8.6 288 9.0
Northamptonshire County 103 3.6 25 7.7 128 4.0
Nottinghamshire County 993 34.5 86 25.8 1,079 33.6
Rutland 13 0.4 0 0.1 13 0.4
Total 2,880 100.0 332 100.0 3,213 100.0
25

Table 5.3
Origin/destination patterns of terminating passengers at Gatwick Airport in 2017 within the South East Planning Region.
Region County Scheduled Charter Total
000's % 000's % 000's %
South East Berkshire County 1,017 3.2 79 4.1 1,096 3.3
Buckinghamshire County 415 1.3 69 3.6 484 1.4
East Sussex County 2,478 7.8 131 6.8 2,609 7.8
Greater London 16,867 53.4 592 30.9 17,459 52.1
Hampshire County 2,088 6.6 270 14.1 2,358 7.0
Isle of Wight 81 0.3 29 1.5 110 0.3
Kent County 2,688 8.5 348 18.2 3,036 9.1
Oxfordshire County 715 2.3 66 3.5 781 2.3
Surrey County 2,602 8.2 172 9.0 2,774 8.3
West Sussex County 2,621 8.3 160 8.3 2,781 8.3
Total 31,571 100.0 1,916 100.0 33,487 100.0
26

Table 5.4
Origin/destination patterns of terminating passengers at Heathrow Airport in 2017 within the South East Planning Region.
Region County Scheduled Charter Total
000's % 000's % 000's %
South East Berkshire County 2,437 6.3 4 6.5 2,441 6.3
Buckinghamshire County 1,114 2.9 4 7.7 1,118 2.9
East Sussex County 577 1.5 1 1.3 578 1.5
Greater London 27,122 69.7 19 34.7 27,141 69.6
Hampshire County 1,906 4.9 6 10.9 1,912 4.9
Isle of Wight 119 0.3 0 0.0 119 0.3
Kent County 1,068 2.7 2 3.1 1,069 2.7
Oxfordshire County 1,545 4.0 2 3.0 1,546 4.0
Surrey County 2,075 5.3 9 16.8 2,085 5.3
West Sussex County 977 2.5 9 16.0 986 2.5
Total 38,940 100.0 54 100.0 38,995 100.0
27

Table 5.5
Origin/destination patterns of terminating passengers at Leeds Bradford Airport in 2017 within the Yorkshire and the Humber Planning Region.
Region County Scheduled Charter Total
000's % 000's % 000's %
Yorkshire and the Humber East Riding of Yorkshire 185 8.2 9 13.1 194 14.9
Lincolnshire County 22 1.0 0 0.0 22 1.7
North Yorkshire County 22 1.0 0 0.0 22 1.7
South Yorkshire 763 33.9 12 16.5 775 59.5
West Yorkshire 286 12.7 4 6.0 290 22.3
Total 2,250 100.0 72 100.0 1,304 100.0
28
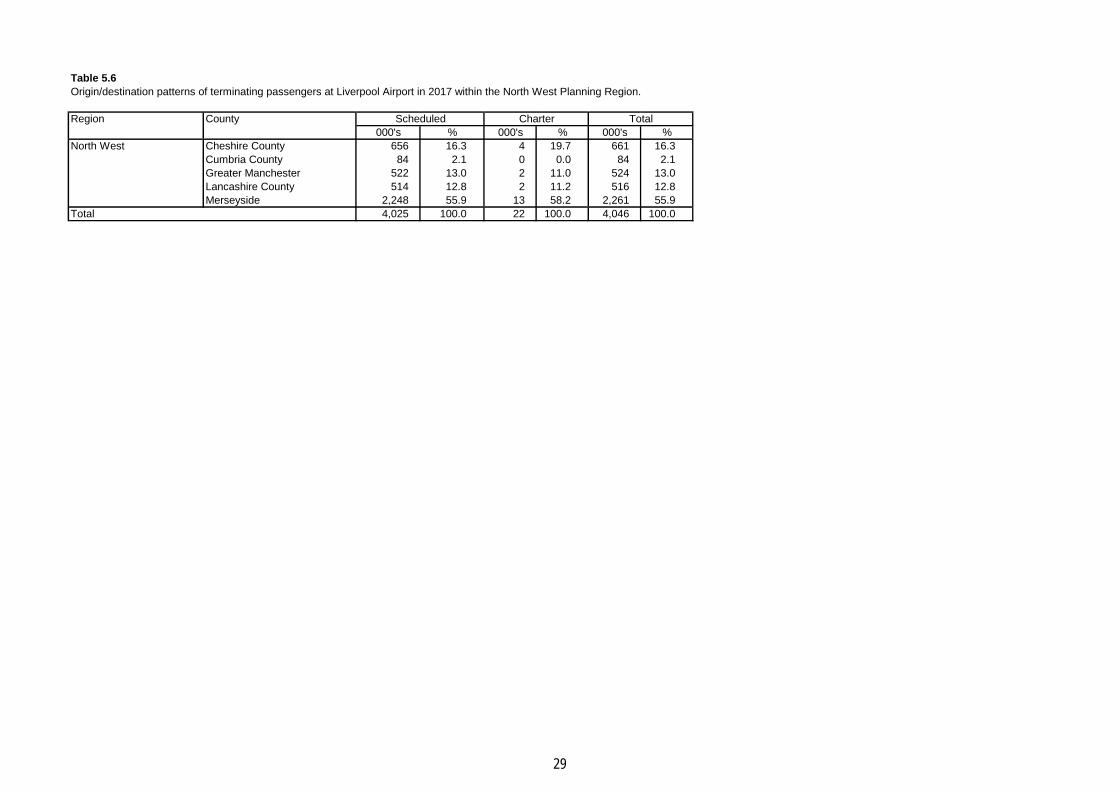
Table 5.6
Origin/destination patterns of terminating passengers at Liverpool Airport in 2017 within the North West Planning Region.
Region County Scheduled Charter Total
000's % 000's % 000's %
North West Cheshire County 656 16.3 4 19.7 661 16.3
Cumbria County 84 2.1 0 0.0 84 2.1
Greater Manchester 522 13.0 2 11.0 524 13.0
Lancashire County 514 12.8 2 11.2 516 12.8
Merseyside 2,248 55.9 13 58.2 2,261 55.9
Total 4,025 100.0 22 100.0 4,046 100.0
29
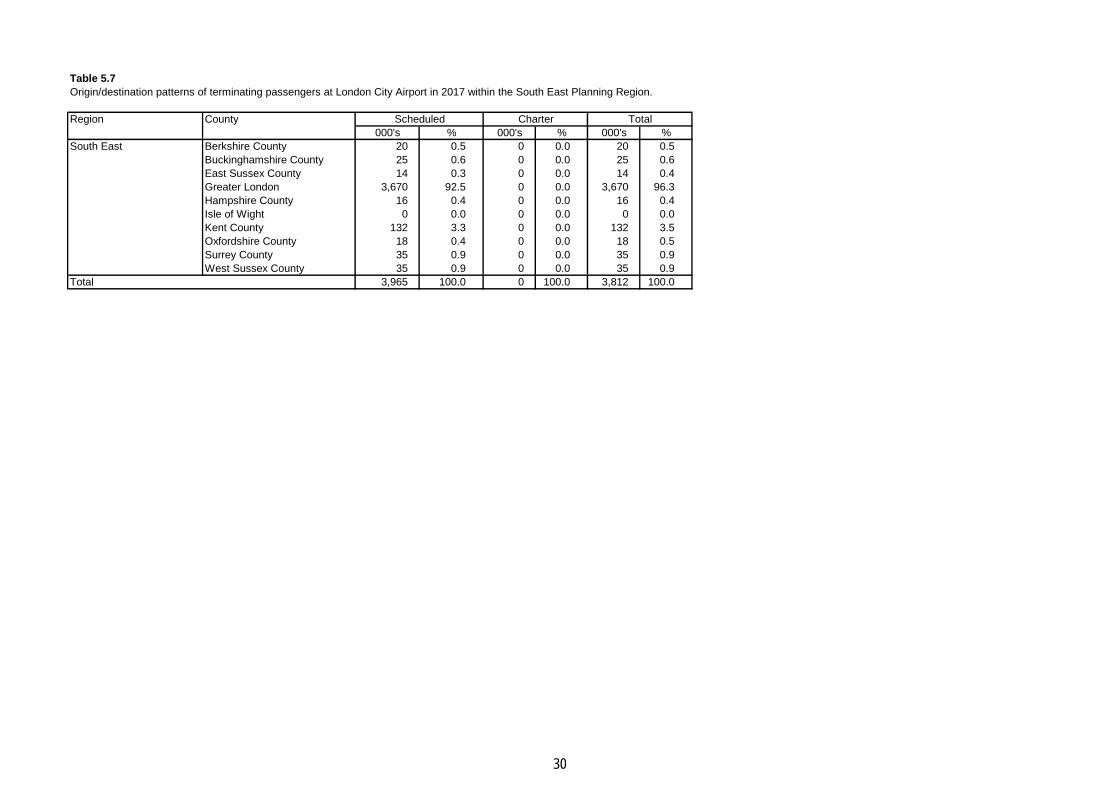
Table 5.7
Origin/destination patterns of terminating passengers at London City Airport in 2017 within the South East Planning Region.
Region County Scheduled Charter Total
000's % 000's % 000's %
South East Berkshire County 20 0.5 0 0.0 20 0.5
Buckinghamshire County 25 0.6 0 0.0 25 0.6
East Sussex County 14 0.3 0 0.0 14 0.4
Greater London 3,670 92.5 0 0.0 3,670 96.3
Hampshire County 16 0.4 0 0.0 16 0.4
Isle of Wight 0 0.0 0 0.0 0 0.0
Kent County 132 3.3 0 0.0 132 3.5
Oxfordshire County 18 0.4 0 0.0 18 0.5
Surrey County 35 0.9 0 0.0 35 0.9
West Sussex County 35 0.9 0 0.0 35 0.9
Total 3,965 100.0 0 100.0 3,812 100.0
30

Table 5.8
Origin/destination patterns of terminating passengers at Luton Airport in 2017 within the South East Planning Region.
Region County Scheduled Charter Total
000's % 000's % 000's %
South East Berkshire County 296 3.6 5 3.9 301 3.6
Buckinghamshire County 1,072 13.1 26 20.8 1,098 13.3
East Sussex County 61 0.8 0 0.0 61 0.7
Greater London 5,777 70.9 79 63.0 5,856 70.7
Hampshire County 183 2.2 10 8.0 193 2.3
Isle of Wight 13 0.2 0 0.0 13 0.2
Kent County 154 1.9 1 1.1 155 1.9
Oxfordshire County 337 4.1 3 2.3 340 4.1
Surrey County 184 2.3 1 0.9 185 2.2
West Sussex County 75 0.9 0 0.0 75 0.9
Total 8,153 100.0 125 100.0 8,278 100.0
31

Table 5.9
Origin/destination patterns of terminating passengers at Manchester Airport in 2017 within the North West Planning Region.
Region County Scheduled Charter Total
000's % 000's % 000's %
North West Cheshire County 2,339 15.9 239 18.2 2,578 16.1
Cumbria County 554 3.8 42 3.2 597 3.7
Greater Manchester 7,749 52.6 528 40.2 8,277 51.6
Lancashire County 2,142 14.5 259 19.7 2,401 15.0
Merseyside 1,951 13.2 246 18.7 2,197 13.7
Total 14,735 100.0 1,315 100.0 16,050 100.0
32

Table 5.10
Origin/destination patterns of terminating passengers at Newcastle Airport in 2017 within the North East Planning Region.
Region County Scheduled Charter Total
000's % 000's % 000's %
North East Durham County 1,140 25.9 0 0.0 1,140 25.9
North Yorkshire County 185 4.2 0 0.0 185 4.2
Northumberland County 619 14.1 0 0.0 619 14.1
Tyne and Wear 2,460 55.9 0 0.0 2,460 55.9
Total 4,403 100.0 0 0.0 4,403 100.0
33

Table 5.11
Origin/destination patterns of terminating passengers at Stansted Airport in 2017 within the South East Planning Region.
Region County Scheduled Charter Total
000's % 000's % 000's %
South East Berkshire County 178 1.2 1 1.5 179 1.2
Buckinghamshire County 256 1.8 3 4.3 259 1.8
East Sussex County 94 0.7 0 0.0 94 0.6
Greater London 12,584 86.9 60 74.5 12,645 86.8
Hampshire County 242 1.7 4 4.4 245 1.7
Isle of Wight 16 0.1 0 0.0 16 0.1
Kent County 566 3.9 3 3.5 569 3.9
Oxfordshire County 228 1.6 2 2.9 230 1.6
Surrey County 165 1.1 4 4.6 169 1.2
West Sussex County 149 1.0 3 4.1 152 1.0
Total 14,479 100.0 81 100.0 14,560 100.0
34

CAA Passenger Survey Data - Want to know more? The information in Table 5 on Surface Origin can be broken down further to the individual district. We can also provide information from all Planning Regions not just those in which the airport is located.
To find out more contact [email protected] or 0207 453 6282.
35
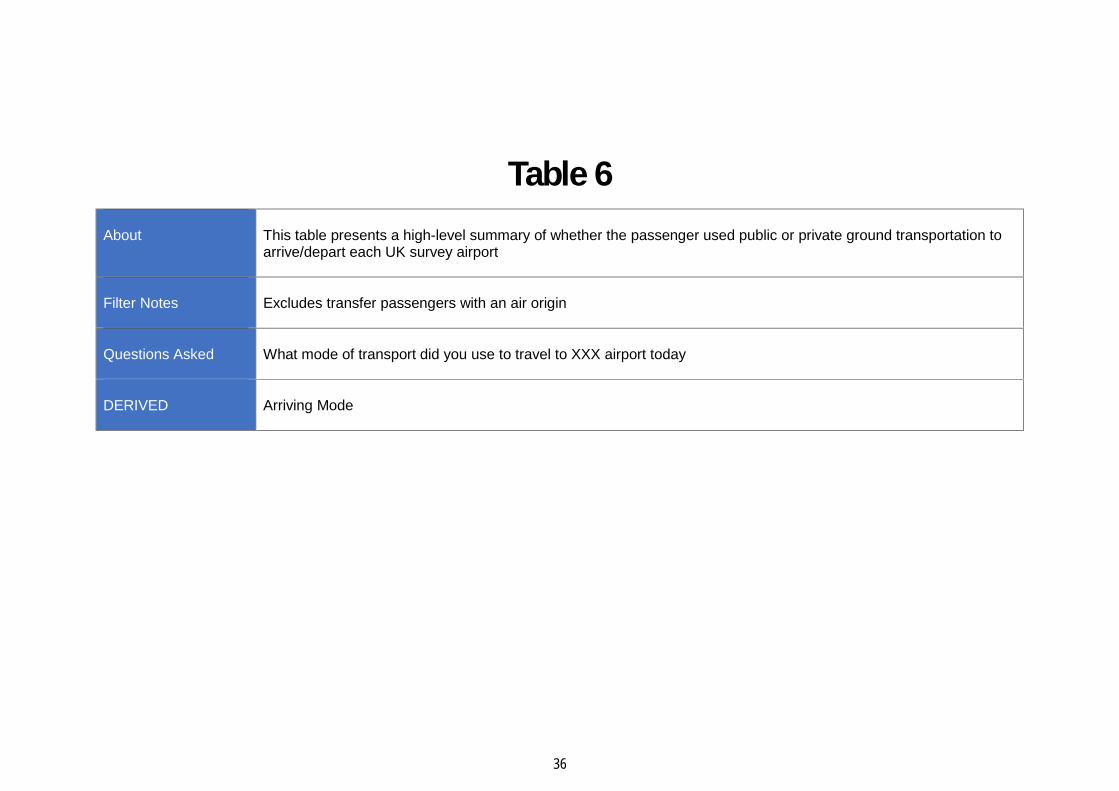
Table 6About This table presents a high-level summary of whether the passenger used public or private ground transportation to
arrive/depart each UK survey airport
Filter Notes Excludes transfer passengers with an air origin
Questions Asked What mode of transport did you use to travel to XXX airport today
DERIVED Arriving Mode
36
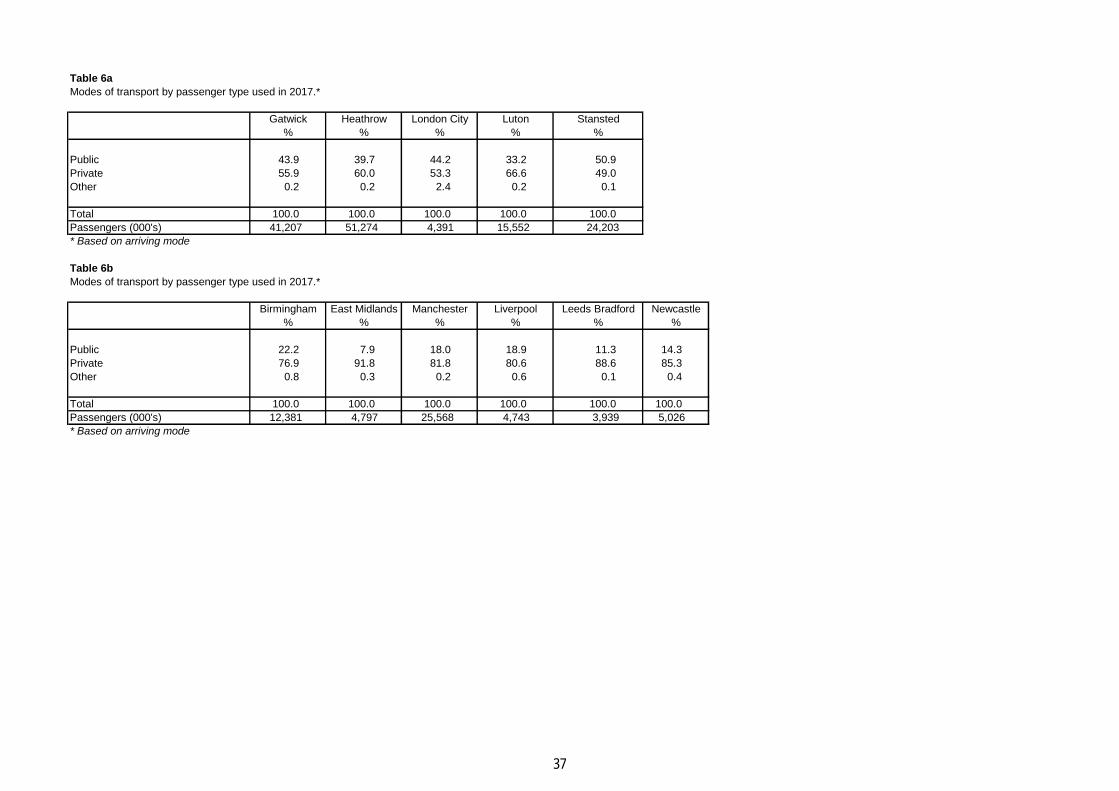
Table 6a
Modes of transport by passenger type used in 2017.*
Gatwick Heathrow London City Luton Stansted
% % % % %
Public 43.9 39.7 44.2 33.2 50.9
Private 55.9 60.0 53.3 66.6 49.0
Other 0.2 0.2 2.4 0.2 0.1
Total 100.0 100.0 100.0 100.0 100.0
Passengers (000's) 41,207 51,274 4,391 15,552 24,203
* Based on arriving mode
Table 6b
Modes of transport by passenger type used in 2017.*
Birmingham East Midlands Manchester Liverpool Leeds Bradford Newcastle
% % % % % %
Public 22.2 7.9 18.0 18.9 11.3 14.3
Private 76.9 91.8 81.8 80.6 88.6 85.3
Other 0.8 0.3 0.2 0.6 0.1 0.4
Total 100.0 100.0 100.0 100.0 100.0 100.0
Passengers (000's) 12,381 4,797 25,568 4,743 3,939 5,026
* Based on arriving mode
37

CAA Passenger Survey Data - Want to know more? The information in Table 6 on Mode of Transport can be broken down further to the individual mode.
To find out more contact [email protected] or 0207 453 6282.
38
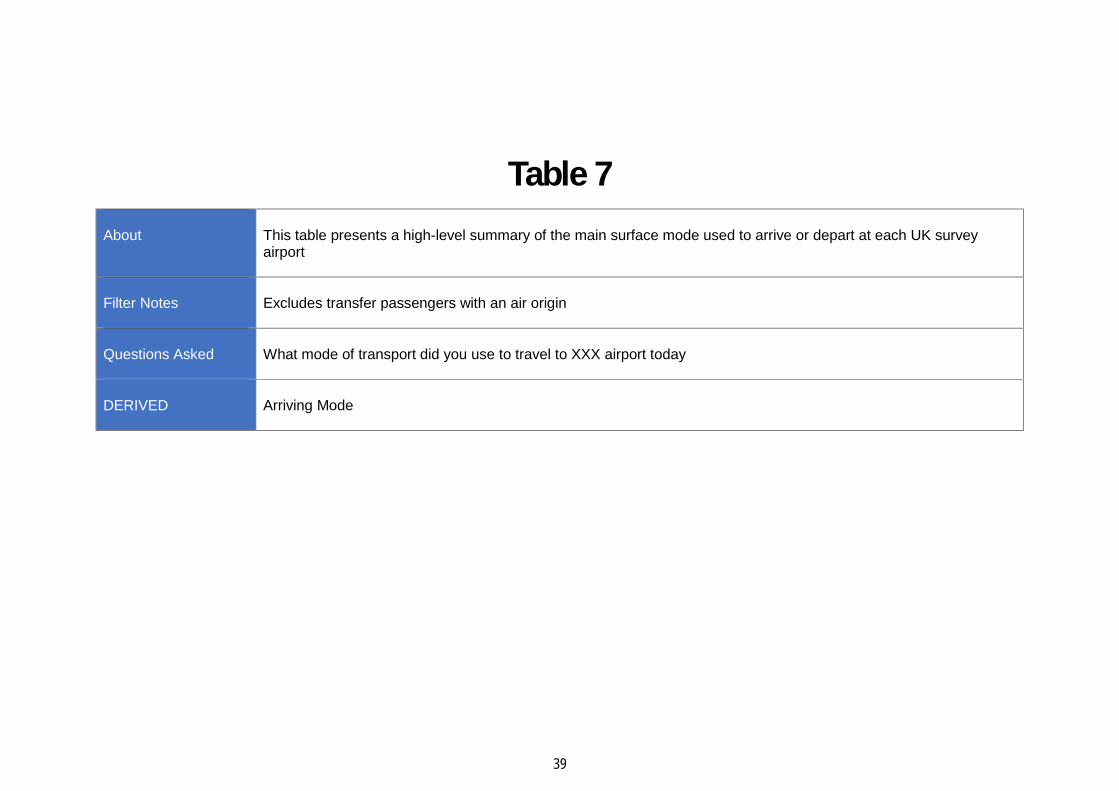
Table 7About This table presents a high-level summary of the main surface mode used to arrive or depart at each UK survey
airport
Filter Notes Excludes transfer passengers with an air origin
Questions Asked What mode of transport did you use to travel to XXX airport today
DERIVED Arriving Mode
39

Table 7.1
Passenger MAIN mode of surface transport to survey airports in 2017.*
Gatwick Heathrow London City Luton Stansted
% % % % %
Private Car 42.2 29.5 15.1 51.5 40.7
Taxi/Minicab/Uber 15.2 31.8 39.7 17.6 9.9
Bus/Coach 5.5 10.3 2.8 13.3 19.7
Rail 36.9 11.5 27.4 17.3 29.2
Tube/Metro/Subway/Tram 0.1 16.7 12.6 0.0 0.3
Other 0.2 0.3 2.5 0.3 0.2
Total 100.0 100.0 100.0 100.0 100.0
Passengers (000's) 41,207 51,274 4,391 15,552 24,203
*Based on main mode
Table 7.2
Passenger MAIN mode of surface transport to survey airports in 2017.*
Birmingham East Midlands Manchester Liverpool Leeds Bradford Newcastle
% % % % % %
Private Car 49.3 70.0 55.9 56.4 62.6 60.7
Taxi/Minicab/Uber 26.7 21.1 25.1 24.0 27.0 24.3
Bus/Coach 2.8 7.1 2.3 12.4 7.2 1.0
Rail 20.2 1.5 16.2 6.7 3.1 2.5
Tube/Metro/Subway/Tram 0.0 0.0 0.3 0.0 0.0 11.0
Other 1.0 0.3 0.2 0.5 0.1 0.5
Total 100.0 100.0 100.0 100.0 100.0 100.0
Passengers (000's) 12,381 4,797 25,568 4,743 3,939 5,026
*Based on main mode
40

Table 8.1 to 8.11About This table presents a summary of the different group sizes observed for differing passenger profiles at each UK
survey airport
Filter Notes Excludes transfer passengers with an air origin
Questions Asked In which country have you been living for most of the last 12 months?What is the chief purpose of your current trip?How many people are travelling in your immediate group?
DERIVED UK/Foreign based on country of residenceMain Journey Purpose based on chief purpose
41

Table 8.1
Group size of terminating air travellers at Birmingham Airport in 2017.
Group size UK Business UK Leisure Foreign Business Foreign Leisure All Passengers
% % % % %
Travelling alone 88.3 29.1 80.6 52.7 43.6
Travelling with one other 6.6 47.4 13.4 34.7 38.2
Travelling with two others 3.6 8.9 3.0 8.6 7.9
Travelling with three others 0.4 8.2 1.9 1.7 5.6
Travelling with four others 0.4 3.0 0.5 1.1 2.2
Travelling with five or more 0.6 3.5 0.6 1.3 2.5
Total 100.0 100.0 100.0 100.0 100.0
Total Passengers (000s) 1,285 8,039 848 2,209 12,381
42

Table 8.2
Group size of terminating air travellers at East Midlands Airport in 2017.
Group size UK Business UK Leisure Foreign Business Foreign Leisure All Passengers
% % % % %
Travelling alone 83.8 17.8 80.3 47.7 25.4
Travelling with one other 12.6 55.9 13.9 36.0 50.9
Travelling with two others 1.3 9.0 2.8 8.2 8.3
Travelling with three others 1.8 10.0 0.5 4.2 8.9
Travelling with four others 0.2 2.6 2.5 1.7 2.4
Travelling with five or more 0.4 4.7 0.0 2.2 4.1
Total 100.0 100.0 100.0 100.0 100.0
Total Passengers (000s) 264 4,154 69 310 4,797
43

Table 8.3
Group size of terminating air travellers at Gatwick Airport in 2017.
Group size UK Business UK Leisure Foreign Business Foreign Leisure All Passengers
% % % % %
Travelling alone 88.1 34.9 89.1 57.2 46.4
Travelling with one other 8.6 45.8 8.5 29.3 37.6
Travelling with two others 0.9 6.7 0.8 5.3 5.6
Travelling with three others 1.7 8.6 0.8 4.1 6.8
Travelling with four others 0.0 2.1 0.2 1.8 1.8
Travelling with five or more 0.7 1.9 0.5 2.3 1.8
Total 100.0 100.0 100.0 100.0 100.0
Total Passengers (000s) 3,670 27,232 1,986 8,320 41,207
44

Table 8.4
Group size of terminating air travellers at Heathrow Airport in 2017.
Group size UK Business UK Leisure Foreign Business Foreign Leisure All Passengers
% % % % %
Travelling alone 87.5 48.8 82.9 43.4 57.1
Travelling with one other 8.3 37.4 11.7 40.9 30.9
Travelling with two others 1.6 5.8 2.5 6.6 5.0
Travelling with three others 1.3 5.3 0.6 5.6 4.2
Travelling with four others 0.4 1.6 0.7 1.4 1.2
Travelling with five or more 0.9 1.1 1.6 2.1 1.5
Total 100.0 100.0 100.0 100.0 100.0
Total Passengers (000s) 7,201 20,683 6,833 16,557 51,274
45

Table 8.5
Group size of terminating air travellers at Leeds Bradford Airport in 2017.
Group size UK Business UK Leisure Foreign Business Foreign Leisure All Passengers
% % % % %
Travelling alone 93.3 31.7 91.3 71.7 44.0
Travelling with one other 6.4 41.9 8.7 18.9 34.9
Travelling with two others 0.0 8.6 0.0 5.4 7.4
Travelling with three others 0.0 10.9 0.0 2.5 8.5
Travelling with four others 0.0 4.0 0.0 1.0 3.1
Travelling with five or more 0.4 2.9 0.0 0.5 2.2
Total 100.0 100.0 100.0 100.0 100.0
Total Passengers (000s) 191 2,829 77 841 3,939
46

Table 8.6
Group size of terminating air travellers at Liverpool Airport in 2017.
Group size UK Business UK Leisure Foreign Business Foreign Leisure All Passengers
% % % % %
Travelling alone 86.6 32.3 77.2 47.3 39.7
Travelling with one other 11.1 40.8 11.9 34.5 37.0
Travelling with two others 0.5 9.3 7.6 7.2 8.3
Travelling with three others 0.0 11.2 2.5 5.0 9.1
Travelling with four others 0.3 2.8 0.0 2.4 2.5
Travelling with five or more 1.5 3.6 0.8 3.6 3.4
Total 100.0 100.0 100.0 100.0 100.0
Total Passengers (000s) 286 3,264 145 1,048 4,743
47

Table 8.7
Group size of terminating air travellers at London City Airport in 2017.
Group size UK Business UK Leisure Foreign Business Foreign Leisure All Passengers
% % % % %
Travelling alone 83.3 53.4 58.7 58.4 64.2
Travelling with one other 12.0 37.2 24.2 25.0 25.4
Travelling with two others 3.6 5.5 8.0 10.6 6.1
Travelling with three others 0.8 3.1 7.0 4.7 3.4
Travelling with four others 0.2 0.4 2.1 1.1 0.8
Travelling with five or more 0.2 0.4 0.0 0.1 0.2
Total 100.0 100.0 100.0 100.0 100.0
Total Passengers (000s) 1,265 1,483 986 657 4,391
48

Table 8.8
Group size of terminating air travellers at Luton Airport in 2017.
Group size UK Business UK Leisure Foreign Business Foreign Leisure All Passengers
% % % % %
Travelling alone 86.7 34.6 68.4 46.3 42.9
Travelling with one other 9.6 40.5 20.1 29.1 34.7
Travelling with two others 0.5 8.8 1.8 11.5 8.2
Travelling with three others 1.7 10.6 5.4 7.5 9.0
Travelling with four others 0.4 3.0 0.5 1.5 2.4
Travelling with five or more 1.1 2.5 3.7 4.1 2.7
Total 100.0 100.0 100.0 100.0 100.0
Total Passengers (000s) 1,269 9,941 594 3,748 15,552
49
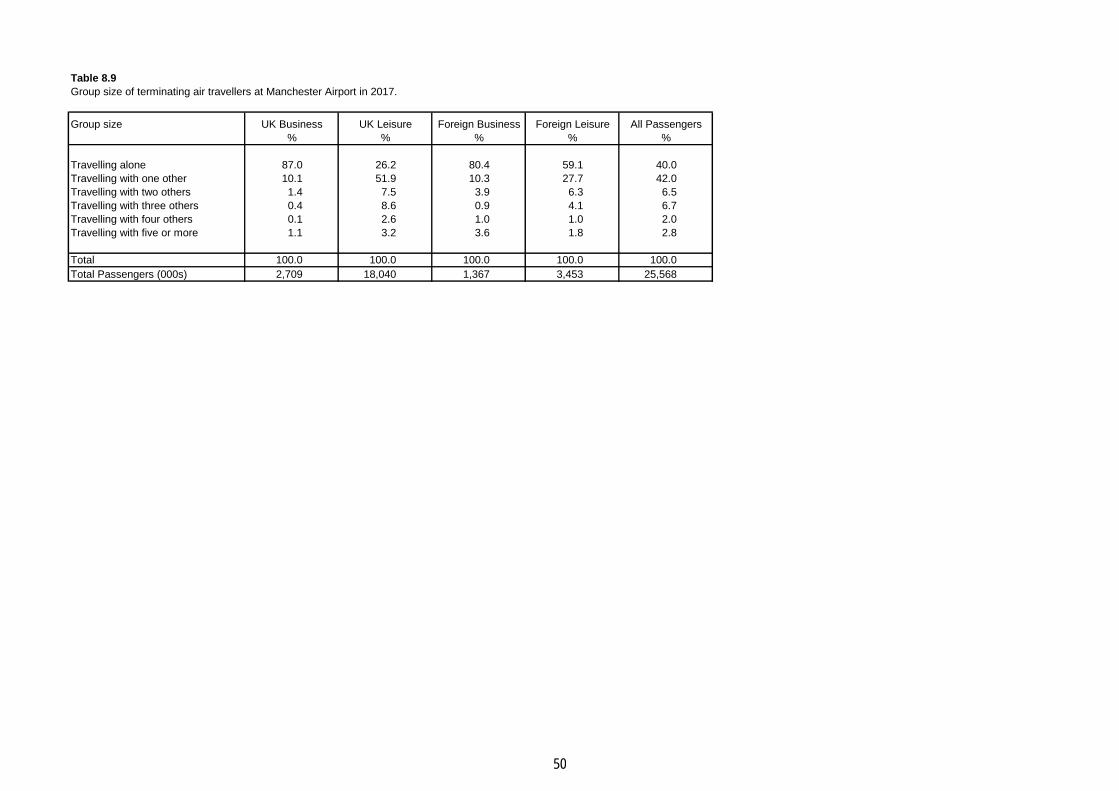
Table 8.9
Group size of terminating air travellers at Manchester Airport in 2017.
Group size UK Business UK Leisure Foreign Business Foreign Leisure All Passengers
% % % % %
Travelling alone 87.0 26.2 80.4 59.1 40.0
Travelling with one other 10.1 51.9 10.3 27.7 42.0
Travelling with two others 1.4 7.5 3.9 6.3 6.5
Travelling with three others 0.4 8.6 0.9 4.1 6.7
Travelling with four others 0.1 2.6 1.0 1.0 2.0
Travelling with five or more 1.1 3.2 3.6 1.8 2.8
Total 100.0 100.0 100.0 100.0 100.0
Total Passengers (000s) 2,709 18,040 1,367 3,453 25,568
50

Table 8.10
Group size of terminating air travellers at Newcastle Airport in 2017.
Group size UK Business UK Leisure Foreign Business Foreign Leisure All Passengers
% % % % %
Travelling alone 89.4 29.1 86.7 56.3 41.0
Travelling with one other 7.8 55.3 8.1 34.0 45.9
Travelling with two others 1.6 6.6 2.1 3.7 5.5
Travelling with three others 0.7 6.6 1.3 3.9 5.5
Travelling with four others 0.2 1.3 1.0 0.2 1.0
Travelling with five or more 0.3 1.1 0.8 1.8 1.1
Total 100.0 100.0 100.0 100.0 100.0
Total Passengers (000s) 507 3,643 212 664 5,026
51

Table 8.11
Group size of terminating air travellers at Stansted Airport in 2017.
Group size UK Business UK Leisure Foreign Business Foreign Leisure All Passengers
% % % % %
Travelling alone 85.0 51.2 84.3 55.1 56.4
Travelling with one other 11.9 34.2 11.6 30.0 30.4
Travelling with two others 1.5 5.3 1.7 7.0 5.2
Travelling with three others 0.6 6.1 0.2 5.3 5.2
Travelling with four others 0.1 1.6 1.2 1.4 1.4
Travelling with five or more 0.9 1.6 0.9 1.2 1.4
Total 100.0 100.0 100.0 100.0 100.0
Total Passengers (000s) 1,838 14,601 1,220 6,544 24,203
52
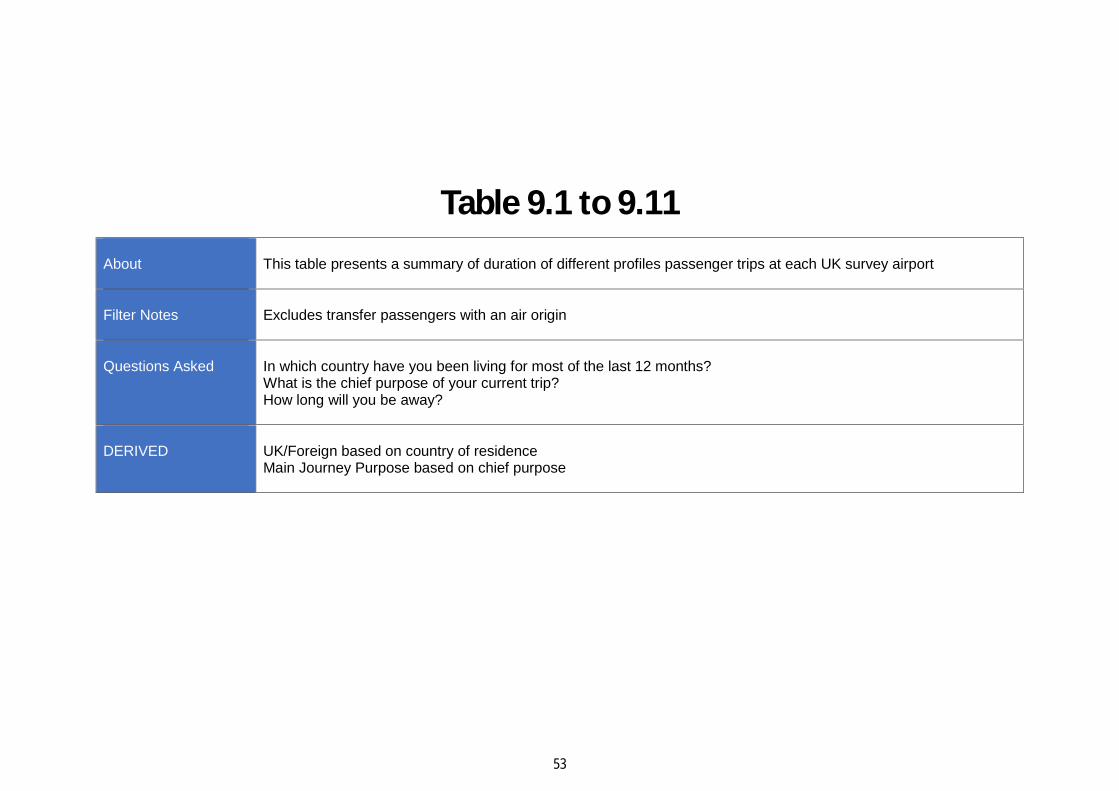
Table 9.1 to 9.11About This table presents a summary of duration of different profiles passenger trips at each UK survey airport
Filter Notes Excludes transfer passengers with an air origin
Questions Asked In which country have you been living for most of the last 12 months?What is the chief purpose of your current trip?How long will you be away?
DERIVED UK/Foreign based on country of residenceMain Journey Purpose based on chief purpose
53

Table 9.1
Trip length of terminating passengers at Birmingham Airport in 2017.
International Scheduled International Charter Domestic ALL
UK UK Foreign Foreign UK UK Foreign Foreign UK UK Foreign Foreign
Business Leisure Business Leisure Business Leisure Business Leisure Business Leisure Business Leisure
% % % % % % % % % % % % %
Up to 12 hrs 4.2 0.0 9.6 1.0 0.0 0.0 0.0 0.0 27.6 1.4 16.6 3.7 2.4
Over 12 hrs to 1 day 11.9 0.2 19.9 2.1 0.0 0.1 77.7 0.0 24.6 5.1 14.9 2.4 3.8
Over 1 day to 2 days 24.7 2.1 19.2 3.7 0.0 0.2 0.0 0.0 21.2 10.0 33.0 14.1 5.9
Over 2 days to 3 days 18.6 4.5 17.9 7.7 0.0 0.1 22.3 0.0 12.8 20.7 0.4 18.5 7.5
Over 3 days to 4 days 9.8 7.3 9.3 7.9 0.0 2.0 0.0 0.0 4.7 17.4 5.8 28.6 7.7
Over 4 days to 5 days 5.9 6.8 5.0 7.0 0.0 0.6 0.0 0.0 3.2 9.4 0.0 3.5 6.1
Over 5 days to 6 days 1.6 2.5 0.0 3.5 0.0 0.9 0.0 0.0 0.9 7.1 0.0 5.9 2.5
Over 6 days to 1 week 7.8 28.5 8.8 19.0 100.0 46.2 0.0 24.2 2.0 16.0 2.9 4.9 23.7
Over 1 week to 2 weeks 7.9 32.4 4.6 27.9 0.0 47.3 0.0 75.8 2.5 9.6 23.7 18.3 27.2
Over 2 weeks to 3 weeks 2.8 6.7 2.2 9.0 0.0 2.3 0.0 0.0 0.1 1.4 2.8 0.0 5.7
Over 3 weeks to 4 weeks 0.7 4.2 0.9 7.3 0.0 0.3 0.0 0.0 0.0 1.3 0.0 0.0 3.7
Over 4 weeks 4.2 4.9 2.6 4.0 0.0 0.0 0.0 0.0 0.3 0.5 0.0 0.0 3.6
Total 100.0 100.0 100.0 100.0 100.0 100.0 - 100.0 100.0 100.0 100.0 100.0 100.0
Total Terminating Passengers (000s) 696 6,368 802 2,113 3 1,141 3 27 586 530 43 69 12,381
Mean Trip Length (days) 4.8 9.7 3.9 9.7 6.5 8.6 1.2 9.6 1.8 4.9 4.0 4.4 8.3
Note: Excludes interviews where passengers have not answered all relevent core questions
54

Table 9.2
Trip length of terminating passengers at East Midlands Airport in 2017.
This question was not asked at East Midlands airport in 2017.
55

Table 9.3
Trip length of terminating passengers at Gatwick Airport in 2017.
International Scheduled International Charter Domestic ALL
UK UK Foreign Foreign UK UK Foreign Foreign UK UK Foreign Foreign
Business Leisure Business Leisure Business Leisure Business Leisure Business Leisure Business Leisure
% % % % % % % % % % % % %
Up to 12 hrs 4.8 0.1 6.5 0.5 0.0 0.0 - 0.0 18.5 1.2 23.4 5.2 1.2
Over 12 hrs to 1 day 7.7 0.2 4.9 0.5 0.0 0.2 - 0.0 8.7 4.2 11.9 5.4 1.3
Over 1 day to 2 days 16.3 1.9 17.2 4.3 0.0 0.2 - 0.0 33.1 8.5 27.7 7.4 4.7
Over 2 days to 3 days 21.3 8.2 18.4 11.8 0.0 0.6 - 0.0 12.5 27.2 13.7 14.7 10.4
Over 3 days to 4 days 13.6 14.1 17.3 19.9 11.6 1.9 - 13.4 12.4 23.9 6.5 23.6 14.5
Over 4 days to 5 days 11.8 9.7 5.5 12.7 17.2 2.5 - 0.0 5.0 12.8 5.6 9.1 9.6
Over 5 days to 6 days 5.2 3.9 2.6 4.2 0.0 0.4 - 0.0 2.7 3.5 0.5 1.5 3.6
Over 6 days to 1 week 7.3 26.2 7.9 15.0 57.0 56.5 - 57.8 3.1 8.1 0.0 8.9 23.6
Over 1 week to 2 weeks 6.5 26.8 9.7 17.6 0.0 36.1 - 28.8 1.7 6.9 10.7 14.1 22.6
Over 2 weeks to 3 weeks 1.2 5.6 2.8 6.1 14.2 0.8 - 0.0 0.5 2.2 0.0 7.0 4.7
Over 3 weeks to 4 weeks 1.9 1.9 4.2 2.4 0.0 0.2 - 0.0 1.5 0.4 0.0 3.1 1.9
Over 4 weeks 2.4 1.4 3.0 4.8 0.0 0.6 - 0.0 0.2 1.2 0.0 0.0 2.0
Total 100.0 100.0 100.0 100.0 100.0 100.0 - 100.0 100.0 100.0 100.0 100.0 100.0
Total Terminating Passengers (000s) 2,661 22,531 1,883 8,059 14 2,769 0 19 995 1,931 103 242 41,207
Mean Trip Length (days) 4.7 7.8 5.7 7.7 7.4 8.1 - 7.3 2.6 4.5 2.6 5.9 7.2
Note: Excludes interviews where passengers have not answered all relevent core questions
56
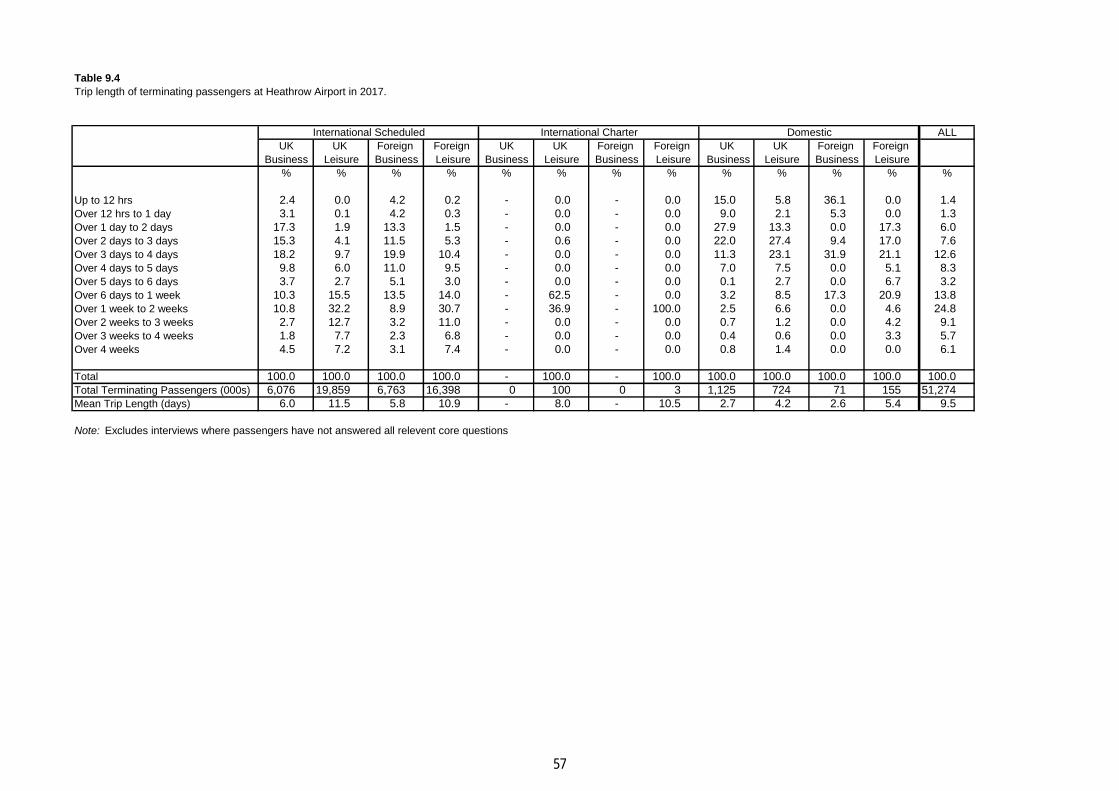
Table 9.4
Trip length of terminating passengers at Heathrow Airport in 2017.
International Scheduled International Charter Domestic ALL
UK UK Foreign Foreign UK UK Foreign Foreign UK UK Foreign Foreign
Business Leisure Business Leisure Business Leisure Business Leisure Business Leisure Business Leisure
% % % % % % % % % % % % %
Up to 12 hrs 2.4 0.0 4.2 0.2 - 0.0 - 0.0 15.0 5.8 36.1 0.0 1.4
Over 12 hrs to 1 day 3.1 0.1 4.2 0.3 - 0.0 - 0.0 9.0 2.1 5.3 0.0 1.3
Over 1 day to 2 days 17.3 1.9 13.3 1.5 - 0.0 - 0.0 27.9 13.3 0.0 17.3 6.0
Over 2 days to 3 days 15.3 4.1 11.5 5.3 - 0.6 - 0.0 22.0 27.4 9.4 17.0 7.6
Over 3 days to 4 days 18.2 9.7 19.9 10.4 - 0.0 - 0.0 11.3 23.1 31.9 21.1 12.6
Over 4 days to 5 days 9.8 6.0 11.0 9.5 - 0.0 - 0.0 7.0 7.5 0.0 5.1 8.3
Over 5 days to 6 days 3.7 2.7 5.1 3.0 - 0.0 - 0.0 0.1 2.7 0.0 6.7 3.2
Over 6 days to 1 week 10.3 15.5 13.5 14.0 - 62.5 - 0.0 3.2 8.5 17.3 20.9 13.8
Over 1 week to 2 weeks 10.8 32.2 8.9 30.7 - 36.9 - 100.0 2.5 6.6 0.0 4.6 24.8
Over 2 weeks to 3 weeks 2.7 12.7 3.2 11.0 - 0.0 - 0.0 0.7 1.2 0.0 4.2 9.1
Over 3 weeks to 4 weeks 1.8 7.7 2.3 6.8 - 0.0 - 0.0 0.4 0.6 0.0 3.3 5.7
Over 4 weeks 4.5 7.2 3.1 7.4 - 0.0 - 0.0 0.8 1.4 0.0 0.0 6.1
Total 100.0 100.0 100.0 100.0 - 100.0 - 100.0 100.0 100.0 100.0 100.0 100.0
Total Terminating Passengers (000s) 6,076 19,859 6,763 16,398 0 100 0 3 1,125 724 71 155 51,274
Mean Trip Length (days) 6.0 11.5 5.8 10.9 - 8.0 - 10.5 2.7 4.2 2.6 5.4 9.5
Note: Excludes interviews where passengers have not answered all relevent core questions
57

Table 9.5
Trip length of terminating passengers at Leeds Bradford Airport in 2017.
International Scheduled International Charter Domestic ALL
UK UK Foreign Foreign UK UK Foreign Foreign UK UK Foreign Foreign
Business Leisure Business Leisure Business Leisure Business Leisure Business Leisure Business Leisure
% % % % % % % % % % % % %
Up to 12 hrs 0.0 0.0 8.3 0.0 - 0.0 - 0.0 2.4 1.1 0.0 3.0 0.3
Over 12 hrs to 1 day 1.7 0.0 1.1 2.2 - 0.0 - 0.0 7.0 0.9 12.5 0.4 0.7
Over 1 day to 2 days 15.8 0.2 22.3 0.8 - 0.0 - 0.0 36.3 1.3 1.5 0.0 1.9
Over 2 days to 3 days 44.8 1.4 21.2 5.9 - 1.8 - 0.0 29.0 14.6 14.0 9.0 5.0
Over 3 days to 4 days 14.5 7.1 14.9 10.7 - 0.0 - 0.0 5.3 7.5 9.0 6.7 7.8
Over 4 days to 5 days 3.5 5.4 0.0 6.8 - 0.0 - 0.0 1.9 8.6 32.3 8.7 5.6
Over 5 days to 6 days 0.0 2.3 2.0 2.2 - 0.0 - 0.0 0.0 5.8 0.0 1.4 2.3
Over 6 days to 1 week 6.7 45.2 7.0 31.5 - 69.1 - 0.0 8.6 26.0 3.9 34.5 39.8
Over 1 week to 2 weeks 2.7 29.3 5.6 30.2 - 16.0 - 0.0 6.2 17.2 20.6 28.1 27.0
Over 2 weeks to 3 weeks 5.7 4.8 5.1 4.9 - 1.6 - 100.0 0.0 10.8 0.0 1.5 4.9
Over 3 weeks to 4 weeks 0.0 2.4 3.3 3.1 - 11.5 - 0.0 0.6 3.8 6.3 3.9 2.8
Over 4 weeks 4.5 1.9 9.3 1.7 - 0.0 - 0.0 2.6 2.4 0.0 2.9 2.0
Total 100.0 100.0 100.0 100.0 - 100.0 - - 100.0 100.0 100.0 100.0 100.0
Total Terminating Passengers (000s) 83 2,516 59 742 0 105 0 2 108 208 18 98 3,939
Mean Trip Length (days) 5.0 8.6 6.9 8.3 - 9.3 - 17.5 3.7 8.4 6.2 8.2 8.4
Note: Excludes interviews where passengers have not answered all relevent core questions
58

Table 9.6
Trip length of terminating passengers at Liverpool Airport in 2017.
International Scheduled International Charter Domestic ALL
UK UK Foreign Foreign UK UK Foreign Foreign UK UK Foreign Foreign
Business Leisure Business Leisure Business Leisure Business Leisure Business Leisure Business Leisure
% % % % % % % % % % % % %
Up to 12 hrs 18.5 0.0 3.0 1.8 - 0.0 - - 39.1 4.5 25.5 6.6 3.3
Over 12 hrs to 1 day 2.1 0.0 4.8 3.0 - 2.3 - - 6.4 2.7 0.0 0.0 1.3
Over 1 day to 2 days 19.8 2.7 29.9 13.6 - 0.0 - - 23.6 19.6 31.4 34.4 9.1
Over 2 days to 3 days 15.6 11.1 18.3 22.7 - 4.4 - - 7.0 23.9 4.8 6.4 14.8
Over 3 days to 4 days 8.6 12.5 14.1 13.0 - 2.6 - - 11.9 16.8 31.4 28.1 13.2
Over 4 days to 5 days 16.8 11.7 7.6 10.8 - 0.0 - - 6.0 10.4 0.0 7.6 11.1
Over 5 days to 6 days 3.4 2.3 1.6 3.0 - 0.0 - - 0.5 2.9 0.0 0.0 2.4
Over 6 days to 1 week 10.2 33.4 11.6 17.4 - 82.7 - - 1.2 9.1 0.0 5.9 24.9
Over 1 week to 2 weeks 3.9 19.1 5.7 9.7 - 8.0 - - 1.9 5.7 7.0 10.2 14.0
Over 2 weeks to 3 weeks 0.6 4.6 1.3 2.1 - 0.0 - - 2.4 2.0 0.0 0.0 3.5
Over 3 weeks to 4 weeks 0.5 0.8 1.1 1.1 - 0.0 - - 0.0 0.6 0.0 0.0 0.8
Over 4 weeks 0.0 1.8 0.9 1.9 - 0.0 - - 0.0 1.6 0.0 0.8 1.6
Total 100.0 100.0 100.0 100.0 - 100.0 - - 100.0 100.0 100.0 100.0 100.0
Total Terminating Passengers (000s) 126 2,570 133 1,001 0 24 0 0 160 670 13 47 4,743
Mean Trip Length (days) 3.3 7.1 4.0 5.2 - 6.5 - - 2.1 4.3 2.5 3.7 6.0
Note: Excludes interviews where passengers have not answered all relevent core questions
59

Table 9.7
Trip length of terminating passengers at London City Airport in 2017.
International Scheduled International Charter Domestic ALL
UK UK Foreign Foreign UK UK Foreign Foreign UK UK Foreign Foreign
Business Leisure Business Leisure Business Leisure Business Leisure Business Leisure Business Leisure
% % % % % % % % % % % % %
Up to 12 hrs 10.1 0.2 6.2 2.0 - - - - 14.3 0.6 5.5 0.0 5.3
Over 12 hrs to 1 day 20.0 0.7 18.1 2.0 - - - - 29.4 5.8 10.7 0.0 12.1
Over 1 day to 2 days 20.7 4.3 32.9 6.4 - - - - 15.1 15.1 32.3 3.2 16.4
Over 2 days to 3 days 17.4 20.0 31.8 23.5 - - - - 29.7 19.3 3.8 12.3 23.2
Over 3 days to 4 days 7.4 21.0 3.3 29.3 - - - - 6.3 17.4 0.0 11.2 13.3
Over 4 days to 5 days 6.0 12.2 2.1 16.2 - - - - 0.9 19.5 29.3 49.8 9.3
Over 5 days to 6 days 0.9 8.0 0.4 4.5 - - - - 0.4 11.2 0.0 0.0 4.1
Over 6 days to 1 week 2.8 12.2 1.6 6.6 - - - - 2.2 8.9 0.0 4.0 5.9
Over 1 week to 2 weeks 7.6 14.2 1.8 6.6 - - - - 0.5 1.4 3.9 8.7 6.3
Over 2 weeks to 3 weeks 1.1 3.1 0.1 1.2 - - - - 0.8 0.8 10.7 8.4 1.4
Over 3 weeks to 4 weeks 4.5 2.0 0.7 0.5 - - - - 0.2 0.0 0.0 0.0 1.6
Over 4 weeks 1.5 2.0 1.1 1.2 - - - - 0.2 0.0 3.7 2.3 1.2
Total 100.0 100.0 100.0 100.0 - - - - 100.0 100.0 100.0 100.0 100.0
Total Terminating Passengers (000s) 751 1,025 961 619 0 0 0 0 513 458 24 39 4,391
Mean Trip Length (days) 4.2 6.2 2.5 4.5 - - - - 2.0 3.7 5.3 6.3 4.1
Note: Excludes interviews where passengers have not answered all relevent core questions
60
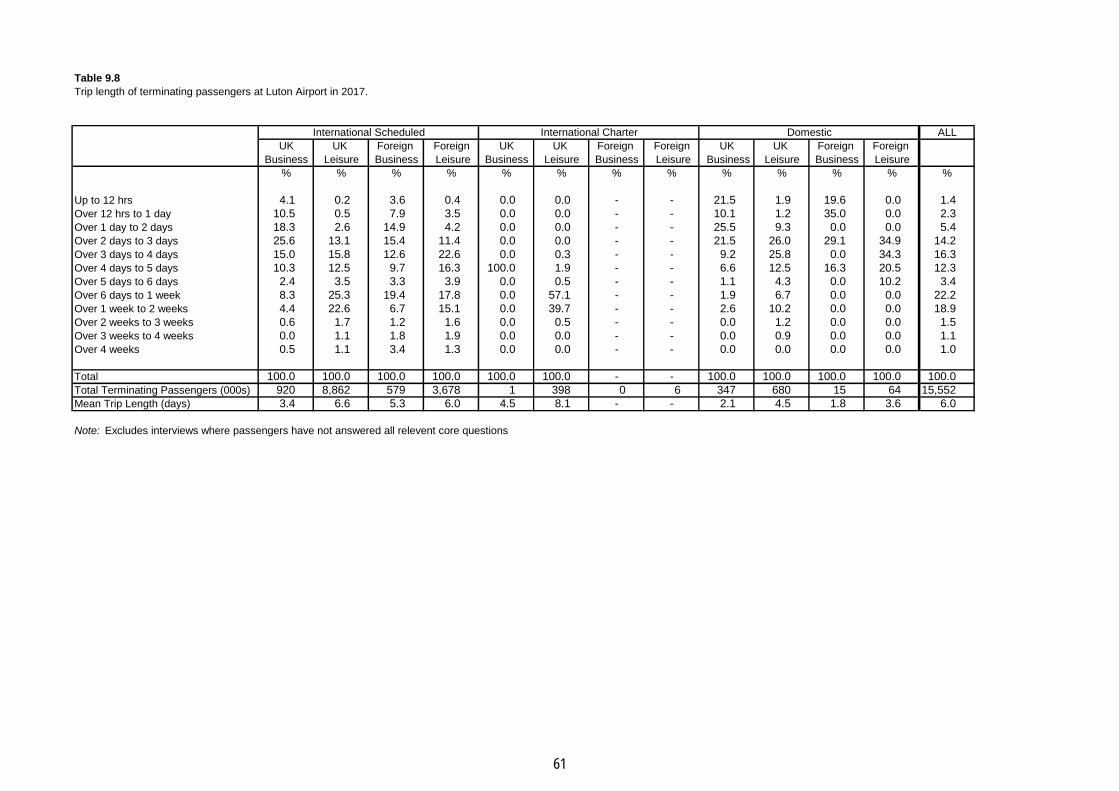
Table 9.8
Trip length of terminating passengers at Luton Airport in 2017.
International Scheduled International Charter Domestic ALL
UK UK Foreign Foreign UK UK Foreign Foreign UK UK Foreign Foreign
Business Leisure Business Leisure Business Leisure Business Leisure Business Leisure Business Leisure
% % % % % % % % % % % % %
Up to 12 hrs 4.1 0.2 3.6 0.4 0.0 0.0 - - 21.5 1.9 19.6 0.0 1.4
Over 12 hrs to 1 day 10.5 0.5 7.9 3.5 0.0 0.0 - - 10.1 1.2 35.0 0.0 2.3
Over 1 day to 2 days 18.3 2.6 14.9 4.2 0.0 0.0 - - 25.5 9.3 0.0 0.0 5.4
Over 2 days to 3 days 25.6 13.1 15.4 11.4 0.0 0.0 - - 21.5 26.0 29.1 34.9 14.2
Over 3 days to 4 days 15.0 15.8 12.6 22.6 0.0 0.3 - - 9.2 25.8 0.0 34.3 16.3
Over 4 days to 5 days 10.3 12.5 9.7 16.3 100.0 1.9 - - 6.6 12.5 16.3 20.5 12.3
Over 5 days to 6 days 2.4 3.5 3.3 3.9 0.0 0.5 - - 1.1 4.3 0.0 10.2 3.4
Over 6 days to 1 week 8.3 25.3 19.4 17.8 0.0 57.1 - - 1.9 6.7 0.0 0.0 22.2
Over 1 week to 2 weeks 4.4 22.6 6.7 15.1 0.0 39.7 - - 2.6 10.2 0.0 0.0 18.9
Over 2 weeks to 3 weeks 0.6 1.7 1.2 1.6 0.0 0.5 - - 0.0 1.2 0.0 0.0 1.5
Over 3 weeks to 4 weeks 0.0 1.1 1.8 1.9 0.0 0.0 - - 0.0 0.9 0.0 0.0 1.1
Over 4 weeks 0.5 1.1 3.4 1.3 0.0 0.0 - - 0.0 0.0 0.0 0.0 1.0
Total 100.0 100.0 100.0 100.0 100.0 100.0 - - 100.0 100.0 100.0 100.0 100.0
Total Terminating Passengers (000s) 920 8,862 579 3,678 1 398 0 6 347 680 15 64 15,552
Mean Trip Length (days) 3.4 6.6 5.3 6.0 4.5 8.1 - - 2.1 4.5 1.8 3.6 6.0
Note: Excludes interviews where passengers have not answered all relevent core questions
61

Table 9.9
Trip length of terminating passengers at Manchester Airport in 2017.
International Scheduled International Charter Domestic ALL
UK UK Foreign Foreign UK UK Foreign Foreign UK UK Foreign Foreign
Business Leisure Business Leisure Business Leisure Business Leisure Business Leisure Business Leisure
% % % % % % % % % % % % %
Up to 12 hrs 6.5 0.1 6.1 0.5 0.0 0.0 - 0.0 28.4 2.7 18.3 0.0 2.0
Over 12 hrs to 1 day 5.8 0.2 8.5 1.5 0.0 0.2 - 0.0 5.6 2.5 0.0 9.0 1.5
Over 1 day to 2 days 17.0 1.5 15.2 2.9 7.2 0.0 - 0.0 21.9 7.1 15.6 0.9 4.3
Over 2 days to 3 days 16.8 5.8 19.0 13.2 8.9 0.8 - 0.0 13.5 18.8 27.2 16.2 8.2
Over 3 days to 4 days 16.8 9.9 11.7 9.5 45.2 0.3 - 19.0 8.3 12.9 0.0 0.0 9.5
Over 4 days to 5 days 8.4 7.8 7.1 8.7 0.0 0.8 - 29.2 4.0 11.8 11.6 13.8 7.1
Over 5 days to 6 days 4.0 3.2 3.4 4.9 26.0 0.0 - 0.0 0.0 2.4 11.9 0.0 3.0
Over 6 days to 1 week 6.9 23.9 10.8 11.8 0.0 49.3 - 0.0 3.1 13.9 0.0 11.2 22.3
Over 1 week to 2 weeks 9.2 32.0 7.2 22.5 12.6 45.1 - 45.0 3.2 17.4 0.0 15.5 28.0
Over 2 weeks to 3 weeks 2.8 7.7 6.3 10.6 0.0 1.4 - 6.7 4.6 5.4 15.4 21.9 6.7
Over 3 weeks to 4 weeks 1.8 3.6 1.7 6.0 0.0 2.0 - 0.0 2.6 3.0 0.0 7.7 3.4
Over 4 weeks 4.1 4.2 2.9 7.8 0.0 0.1 - 0.0 4.7 2.1 0.0 3.8 4.0
Total 100.0 100.0 100.0 100.0 100.0 100.0 - 100.0 100.0 100.0 100.0 100.0 100.0
Total Terminating Passengers (000s) 1,868 14,786 1,285 3,234 11 2,395 1 24 830 859 82 195 25,568
Mean Trip Length (days) 5.4 9.4 5.5 10.1 4.7 8.8 - 7.9 4.6 6.8 4.8 10.3 8.6
Note: Excludes interviews where passengers have not answered all relevent core questions
62

Table 9.10
Trip length of terminating passengers at Newcastle Airport in 2017.
International Scheduled International Charter Domestic ALL
UK UK Foreign Foreign UK UK Foreign Foreign UK UK Foreign Foreign
Business Leisure Business Leisure Business Leisure Business Leisure Business Leisure Business Leisure
% % % % % % % % % % % % %
Up to 12 hrs 1.9 0.0 3.0 1.1 - - - - 11.5 1.4 0.0 0.0 1.2
Over 12 hrs to 1 day 1.2 0.0 10.9 0.7 - - - - 12.6 1.8 0.9 0.4 1.5
Over 1 day to 2 days 16.3 0.4 15.2 2.0 - - - - 27.4 8.8 8.2 2.6 4.5
Over 2 days to 3 days 22.5 4.1 24.5 13.5 - - - - 22.3 19.3 15.8 12.1 9.6
Over 3 days to 4 days 17.1 5.4 14.0 12.6 - - - - 6.0 13.7 10.3 9.7 8.0
Over 4 days to 5 days 6.2 6.5 3.5 11.4 - - - - 3.6 8.2 5.6 10.4 7.0
Over 5 days to 6 days 1.8 1.9 3.3 5.0 - - - - 1.8 2.9 0.7 4.0 2.4
Over 6 days to 1 week 6.3 39.4 5.6 19.4 - - - - 3.0 11.6 9.6 10.7 28.6
Over 1 week to 2 weeks 10.5 31.7 7.5 17.3 - - - - 4.8 17.4 15.1 26.3 25.1
Over 2 weeks to 3 weeks 4.1 4.5 2.0 5.6 - - - - 2.0 8.4 4.7 10.7 5.0
Over 3 weeks to 4 weeks 3.3 2.6 1.7 5.0 - - - - 1.1 3.2 2.4 6.4 2.9
Over 4 weeks 8.8 3.3 8.8 6.4 - - - - 3.9 3.3 26.7 6.7 4.3
Total 100.0 100.0 100.0 100.0 - - - - 100.0 100.0 100.0 100.0 100.0
Total Terminating Passengers (000s) 188 2,962 173 553 0 0 0 0 318 681 39 111 5,026
Mean Trip Length (days) 7.3 9.0 6.2 8.7 - - - - 4.0 7.4 12.3 10.2 8.4
Note: Excludes interviews where passengers have not answered all relevent core questions
63

Table 9.11
Trip length of terminating passengers at Stansted Airport in 2017.
International Scheduled International Charter Domestic ALL
UK UK Foreign Foreign UK UK Foreign Foreign UK UK Foreign Foreign
Business Leisure Business Leisure Business Leisure Business Leisure Business Leisure Business Leisure
% % % % % % % % % % % % %
Up to 12 hrs 6.8 0.3 14.0 1.2 0.0 0.0 - 0.0 15.6 1.6 0.0 0.0 1.9
Over 12 hrs to 1 day 9.1 0.7 6.6 1.1 0.0 0.4 - 0.0 15.8 2.8 0.0 10.9 2.0
Over 1 day to 2 days 13.3 2.9 15.0 5.7 0.0 0.0 - 55.2 18.7 19.5 0.0 21.9 5.8
Over 2 days to 3 days 19.5 9.8 18.8 14.3 0.0 0.0 - 0.0 14.5 20.1 0.0 23.7 12.1
Over 3 days to 4 days 21.5 21.7 23.1 26.3 67.1 0.8 - 0.0 13.7 27.1 30.9 25.8 22.4
Over 4 days to 5 days 10.0 11.4 6.8 14.8 32.9 0.0 - 0.0 8.3 10.1 16.3 0.0 11.5
Over 5 days to 6 days 2.6 4.3 3.1 4.1 0.0 0.0 - 3.7 0.3 1.3 0.0 1.7 3.8
Over 6 days to 1 week 6.9 23.0 5.3 14.0 0.0 70.8 - 7.5 2.0 8.7 27.7 10.2 19.1
Over 1 week to 2 weeks 6.4 19.4 3.9 11.8 0.0 26.5 - 33.6 10.1 7.1 25.1 3.3 15.6
Over 2 weeks to 3 weeks 2.0 3.5 1.8 3.8 0.0 1.4 - 0.0 0.6 0.9 0.0 2.7 3.1
Over 3 weeks to 4 weeks 0.6 1.5 0.1 1.3 0.0 0.1 - 0.0 0.4 0.3 0.0 0.0 1.2
Over 4 weeks 1.4 1.5 1.4 1.6 0.0 0.0 - 0.0 0.0 0.5 0.0 0.0 1.4
Total 100.0 100.0 100.0 100.0 - 100.0 - 100.0 100.0 100.0 100.0 100.0 100.0
Total Terminating Passengers (000s) 1,267 13,335 1,203 6,433 8 342 0 5 564 923 17 106 24,203
Mean Trip Length (days) 4.1 6.7 3.6 5.9 3.9 7.7 - 5.1 3.1 4.0 6.3 3.5 6.1
Note: Excludes interviews where passengers have not answered all relevent core questions
64

Table 10.1 to 10.11About This table presents a summary of disposable income for different passenger profiles at each UK survey airport
Filter Notes Excludes transfer passengers with an air origin
Questions Asked In which country have you been living for most of the last 12 months?What is the chief purpose of your current trip?
Business Passenger - Can you indicate from this screen YOUR total ANNUAL income BEFORE tax and otherdeductions?
Leisure Passenger - Can you indicate from this screen the total ANNUAL income of ALL people living in yourhousehold BEFORE tax and other deductions?
DERIVED Flight type based on current departure flight detailsUK/Foreign based on country of residenceMain Journey Purpose based on chief purpose
65

Table 10.1
Income of UK and foreign passengers at Birmingham Airport in 2017. *
UK Passengers Foreign Passengers ALL
Income Business Leisure Business Leisure Business Leisure
International Domestic International Domestic International Domestic International Domestic Total Total
% % % % % % % % % %
Under £5,750 5.2 0.2 2.5 2.7 4.8 0.0 7.8 8.1 3.4 3.9
£5,750-£8,624 0.4 0.0 1.9 1.7 1.3 0.0 1.5 7.8 0.6 1.8
£8,625-£11,499 1.2 0.0 2.5 7.5 2.4 0.0 2.9 0.8 1.2 2.8
£11,500-£14,374 1.2 0.4 4.3 5.1 1.2 0.0 3.7 5.4 0.9 4.2
£14,375-£17,249 1.0 1.5 3.8 6.2 0.6 11.9 4.6 2.1 1.3 4.1
£17,250-£22,999 6.0 8.3 9.6 8.2 3.6 3.2 10.1 16.2 5.7 9.7
£23,000-£28,749 2.9 10.7 12.4 7.9 3.3 9.3 12.9 7.6 5.5 12.2
£28,750-£34,499 8.4 13.2 8.9 11.2 5.6 18.4 8.4 6.2 9.1 8.9
£34,500-£40,249 9.7 13.1 11.5 12.0 10.1 11.5 10.6 16.4 10.9 11.4
£40,250-£45,999 6.8 11.7 9.9 8.1 14.9 36.3 12.6 5.7 11.9 10.4
£46,000-£57,499 14.9 9.4 11.1 11.2 17.8 2.9 10.2 8.4 14.0 10.8
£57,500-£80,499 16.2 20.1 12.6 8.6 13.0 3.7 6.0 9.1 15.9 10.7
£80,500-£114,999 17.7 7.8 4.6 5.2 12.3 2.9 4.1 3.8 12.5 4.5
£115,000-£172,999 7.6 3.4 3.0 3.7 6.3 0.0 2.1 2.6 5.7 2.8
£173,000-£229,999 0.8 0.0 1.1 0.6 1.5 0.0 0.3 0.0 0.8 0.8
£230,000-£349,999 0.0 0.0 0.2 0.0 0.0 0.0 1.4 0.0 0.0 0.5
Over £350,000 0.0 0.2 0.2 0.0 1.3 0.0 0.8 0.0 0.5 0.3
Total 100.0 100.0 100.0 100.0 100.0 100.0 100.0 100.0 100.0 100.0
Total terminal passengers (000s) 711 590 7,556 570 834 50 2,243 98 2,185 10,467
Mean income £60,605 £50,715 £44,935 £41,293 £61,209 £37,572 £43,132 £35,688 £57,313 £44,149
Note: Excludes interviews where passengers have not answered all relevent core questions
* Business passengers are asked for their personal income and leisure passengers are asked for their household income.
66

Table 10.2
Income of UK and foreign passengers at East Midlands Airport in 2017. *
UK Passengers Foreign Passengers ALL
Income Business Leisure Business Leisure Business Leisure
International Domestic International Domestic International Domestic International Domestic Total Total
% % % % % % % % % %
Under £5,750 0.0 0.0 0.6 1.4 0.0 0.0 4.1 0.0 0.0 0.8
£5,750-£8,624 0.0 0.3 1.4 0.0 6.9 0.0 1.2 0.0 1.0 1.3
£8,625-£11,499 1.5 0.6 2.5 2.1 3.2 0.0 0.4 0.0 1.0 2.4
£11,500-£14,374 0.0 0.8 3.1 5.5 11.1 0.0 6.9 0.0 1.9 3.4
£14,375-£17,249 0.0 2.1 6.5 1.7 0.0 0.0 10.1 0.0 1.5 6.5
£17,250-£22,999 10.0 4.9 11.2 10.6 28.0 0.0 23.4 0.0 8.5 11.9
£23,000-£28,749 8.6 11.8 13.5 21.2 5.2 0.0 12.1 0.0 10.4 13.7
£28,750-£34,499 8.9 12.8 11.2 10.0 2.5 0.0 3.5 18.4 10.8 10.7
£34,500-£40,249 3.1 8.7 13.8 9.3 1.4 0.0 13.5 0.0 6.7 13.5
£40,250-£45,999 6.2 12.2 11.1 4.0 7.0 0.0 7.3 0.0 10.4 10.5
£46,000-£57,499 13.2 11.5 8.7 12.6 9.4 0.0 3.3 0.0 11.5 8.5
£57,500-£80,499 28.5 19.4 9.2 7.4 9.9 0.0 4.2 53.5 19.8 8.9
£80,500-£114,999 11.6 5.4 4.1 10.1 7.0 84.5 6.2 28.1 7.4 4.6
£115,000-£172,999 5.1 6.7 2.3 2.9 0.0 15.5 3.3 0.0 5.7 2.4
£173,000-£229,999 3.2 2.0 0.6 0.2 7.5 0.0 0.3 0.0 2.9 0.5
£230,000-£349,999 0.0 0.0 0.1 0.2 1.1 0.0 0.0 0.0 0.1 0.1
Over £350,000 0.0 0.6 0.2 0.6 0.0 0.0 0.0 0.0 0.4 0.2
Total 100.0 100.0 100.0 100.0 100.0 - 100.0 100.0 100.0 100.0
Total terminal passengers (000s) 81 186 3,952 207 67 2 338 9 336 4,506
Mean income £62,747 £57,725 £41,451 £46,123 £50,343 £104,925 £36,119 £70,196 £58,204 £41,382
Note: Excludes interviews where passengers have not answered all relevent core questions
* Business passengers are asked for their personal income and leisure passengers are asked for their household income.
67

Table 10.3
Income of UK and foreign passengers at Gatwick Airport in 2017. *
UK Passengers Foreign Passengers ALL
Income Business Leisure Business Leisure Business Leisure
International Domestic International Domestic International Domestic International Domestic Total Total
% % % % % % % % % %
Under £5,750 2.6 0.6 3.4 2.7 6.0 0.0 7.0 2.2 3.3 4.1
£5,750-£8,624 1.6 1.0 1.1 1.4 1.0 0.0 2.4 0.0 1.3 1.4
£8,625-£11,499 0.2 0.7 1.6 2.2 1.8 0.0 2.5 3.3 0.8 1.9
£11,500-£14,374 1.2 0.0 2.2 5.3 2.5 0.0 3.7 7.8 1.4 2.8
£14,375-£17,249 1.4 0.4 2.8 2.0 2.3 0.0 3.2 1.8 1.5 2.9
£17,250-£22,999 2.7 2.8 5.9 5.0 4.8 0.0 4.6 4.4 3.4 5.5
£23,000-£28,749 5.7 6.4 8.8 8.4 7.3 5.7 7.9 1.1 6.4 8.5
£28,750-£34,499 8.3 6.1 8.6 7.8 7.2 2.3 6.3 5.4 7.4 8.1
£34,500-£40,249 7.5 7.7 8.6 9.1 10.0 3.7 7.3 6.2 8.3 8.3
£40,250-£45,999 7.3 7.5 8.6 9.0 6.0 17.6 7.2 2.2 7.1 8.3
£46,000-£57,499 9.3 10.8 10.8 11.6 7.8 24.5 9.1 19.3 9.3 10.5
£57,500-£80,499 17.8 23.0 15.3 16.4 17.6 23.7 13.5 17.5 18.7 15.0
£80,500-£114,999 18.5 14.1 11.9 13.1 11.4 9.7 11.0 10.5 15.2 11.7
£115,000-£172,999 8.8 10.1 5.9 3.1 9.2 12.8 8.4 9.5 9.3 6.3
£173,000-£229,999 4.2 2.4 2.3 2.1 1.2 0.0 1.9 5.0 2.8 2.2
£230,000-£349,999 1.4 5.4 1.3 0.6 1.2 0.0 2.2 1.8 2.0 1.5
Over £350,000 1.5 1.0 0.9 0.2 2.7 0.0 1.7 2.1 1.8 1.0
Total 100.0 100.0 100.0 100.0 100.0 100.0 100.0 100.0 100.0 100.0
Total terminal passengers (000s) 2,757 1,062 26,016 2,499 2,190 125 9,747 391 6,133 38,653
Mean income £77,009 £84,295 £62,010 £55,626 £68,647 £68,134 £65,457 £76,254 £75,301 £62,504
Note: Excludes interviews where passengers have not answered all relevent core questions
* Business passengers are asked for their personal income and leisure passengers are asked for their household income.
68

Table 10.4
Income of UK and foreign passengers at Heathrow Airport in 2017. *
UK Passengers Foreign Passengers ALL
Income Business Leisure Business Leisure Business Leisure
International Domestic International Domestic International Domestic International Domestic Total Total
% % % % % % % % % %
Under £5,750 0.6 3.5 7.2 4.3 1.1 0.0 3.2 1.4 1.1 5.2
£5,750-£8,624 0.5 0.2 1.4 2.5 0.5 0.0 2.2 1.4 0.5 1.8
£8,625-£11,499 0.8 0.0 1.4 0.2 0.8 4.0 1.6 2.4 0.8 1.5
£11,500-£14,374 0.3 0.3 2.7 1.1 0.9 0.0 2.4 3.9 0.6 2.6
£14,375-£17,249 0.4 0.3 3.3 3.7 1.2 0.0 2.0 0.0 0.8 2.7
£17,250-£22,999 2.0 3.7 7.3 4.5 2.2 0.0 3.5 4.4 2.2 5.5
£23,000-£28,749 3.4 4.2 6.8 1.9 5.5 0.0 5.0 2.0 4.5 5.8
£28,750-£34,499 8.3 4.5 8.1 11.0 4.9 28.5 5.0 0.0 6.4 6.6
£34,500-£40,249 8.4 14.0 7.2 9.8 6.6 3.2 7.2 5.9 7.9 7.2
£40,250-£45,999 7.8 7.0 7.9 7.9 7.1 3.2 9.5 24.5 7.4 8.8
£46,000-£57,499 10.4 17.5 9.9 8.0 8.3 0.0 11.2 9.0 9.8 10.5
£57,500-£80,499 16.7 15.7 14.4 20.7 17.7 20.2 15.1 19.1 17.1 14.9
£80,500-£114,999 16.5 12.9 10.9 10.9 15.5 8.6 13.7 10.0 15.7 12.2
£115,000-£172,999 12.9 8.4 6.6 4.5 12.8 22.1 8.6 1.4 12.5 7.5
£173,000-£229,999 4.4 5.4 2.3 5.2 6.5 0.0 3.9 7.5 5.5 3.1
£230,000-£349,999 3.6 1.0 1.2 3.6 4.7 0.0 3.2 2.8 3.9 2.2
Over £350,000 3.1 1.5 1.5 0.0 3.7 10.1 2.6 4.3 3.3 2.0
Total 100.0 100.0 100.0 100.0 100.0 100.0 100.0 100.0 100.0 100.0
Total terminal passengers (000s) 6,622 1,539 21,602 1,946 11,850 366 32,664 949 20,376 57,161
Mean income £92,023 £75,242 £61,702 £69,561 £99,008 £101,673 £79,821 £82,851 £94,269 £70,456
Note: Excludes interviews where passengers have not answered all relevent core questions
* Business passengers are asked for their personal income and leisure passengers are asked for their household income.
69

Table 10.5
Income of UK and foreign passengers at Leeds Bradford Airport in 2017. *
UK Passengers Foreign Passengers ALL
Income Business Leisure Business Leisure Business Leisure
International Domestic International Domestic International Domestic International Domestic Total Total
% % % % % % % % % %
Under £5,750 0.6 0.0 0.4 0.9 1.7 0.0 1.0 0.7 0.4 0.5
£5,750-£8,624 0.5 0.0 1.3 1.7 0.0 0.0 0.8 1.3 0.2 1.2
£8,625-£11,499 0.0 0.0 1.7 0.9 10.8 0.0 0.4 0.0 1.3 1.4
£11,500-£14,374 0.0 0.0 2.6 1.6 7.4 11.9 3.5 1.8 1.5 2.7
£14,375-£17,249 0.0 1.3 3.1 6.2 0.0 5.0 5.4 0.9 0.8 3.7
£17,250-£22,999 0.8 1.0 5.6 6.5 17.2 0.0 10.8 13.1 2.9 6.9
£23,000-£28,749 5.1 3.8 8.6 10.5 0.0 1.7 12.5 9.6 3.7 9.6
£28,750-£34,499 10.7 12.2 12.2 7.8 2.1 9.9 22.2 6.9 10.2 13.9
£34,500-£40,249 18.5 13.1 10.8 9.9 31.7 15.9 12.1 36.4 17.7 11.6
£40,250-£45,999 24.2 13.8 12.1 13.6 16.2 1.7 15.0 18.9 17.6 13.0
£46,000-£57,499 11.7 31.1 13.9 14.5 9.6 5.2 9.7 5.4 19.5 12.8
£57,500-£80,499 18.3 8.2 16.7 17.2 2.4 48.7 5.8 4.4 13.5 14.1
£80,500-£114,999 9.5 14.9 8.5 7.2 0.9 0.0 0.6 0.2 10.3 6.6
£115,000-£172,999 0.0 0.6 2.4 1.4 0.0 0.0 0.3 0.2 0.3 1.9
£173,000-£229,999 0.0 0.0 0.1 0.0 0.0 0.0 0.0 0.0 0.0 0.1
£230,000-£349,999 0.0 0.0 0.0 0.0 0.0 0.0 0.0 0.0 0.0 0.0
Over £350,000 0.0 0.0 0.0 0.0 0.0 0.0 0.0 0.0 0.0 0.0
Total 100.0 100.0 100.0 100.0 100.0 100.0 100.0 100.0 100.0 100.0
Total terminal passengers (000s) 83 109 2,623 210 64 18 759 98 274 3,689
Mean income £50,332 £53,289 £48,297 £45,890 £32,529 £48,874 £34,839 £36,000 £49,323 £44,991
Note: Excludes interviews where passengers have not answered all relevent core questions
* Business passengers are asked for their personal income and leisure passengers are asked for their household income.
70
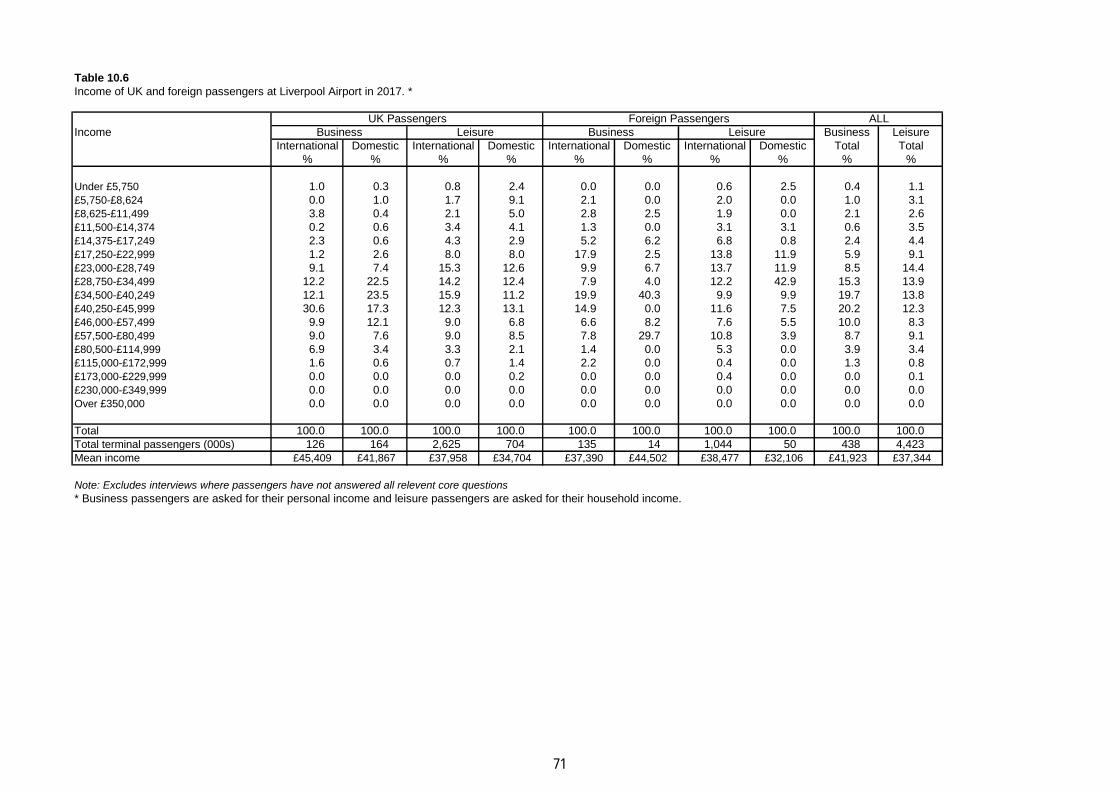
Table 10.6
Income of UK and foreign passengers at Liverpool Airport in 2017. *
UK Passengers Foreign Passengers ALL
Income Business Leisure Business Leisure Business Leisure
International Domestic International Domestic International Domestic International Domestic Total Total
% % % % % % % % % %
Under £5,750 1.0 0.3 0.8 2.4 0.0 0.0 0.6 2.5 0.4 1.1
£5,750-£8,624 0.0 1.0 1.7 9.1 2.1 0.0 2.0 0.0 1.0 3.1
£8,625-£11,499 3.8 0.4 2.1 5.0 2.8 2.5 1.9 0.0 2.1 2.6
£11,500-£14,374 0.2 0.6 3.4 4.1 1.3 0.0 3.1 3.1 0.6 3.5
£14,375-£17,249 2.3 0.6 4.3 2.9 5.2 6.2 6.8 0.8 2.4 4.4
£17,250-£22,999 1.2 2.6 8.0 8.0 17.9 2.5 13.8 11.9 5.9 9.1
£23,000-£28,749 9.1 7.4 15.3 12.6 9.9 6.7 13.7 11.9 8.5 14.4
£28,750-£34,499 12.2 22.5 14.2 12.4 7.9 4.0 12.2 42.9 15.3 13.9
£34,500-£40,249 12.1 23.5 15.9 11.2 19.9 40.3 9.9 9.9 19.7 13.8
£40,250-£45,999 30.6 17.3 12.3 13.1 14.9 0.0 11.6 7.5 20.2 12.3
£46,000-£57,499 9.9 12.1 9.0 6.8 6.6 8.2 7.6 5.5 10.0 8.3
£57,500-£80,499 9.0 7.6 9.0 8.5 7.8 29.7 10.8 3.9 8.7 9.1
£80,500-£114,999 6.9 3.4 3.3 2.1 1.4 0.0 5.3 0.0 3.9 3.4
£115,000-£172,999 1.6 0.6 0.7 1.4 2.2 0.0 0.4 0.0 1.3 0.8
£173,000-£229,999 0.0 0.0 0.0 0.2 0.0 0.0 0.4 0.0 0.0 0.1
£230,000-£349,999 0.0 0.0 0.0 0.0 0.0 0.0 0.0 0.0 0.0 0.0
Over £350,000 0.0 0.0 0.0 0.0 0.0 0.0 0.0 0.0 0.0 0.0
Total 100.0 100.0 100.0 100.0 100.0 100.0 100.0 100.0 100.0 100.0
Total terminal passengers (000s) 126 164 2,625 704 135 14 1,044 50 438 4,423
Mean income £45,409 £41,867 £37,958 £34,704 £37,390 £44,502 £38,477 £32,106 £41,923 £37,344
Note: Excludes interviews where passengers have not answered all relevent core questions
* Business passengers are asked for their personal income and leisure passengers are asked for their household income.
71

Table 10.7
Income of UK and foreign passengers at London City Airport in 2017. *
UK Passengers Foreign Passengers ALL
Income Business Leisure Business Leisure Business Leisure
International Domestic International Domestic International Domestic International Domestic Total Total
% % % % % % % % % %
Under £5,750 5.8 0.0 2.0 0.0 0.5 0.0 1.9 0.0 2.5 1.4
£5,750-£8,624 0.1 0.0 0.1 0.0 0.3 0.0 1.8 0.0 0.1 0.4
£8,625-£11,499 0.0 0.0 0.9 0.6 0.9 0.0 0.2 0.0 0.3 0.6
£11,500-£14,374 2.0 0.3 0.9 0.5 0.1 0.0 0.0 0.0 0.9 0.6
£14,375-£17,249 3.9 0.0 1.2 0.6 1.3 0.0 0.3 0.0 2.0 0.8
£17,250-£22,999 1.7 2.4 4.4 4.3 0.8 0.0 8.1 1.6 1.6 5.1
£23,000-£28,749 3.6 2.9 4.9 9.9 1.4 0.0 3.1 41.9 2.6 6.6
£28,750-£34,499 5.0 4.5 7.2 8.2 0.7 22.9 5.6 8.2 3.4 7.1
£34,500-£40,249 5.5 8.2 8.0 23.3 1.8 68.9 4.5 3.0 5.2 11.4
£40,250-£45,999 9.0 11.4 7.5 2.3 5.3 0.0 8.8 22.1 8.2 6.6
£46,000-£57,499 16.4 20.0 14.2 16.1 13.2 0.0 7.0 2.9 16.1 12.9
£57,500-£80,499 10.9 15.6 22.5 20.2 16.9 0.0 15.2 6.8 14.1 19.9
£80,500-£114,999 13.1 23.4 10.1 4.0 19.4 8.1 11.5 4.2 17.8 8.6
£115,000-£172,999 5.7 7.1 4.0 5.3 18.3 0.0 8.9 0.0 10.4 5.4
£173,000-£229,999 9.5 1.8 6.1 1.1 10.0 0.0 19.9 9.4 7.8 7.8
£230,000-£349,999 4.9 0.8 3.0 3.0 5.7 0.0 2.1 0.0 4.2 2.8
Over £350,000 2.9 1.6 2.9 0.4 3.3 0.0 1.1 0.0 2.7 1.8
Total 100.0 100.0 100.0 100.0 100.0 100.0 100.0 100.0 100.0 100.0
Total terminal passengers (000s) 782 526 1,039 461 966 27 626 47 2,300 2,173
Mean income £90,520 £76,344 £80,963 £62,358 £116,130 £40,974 £98,146 £53,609 £95,826 £79,028
Note: Excludes interviews where passengers have not answered all relevent core questions
* Business passengers are asked for their personal income and leisure passengers are asked for their household income.
72

Table 10.8
Income of UK and foreign passengers at Luton Airport in 2017. *
UK Passengers Foreign Passengers ALL
Income Business Leisure Business Leisure Business Leisure
International Domestic International Domestic International Domestic International Domestic Total Total
% % % % % % % % % %
Under £5,750 0.8 0.9 8.6 6.4 3.3 0.0 16.1 42.5 1.5 9.9
£5,750-£8,624 0.5 0.0 2.0 2.9 2.2 0.0 3.6 0.0 0.8 2.3
£8,625-£11,499 0.7 0.0 2.1 4.2 6.5 0.0 4.1 0.0 2.0 2.5
£11,500-£14,374 1.1 0.0 3.0 3.3 7.3 0.0 8.0 0.0 2.4 3.8
£14,375-£17,249 0.8 1.6 6.4 2.5 5.1 0.0 4.5 10.4 2.1 5.9
£17,250-£22,999 2.9 3.5 8.2 7.9 2.8 0.0 6.1 0.0 3.0 7.8
£23,000-£28,749 3.6 7.5 9.2 11.6 5.5 34.6 8.6 0.0 5.2 9.2
£28,750-£34,499 4.4 9.3 10.6 8.8 2.8 0.0 4.2 0.0 5.1 9.4
£34,500-£40,249 5.3 9.4 7.7 11.5 5.7 0.0 6.7 0.0 6.3 7.6
£40,250-£45,999 10.4 9.2 6.6 4.9 6.3 0.0 7.0 3.5 9.0 6.5
£46,000-£57,499 14.6 13.4 9.9 8.1 10.5 0.0 4.2 0.0 13.2 8.8
£57,500-£80,499 22.4 24.7 13.1 18.0 6.5 4.5 9.2 11.2 18.9 12.7
£80,500-£114,999 20.4 10.7 7.4 4.9 10.9 60.9 9.8 32.5 16.0 7.8
£115,000-£172,999 7.0 7.7 2.6 2.7 7.5 0.0 3.2 0.0 7.3 2.7
£173,000-£229,999 2.5 1.2 1.4 1.2 4.2 0.0 4.1 0.0 2.6 1.9
£230,000-£349,999 1.6 0.0 0.5 1.0 0.5 0.0 0.7 0.0 0.9 0.5
Over £350,000 1.0 0.7 0.7 0.0 12.3 0.0 0.1 0.0 3.7 0.5
Total 100.0 100.0 100.0 100.0 100.0 100.0 100.0 100.0 100.0 100.0
Total terminal passengers (000s) 944 350 9,302 716 616 16 3,904 75 1,926 13,998
Mean income £76,084 £63,833 £46,803 £46,090 £94,508 £71,596 £46,468 £43,833 £77,736 £46,698
Note: Excludes interviews where passengers have not answered all relevent core questions
* Business passengers are asked for their personal income and leisure passengers are asked for their household income.
73

Table 10.9
Income of UK and foreign passengers at Manchester Airport in 2017. *
UK Passengers Foreign Passengers ALL
Income Business Leisure Business Leisure Business Leisure
International Domestic International Domestic International Domestic International Domestic Total Total
% % % % % % % % % %
Under £5,750 2.1 0.8 4.1 12.1 1.5 0.0 7.4 4.2 1.6 4.9
£5,750-£8,624 0.6 0.0 1.8 2.8 0.1 0.0 0.8 0.0 0.3 1.7
£8,625-£11,499 0.6 2.7 2.4 3.2 1.0 0.0 1.9 2.5 1.1 2.3
£11,500-£14,374 1.4 0.1 2.9 3.9 1.4 5.5 3.9 7.3 1.2 3.1
£14,375-£17,249 1.4 0.0 3.8 2.6 1.5 2.5 2.2 2.0 1.1 3.5
£17,250-£22,999 1.5 1.7 7.1 13.1 2.3 0.0 4.1 1.0 1.8 6.8
£23,000-£28,749 3.7 4.8 10.7 10.5 1.8 5.5 8.6 2.8 3.5 10.3
£28,750-£34,499 7.2 7.2 12.1 7.0 5.5 2.9 7.4 7.0 6.7 11.2
£34,500-£40,249 10.6 16.0 12.5 9.9 11.8 0.0 8.6 14.8 11.9 11.8
£40,250-£45,999 15.0 9.1 10.2 7.8 14.4 1.5 9.9 10.6 13.4 10.1
£46,000-£57,499 12.8 15.1 10.2 7.9 11.7 5.4 7.0 7.9 12.9 9.6
£57,500-£80,499 18.3 20.0 11.9 5.6 17.8 11.6 16.4 11.0 18.4 12.3
£80,500-£114,999 18.0 11.8 6.3 9.2 9.7 31.6 10.3 9.6 14.7 7.0
£115,000-£172,999 4.7 6.0 2.8 4.4 16.4 28.1 7.9 9.9 8.4 3.7
£173,000-£229,999 1.0 2.5 0.5 0.0 1.6 0.0 2.0 1.2 1.4 0.7
£230,000-£349,999 1.1 0.3 0.2 0.0 0.6 0.0 1.2 8.1 0.8 0.4
Over £350,000 0.2 1.9 0.3 0.0 0.9 5.2 0.4 0.0 0.8 0.3
Total 100.0 100.0 100.0 100.0 100.0 100.0 100.0 100.0 100.0 100.0
Total terminal passengers (000s) 1,922 973 17,330 1,032 1,397 95 3,563 260 4,386 22,185
Mean income £63,812 £68,318 £45,030 £39,653 £73,244 £104,572 £59,264 £76,224 £67,852 £47,303
Note: Excludes interviews where passengers have not answered all relevent core questions
* Business passengers are asked for their personal income and leisure passengers are asked for their household income.
74

Table 10.10
Income of UK and foreign passengers at Newcastle Airport in 2017. *
UK Passengers Foreign Passengers ALL
Income Business Leisure Business Leisure Business Leisure
International Domestic International Domestic International Domestic International Domestic Total Total
% % % % % % % % % %
Under £5,750 2.1 0.9 1.6 5.6 2.3 5.4 2.5 1.5 1.8 2.2
£5,750-£8,624 1.3 1.1 2.0 3.2 0.4 8.1 3.2 5.3 1.4 2.4
£8,625-£11,499 1.0 0.3 2.6 3.2 3.5 0.0 3.3 2.1 1.1 2.8
£11,500-£14,374 2.2 1.9 4.0 4.3 5.2 4.5 4.2 2.5 2.8 4.0
£14,375-£17,249 1.5 1.0 7.4 5.8 1.9 5.6 5.0 4.3 1.6 6.8
£17,250-£22,999 4.2 3.2 8.9 7.0 1.6 2.3 10.1 4.4 3.1 8.7
£23,000-£28,749 6.0 8.3 11.3 12.7 4.0 2.9 8.1 3.1 6.5 10.9
£28,750-£34,499 19.0 11.6 11.8 10.1 5.0 5.8 8.1 6.4 12.2 11.0
£34,500-£40,249 11.6 17.2 12.9 9.6 7.2 2.4 9.6 5.9 12.7 11.9
£40,250-£45,999 11.3 8.3 11.2 9.0 14.5 9.9 9.2 10.8 10.5 10.6
£46,000-£57,499 14.2 14.6 9.6 8.9 22.5 9.0 12.0 9.5 15.7 9.8
£57,500-£80,499 14.4 17.5 9.6 11.0 15.1 12.7 9.4 12.4 15.8 9.9
£80,500-£114,999 8.1 8.0 4.9 6.9 8.9 22.2 6.9 12.2 9.1 5.6
£115,000-£172,999 2.5 3.0 1.7 1.7 4.7 2.3 4.4 13.0 3.2 2.3
£173,000-£229,999 0.3 1.0 0.3 0.6 1.4 2.7 2.1 4.2 1.0 0.7
£230,000-£349,999 0.2 0.9 0.1 0.2 0.3 0.8 0.9 1.3 0.6 0.3
Over £350,000 0.1 1.0 0.1 0.2 1.5 3.3 1.0 1.0 1.0 0.2
Total 100.0 100.0 100.0 100.0 100.0 100.0 100.0 100.0 100.0 100.0
Total terminal passengers (000s) 188 318 2,964 682 175 39 562 112 721 4,320
Mean income £48,910 £57,071 £40,300 £41,236 £59,890 £68,397 £52,239 £72,284 £55,837 £42,581
Note: Excludes interviews where passengers have not answered all relevent core questions
* Business passengers are asked for their personal income and leisure passengers are asked for their household income.
75

Table 10.11
Income of UK and foreign passengers at Stansted Airport in 2017. *
UK Passengers Foreign Passengers ALL
Income Business Leisure Business Leisure Business Leisure
International Domestic International Domestic International Domestic International Domestic Total Total
% % % % % % % % % %
Under £5,750 1.1 0.6 4.7 6.4 2.8 0.0 13.8 20.0 1.6 7.2
£5,750-£8,624 0.9 0.7 1.2 3.0 2.4 2.9 3.6 0.0 1.4 1.8
£8,625-£11,499 1.1 0.0 2.7 3.1 3.2 0.0 2.9 7.1 1.6 2.8
£11,500-£14,374 2.6 0.4 3.4 2.4 4.4 0.0 4.6 14.5 2.8 3.7
£14,375-£17,249 1.3 0.9 4.3 2.4 4.8 0.0 5.6 4.4 2.5 4.6
£17,250-£22,999 2.4 2.3 7.2 3.6 5.5 2.9 6.5 5.6 3.5 6.8
£23,000-£28,749 9.1 6.2 10.6 8.5 9.6 0.0 7.7 4.4 8.7 9.7
£28,750-£34,499 8.3 5.9 10.0 10.9 11.8 0.0 7.6 4.3 9.1 9.4
£34,500-£40,249 15.9 9.4 8.4 9.7 6.9 9.6 7.2 3.0 11.3 8.1
£40,250-£45,999 8.0 9.9 8.4 8.2 5.9 32.9 7.3 22.7 7.7 8.2
£46,000-£57,499 13.0 11.9 8.9 10.9 11.8 19.9 7.7 1.0 12.4 8.6
£57,500-£80,499 16.1 26.1 12.0 8.1 13.5 5.2 10.6 2.9 17.0 11.4
£80,500-£114,999 7.9 8.8 10.3 10.7 10.1 0.0 7.3 1.7 8.8 9.5
£115,000-£172,999 7.0 7.2 5.3 9.0 4.2 9.2 4.2 3.4 6.0 5.2
£173,000-£229,999 3.4 8.4 1.5 1.2 1.3 11.3 2.2 5.1 3.6 1.7
£230,000-£349,999 0.1 0.9 0.7 1.6 0.2 6.0 0.7 0.0 0.3 0.7
Over £350,000 1.7 0.3 0.7 0.3 1.5 0.0 0.6 0.0 1.4 0.7
Total 100.0 100.0 100.0 100.0 100.0 100.0 100.0 100.0 100.0 100.0
Total terminal passengers (000s) 1,294 573 13,837 990 1,311 26 7,198 152 3,204 22,177
Mean income £64,613 £75,783 £53,598 £57,899 £54,146 £86,091 £46,976 £37,712 £63,022 £52,019
Note: Excludes interviews where passengers have not answered all relevent core questions
* Business passengers are asked for their personal income and leisure passengers are asked for their household income.
76
Table 11.1 to 11.11About This table presents a summary of the age distribution of different passenger profiles at each UK survey airport
Filter Notes Excludes transfer passengers with an air origin
Questions Asked In which country have you been living for most of the last 12 months?What is the chief purpose of your current trip?Which of these age groups do you come into?
DERIVED UK/Foreign based on country of residence
77

Table 11.1
Age distribution of UK and foreign passengers at Birmingham Airport in 2017.
UK Foreign Grand
Age Business Leisure Business Leisure Total
% % % % %
02-10 0.0 3.2 0.1 1.6 2.3
11-15 0.0 2.8 0.1 1.9 2.2
16-19 1.4 4.7 1.7 5.0 4.2
20-24 4.7 14.7 8.7 13.1 12.9
25-34 25.7 18.8 24.7 25.4 21.2
35-44 26.5 11.8 24.7 17.3 15.2
45-54 24.9 12.1 29.3 13.4 14.9
55-59 9.9 10.0 5.0 8.5 9.4
60-64 3.8 7.6 3.7 7.4 6.9
65-74 2.8 11.2 1.4 4.6 8.5
75-84 0.3 2.8 0.6 1.8 2.2
Over 85 0.0 0.2 0.0 0.1 0.1
Total 100.0 100.0 100.0 100.0 100.0
Terminal Passengers (000s) 1,301 8,125 884 2,341 12,652
Mean age (yrs) 41.8 41.5 40.4 39.2 41.0
Note: Excludes interviews where passengers have not answered all relevent core questions
78

Table 11.2
Age distribution of UK and foreign passengers at East Midlands Airport in 2017.
UK Foreign Grand
Age Business Leisure Business Leisure Total
% % % % %
02-10 0.2 2.8 0.0 2.4 2.6
11-15 0.0 3.0 0.0 1.4 2.7
16-19 4.0 3.6 2.0 3.1 3.6
20-24 5.3 8.3 9.7 9.6 8.2
25-34 18.2 13.2 18.5 17.6 13.9
35-44 24.9 12.3 19.1 13.8 13.2
45-54 27.8 16.9 16.7 16.1 17.4
55-59 11.8 10.1 17.4 10.2 10.3
60-64 5.0 9.0 8.3 10.0 8.8
65-74 2.4 15.4 6.8 11.4 14.3
75-84 0.4 5.0 1.5 4.3 4.7
Over 85 0.0 0.4 0.0 0.0 0.3
Total 100.0 100.0 100.0 100.0 100.0
Terminal Passengers (000s) 267 4,159 69 347 4,842
Mean age (yrs) 42.7 46.5 44.7 45.0 46.2
Note: Excludes interviews where passengers have not answered all relevent core questions
79

Table 11.3
Age distribution of UK and foreign passengers at Gatwick Airport in 2017.
UK Foreign Grand
Age Business Leisure Business Leisure Total
% % % % %
02-10 0.0 2.4 0.0 1.3 1.8
11-15 0.0 1.7 0.1 1.9 1.5
16-19 1.4 3.3 0.6 5.0 3.4
20-24 6.3 10.3 8.4 15.3 11.0
25-34 25.7 20.4 24.4 22.8 21.6
35-44 24.7 12.9 27.7 12.4 14.6
45-54 23.7 16.9 24.6 15.2 17.5
55-59 9.9 9.4 8.4 7.9 9.1
60-64 4.2 8.4 2.8 7.5 7.6
65-74 3.5 11.8 2.8 8.9 10.0
75-84 0.6 2.4 0.3 1.8 2.0
Over 85 0.0 0.1 0.0 0.0 0.1
Total 100.0 100.0 100.0 100.0 100.0
Terminal Passengers (000s) 3,819 28,515 2,314 10,138 44,786
Mean age (yrs) 41.8 43.4 40.9 40.5 42.5
Note: Excludes interviews where passengers have not answered all relevent core questions
80

Table 11.4
Age distribution of UK and foreign passengers at Heathrow Airport in 2017.
UK Foreign Grand
Age Business Leisure Business Leisure Total
% % % % %
02-10 0.0 1.3 0.0 1.0 0.9
11-15 0.0 1.7 0.0 2.6 1.5
16-19 0.6 3.6 0.3 4.6 3.1
20-24 4.7 9.8 2.6 9.6 8.1
25-34 24.5 21.0 25.3 18.2 21.1
35-44 29.2 13.4 33.7 13.3 18.2
45-54 26.5 16.2 23.5 16.0 18.5
55-59 7.9 8.9 8.8 11.2 9.5
60-64 3.6 8.4 3.5 8.9 7.2
65-74 2.3 12.3 1.9 11.0 9.1
75-84 0.5 3.1 0.3 3.2 2.4
Over 85 0.1 0.4 0.0 0.4 0.3
Total 100.0 100.0 100.0 100.0 100.0
Terminal Passengers (000s) 8,160 23,548 12,216 33,613 77,537
Mean age (yrs) 41.9 44.2 41.8 44.3 43.6
Note: Excludes interviews where passengers have not answered all relevent core questions
81

Table 11.5
Age distribution of UK and foreign passengers at Leeds Bradford Airport in 2017.
UK Foreign Grand
Age Business Leisure Business Leisure Total
% % % % %
02-10 0.0 0.4 0.0 0.1 0.3
11-15 0.0 0.8 0.0 0.0 0.5
16-19 0.1 2.3 0.4 1.1 1.9
20-24 3.8 10.5 9.6 9.4 9.9
25-34 38.8 22.3 25.8 26.9 24.1
35-44 32.0 14.6 28.1 17.7 16.4
45-54 15.0 11.6 18.0 9.6 11.5
55-59 5.5 6.4 17.0 10.2 7.4
60-64 3.6 8.4 0.0 8.8 8.1
65-74 1.3 17.2 1.1 11.1 14.7
75-84 0.0 5.4 0.0 5.0 4.9
Over 85 0.0 0.2 0.0 0.1 0.2
Total 100.0 100.0 100.0 100.0 100.0
Terminal Passengers (000s) 192 2,832 83 857 3,964
Mean age (yrs) 38.6 46.2 40.3 45.0 45.4
Note: Excludes interviews where passengers have not answered all relevent core questions
82

Table 11.6
Age distribution of UK and foreign passengers at Liverpool Airport in 2017.
UK Foreign Grand
Age Business Leisure Business Leisure Total
% % % % %
02-10 0.0 2.2 0.0 0.4 1.6
11-15 0.0 2.6 0.0 0.8 2.0
16-19 0.8 4.7 0.0 3.6 4.1
20-24 7.7 12.4 9.5 18.7 13.4
25-34 14.7 20.9 27.6 27.9 22.3
35-44 31.3 13.3 28.9 16.6 15.6
45-54 29.4 15.3 18.6 12.2 15.6
55-59 10.9 8.1 7.5 8.2 8.3
60-64 2.8 7.7 7.2 6.4 7.1
65-74 2.3 10.5 0.8 4.9 8.5
75-84 0.3 2.0 0.0 0.3 1.4
Over 85 0.0 0.3 0.0 0.0 0.2
Total 100.0 100.0 100.0 100.0 100.0
Terminal Passengers (000s) 289 3,329 149 1,094 4,861
Mean age (yrs) 42.8 41.6 40.1 37.9 40.8
Note: Excludes interviews where passengers have not answered all relevent core questions
83

Table 11.7
Age distribution of UK and foreign passengers at London City Airport in 2017.
UK Foreign Grand
Age Business Leisure Business Leisure Total
% % % % %
02-10 0.1 0.2 0.0 0.1 0.1
11-15 0.0 0.4 0.0 1.8 0.4
16-19 0.3 5.1 0.8 6.2 2.9
20-24 9.5 11.8 3.9 17.0 10.2
25-34 26.8 24.8 19.3 24.7 24.2
35-44 23.1 16.2 26.4 15.5 20.4
45-54 22.9 15.3 28.2 12.4 19.9
55-59 10.3 8.3 13.9 7.6 10.0
60-64 4.5 8.1 6.5 7.1 6.5
65-74 2.1 8.1 0.9 6.6 4.5
75-84 0.2 1.6 0.1 1.0 0.7
Over 85 0.0 0.1 0.0 0.1 0.1
Total 100.0 100.0 100.0 100.0 100.0
Terminal Passengers (000s) 1,308 1,500 993 673 4,473
Mean age (yrs) 40.9 41.6 43.7 38.8 41.4
Note: Excludes interviews where passengers have not answered all relevent core questions
84

Table 11.8
Age distribution of UK and foreign passengers at Luton Airport in 2017.
UK Foreign Grand
Age Business Leisure Business Leisure Total
% % % % %
02-10 0.0 8.7 0.0 4.4 6.5
11-15 0.0 2.7 1.4 3.9 2.7
16-19 0.3 4.9 1.5 4.7 4.4
20-24 4.7 11.7 6.5 14.3 11.5
25-34 18.8 18.8 27.1 19.8 19.4
35-44 20.2 11.5 27.9 11.3 12.8
45-54 31.7 14.8 19.0 13.2 16.0
55-59 13.3 7.7 12.0 9.4 8.7
60-64 6.9 7.6 3.1 7.8 7.4
65-74 2.8 9.7 1.5 9.6 8.8
75-84 1.2 1.9 0.0 1.6 1.7
Over 85 0.0 0.1 0.0 0.0 0.1
Total 100.0 100.0 100.0 100.0 100.0
Terminal Passengers (000s) 1,294 10,018 632 3,980 15,924
Mean age (yrs) 45.1 39.1 40.1 39.8 39.8
Note: Excludes interviews where passengers have not answered all relevent core questions
85

Table 11.9
Age distribution of UK and foreign passengers at Manchester Airport in 2017.
UK Foreign Grand
Age Business Leisure Business Leisure Total
% % % % %
02-10 0.1 1.4 0.0 0.7 1.1
11-15 0.0 1.2 0.0 1.1 1.0
16-19 0.3 2.7 0.7 4.9 2.7
20-24 3.7 10.4 4.1 13.4 9.8
25-34 18.4 17.2 20.6 21.2 18.1
35-44 24.5 12.7 26.3 15.7 15.2
45-54 34.2 18.9 30.5 16.9 20.9
55-59 12.0 10.0 10.2 9.7 10.2
60-64 4.5 9.1 3.5 7.9 8.1
65-74 2.1 13.1 3.1 6.9 10.4
75-84 0.2 3.0 1.0 1.4 2.4
Over 85 0.0 0.2 0.0 0.1 0.2
Total 100.0 100.0 100.0 100.0 100.0
Terminal Passengers (000s) 2,894 18,362 1,491 3,823 26,570
Mean age (yrs) 44.2 45.5 43.5 41.3 44.6
Note: Excludes interviews where passengers have not answered all relevent core questions
86

Table 11.10
Age distribution of UK and foreign passengers at Newcastle Airport in 2017.
UK Foreign Grand
Age Business Leisure Business Leisure Total
% % % % %
02-10 0.0 0.1 0.0 0.0 0.1
11-15 0.0 0.3 0.0 0.3 0.2
16-19 1.3 3.0 1.8 4.5 3.0
20-24 5.7 8.3 6.9 14.4 8.8
25-34 20.2 10.3 19.1 18.4 12.7
35-44 23.7 10.3 27.2 11.4 12.5
45-54 29.6 18.4 25.4 16.0 19.5
55-59 11.1 11.9 9.3 9.0 11.3
60-64 5.2 12.2 5.1 8.7 10.8
65-74 2.6 19.7 5.2 14.3 16.7
75-84 0.4 5.3 0.0 2.9 4.2
Over 85 0.0 0.3 0.0 0.2 0.2
Total 100.0 100.0 100.0 100.0 100.0
Terminal Passengers (000s) 507 3,646 214 674 5,041
Mean age (yrs) 43.2 51.1 42.9 44.8 49.1
Note: Excludes interviews where passengers have not answered all relevent core questions
87

Table 11.11
Age distribution of UK and foreign passengers at Stansted Airport in 2017.
UK Foreign Grand
Age Business Leisure Business Leisure Total
% % % % %
02-10 0.0 1.0 0.0 0.6 0.8
11-15 0.0 1.4 0.0 1.3 1.2
16-19 0.4 2.8 1.6 5.4 3.3
20-24 5.7 13.6 6.9 20.1 14.5
25-34 29.0 31.8 34.7 30.7 31.4
35-44 23.9 16.7 27.8 13.4 16.9
45-54 25.3 12.9 20.7 11.2 13.7
55-59 8.9 5.9 5.0 5.2 5.9
60-64 4.8 4.9 2.0 5.3 4.8
65-74 2.0 7.3 1.1 4.8 5.9
75-84 0.1 1.6 0.1 1.9 1.5
Over 85 0.0 0.2 0.0 0.0 0.1
Total 100.0 100.0 100.0 100.0 100.0
Terminal Passengers (000s) 1,867 14,827 1,338 7,351 25,382
Mean age (yrs) 41.3 38.9 38.2 36.6 38.4
Note: Excludes interviews where passengers have not answered all relevent core questions
88

Table 12About This table presents an overall satisfactory summary provided by different passenger profiles at each UK survey
airport
Filter Notes No filters
Questions Asked How would you rate your overall experience at THIS Airport today?
DERIVED NONE
89

Table 12.1
Overall passenger experience of airport in 2017.
Gatwick Heathrow London City Luton Stansted
% % % % %
Excellent 32.7 37.0 42.3 27.8 22.4
Good 58.6 52.1 49.2 55.6 59.3
Average 7.5 9.1 7.1 12.6 14.5
Poor 1.0 1.4 1.1 3.0 3.0
Extremely Poor 0.2 0.5 0.3 1.0 0.8
Total 100.0 100.0 100.0 100.0 100.0
Passengers (000's) 44,786 77,537 4,473 15,924 25,382
Table 12.2
Overall passenger experience of airport in 2017.*
Birmingham Manchester Liverpool Leeds Bradford Newcastle
% % % % %
Excellent 24.4 25.0 42.0 25.1 44.4
Good 63.9 55.1 52.8 53.2 50.3
Average 9.7 15.9 4.6 19.9 4.5
Poor 1.4 3.0 0.6 1.4 0.6
Extremely Poor 0.5 0.9 0.0 0.4 0.2
Total 100.0 100.0 100.0 100.0 100.0
Passengers (000's) 12,652 26,570 4,861 3,964 5,041
* This question wasn't asked at East Midlands airport in 2017
90

CAA Passenger Survey Data - Want to know more? Contact us for your bespoke data. These tables provide summary information. If you are looking for more detail or at a different passenger profile we would be happy to assist you in obtaining your required data. We have a wealth of information and a dedicated team on hand to help you find what you need.
To find out more contact [email protected] or 0207 453 6282.
91