caadp framework and the card initiative - rice for africa 2-01 caadp.pdf · targeting smallholders...
TRANSCRIPT
The Fourth General Meeting of CARD
CAADP Framework and the CARD Initiative
8 November 2011
Annex 10
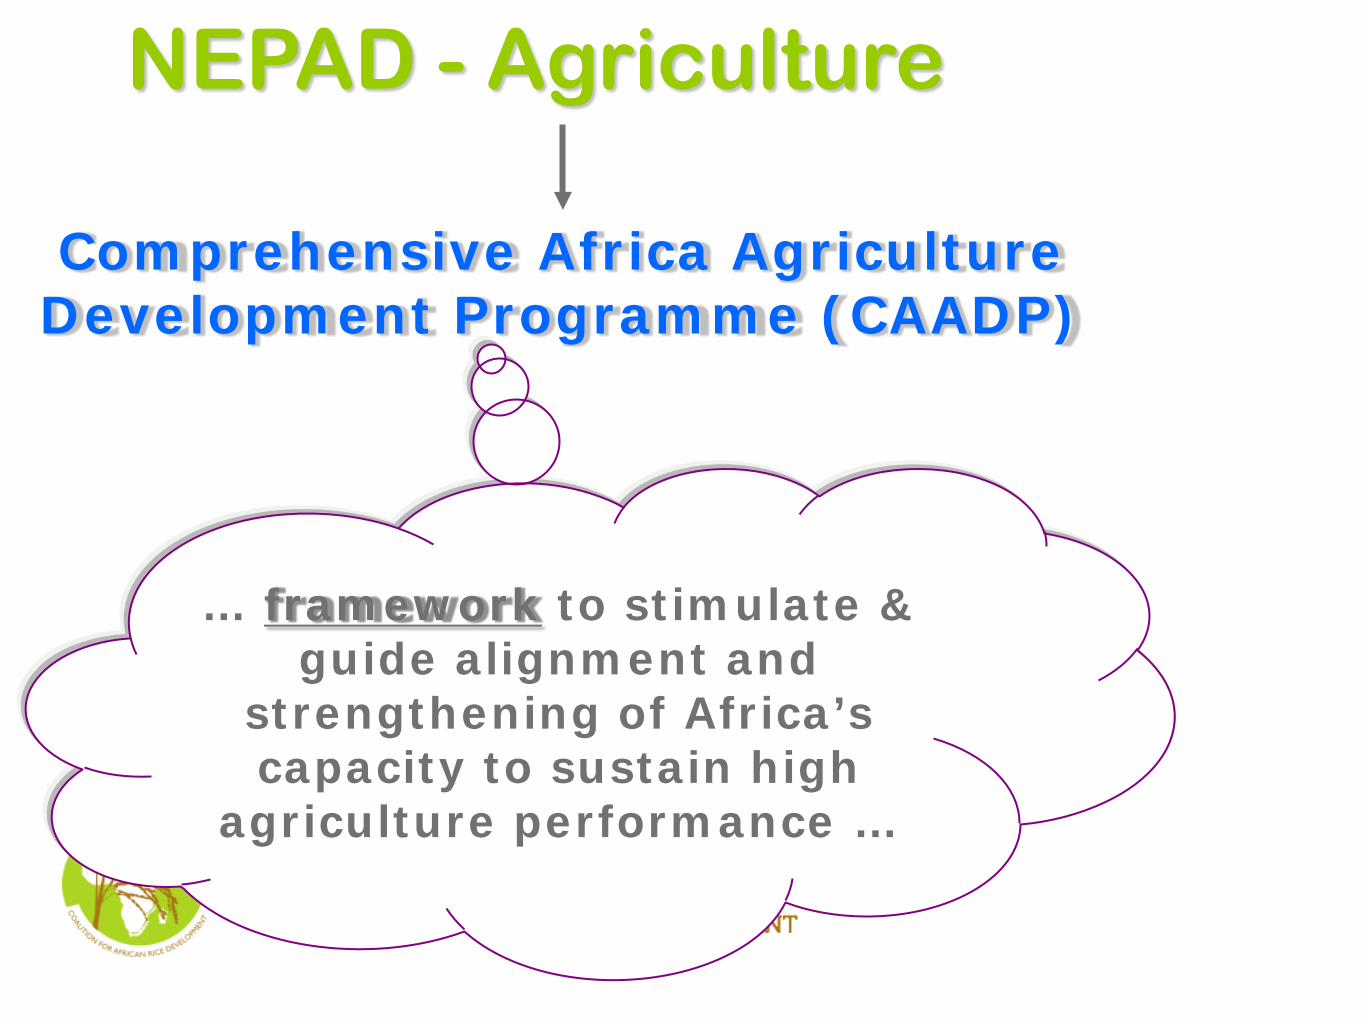
… framework to stimulate & guide alignment and
strengthening of Africa’s capacity to sustain high
agriculture performance …
Comprehensive Africa Agriculture Development Programme (CAADP)
NEPAD - Agriculture
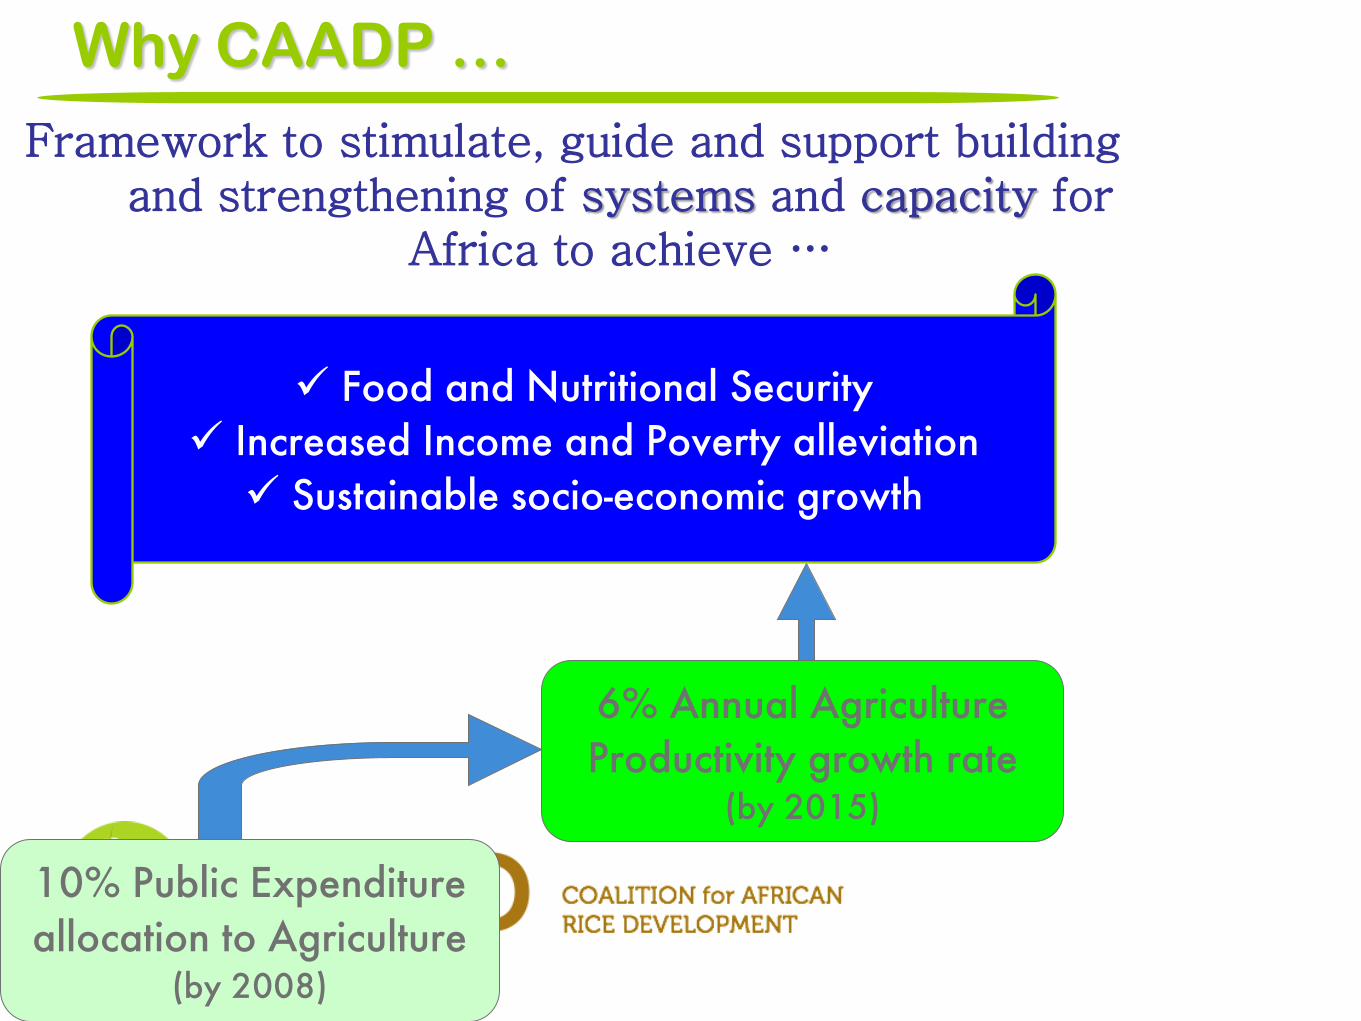
Framework to stimulate, guide and support building and strengthening of systems and capacity for
Africa to achieve …
Why CAADP …
Food and Nutritional Security Increased Income and Poverty alleviation Sustainable socio-economic growth
10% Public Expenditure allocation to Agriculture
(by 2008)
6% Annual Agriculture Productivity growth rate
(by 2015)

CAADP and transformation of Africa Agriculture (development) instruments/models
1
2
3
6%

Food and Nutritional Security Increased Income and Poverty alleviation Sustainable socio-economic growth
6% Annual Agriculture Productivity growth rate
(by 2015)
CARD CAADP Flagship
Programmes
14 million tons/year to 28 million tons/year by 2018
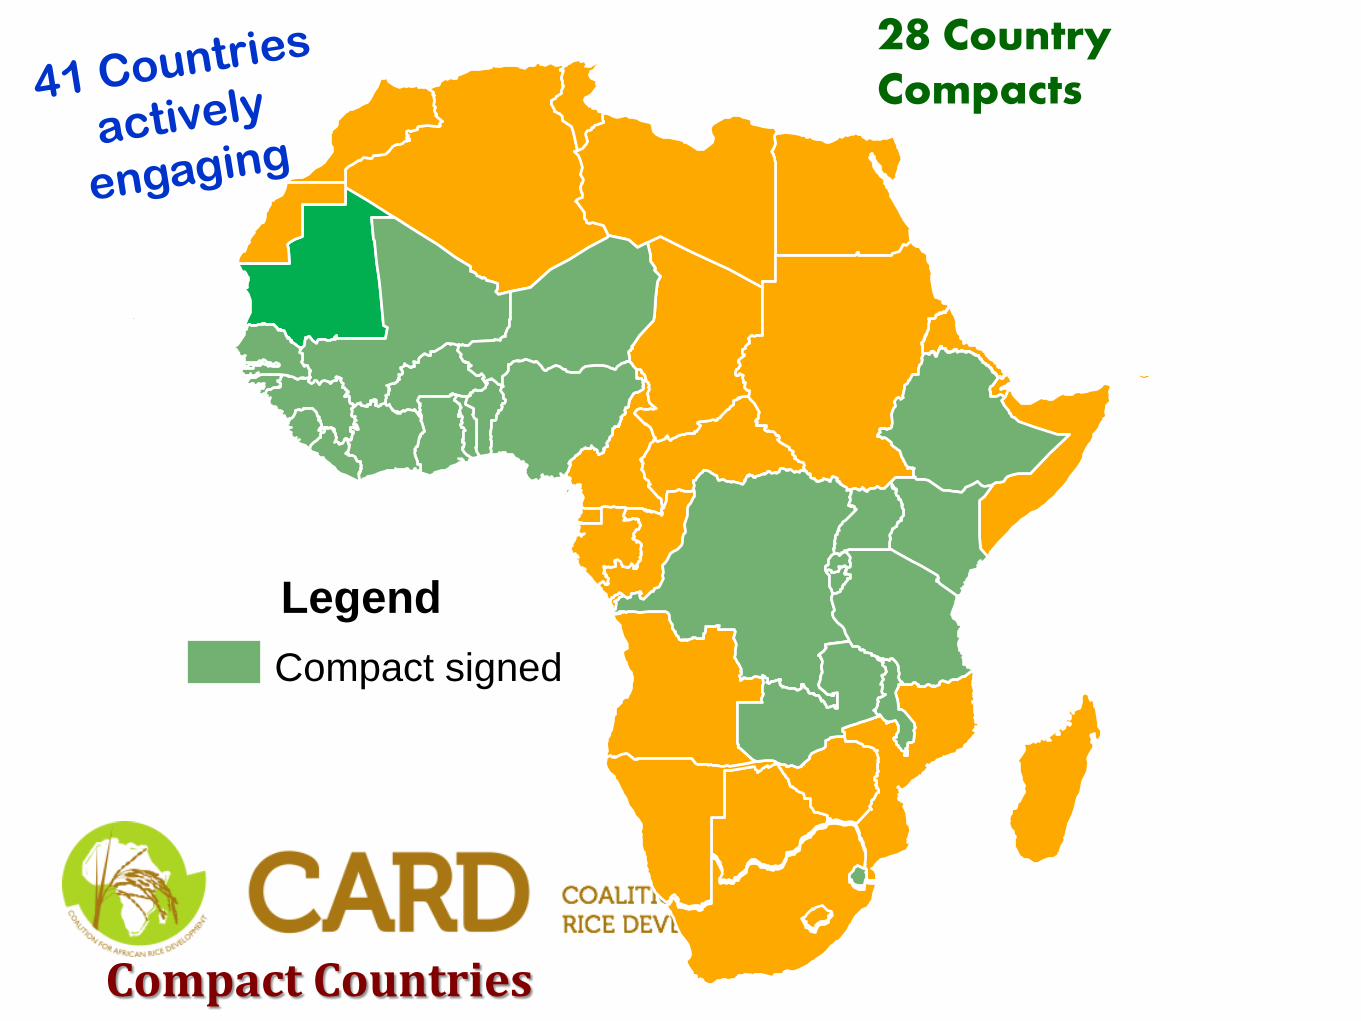
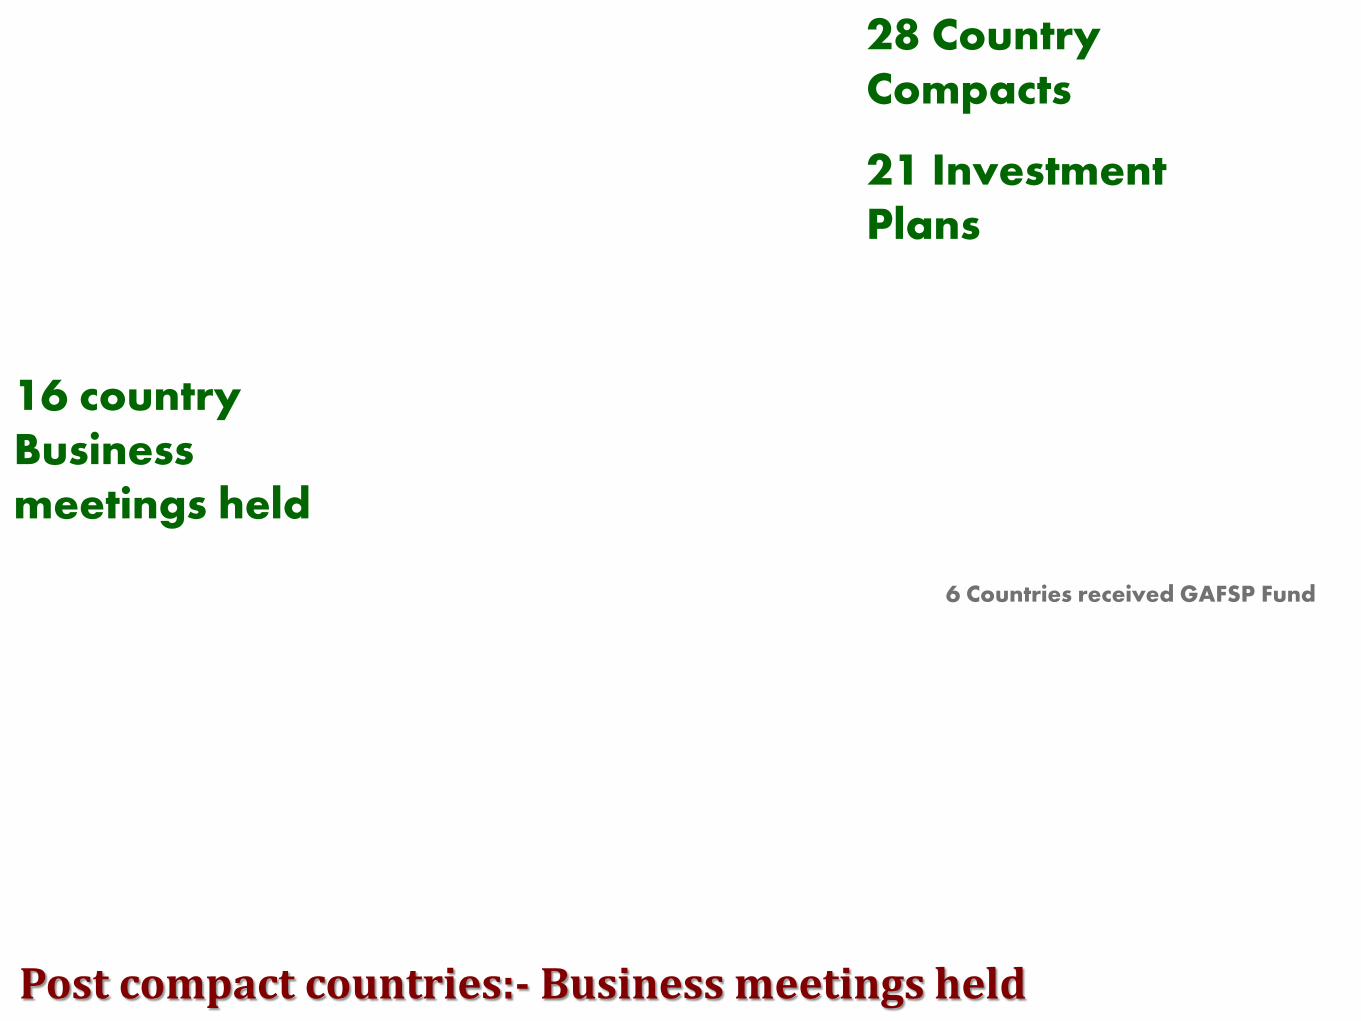
28 Country Compacts
Compact Countries
Legend Compact signed

28 Country Compacts
Post Compact countries:- Investment plans reviewed
21 Investment Plans
21 Investment Plans
Post compact countries:- Business meetings held
28 Country Compacts
16 country Business meetings held
6 Countries received GAFSP Fund
REC Countries that have signed
Compacts Dates when Compacts
signed IP Ready
Technical review for the IP
Business Meeting held Remarks C
OM
ESA
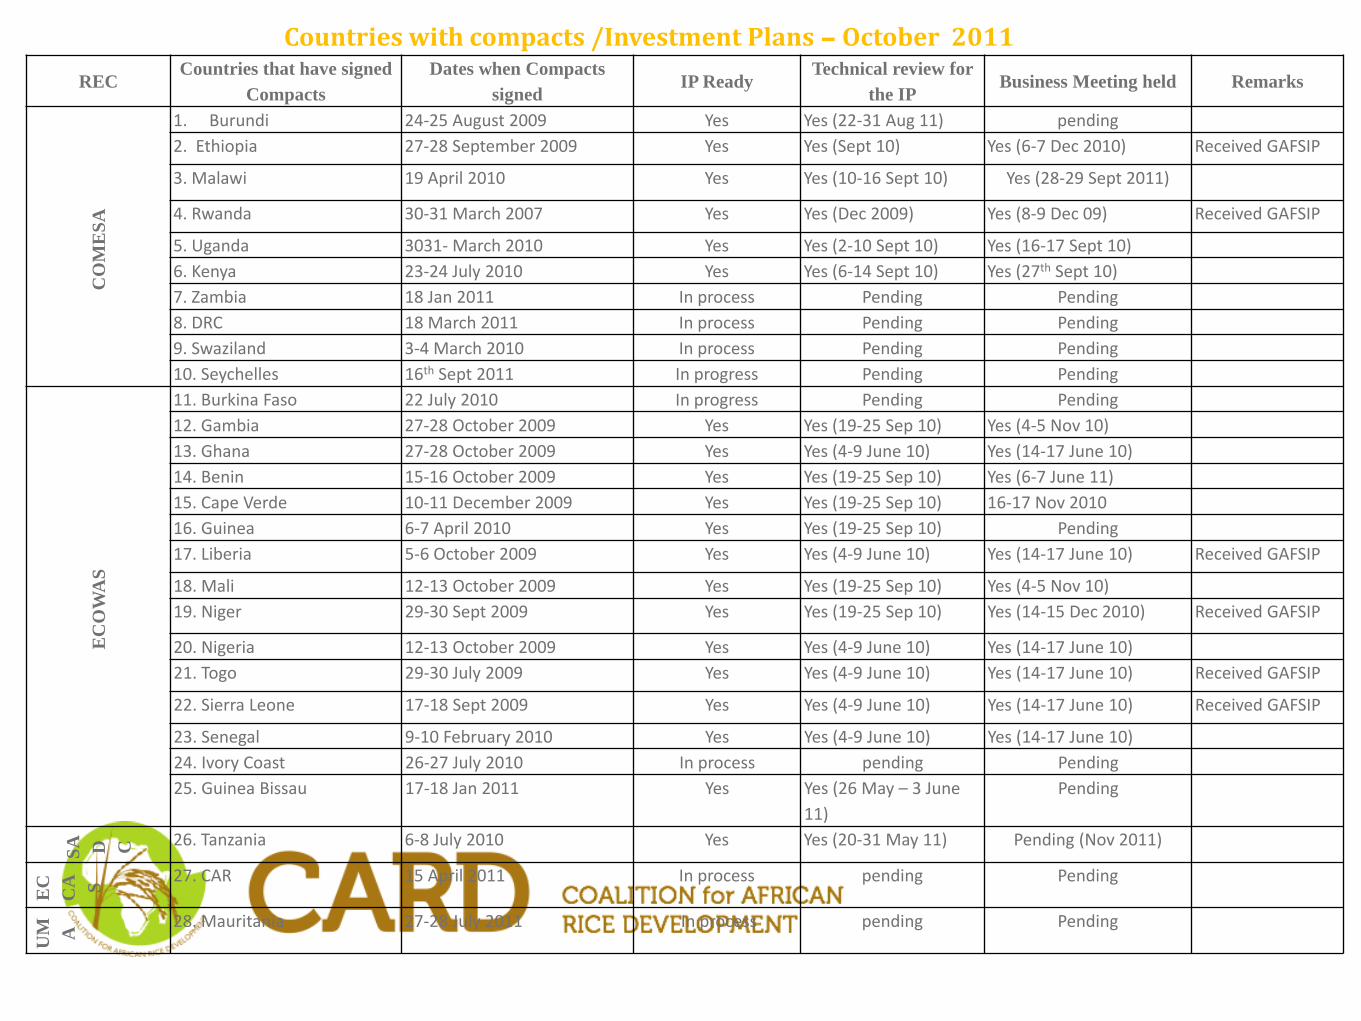
1. Burundi 24-25 August 2009 Yes Yes (22-31 Aug 11) pending 2. Ethiopia 27-28 September 2009 Yes Yes (Sept 10) Yes (6-7 Dec 2010) Received GAFSIP
3. Malawi 19 April 2010 Yes Yes (10-16 Sept 10) Yes (28-29 Sept 2011)
4. Rwanda 30-31 March 2007 Yes Yes (Dec 2009) Yes (8-9 Dec 09) Received GAFSIP
5. Uganda 3031- March 2010 Yes Yes (2-10 Sept 10) Yes (16-17 Sept 10) 6. Kenya 23-24 July 2010 Yes Yes (6-14 Sept 10) Yes (27th Sept 10) 7. Zambia 18 Jan 2011 In process Pending Pending 8. DRC 18 March 2011 In process Pending Pending 9. Swaziland 3-4 March 2010 In process Pending Pending 10. Seychelles 16th Sept 2011 In progress Pending Pending
EC
OW
AS
11. Burkina Faso 22 July 2010 In progress Pending Pending 12. Gambia 27-28 October 2009 Yes Yes (19-25 Sep 10) Yes (4-5 Nov 10) 13. Ghana 27-28 October 2009 Yes Yes (4-9 June 10) Yes (14-17 June 10) 14. Benin 15-16 October 2009 Yes Yes (19-25 Sep 10) Yes (6-7 June 11) 15. Cape Verde 10-11 December 2009 Yes Yes (19-25 Sep 10) 16-17 Nov 2010 16. Guinea 6-7 April 2010 Yes Yes (19-25 Sep 10) Pending 17. Liberia 5-6 October 2009 Yes Yes (4-9 June 10) Yes (14-17 June 10) Received GAFSIP
18. Mali 12-13 October 2009 Yes Yes (19-25 Sep 10) Yes (4-5 Nov 10) 19. Niger 29-30 Sept 2009 Yes Yes (19-25 Sep 10) Yes (14-15 Dec 2010) Received GAFSIP
20. Nigeria 12-13 October 2009 Yes Yes (4-9 June 10) Yes (14-17 June 10) 21. Togo 29-30 July 2009 Yes Yes (4-9 June 10) Yes (14-17 June 10) Received GAFSIP
22. Sierra Leone 17-18 Sept 2009 Yes Yes (4-9 June 10) Yes (14-17 June 10) Received GAFSIP
23. Senegal 9-10 February 2010 Yes Yes (4-9 June 10) Yes (14-17 June 10) 24. Ivory Coast 26-27 July 2010 In process pending Pending 25. Guinea Bissau 17-18 Jan 2011 Yes Yes (26 May – 3 June
11) Pending
SA D C 26. Tanzania 6-8 July 2010 Yes Yes (20-31 May 11) Pending (Nov 2011)
EC
CA S 27. CAR 15 April 2011 In process pending Pending
UM A
28. Mauritania 27-28 July 2011 In process pending Pending
Countries with compacts /Investment Plans – October 2011

Countries, which have launched CAADP implementation and working towards signing compact. 1. Zimbabwe 2. Mozambique (formal launch 24/11/10) 3. Congo-Brazzaville 4. Democratic Republic of Congo 5. Sudan* 6. Lesotho (launch on 26 May 2011) 7. South Africa (20 Oct 2011) Expected to formally launch CAADP implementation (in 2011) 1. Cameroon 4. Botswana 2. Algeria 5. Djibouti 3. Namibia 6. Egypt 7. Tchad Newly engaging and yet to start countries Tunisia 5. Namibia Sao Tome and Principle 6. Gabon Angola 7. Comoros Mauritius 8. Madagascar

Food & Nutrition Security and Emergency Preparedness
38%
Sustainable management of land and water
6% Intensification & Devt of
Production and Productivty Systems
15%
Market Access, Competitiveness and Value
Addition 30%
Enabling Environment 2%
Science and technology applied in food and agriculture
5% Capacity Institutional
Development 5%
Key Priorities
Source: “Status, Experiences and Lessons with the National Agriculture & Food Security Investment Plans”, presentation at CAADP PP 2011 held by Ousmane Djibo (NEPAD Agency - GIZ).
1/9/2012
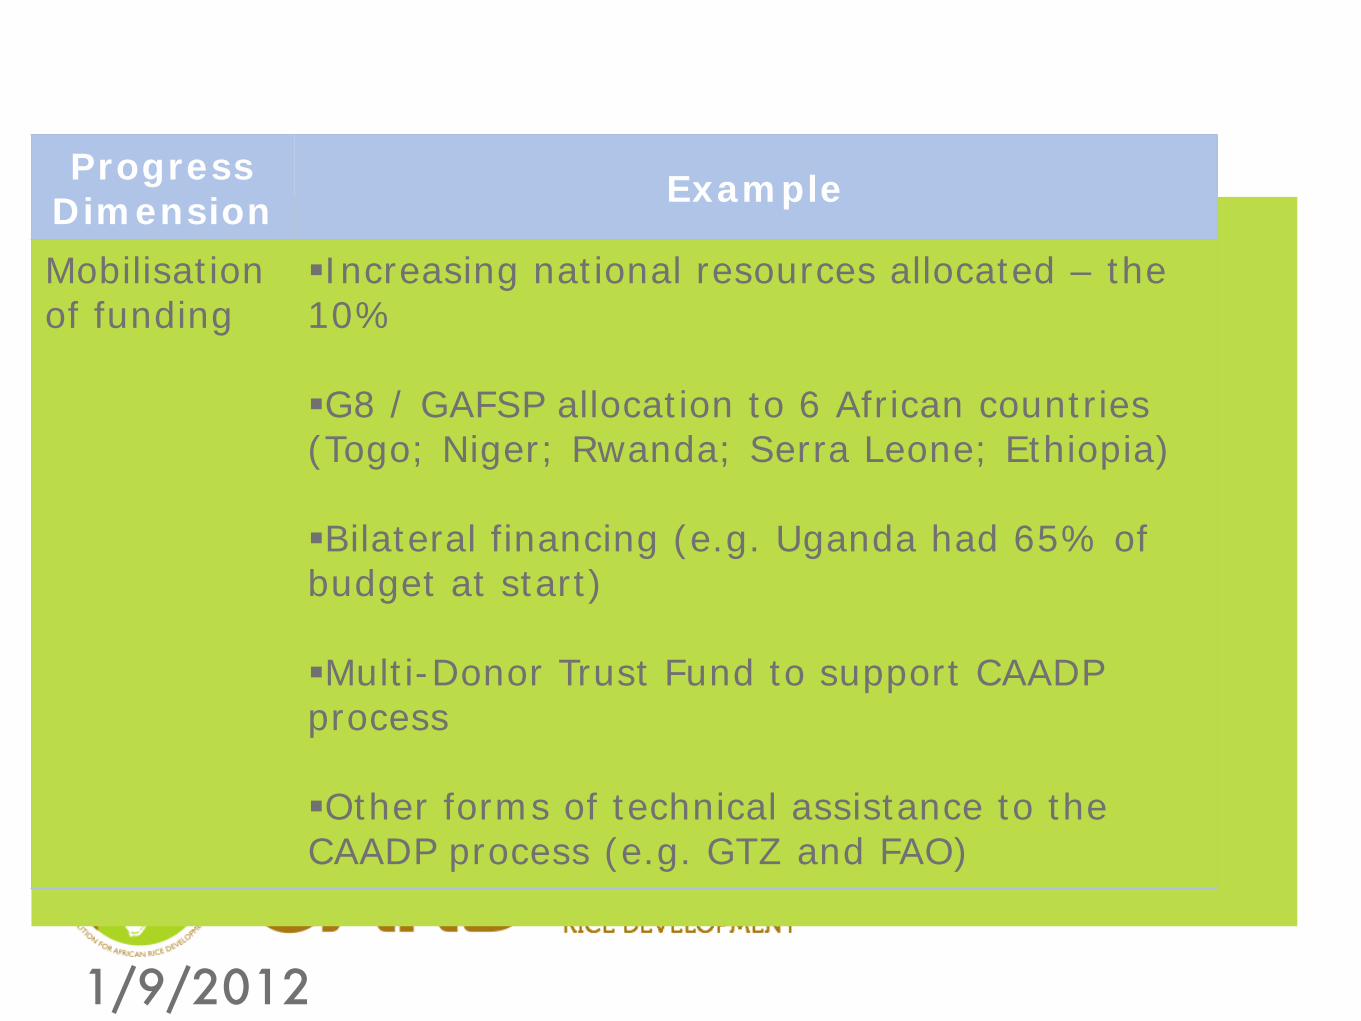
Progress Dimension Example
Mobilisation of funding
Increasing national resources allocated – the 10% G8 / GAFSP allocation to 6 African countries (Togo; Niger; Rwanda; Serra Leone; Ethiopia) Bilateral financing (e.g. Uganda had 65% of budget at start) Multi-Donor Trust Fund to support CAADP process Other forms of technical assistance to the CAADP process (e.g. GTZ and FAO)

Meeting the MDG 1 •There are 2 components to MDG1: hunger and poverty •Great progress has been made in many countries that are meeting one or the other,
Burkina Faso Cameroon Cape Verde Central African Rep. Ethiopia Guinea Kenya Lesotho Malawi Mali Morocco Senegal Swaziland Uganda EA Region
Countries on track towards halving poverty by 2015
Countries on track towards halving hunger
by 2015
Countries on track towards
achieving MDG1
Algeria Angola Benin Botswana Burundi Equatorial Guinea The Gambia Guinea Bissau Mozambique Namibia Sao Tome & Principe Tunisia
Ghana Egypt Mauritania NA Region
NRDS Countries not
included in the above
G1
Madagascar Sierra Leone Tanzania
G2 Cote D’Ivoire DRC Liberia Rwanda Togo Zambia
NRDS Countries
1/9/2012
0
1,000
2,000
3,000
4,000
5,000
6,000
2003/04 2004/05 2005/06 2006/07 2007/08 2008/09 2009/10
Government Donors Total
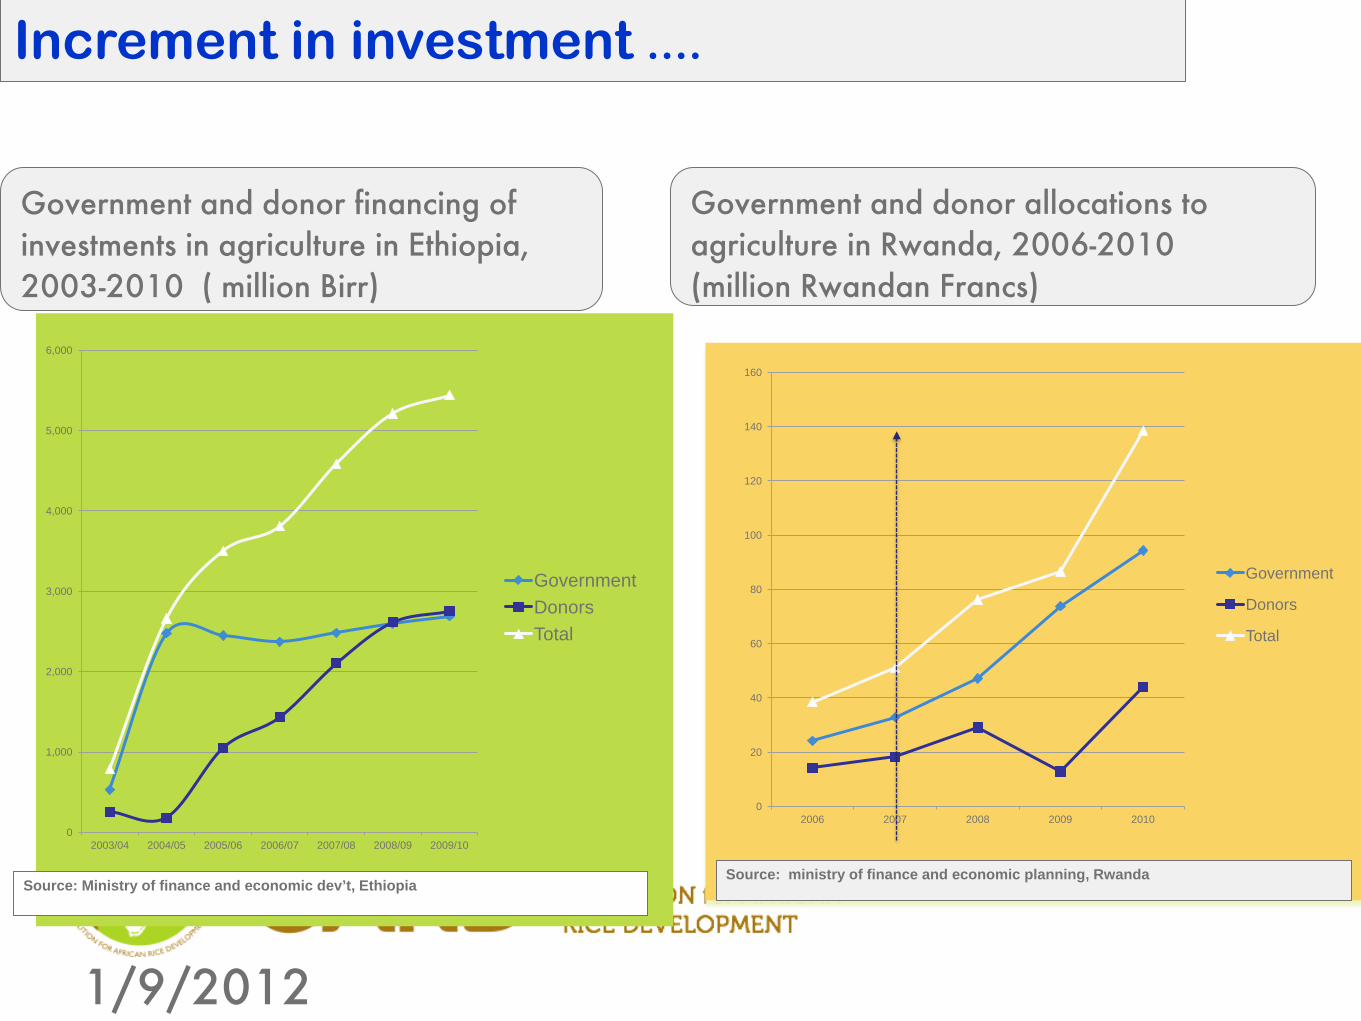
Source: Ministry of finance and economic dev’t, Ethiopia
Government and donor financing of investments in agriculture in Ethiopia, 2003-2010 ( million Birr)
0
20
40
60
80
100
120
140
160
2006 2007 2008 2009 2010
Government
Donors
Total
Source: ministry of finance and economic planning, Rwanda
Government and donor allocations to agriculture in Rwanda, 2006-2010 (million Rwandan Francs)
Increment in investment ....

Advocacy: flow of info and messages
NRDS Task Force
CAADP / FP Ag. Sector
High Level Decision Making
Sub-sector strategies Progress reporting
Priorities Regional level
QUALITY QUALITY

Table 1 CAADP Implementation Status in CARD Countries
G1 Countries NRDS Compact NAIP Tec Rev Busuniess
Mt Financing
Implementation
Readiness 1 Cameroun
2 Ghana
3 Guinea
4 Kenya
5 Madagascar
6 Mali
7 Mozambique
8 Nigeria
9 Senegal
10 Sierra Leone GAFSP
11 Tanzania
12 Uganda
Total 12 9 9 9 7 7 7
Milestone Achieved Milestone not yet achieved

Table 2 CAADP Implementation Status in CARD Countries
G2 Countries NRDS Compact IP Tec Rev Busuniess
Mt Financing Redines
s 1 Benin 2 Burkina Faso 3 Cote D'Ivoire 4 CAR 5 DR Congo 6 Ethiopia GAFSP 7 The Gambia 8 Liberia GAFSP 9 Rwanda GAFSP
10 Togo GAFSP 11 Zambia 5 10 9 7 6 6 6
Milestone Achieved Milestone not yet achieved
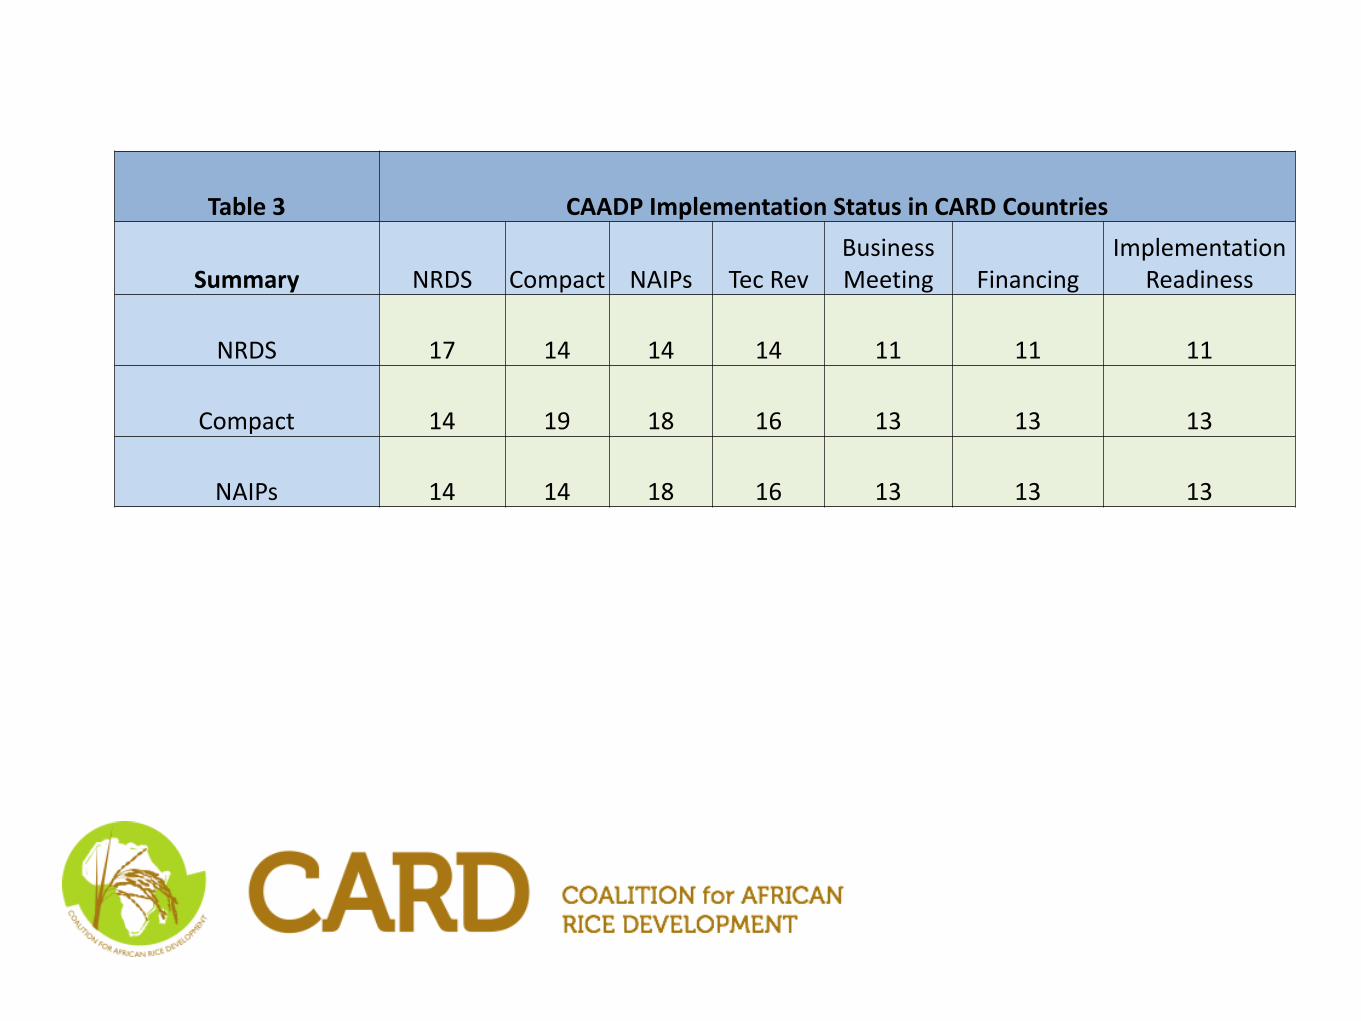
Table 3 CAADP Implementation Status in CARD Countries
Summary NRDS
Compact NAIPs Tec Rev Business Meeting Financing
Implementation Readiness
NRDS 17 14 14 14 11 11 11
Compact 14 19 18 16 13 13 13
NAIPs 14 14 18 16 13 13 13

Areas of investment in selected NAIPs in relation to NRDS
Country IP Fields of investment linked to NRDS
Tanzania Tanzania Agriculture and Food Security Investment Plan (TAFSIP) 2011-12 to 2020-21
Growth in the agricultural sector tends to be skewed towards larger‐scale production of rice, maize and wheat; Tanzania’s economic growth over the last decade is concentrated in larger‐scale production of rice and wheat, and export crops. Production and Productivity of Rice improved access to improved rice varieties Develop Irrigated and Rain fed Rice Infrastructure Improve the nutritional requirements for rice in terms of vitamins, minerals and other micro nutrients. Area under rice irrigation to increase from 640 ha to 1,550 ha,. Targeting smallholders to engage in commercial enterprise through incentives, training etc. Aligning central budget allocation to sector policy in order to reach stated outcomes. Need to stimulate private sector investments to achieve target growth rate
Coordination issues between NRDS and other ongoing projects Bread Basked initiative (AGRA/Private Sector) is estimated at USD 173 million. 2010-2015 National Rice Development Strategy (NARDS) Pg 73
Source: Document compiled by Andreas Springer Heinze and Carsten Schüttel for the Value Chain Training Workshop in Nairobi Kenya 2011.

Country IP Fields of investment linked to NRDS Ghana Medium-Term
Agriculture Sector Investment Plan METASIP 2011-2015
Rice is 3rd most important cereal consumed after maze and Millet In 2008 total production estimated consuption was 561,400mt but produced 107,900mt with deficits of 453 500 mt. Rice imports have consistently been the highest since 2001 There is a growing excess demand for rice Per capita consumption has increased from about 12kg in 1980 to 24kg in 2009. Between 2006 and 2008, Ghana imported an average of 409,000 Mt of rice worth US$168 million There are also 13 ongoing rice development projects in the country funded by various donors. Despite the efforts made in the production of rice, cost of production is high and it cannot compete with cheaper imported rice. Gaps between achievable yields (under best farmer practices) and actual yields range from about 42% for rice. Intend to reduce post harvest losses from the current 6.9% to 4% by 2015 resulting in 35% total reduction in post harvest losses from . Improve technologies adopted by smallholder farmers and yields by 50%. Develop other high quality staples through breeding rice etc. Reduce post harvest losses by 35% along the value chain by 2015 (based on baseline in MOFA 2007 post-harvest study).

2012 NPCA CARD Support
1. In the context of NEPAD Agribusiness and Trade
Promotion Strategy and NEPAD Flagship programmes 2. Coordination and alignment issues, eg with RECs
strategies 3. Seek alignment of NRDS with NAIPs 4. Value Chain Promotion and capacity building for NRDS
countries in collaboration with CMA/WCA, GIZ 5. Post harvest infrastructure, quality and marketing issues 6. National and regional policy dialogues and reforms-e.g.
mechanization, seeds, fertilizer, markets. 7. Private sector finance negotiations 8. Partnerships- South South cooperation 9. African Rice Investment Roundtable ??????
