cabin environment physics risk model - nasa · cabin environment physics risk model ... failure...
TRANSCRIPT
Cabin Environment Physics Risk Model
Christopher J. Mattenbergera* and Donovan L. Mathiasb a Science and Technology Corporation, Moffett Field, CA, USA
b NASA Ames Research Center, Moffett Field, CA, USA
Abstract: This paper presents a Cabin Environment Physics Risk (CEPR) model that predicts the time for an initial failure of Environmental Control and Life Support System (ECLSS) functionality to propagate into a hazardous environment and trigger a loss-of-crew (LOC) event. This physics-of-failure model allows a probabilistic risk assessment of a crewed spacecraft to account for the cabin environment, which can serve as a buffer to protect the crew during an abort from orbit and ultimately enable a safe return. The results of the CEPR model replace the assumption that failure of the crew-critical ECLSS functionality causes LOC instantly, and provide a more accurate representation of the spacecraft’s risk posture. The instant-LOC assumption is shown to be excessively conservative and, moreover, can impact the relative risk drivers identified for the spacecraft. This, in turn, could lead the design team to allocate mass for equipment to reduce overly conservative risk estimates in a suboptimal configuration, which inherently increases the overall risk to the crew. For example, available mass could be poorly used to add redundant ECLSS components that have a negligible benefit but appear to make the vehicle safer due to poor assumptions about the propagation time of ECLSS failures. Keywords: Physics of Failure, Risk-Informed Design, Human Spaceflight, PRA, Dynamic PSA. 1. INTRODUCTION Human space flight is not only extremely hazardous, but is also highly constrained in terms of mass, cost, and performance, making it an ideal candidate to benefit from risk-informed design [1]. Risk-informed design practices enable spacecraft engineers to efficiently mitigate the most impactful risk factors while optimizing the use of constrained resources [2]. In other words, risk-informed design enables design teams to utilize precious resources, such as mass, in a risk-efficient manner to arrive at a risk-balanced design solution with a higher probability of success [3]. Implementing risk-informed design in human spaceflight requires the design team to have detailed, quantitative, probabilistic insights into the environmental hazards, operational risks, and component unreliabilities that could lead to a loss of mission (LOM) or a loss of crew (LOC) [4]. Classical probabilistic risk assessment (PRA) methodologies based on event trees and fault trees cannot easily capture dynamic, time-sensitive interactions between a complex space system experiencing failure and the rapidly evolving hazardous environments that it encounters [5]. As such, a standard acceptable practice is to conservatively and simplistically bound the risk estimate by making assumptions about the time it takes a loss of functionality to propagate into a LOC event [6]. Often, it is assumed that loss of functionality immediately leads to LOC. However, if such an assumption causes the functionality to become a leading risk driver, then this assumption must be refined to allow the true nature of the system risk to emerge. Modeling risks due to Environmental Control and Life Support System (ECLSS) failures is an important example of this issue. It can be simplistically and conservatively assumed that a LOC event occurs immediately if ECLSS functionality is lost on a crewed spacecraft while in orbit. However, this assumption will be shown to be excessively conservative and dangerously misleading if the results are used to implement risk-informed design and guide the application of redundancy to various system functionalities. Such an assumption impacts the relative risk drivers identified by the assessment and could lead the design team to allocate mass to reduce risk in a suboptimal configuration, which inherently increases the overall risk to the crew.
https://ntrs.nasa.gov/search.jsp?R=20140010764 2018-08-24T16:44:22+00:00Z

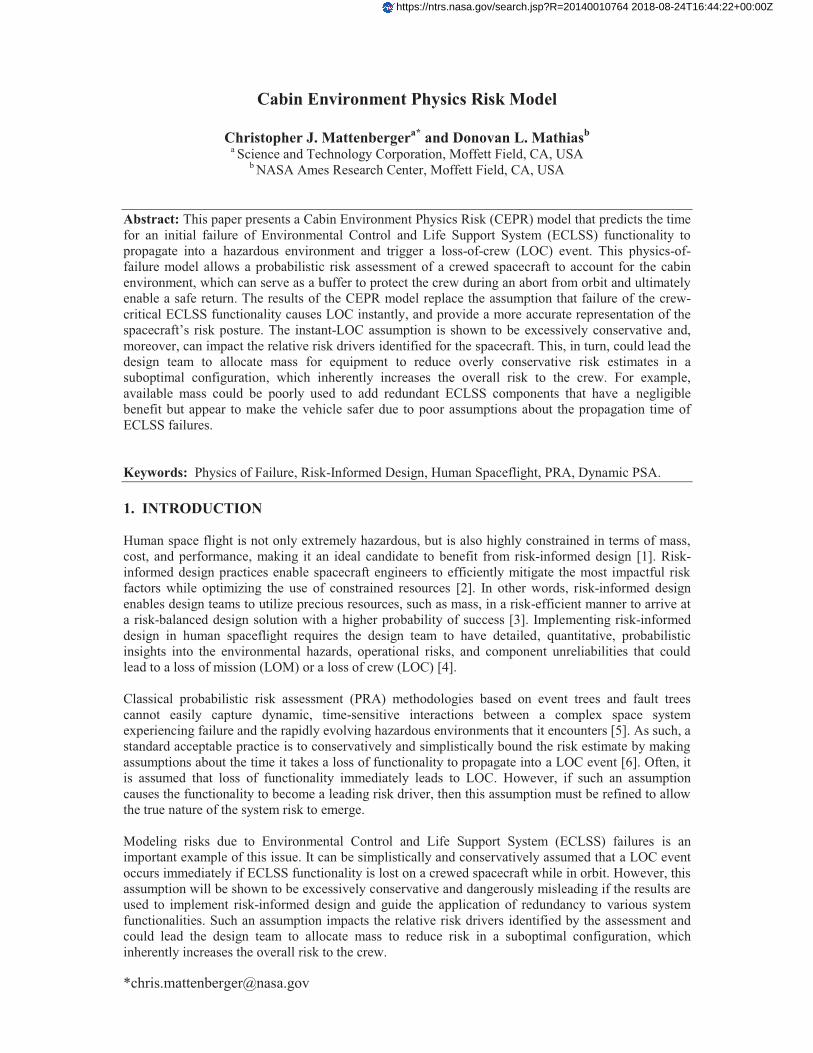
This paper presents a Cabin Environment Physics Risk (CEPR) model that uses physics-of-failure analysis to predict the time it takes for an initial ECLSS failure to propagate into a hazardous environment and cause a LOC event. This model allows the risk assessment to take credit for the cabin environment and diverse capabilities of the system, which can serve as buffer to protect the crew after an initial failure and enable a successful abort from orbit. This refinement removes the excessively conservative assumption that failure of a crew-critical ECLSS functionality causes LOC instantly and provides a more accurate picture of the spacecraft’s true risk posture. In the CEPR model, a functionality loss of varying severity occurs based upon a given failure initiator, triggering a LOM event. Once a LOM event has occurred, the model assumes that the mission ends early and the spacecraft performs contingency operations. The spacecraft aborts the nominal mission and attempts to return the crew safely before the failure can propagate into a LOC event. The severity of the failure and the resources available to mitigate it are used as inputs to the model. The model then captures the time- and state-dependent off-nominal performance of the system. The model tracks consumption of consumables; processing of cabin air by both the crew and atmospheric revitalizations subsystem (ARS) equipment; and the oxygen (O2), carbon dioxide (CO2), and nitrogen (N2) content of the cabin environment. The cabin environment is then compared to a physical threshold at which LOC would occur. Potential ECLSS failure modes include loss of air delivery to the cabin, a loss or reduction of CO2 removal from the atmosphere, and a loss of cabin pressure vessel integrity due to a valve or hatch failure. Specific mission Concept of Operations (ConOps) logic is encoded in the model to handle the various failure modes and respond in a manner that maximizes the amount of time until a LOC threshold of minimum O2 or maximum CO2 partial pressure is violated. The results of the CEPR model can be integrated into an overall dynamic mission risk model [7] to provide insight into the mission- and time-varying capabilities of a spacecraft to protect crew from an initial failure. It can also be utilized as a stand-alone model to aid in trade studies, ConOps development, and other design guidance. Future improvements to refine the model’s predictions and better reflect actual mission operations are also discussed, including stochastic initial cabin conditions, uncertainties in consumable gauging, and failure detection logic and timing. 2. METHODOLOGY 2.1. Model Overview The CEPR model is an ongoing development with incremental stages of functionality included to address conservative, risk-driving assumptions that have been made during the development of the NASA Ames Research Center Engineering Risk Assessment (ERA) team’s generic spacecraft [8]. The PRA assessment presented was performed using the Ames Reliability Tool (ART), based upon previous ERA team efforts [9]. The ART is an implicit fault tree/event tree generator that can rapidly produce quantitative risk estimates by focusing only on the risk driving cut-sets and neglecting cross-component interactions. Initial PRA estimates for the generic spacecraft indicated that ECLSS was the #2 LOC risk driver and that this risk was driven by the assumption that loss of ECLSS functionality leads immediately to LOC without the possibility of an abort from orbit. As such, the initial focus of the CEPR model development has been on ECLSS, with the ultimate goal of modeling the entire dynamic cabin environment. Currently, the scope of the CEPR model as described in this paper includes the functionality of the ECLSS pressure control subsystem (PCS), ARS, avionics, and the pressure vessel. Figure 1 shows a schematic of the current CEPR model scope, with connecting arrows indicating the external dependencies and resources supplied for each element. Future work aims to expand the model to include all physics-based interactions of the thermal control system (TCS), power systems, avionics, ARS, PCS, and crew activity cycles, as shown in Figure 2.
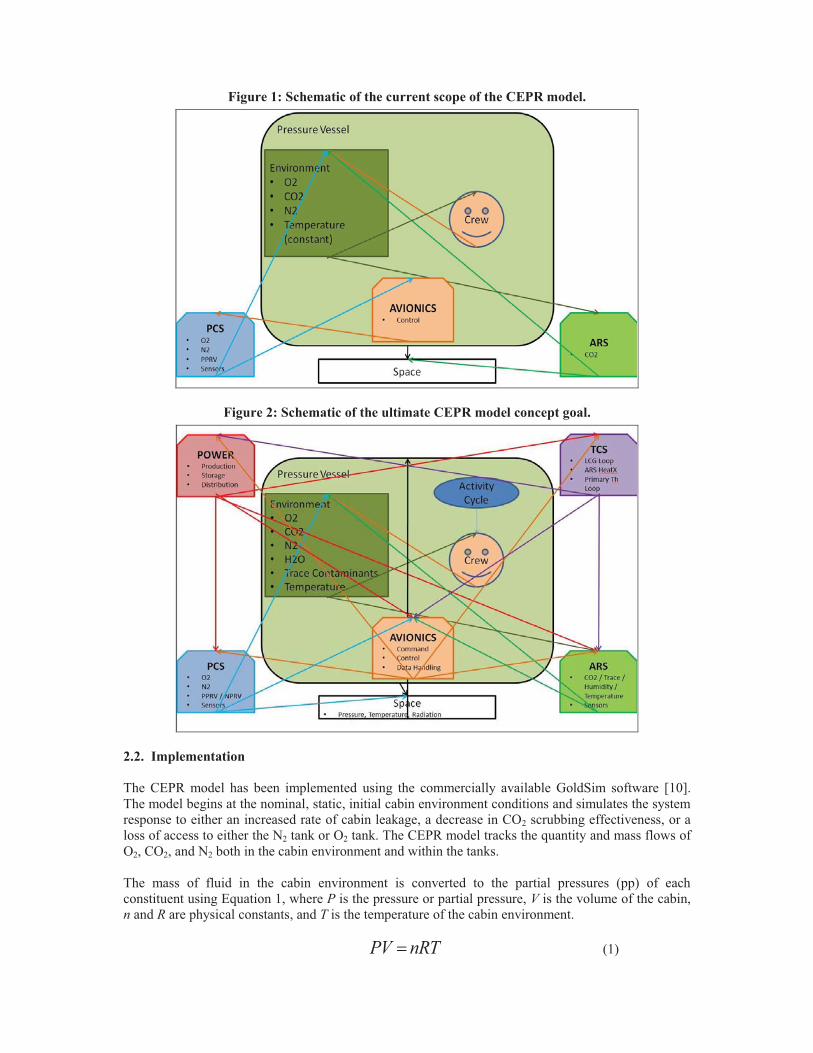
Figure 1: Schematic of the current scope of the CEPR model.
Figure 2: Schematic of the ultimate CEPR model concept goal.
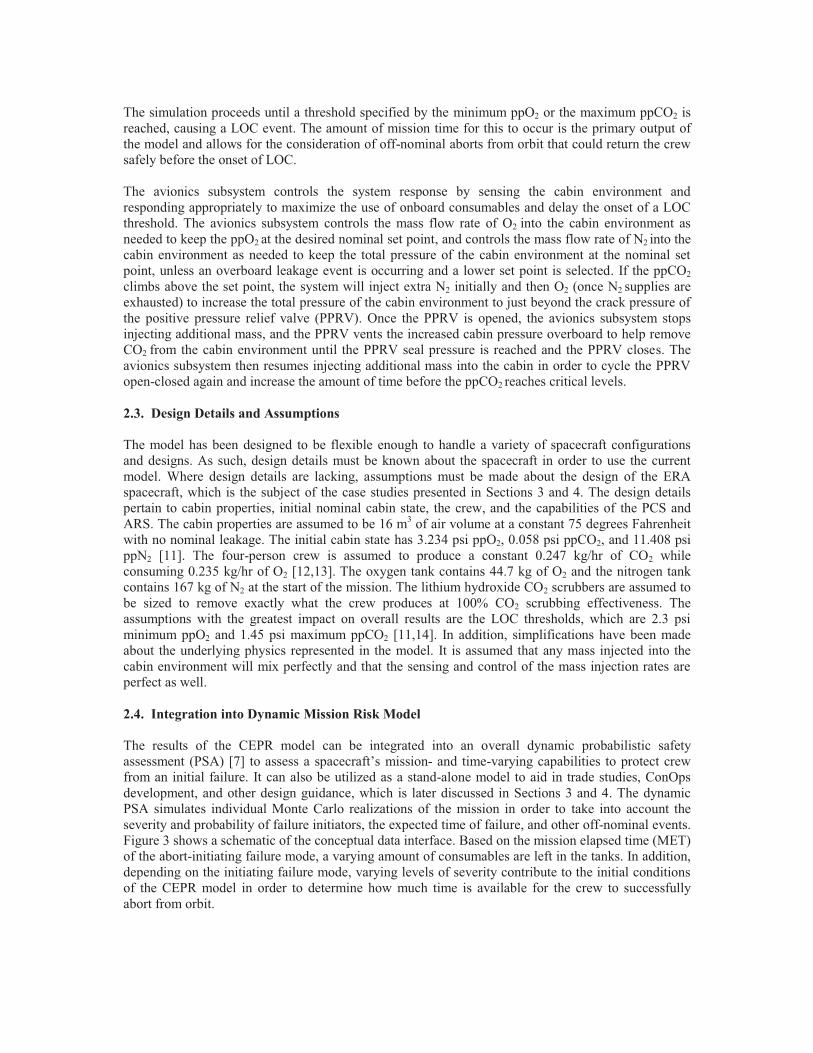
2.2. Implementation The CEPR model has been implemented using the commercially available GoldSim software [10]. The model begins at the nominal, static, initial cabin environment conditions and simulates the system response to either an increased rate of cabin leakage, a decrease in CO2 scrubbing effectiveness, or a loss of access to either the N2 tank or O2 tank. The CEPR model tracks the quantity and mass flows of O2, CO2, and N2 both in the cabin environment and within the tanks. The mass of fluid in the cabin environment is converted to the partial pressures (pp) of each constituent using Equation 1, where P is the pressure or partial pressure, V is the volume of the cabin, n and R are physical constants, and T is the temperature of the cabin environment. PV = nRT (1)
The simulation proceeds until a threshold specified by the minimum ppO2 or the maximum ppCO2 is reached, causing a LOC event. The amount of mission time for this to occur is the primary output of the model and allows for the consideration of off-nominal aborts from orbit that could return the crew safely before the onset of LOC. The avionics subsystem controls the system response by sensing the cabin environment and responding appropriately to maximize the use of onboard consumables and delay the onset of a LOC threshold. The avionics subsystem controls the mass flow rate of O2 into the cabin environment as needed to keep the ppO2 at the desired nominal set point, and controls the mass flow rate of N2 into the cabin environment as needed to keep the total pressure of the cabin environment at the nominal set point, unless an overboard leakage event is occurring and a lower set point is selected. If the ppCO2 climbs above the set point, the system will inject extra N2 initially and then O2 (once N2 supplies are exhausted) to increase the total pressure of the cabin environment to just beyond the crack pressure of the positive pressure relief valve (PPRV). Once the PPRV is opened, the avionics subsystem stops injecting additional mass, and the PPRV vents the increased cabin pressure overboard to help remove CO2 from the cabin environment until the PPRV seal pressure is reached and the PPRV closes. The avionics subsystem then resumes injecting additional mass into the cabin in order to cycle the PPRV open-closed again and increase the amount of time before the ppCO2 reaches critical levels.
2.3. Design Details and Assumptions The model has been designed to be flexible enough to handle a variety of spacecraft configurations and designs. As such, design details must be known about the spacecraft in order to use the current model. Where design details are lacking, assumptions must be made about the design of the ERA spacecraft, which is the subject of the case studies presented in Sections 3 and 4. The design details pertain to cabin properties, initial nominal cabin state, the crew, and the capabilities of the PCS and ARS. The cabin properties are assumed to be 16 m3 of air volume at a constant 75 degrees Fahrenheit with no nominal leakage. The initial cabin state has 3.234 psi ppO2, 0.058 psi ppCO2, and 11.408 psi ppN2 [11]. The four-person crew is assumed to produce a constant 0.247 kg/hr of CO2 while consuming 0.235 kg/hr of O2 [12,13]. The oxygen tank contains 44.7 kg of O2 and the nitrogen tank contains 167 kg of N2 at the start of the mission. The lithium hydroxide CO2 scrubbers are assumed to be sized to remove exactly what the crew produces at 100% CO2 scrubbing effectiveness. The assumptions with the greatest impact on overall results are the LOC thresholds, which are 2.3 psi minimum ppO2 and 1.45 psi maximum ppCO2 [11,14]. In addition, simplifications have been made about the underlying physics represented in the model. It is assumed that any mass injected into the cabin environment will mix perfectly and that the sensing and control of the mass injection rates are perfect as well. 2.4. Integration into Dynamic Mission Risk Model The results of the CEPR model can be integrated into an overall dynamic probabilistic safety assessment (PSA) [7] to assess a spacecraft’s mission- and time-varying capabilities to protect crew from an initial failure. It can also be utilized as a stand-alone model to aid in trade studies, ConOps development, and other design guidance, which is later discussed in Sections 3 and 4. The dynamic PSA simulates individual Monte Carlo realizations of the mission in order to take into account the severity and probability of failure initiators, the expected time of failure, and other off-nominal events. Figure 3 shows a schematic of the conceptual data interface. Based on the mission elapsed time (MET) of the abort-initiating failure mode, a varying amount of consumables are left in the tanks. In addition, depending on the initiating failure mode, varying levels of severity contribute to the initial conditions of the CEPR model in order to determine how much time is available for the crew to successfully abort from orbit.

Figure 3: Conceptual integration interface.
For the current CEPR model, three different time-to-LOC hazard tables have been created to capture the behavior of the system. Table 1 presents an example of one such table. The table indicates that, for example, if a 10 kg/hr cabin leakage were to occur at the very beginning of a Monte Carlo simulation realization, then the ERA spacecraft would need to complete the abort and return the crew safely within 5.88 hours in order to avoid a LOC.
Table 1: Time-to-LOC hazard table for cabin leakage failure modes.
3. SENSITVITY CASE STUDIES To better demonstrate the capabilities of the CEPR model, several sensitivity case studies are presented using the ERA generic spacecraft design. These case studies show how the CEPR model can also be utilized as a stand-alone tool to aid in trade studies and ConOps development.

3.1. Feed-the-Leak Sensitivity To investigate the sensitivity of available abort time to various leakage scenarios, the CEPR model was used to simulate the system response to overboard leakage failures of varying severity. The results enable assessment of the system’s ability to ‘feed-the-leak’ in order to maintain a habitable environment. The leakage rate was varied for each simulation along with the percent of onboard consumables remaining. The time-to-LOC results are shown in Figure 4. For this study, it was assumed that LOC would occur if the ppO2 reached 2.3 psi [11]. In addition, it was assumed that the worst-case return time (i.e., the longest potential abort from orbit) is 4 hours, which is indicated as a dotted red line in Figure 4.
Figure 4: Feed-the-leak sensitivity study results.
The information in this study can be used to inform the intuition of the design team by quantifying the impact of several key cabin environment features. For example, with 0 kg/hr leakage and 0% remaining consumables, the ERA spacecraft is able to return home safely before LOC occurs. Such quantitative evidence could be used to enable the ERA spacecraft PRA to take credit for the cabin environment as an additional leg of redundancy. This could, in turn, impact a design decision to increase redundancy of the PCS. Moreover, such a detailed understanding of the system’s inherent capabilities could be used to enhance the margin and contingency policies for the ERA spacecraft. For example, if a design decision to increase the redundancy of the PPRV is considered, then the leakage rate for a failed-open PPRV can be calculated using the formula for choked flow of a compressible fluid through an orifice [15]. This formula is given in Equation 2, where ṁ is the mass flow rate, C is the coefficient of discharge, A is the area of the hole, � is the specific heat ratio of the gas, � is the density of the cabin air, and P is the pressure of the cabin air.
)1()1(
12 �
�
���
�
��
��
���PCAm� (2)
This equation yields that the expected leakage rate out of a quarter-inch PPRV will be approximately 10 kg/hr. So, a loss of redundancy should not trigger an abort as long as at least 60% of the onboard consumables remain. Moreover, such an analysis indicates redundancy might not even be necessary since 88% of the consumables remain at the end of the nominal mission.

3.2. CO2 Scrubbing Effectiveness Sensitivity To investigate the sensitivity of available abort time to CO2 scrubbing, the CEPR model was used to simulate the system response to varying reductions in CO2 scrubbing effectiveness. The percent scrubbing effectiveness was varied for each simulation along with the percent of onboard consumables remaining. Figure 5 shows the CEPR model’s time-to-LOC results. For this study, it was assumed that LOC would occur if the ppCO2 reached 0.87 psi [13]. In addition, it was conservatively assumed that the worst-case return time for an abort from orbit is 4 hours, which is indicated as a dotted red line in Figure 5.
Figure 5: Loss of CO2 scrubbing effectiveness sensitivity study results.
This study demonstrates the system’s capabilities to “blow” additional mass into the system and trigger the PPRV to “bleed” excess cabin air into space. This blow-and-bleed functionality essentially allows the ERA spacecraft to return the crew safely even after a complete loss of CO2 scrubbing effectiveness, regardless of when the failure occurs, with varying levels of margin. Such knowledge would be extremely important to incorporate into the ERA spacecraft PRA to indicate that a loss of CO2 scrubbing functionality does not lead to LOC. Moreover, such information would have a definite impact on a design decision to increase the redundancy of the lithium hydroxide CO2 scrubbers and would also indicate that loss of lithium hydroxide CO2 scrubber redundancy should not trigger an abort from orbit. 4. RISK-INFORMED DESIGN EXAMPLE Implementing risk-informed design requires the design team to have detailed, quantitative PRA estimates. These risk estimates are important to informing the intuition of the design team regarding the relative impact of various risk-driving components. They are also extremely important to understanding the risk posture of the existing design and potential design enhancements in order to use risk as a metric during trade studies. The ERA spacecraft PRA was performed with the ART, based upon previous efforts [9]. This section presents an examination of the relative risk driver rankings and a potential risk reduction trade study. These risk-informed design examples illustrate how replacing the instant-LOC assumption with the CEPR model impacts both the overall risk driver rankings for the ERA spacecraft and the conclusions of a potential risk-reduction trade study. In this section, the dramatic differences in quantitative results due to the change in assumption will demonstrate that the conservative instant-LOC assumption is driving the risk of ECLSS and, thus, must be refined.

4.1. Relative Risk Drivers The ART-based PRA model of the ERA spacecraft was used to produce a list of spacecraft risk drivers, ranked by contributing subsystem. The ERA spacecraft subsystem risk drivers are shown in Table 2 for cases both with and without the results of the CEPR model included. Without the CEPR model, it is assumed that all ECLSS failures lead immediately to LOC, which causes ECLSS to appear as the #2 LOC risk driver. However, if the results of the feed-the-leak sensitivity study (Section 3.2) are combined with Equation 2 for each potential leak path, then this assumption can be refined and the LOC contribution of ECLSS drops dramatically to the #6 risk driver. This reduction in LOC risk with the CEPR model is due to the refined assumption that the cabin environment protects against LOC in 99% of all cases, as opposed to 0% of cases without the CEPR model results included. This is still conservative, as the CEPR model indicates a 100% protection against LOC for these cases. This remaining 1% of risk is assumed to account for the difficulty of successfully implementing the off-nominal procedures.
Table 2: ERA spacecraft risk drivers.
The dramatic change in relative risk driver ranking indicates that the subsystem LOC risk is being driven by the instant-LOC assumption, which the feed-the-leak sensitivity study indicates is extremely conservative. If an extremely conservative assumption is driving subsystem risk, then it must be refined in order to allow the true risk posture of the system to emerge and enable the design team to properly implement risk-informed design decisions. For example, if the lead designer of the ERA spacecraft wanted to allocate project resources to reduce the risk of LOC, then ECLSS would appear to be a prime candidate if CEPR model results were not included in the analysis. However, with the results of the CEPR model included, it would appear that electrical power or TCS would have a greater potential to improve the vehicle’s overall risk posture. This illustrates how including the CEPR model in the PRA provides more accurate design insights and helps the design team to effectively allocate program resources. 4.2. Risk Reduction Efficiency Trade Study Results In order to properly evaluate the relative benefits of potential design enhancements, the design team must have accurate relative risk estimates. One useful parameter for evaluating competing design enhancements is risk reduction efficiency (RRE), which is defined as the difference in risk between the trade study options divided by the difference in mass between the trade study options [3]. The RRE allows the design team to “get the most bang for their buck” or optimize their design decisions in terms of spending mass to buy down risk.

Table 3 shows the mass impacts of two different trade study design options to potentially buy down LOC risk by adding various components to the vehicle. The EPS – Enhanced option adds a fourth string of power generation capabilities, while the ECLSS – Enhanced option adds a redundant valve in series with every valve that could fail open and trigger an overboard leakage.
Table 3: Trade study option mass summary.
Table 4 shows the subsystem LOC risk estimates for the baseline design and the two enhanced options, computed both with and without the CEPR model assumptions included in the PRA, as discussed in Section 4.1. Without the CEPR model, the ECLSS – Enhanced option yields the higher RRE value and appears to offer a more efficient reduction of LOC risk per unit mass. However, when the results of the CEPR model are included, the EPS – Enhanced option has the higher RRE and provides significantly more risk reduction per unit mass. By incorporating the physics-of-failure for these potential leakage paths, it becomes immediately apparent that adding mass to reduce the risk of LOC from these valves is suboptimal due to the protection afforded by the cabin environment. If the CEPR model were not included in this trade study, then the design team would have used mass for equipment in a suboptimal configuration and would have effectively wasted several orders of magnitude of potential RRE, which instead could have been used to enhance the power system and reduce the overall risk of the vehicle. In this way, the design team would have actually increased the relative risk of LOC to the crew by not considering the physics-of-failure in the CEPR model.
Table 4: Risk reduction efficiency of trade study options with and without CEPR model.
5. CONCLUSION This paper has described the use of the CEPR model to predict the time for an initial ECLSS failure to propagate into a hazardous environment and trigger a LOC. The model allows the risk analyst to replace the assumption that loss of functionality triggers LOC instantly and allows for a more accurate representation of the spacecraft’s risk posture. This assumption has been shown to be excessively conservative, as it greatly overstates the predicted LOC risk. Moreover, it has been shown that this assumption impacts the relative risk drivers of the spacecraft and could lead a design team to allocate mass in a suboptimal configuration, which inherently increases the overall risk to the crew for a given mass allocation. PRA estimates for additional LOC-risk-driving subsystems and components could also greatly benefit from a physics-based analysis of the propagation times between a loss of functionality and a LOC. Such modeling refinements must be undertaken to ensure more accurate relative risk comparisons.

In the near future, risk-informed development of the CEPR model will continue to add system functionality, guided by the preliminary PRA of the ERA spacecraft. Specifically, the TCS will be added to the CEPR model in order to remove excessively conservative assumptions about the time-to-effect of TCS failures in the spacecraft PRA. The power system will be included to better represent cascade failures and spacecraft abort performance during a degraded state. Stochastic initial conditions of the state of the cabin environment when failure occurs will be included to provide more insight into state uncertainty. In addition, failure detection logic and timing will be included to model actual mission operations more closely. Moreover, to better reflect the severity of various leakage failure modes in the dynamic PSA model, physics-based analysis will be undertaken to determine the amount of overboard cabin leakage for various failure modes, including meteoroid and orbital debris penetrations. Acknowledgements The authors would like to acknowledge the support, review, and comments from their fellow Engineering Risk Assessment team members at NASA Ames Research Center, as well as the ERA team’s intern, Samira Motiwala, for her work on the ERA conceptual launch vehicle and spacecraft. References [1] J. Miller, J. Leggett, and J. Kramer-White, “Design Development Test and Evaluation Considerations for Safe and Reliable Human Rated Spacecraft Systems,” NASA, 2008, Hampton, VA. [2] M. Bay, M. Davis, B.F. Putney, “Iterative Risk Driven Design Approach for CEV Avionics Smart Buyer Team Study Results,” 7th National Space Systems Engineering & Risk Management Symposium, 2008, Los Angeles, CA. [3] C. J. Mattenberger, “Vehicle-Wide Optimization of Subsystem Trade Study Option Selection,” Proceedings of Reliability and Maintainability Symposium, 2010, San Jose, CA. [4] C. J. Mattenberger, “Risk-Informed Design Process & Design Team – Analyst Interaction,” Proceedings of the Reliability and Maintainability Symposium, 2010, San Jose, CA. [5] C. J. Mattenberger, “Lunar Landing Operational Risk Model,” Proceedings of Probabilistic Safety Assessment and Management conference, 2010, Seattle, WA. [6] J. R. Fragola, “Supporting Preliminary Design Decision Making with a Risk Data Base,” Proceedings of Probabilistic Safety Assessment and Management conference, 2010, Seattle, WA. [7] S. Go, D. Mathias, S. Lawrence, K. Gee, “An Integrated Reliability and Physics-based Risk Modeling Approach for Assessing Human Spaceflight Systems,” Probabilistic Safety Assessment and Management conference, 2014, Honolulu, HI. [8] S. A. Motiwala and D. L. Mathias, “Conceptual Launch Vehicle and Spacecraft Design for Risk Assessment,” NASA USRP – Internship Final Report, 2013, Moffett Field, CA. [9] B. F. Putney, E. Tavernetti, J.R. Fragola, and E. Gold, “Reliability Tool for a Preliminary Quantified Functional Risk and Hazard Analysis,” Proceedings of the Reliability and Maintainability Symposium, 2009, Fort Worth, TX. [10] www.goldsim.com [11] R. S. Williams, “NASA Spaceflight Human-System Standard, Volume 2,” NASA, STD-3001 Volume 2, 2011, Washington, DC. [12] J. Voss, “Human Spaceflight Course Notes,” Teaching Science and Technology Inc., 2010, Manitou Springs, CO. [13] W. J. Larson, L.K. Pranke, “Human Spaceflight: Mission Analysis and Design,” McGraw-Hill Companies, Inc., 1999, New York, NY. [14] “Spacecraft Maximum Allowable Concentration for Airbone Contaminants,” NASA, JSC 20584, 1999, Houston, TX. [15] B. J. Cantwell, “Fundamentals of Compressible Flow,” Stanford Bookstore Custom Publishing, 2005, Stanford, CA.