cable-telco-wireless competition in floridawarrington.ufl.edu/centers/purc/purcdocs/... ·...
TRANSCRIPT
William E. TaylorSenior Vice President
35th Annual PURC ConferenceFebruary 5-6, 2008
Cable-Telco-Wireless Competition In Florida:Facts and Consequences
T

1
Intermodal Competition and Telecommunications Deregulation
Overview
§ Updated state of competition in Florida (2006):
– Wireline carriers
– Intermodal carriersó Cableó Wirelessó VoIP
§ Effects on regulation– Parity across platforms
– Universal service
– Wholesale regulation
July 2006
Intermodal Competition in Florida Telecommunications Prepared for: BellSouth Telecommunications, Inc., Embarq Florida, Inc., Verizon Florida Inc., and Windstream Communications Florida, Inc.
By
William E. Taylor Senior Vice President
Harold Ware Vice President
Joel M. David Senior Analyst
http://www.psc.state.fl.us/library/filings/06/06521-06/nera%20fl%20white%20paper.doc

Intermodal Telecommunications Competition in Florida
2007
3
Intermodal Telecommunications Competition in Florida
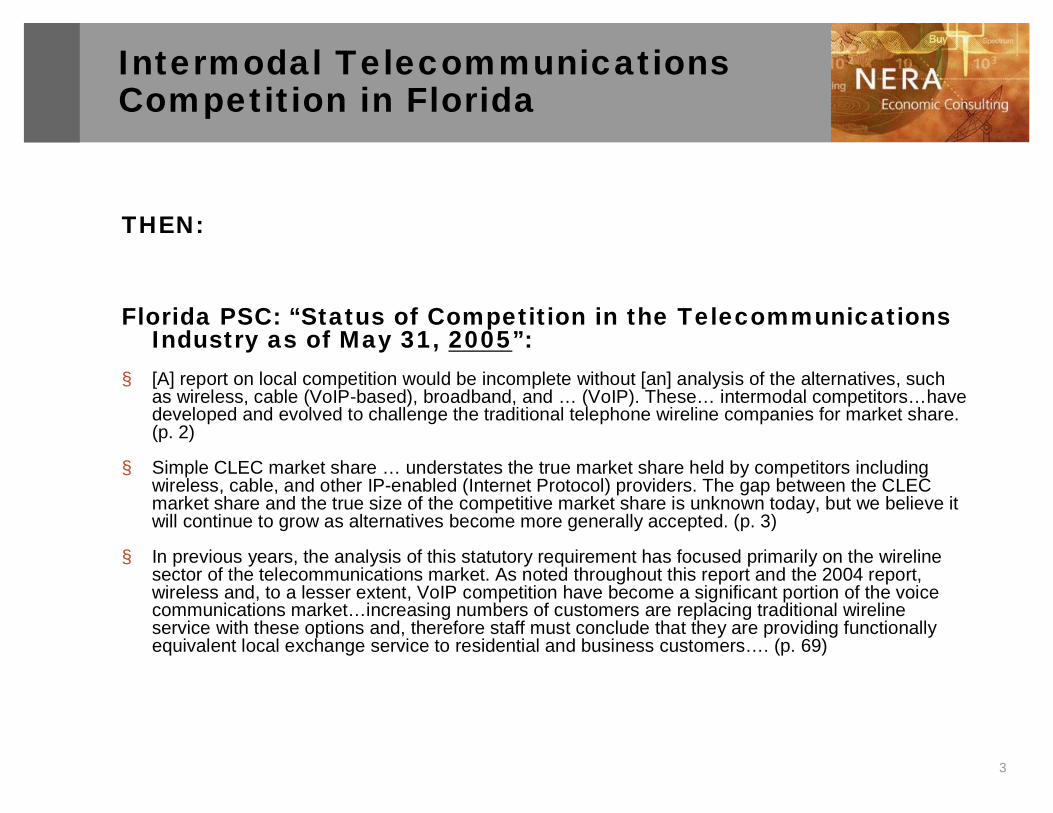
THEN:
Florida PSC: “Status of Competition in the Telecommunications Industry as of May 31, 2005”:
§ [A] report on local competition would be incomplete without [an] analysis of the alternatives, such as wireless, cable (VoIP-based), broadband, and … (VoIP). These… intermodal competitors…have developed and evolved to challenge the traditional telephone wireline companies for market share. (p. 2)
§ Simple CLEC market share … understates the true market share held by competitors includingwireless, cable, and other IP-enabled (Internet Protocol) providers. The gap between the CLEC market share and the true size of the competitive market share is unknown today, but we believe it will continue to grow as alternatives become more generally accepted. (p. 3)
§ In previous years, the analysis of this statutory requirement has focused primarily on the wireline sector of the telecommunications market. As noted throughout this report and the 2004 report, wireless and, to a lesser extent, VoIP competition have become a significant portion of the voice communications market…increasing numbers of customers are replacing traditional wireline service with these options and, therefore staff must conclude that they are providing functionally equivalent local exchange service to residential and business customers…. (p. 69)

4
Telecommunications Competition in Florida
NOW:
Florida PSC: “Status of Competition in the Telecommunications Industry as of May 31, 2006” (pp. 2-3)
§ Wireless, VoIP, and broadband services are fulfilling the expectations of competition and represent a significant portion of today’s communications market in Florida….
– Wireless…– VoIP…– Broadband…
§ Florida’s communications market continues to evolve as new technologies and services become more widely accepted. Estimates of wireless substitution for wireline service have increased from prior years, and this trend is expected to continue in the near future. In the most recent reporting period, Florida cable companies expanded the number of markets in which they offer voice services, and it is expected that even more Florida markets will have access to cable-provided voice offerings in the coming year. Finally, Vonage, a nationally known VoIP provider, has reported a substantial number of Florida subscribers at the present time. These facts, coupled with continued residential access line losses by ILECs, suggest an active market for voice communications services in many areas of Florida.

5
Wireline Subscription
§ Year-end 2000: about 3.4 million more mass market (residence and small business) wireline access lines than total wireless subscribers and mass market high-speed broadband lines.
§ Year-end 2002: about 1.3 million fewer mass market wireline lines than total wireless subscribers and mass market broadband lines.
§ Year-end 2006: about 12 million fewer ILEC and CLEC mass market lines combined than total wireless and mass market broadband lines.
§ Trending residential access lines using the historical relationship with population suggests a more rapid reduction in wirelines.
0
2,000,000
4,000,000
6,000,000
8,000,000
10,000,000
12,000,000
14,000,000
16,000,000
18,000,000
20,000,000
12/31/2000 12/31/2001 12/31/2002 12/31/2003 12/31/2004 12/31/2005 12/31/2006
Num
ber
of L
ines
or
Subs
crib
ers
CLECsILECsWireless SubscribersWireless plus Residential (Small Business) Broadband
Note: Due to differences in reporting, 2005-2006 data are not comparable to previous.Source: FCC December 2000-December 2006 Local Competition and High-Speed Internet Reports.
-
2,000,000
4,000,000
6,000,000
8,000,000
10,000,000
12,000,000
1991 1992 1993 1994 1995 1996 1997 1998 1999 2000 2001 2002 2003 2004 2005 2006
Res
iden
tial S
witc
hed
Acc
ess
Lin
es
Actual Lines
Predicted Lines
3.3 million lines

6
Wireline Usage
§ A dramatic decline in expected wireline usage in Florida based on historical relationships with population.
§ A similar dramatic reduction in Florida wireline long distance usage, as measured by the average annual changes in switched access minutes 1995-2000 compared with 2000-2006.
5.9% 6.6%
13.0%
7.8% 7.2%
-4.2% -3.9%
-5.6%-6.8%
2.1%
-10.0%
-5.0%
0.0%
5.0%
10.0%
15.0%
BellSouth Verizon Embarq Windstream Total of 4 Carriers
Ann
ual C
hang
e in
Acc
ess M
inut
es
1995-2000 2000-2006
Source: FCC, National Exchange Carrier Association, Network Usage Data.
-
5,000,000
10,000,000
15,000,000
20,000,000
25,000,000
30,000,000
35,000,000
40,000,000
45,000,000
50,000,000
1991 1992 1993 1994 1995 1996 1997 1998 1999 2000 2001 2002 2003 2004 2005 2006
Ann
ual L
ocal
Cal
ls (T
hous
ands
)
Actual Local CallsPredicted Local Calls
27 billion calls

7
Cable Telephony
§ Cable telephony is widely available across Florida.
– Cable passes 95% of households
– Cable penetration is 78% of homes passed
– Broadband deployed to 98% of homes passed
– Telephony enabled to 63% of homes passed.
§ A substitute for basic telephone service?
Company TotalBroadband
ReadyTelephony
ReadyBroadband
ReadyTelephony
Ready
Comcast 3,392,721 3,304,487 1,203,565 97.4% 35.5%Bright House 2,024,048 2,024,048 2,005,903 100.0% 99.1%Knology 334,379 334,379 334,379 100.0% 100.0%Cox 332,308 332,308 332,308 100.0% 100.0%Atlantic Broadband 54,748 54,748 - 100.0% 0.0%Advanced Cable 44,255 44,255 44,255 100.0% 100.0%Mediacom 28,158 28,158 25,472 100.0% 90.5%Other 40,909 27,335 - 66.8% 0.0%Total 5,917,147 5,815,339 3,611,503 98.3% 61.0%
Note: Because Knology is an overbuild operation, Knology homes are subtracted from the totals shown. As a result, totals include the primary provider only and may thus understate the services available.
Table 3Advanced Cable Services Are Widely Available in Florida
Homes Passed Percent of Homes Passed
Comcast includes the former Adelphia and Time Warner systems in Florida.Source: Warren Communications News, Cable Fact Book, GIS Format.
First Half of 2005
Oct. 2005 - Mar. 2006
MSA Group 1 over 1,000 1.4% 4.7%MSA Group 2 500-1,000 0.8% 3.9%MSA Group 3 Less than 500 2.5% 4.4%Non-MSA Area 0.4% 3.7%Statewide 1.6% 4.4%
Source: Cable share: TNS Telecoms ReQuest® Consumer Survey.
Cable Telephony Share of Households
AreaPopulation Density (persons/sq. mile)
Table 5Cable Telephony Share of Households

8
Cable Telephony
§ National penetration rates for cable telephony.
– Data presented in chronological order of deployment (from top to bottom)
– Penetration increases significantly with time.
§ Cable telephony availability is forecasted to increase dramatically.
9.1%
11.6%
4.9%
5.0%
8.0%
11.1%
19.4%
20.8%
21.6%
0.0% 5.0% 10.0% 15.0% 20.0% 25.0%
Mediacom
Insight
Charter
Comcast
Time Warner
Bright House
Cablevision
Knology
Cox
Source: VoIP Deployment & Strategies Update: Cable Operators , Broadband Advisory Services, Pike & Fischer, July 2006, p. 3; Bright House Networks Press Release, More than 225,000 Florida Families Switch to Bright House Networks Digital Phone: Now Announcing a Florida Unlimited Calling Plan , May 2, 2006 and Table 1; Knology Inc, SEC, Form 10-Q, March 31, 2006, p. 12.
-
20
40
60
80
100
120
140
2002A 2003A 2004A 2005A 2006E 2007E 2008E 2009E 2010E
Cab
le T
eleph
ony
Hom
es P
asse
d (M
illio
ns)
0%
10%
20%
30%
40%
50%
60%
70%
80%
90%
100% Cable T
elephony Hom
es Passed as % of A
ll U.S. H
omes
Circuit Switched Homes Passed
VoIP Homes Passed
Cable Telephony Homes Passedas % of All U.S. Homes
Source: J. Halpern, et al., Bernstein Research, Quarterly VoIP Monitor: VoIP Growth Still Accelerating , April 18, 2006, Exhibit 12.

9
Cable Telephony
§ Cable telephony penetration is forecast to grow rapidly
§ But from a small base as a proportion of addressable households. Room for expansion.
-
5
10
15
20
25
2002A 2003A 2004A 2005A 2006E 2007E 2008E 2009E 2010ESu
bscr
iber
s (M
illio
ns)
0.0%
2.0%
4.0%
6.0%
8.0%
10.0%
12.0%
14.0%
16.0%
18.0%
20.0%
Share of U.S. H
ouseholds
Cable Telephony SubscribersShare of U.S. Households
Source: J. Halpern, et al. ,Bernstein Research, Quarterly VoIP Monitor: VoIP Growth Still Accelerating , April 18, 2006, Exhibit 13.
10
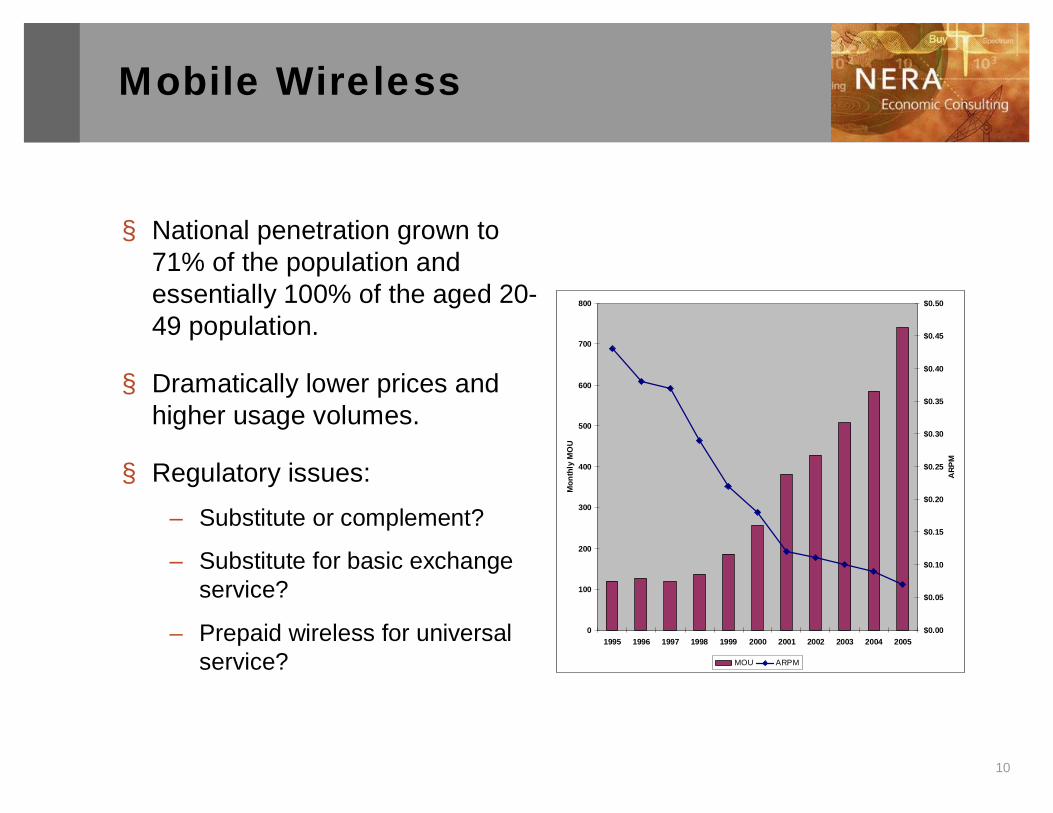
Mobile Wireless
§ National penetration grown to 71% of the population and essentially 100% of the aged 20-49 population.
§ Dramatically lower prices and higher usage volumes.
§ Regulatory issues:– Substitute or complement?
– Substitute for basic exchange service?
– Prepaid wireless for universal service?
0
100
200
300
400
500
600
700
800
1995 1996 1997 1998 1999 2000 2001 2002 2003 2004 2005
Mon
thly
MO
U
$0.00
$0.05
$0.10
$0.15
$0.20
$0.25
$0.30
$0.35
$0.40
$0.45
$0.50
ARP
M
MOU ARPM

11
Mobile Wireless
§ Florida subscription growing rapidly.
§ In December 2006, wireless penetration in Florida exceeded 80%
§ Growth has occurred throughout Florida economic areas.
0.0%
10.0%
20.0%
30.0%
40.0%
50.0%
60.0%
70.0%
80.0%
90.0%
100.0%
Fort Myers-Cape Coral,
FL
Pensacola,FL
Jacksonville,FL-GA
Orlando, FL Miami-FortLauderdale,
FL
Tampa-St.Petersburg-Clearwater,
FL
Sarasota-Bradenton,
FL
Tallahassee,FL-GA
Pene
trat
ion
Rat
e
2001 2002 2003 2004 2005
Source: Seventh-Eleventh CMRS Reports .
-
2
4
6
8
10
12
14
16
2000 2001 2002 2003 2004 2005 2006
Mill
ions
Wir
eles
s Sub
scri
bers
(Mill
ions
)
0
0.1
0.2
0.3
0.4
0.5
0.6
0.7
0.8
0.9
Wir
eles
s Pen
etra
tion
(% o
f Pop
ulat
ion)
Subscribers
Penetration
Source: FCC December 2006 Local Competition Report, Table 14 and Florida PSC 2006 Competition Report , Figure 17.

12
Mobile Wireless
§ Wireless calls have displaced wireline minutes of use in Florida.
2000
2200
2400
2600
2800
3000
3200
3400
3600
3800
1999 2000 2001 2002 2003 2004 2005 2006
Loca
l Cal
ls p
er L
ine
450
460
470
480
490
500
510
520
530
540
Toll
Cal
ls p
er L
ine
Local Calls/ Line (Left Y-Axis) Toll Calls/ Line (Right Y-Axis)
Source: ARMIS 43-08.
0
5,000
10,000
15,000
20,000
25,000
30,000
35,000
40,000
45,000
2000 2001 2002 2003 2004 2005 2006
Wir
elin
e M
inut
es o
f Use
(Mill
ions
)
-
2
4
6
8
10
12
14
16
Wir
eles
s Su
bscr
iber
s (M
illio
ns)
Wireline Minutes Wireless Subscribers
Note: Minutes of use are interstate switched access minutes for Florida ILECs.Source: FCC, National Exchange Carrier Association, Quarterly Minutes of Use Data; FCC December 2006 Local Competition Report, Table 13.

13
Broadband and VoIP
§ Every zip code in Florida has 2 or more broadband providers.
§ 96 percent of zip codes have 4 or more providers.

14
Broadband and VoIP
§ Internet penetration stable (71-73%) but dramatic shift from dial-up to broadband
§ Broadband penetrationexceeds 50% of Florida households in 2Q2006
§ Florida broadband availability, December 2006:
– 89% DSL availability (79% national)
– 97% cable modem availability (96% national)
Florida Broadband Penetration
0%
10%
20%
30%
40%
50%
60%
1Q20032Q2003
3Q20034Q2003
1Q20042Q2004
3Q20044Q2004
1Q20052Q2005
3Q20054Q2005
1Q20062Q2006
Source: Florida PSC 2006 Competition Report, Figures 25-26

15
Broadband and VoIP
§ FCC broadband lines show dramatic growth in Florida.
§ WI-FI access widely available in Florida
§ WiMAX: Clearwire in Daytona, Jacksonville. 88,000 US subscribers, March 2006.
Florida High-Speed Line s
-
1,000,000
2,000,000
3,000,000
4,000,000
5,000,000
6,000,000
12/31
/1999
6/30/20
00
12/31
/2000
6/30/20
01
12/31
/2001
6/30/20
02
12/31
/2002
6/30/20
03
12/31
/2003
6/30/2
004
12/30
/2004
6/30/2
005
12/31
/2005
6/30/2
006
12/31
/2006
Num
ber
of h
igh-
spee
d lin
es Residential & Small Business
Total
Note: Data on residential & small business not available until 12/31/00 and is residential only at 6/30/05.Source: FCC June 2000-December 2006 High-Speed Internet Reports.
2,642
937
1,927
385
-
500
1,000
1,500
2,000
2,500
3,000
2003 2004 2005 2006
Note: 2006 figure as of June.Source: JiWire Hotspot Directory, available at www.jiwire.com.

16
Broadband and VoIP
§ Rapid national growth in independent VoIP subscribers.
§ VoIP suppliers have local area codes throughout Florida.
§ Package prices competitive with wireline / wireless packages.

Consequences for Regulation

18
Regulatory Parity Across Platforms
§ Regulatory parity particularly critical here:– where markets are characterized by rapid technological change
and competing platforms or technologies are subject to lock-in or path dependence.
§ Such regulation is not a simple squabble over rents --does not merely transfer welfare among carriers -- but inevitably affects consumers’ technology choices,
– which can have large and irreversible welfare effects on consumers, reducing economic efficiency and productivity by distorting the competitive market outcome and driving the marketto an inefficient platform or technology.

19
Regulatory Parity Across Platforms
§ How can parity be achieved when regulatory jurisdiction differs across wireline, cable, wireless and broadband?
– Removal of ex ante regulation of prices, wholesale unbundling, terms and conditions, quality of service, reporting requirements
– Substitution of ex post reliance on antitrust, competition law, consumer protection law, possibly adjudicated by the regulatory commission.

20
Universal Service with Intermodal Carriers
§ Targeted subsidies that are platform-neutral.
§ For low-income, low-usage customers, prepaid wireless service substitutes for prepaid wireline service (payphones).
– Prepaid wireless accounted for roughly 11 percent of U.S. subscribers at the end of 2005, versus 9.5 percent at the end of 2004 and 8.1percent at the end of 2003.
– 27 percent of the net subscriber adds in the fourth quarter of 2005 were prepaid customers.
Florida Payphones & Wireless Subs
-
20,000
40,000
60,000
80,000
100,000
120,000
140,000
1999 2000 2001 2002 2003 2004 2005 2006
Payp
hone
s-
2
4
6
8
10
12
14
16
Mill
ions
Wire
less
Sub
scrib
ers
Payphone Wireless
Source: FCC Trends in Telephone Service

21
Regulation of Wholesale Services
Intermodal competition affects regulation.
§ Assumption of a single vertically-integrated ILEC network with dependent competitors drove regulatory structure
– Long-distance carriers [1978 – 1996]
– CLECs [1996 -]
– Led to economic regulation of both retail and wholesale services.
§ In theory, such dual regulation (wholesale and retail) is perilous.
§ In practice, with intermodal competition, deregulation of wholesale services must be considered.

22
Regulation of Wholesale Services
§ Long experience in regulating and deregulating retail markets.– Cost-of-service replaced by price regulation replaced by pricing flexibility
or deregulation where warranted.
– General agreement on market power as trigger. General disagreement on everything else.
§ Less experience, but long-time economic regulation of wholesale services in the U.S.
– Carrier access services since 1984
– Wholesale local exchange services (UNEs / resale) since 1996.
– Little thought regarding regulation or deregulation of wholesale services.
– Understanding the relationship between retail and wholesale services and regulation is now necessary, due in part to intermodal competition.

23
Regulation of Wholesale Services
§ In economics, benefits from wholesale regulation are different:
– welfare effects are measured in the market for final goods.
– If wholesale regulation has no effect downstream, it has no benefits for consumers.
§ Costs of wholesale regulation are more complex:– Induces distortions in retail markets because some platforms are
regulated and others are not.
– Incentive effects are important because network investment is sunk and irreversible.

24
Regulation of Wholesale Services
Essential Facilities§ Assume the retail market is
competitive.– Assume all competitors are
dependent on ILEC facilities.– The ILEC has the ability to exercise
market power in the wholesale market.ó Increase in the wholesale price
passed through by all carriersó Hence extraction of additional profit
from wholesale monopoly requires effective market power downstream.
§ Not unreasonable to regulate wholesale services when they meet the conditions for an essential facility.
– May be more efficient methods than ex ante regulation.
ILEC
CLEC 1 CLEC 2 CLEC 3 CLEC 4
ILEC
CLEC 1 CLEC 2 CLEC 3 CLEC 4
Retail Telecommunications Services

25
Regulation of Wholesale Services
ILEC
CLEC 1 CLEC 2
ILEC
CLEC 1 CLEC 2
Wireless Cable VoIP
Retail Telecommunications Services
Intermodal Competition
§ The retail market is competitive and would be absent the dependent CLECs.
§ Even though the ILEC is (assumed to be) a monopoly supplier of the wholesale service, it possesses no market power.
– Has no ability to extract supracompetitive profits from dependent CLECs
– Has no incentive or ability to price wholesale services at an anticompetitive level (entailing a margin squeeze).

26
Consequences of Intermodal Competition for Telecommunications Regulation
Conclusions
§ Ex ante economic regulation of both wholesale and retail services is generally unwarranted, inconsistent and rife with inefficient, unintended consequences.
– Particularly, if retail market is effectively competitive
– Platform parity possible using ex post regulation through the legal system.
§ Ex ante regulation of wholesale services is best confined to essential facilities. BUT:
– We frequently don’t know if a facility is essential at competitive market prices.
– Efficiency consequences of regulating some platforms but not others recalls the debacle of surface transport regulation: truck / rail / barge.
– Ex post regulation through competition law avoids these costs.