cache.pressmailing.net · interim report as of september 30, 2011 klÖckner & co group figures...
TRANSCRIPT

Interim Report as of September 30, 2011
Klöckner & Co SE
A Leading Multi Metal Distributor
INTERIM REPORT AS OF SEPTEMBER 30, 2011 KLÖCKNER & CO GROUP FIGURES 2
GROUP INTERIM MANAGEMENT REPORT 3
KLÖCKNER & CO SHARE 11
CONSOLIDATED STATEMENT OF INCOME FOR THE NINE-MONTH PERIOD ENDING SEPTEMBER 30, 2011 13
STATEMENT OF COMPREHENSIVE INCOME FOR THE NINE-MONTH PERIOD ENDING SEPTEMBER 30, 2011 14
CONSOLIDATED STATEMENT OF FINANCIAL POSITION AS OF SEPTEMBER 30, 2011 15
CONSOLIDATED STATEMENT OF CASH FLOWS FOR THE NINE-MONTH PERIOD ENDING SEPTEMBER 30, 2011 17
SUMMARY OF CHANGES IN EQUITY 18
SELECTED EXPLANATORY NOTES TO THE INTERIM CONSOLIDATED FINANCIAL STATEMENTS OF KLÖCKNER & CO SE FOR THE NINE-MONTH PERIOD ENDING SEPTEMBER 30, 2011 19

KLÖCKNER & CO SE Klöckner & Co Group Figures
Income statement Q3 2011 Q3 2010
Jan. 1 - Sep. 30,
2011
Jan. 1 - Sep. 30,
2010
Sales € million 1,885 1,401 5,357 3,866
Earnings before interest, taxes, depreciation and amortization (EBITDA) € million 37 61 203 190
Earnings before interest and taxes (EBIT) € million 8 39 129 127
Earnings before taxes (EBT) € million – 15 22 66 79
Net income € million – 12 15 38 63
Net income attributable to shareholders of Klöckner & Co SE € million – 11 14 38 61
Earnings per share (basic) € – 0.11 0.21 0.47 0.92
Earnings per share (diluted) € – 0.11 0.21 0.47 0.92
Cash flow statement
Jan. 1 - Sep. 30,
2011
Jan. 1 - Sep. 30,
2010
Cash flow from operating activities € million – 148 – 82
Cash flow from investing activities € million – 466 – 148
Balance sheet September
30, 2011 December
31, 2010
Net working capital*) € million 1,692 1,017
Net financial debt € million 580 137
Equity € million 1,847 1,290
Balance sheet total € million 4,950 3,491
Key figures Q3 2011 Q3 2010
Jan. 1 - Sep. 30,
2011
Jan. 1 - Sep. 30,
2010
Sales volumes Tto 1,765 1,368 5,026 3,996
September
30, 2011 December
31, 2010
Employees at end of period 11,577 9,699
*) Net working capital = Inventories plus trade receivables minus trade payables

3 3 Group interim management report
3 Key figures of the first nine months of
2011
5 Economic environment
6 Results of operations, financial position
and net assets
9 Subsequent events
9 Risk and opportunity management
10 Outlook
Group Interim Management Report
Sales volumes, sales and operating income (EBITDA) increased predominantly supported by acquisitions. Earnings development affected by increasing market uncertainty and economic slowdown.
Sales volumes increased by more than 25% and sales by 38% mainly thanks to the Macsteel and Frefer acquisitions and have already exceeded total sales for 2010. Similarly, operating income (EBITDA) for the first nine months, at €203 million, was up on the prior year, although the earnings dynamics gradually lost momentum. After €104 million in the first and €62 million in the second quarter, operating income (EBITDA) fell in the third quarter of the current year to €37 million. The drop in operating income partly reflected the customary seasonal softening of demand in the summer months, but partly also the economic slowdown that meant doing without the usual end-of-summer recovery. In addition, producers generally failed in their attempts to stabilize prices and this put a squeeze on margins. Customers were accordingly more cautious whereby margins came increasingly under pressure.
Key figures for the first nine months of 2011 in comparison with the prior-year period: • Supported by the acquisitions, sales volumes increased by 25.8% to 5.0 million tons (Q3: 1.8 million tons
compared with 1.4 million tons in the third quarter of 2010)
• As a result of additional price effects, sales rose by 38.6% to some €5.4 billion (Q3: €1.9 billion compared with €1.4 billion in Q3 2010)
• Gross profit increased by 17,1% to €1.008 million (Q3: €318 million compared with €294 million in the third quarter of 2010), although the gross profit margin fell from 22.3% to 18.8%
• Operating income (EBITDA) increased from €190 million to €203 million; however, third-quarter EBITDA, at €37 million, was significantly down on the prior-year figure of €61 million
• Net income down from €63 million to €38 million, largely due to higher depreciation and amortization as a result of acquisitions, higher financing charges and higher taxes (Q3: €– 12 million, compared with €15 million in Q3 2010)
• Earnings per share down from €0.92 to €0.47
• Sound financial position with 37% equity ratio and net financial debt of €580 million
• Successful rights issue with net proceeds of €516 million
After the promising start to the fiscal year, landmark developments in the first nine months at Klöckner & Co – aside from the steady decline in earnings– were the two acquisitions and a successful rights issue.
Profitability action program After signs of the economic slowdown increased over the course of the third quarter, we immediately initiated a comprehensive action plan. Alongside cuts in administration costs and overheads, the plan centers on structural changes in the country organizations, including the discontinuation of insufficiently profitable business activities. We expect that the plan will deliver an annual improvement to operating income in the mid double-digit millions of euros. The total one-off charges required to achieve this is expected to be in the low double-digit millions of euros and will be financed in full by disposal proceeds. While potentially discontinuing business activities, we are holding to our “Klöckner & Co 2020” growth strategy.
4 3 Group interim management report
3 Key figures of the first nine months of
2011
5 Economic environment
6 Results of operations, financial position
and net assets
9 Subsequent events
9 Risk and opportunity management
10 Outlook
Growth strategy sustained We continued to press ahead with the implementation of our “Klöckner & Co 2020” strategy in the first half of the year with the acquisitions of Macsteel Service Centers USA (“MSCUSA”) and Frefer, Brazil. With a workforce of some 1,200 at 30 locations and sales of around USD 1.3 billion (about €1.0 billion) in 2010, MSCUSA is one of the leading flat steel service center companies in the USA. The acquisition, completed at the end of April, is doubling Klöckner & Co’s sales and number of locations in North America. It adds flat products to a range previously focused on long products and heavy plate. Klöckner & Co is now among the market leaders in all three product segments in the USA and has moved up to become the third largest steel and metal distributor in North America. With 30% of sales, the US country organization is consequently now the largest in the Group.
At the end of May, we also completed the acquisition of a 70% interest in the Frefer group, Brazil. With approximately 360 employees at 14 locations, the group generated sales of some BRL 340 million (about €150 million) in 2010. This represents yet another milestone in the implementation of the “Klöckner & Co 2020” strategy and marks our entry into the emerging economies of South America to share in the accelerated growth of their markets.
In accordance with internal lines of responsibility and management reporting structures, the activities of MSCUSA and Frefer were assigned to the former "North America" segment, which was renamed the "Americas" segment with effect from the second quarter.
In June, after concluding both acquisitions, we raised capital through a rights issue in which 33.25 million shares were issued at a subscription price of €15.85. The subscription ratio exceeded 99.6%. In line with our “Klöckner & Co 2020” strategy, we are planning to use the €516 million net proceeds predominantly for acquisitions.
Addition to the Management Board At its meeting of September 20, 2011, the Supervisory Board of Klöckner & Co SE appointed William A. (Bill) Partalis effective October 1, 2011 as an additional member of the Management Board responsible for the Americas segment. The Americas segment will therefore once again be managed by a Management Board member representing it. Bill Partalis also continues to be in charge of operating activities as CEO at our US subsidiaries.
Outlook For fiscal 2011, despite softening demand, we continue to anticipate year-on-year growth of over 25% in sales volumes and more than 35% in sales, largely thanks to the contributions made by the acquisitions. Given the weak demand trend and the sustained price pressure, we project that fourth-quarter operating income (EBITDA) will be down on the third quarter. Restructuring costs in the low double-digit millions of euros will in addition negatively influence income.
For 2012, we are currently expecting rising demand for steel in North and South America and at best stable demand for steel in Europe, with risks due to the sovereign debt crisis in the euro zone remaining extremely high.
5 3 Group interim management report
3 Key figures of the first nine months of
2011
5 Economic environment
6 Results of operations, financial position
and net assets
9 Subsequent events
9 Risk and opportunity management
10 Outlook
Economic environment: Economic expectations further lowering After a strong first quarter to the economic year, expectations for the economy have since then steadily worsened. Leading economic research institutes have strongly adjusted their estimates downward on multiple occasions as the year progressed. Global economic growth retains its positive underlying momentum, but the increasingly severe debt crisis in the USA and Europe and attendant uncertainty are contributing to a growth slowdown, especially in Western industrialized nations. According to the International Monetary Fund (IMF), the global economy has entered a dangerous new phase. The IMF has revised its growth estimate downward twice in a row since its spring estimate. This uncertainty is mirrored worldwide in exceptionally volatile financial markets.
The IMF expects 4.0% global GDP growth for 2011 and 2012, down from 5.1% in 2010. Its forecast continues to be based around a two-speed recovery. By IMF estimates, emerging economies will put in GDP growth of 6.4% in 2011, while mature markets are anticipated to grow by only 1.6%. Further rating downgrades threatening European states and lack of confidence in the stabilization measures adopted so far may yet trigger further downward adjustments to the projections.
After first-quarter GDP growth in the USA was marked down to only 0.4%, the second quarter showed an improvement of 1.3%. The slight positive trend held up with 2.5% growth in the third quarter. Key drivers were a powerful rise in private consumption combined with capital spending that firms were obviously now carrying out after postponing such plans in the first half. Despite this catching-up, aggregate estimates project growth of only 2.0% for the final quarter. The IMF reflected these expectations in its most recent September estimate, revising the 2011 full-year growth projection for the USA down to just 1.5%. The IMF also sharply marked down its estimate for 2012, when it now expects growth of 1.8%. The OECD takes a similar view of developments, projecting growth of 1.7% for 2011 and 1.8% for 2012.
For the euro zone, the IMF anticipates growth of 1.6% in the current year and 1.1% in 2012. This estimate was also revised downward compared with the June projection, although the 0.4 percentage point adjustment is not as severe as that applied to US growth. After a steep downward revision in its most recent estimate as of the end of October, the OECD likewise expects the euro zone economy to grow by 1.6% in 2011, but only 0.3% in 2012. A loss in momentum is anticipated notably in Germany and France due to heavy reliance on exports. On aggregate estimates, the euro zone economy gained 1.4% in the third quarter, down from 1.6% in the second. Industry order intake has visibly slowed. Other early indicators such as the ZEW and the ifo index similarly point to a rapid cooling-off of business sentiment. A further growth slowdown is consequently expected for the final quarter.
The uncertainties also show through in downward adjustments to sectoral expectations. While European mechanical engineering grew by 6.1% according to Eurofer statistics in the third quarter, the growth rate is distinctly leveling off compared with average growth of 13.9% in the first half. The industry association accordingly projects only 3.8% growth for the fourth quarter. Eurofer projects 9.2% growth for the sector over the year as a whole. Although order books are still strong and stretch to the first quarter of 2012, the main country-level associations expect negative impacts from a possible destabilization of the currency union. A loss in momentum is also anticipated in the USA, although not to the same extent as in Europe.
Eurofer forecasts growth of 10.3% for the European automotive industry in 2011 as a whole, mostly driven by high rates of increase in the first two quarters. European automotive production remains close to capacity, primarily on the back of strong exports. The commercial vehicle segment, however, is already showing initial decreases. Eurofer projects that growth in the European automotive market will be down to 3.9% in the fourth quarter, compared with 7.5% in the third. The US automotive sector once again recorded higher sales volumes in the third quarter as the situation in Japan returned to normal. Whether this trend can be sustained is questionable, however. According to estimates, the growth rate will slow back down as a result of decreasing consumer demand.
On Eurofer projections, the European construction industry shows growth of 2.4% for the year as a whole, mainly driven by the strong first quarter. Growth in the third quarter, in contrast, is expected to come to a near-standstill, at 0.1%. Stimulus came from new contracts and an increase in residential modernization activity in Germany and France. However, this was not enough to make up for the negative trends in construction in Southern European countries. The European construction confidence index fell in September to its lowest level since December 2010, implying that no recovery can be expected in the short term. Eurofer projects growth of 1.5% in Europe for the fourth quarter.
6 3 Group interim management report
3 Key figures of the first nine months of
2011
5 Economic environment
6 Results of operations, financial position
and net assets
9 Subsequent events
9 Risk and opportunity management
10 Outlook
Construction activity has not yet visibly picked up in the USA, either. Commercial construction was seen to stabilize at a low level and no positive trend could be made out for residential construction yet. A sustained recovery in construction activity in the USA is therefore not expected until the medium term.
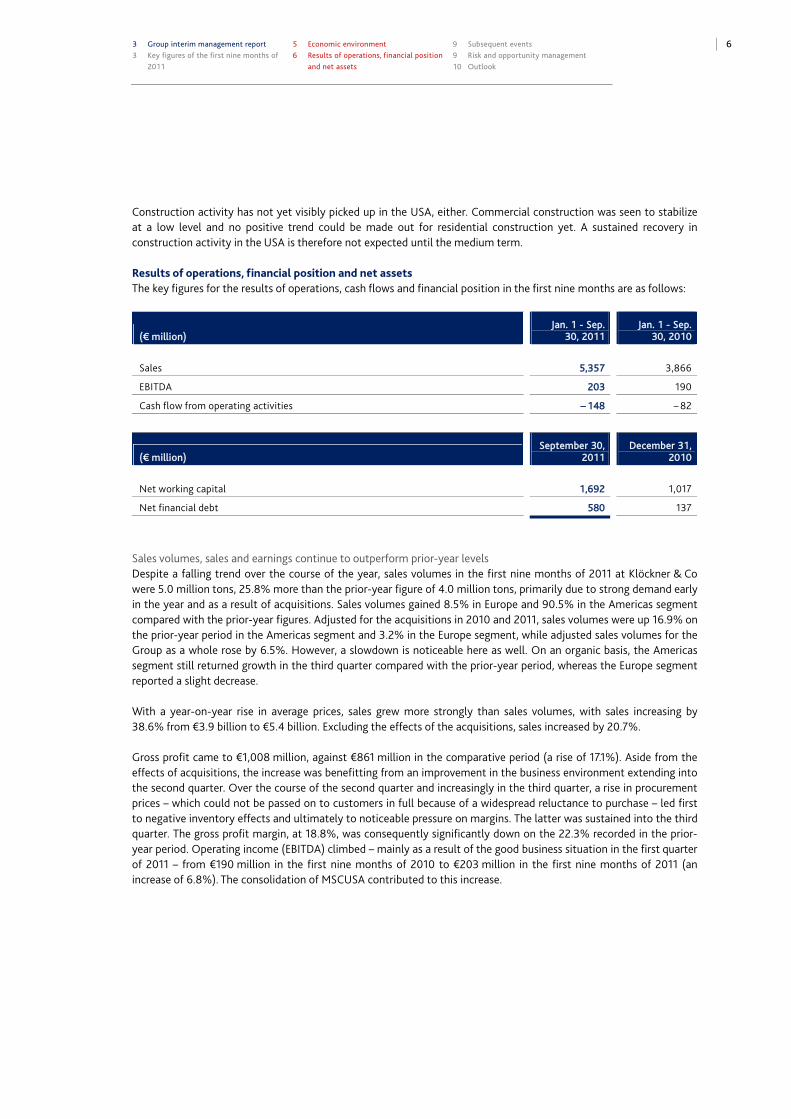
Results of operations, financial position and net assets The key figures for the results of operations, cash flows and financial position in the first nine months are as follows:
(€ million) Jan. 1 - Sep.
30, 2011 Jan. 1 - Sep.
30, 2010
Sales 5,357 3,866
EBITDA 203 190
Cash flow from operating activities – 148 – 82
(€ million) September 30,
2011 December 31,
2010
Net working capital 1,692 1,017
Net financial debt 580 137
Sales volumes, sales and earnings continue to outperform prior-year levels Despite a falling trend over the course of the year, sales volumes in the first nine months of 2011 at Klöckner & Co were 5.0 million tons, 25.8% more than the prior-year figure of 4.0 million tons, primarily due to strong demand early in the year and as a result of acquisitions. Sales volumes gained 8.5% in Europe and 90.5% in the Americas segment compared with the prior-year figures. Adjusted for the acquisitions in 2010 and 2011, sales volumes were up 16.9% on the prior-year period in the Americas segment and 3.2% in the Europe segment, while adjusted sales volumes for the Group as a whole rose by 6.5%. However, a slowdown is noticeable here as well. On an organic basis, the Americas segment still returned growth in the third quarter compared with the prior-year period, whereas the Europe segment reported a slight decrease.
With a year-on-year rise in average prices, sales grew more strongly than sales volumes, with sales increasing by 38.6% from €3.9 billion to €5.4 billion. Excluding the effects of the acquisitions, sales increased by 20.7%.
Gross profit came to €1,008 million, against €861 million in the comparative period (a rise of 17.1%). Aside from the effects of acquisitions, the increase was benefitting from an improvement in the business environment extending into the second quarter. Over the course of the second quarter and increasingly in the third quarter, a rise in procurement prices – which could not be passed on to customers in full because of a widespread reluctance to purchase – led first to negative inventory effects and ultimately to noticeable pressure on margins. The latter was sustained into the third quarter. The gross profit margin, at 18.8%, was consequently significantly down on the 22.3% recorded in the prior-year period. Operating income (EBITDA) climbed – mainly as a result of the good business situation in the first quarter of 2011 – from €190 million in the first nine months of 2010 to €203 million in the first nine months of 2011 (an increase of 6.8%). The consolidation of MSCUSA contributed to this increase.

7 3 Group interim management report
3 Key figures of the first nine months of
2011
5 Economic environment
6 Results of operations, financial position
and net assets
9 Subsequent events
9 Risk and opportunity management
10 Outlook
EBITDA by segments developed as follows:
EBITDA by segments
(€ million) Q3 2011 Q3 2010Jan. 1 - Sep.
30, 2011 Jan. 1 - Sep.
30, 2010
Europe 24 60 155 178
Americas*) 15 5 68 26
Headquarters – 2 – 4 – 20 – 14
Klöckner & Co Group 37 61 203 190
* 2010: North America.
The Europe segment generated operating income of €155 million in the first nine months, less than the €178 million recorded in the prior-year period. The Swiss country organization once again made a strong contribution to the total. All other country organizations recorded decreases in operating income due to the rising pressure on margins in the second and increasingly in the third quarter. The Becker Stahl-Service (BSS) Group taken over last year was likewise unable to break away from this trend, although it still accounted for the largest share of Europe segment EBITDA. Segment EBITDA includes €5.6 million in second-quarter income from reversals of provisions recognized in past periods for a legal dispute with a customer. The dispute was settled out of court.
The Americas segment includes the activities of MSCUSA from May 1 and the activities of Frefer from June 1. EBITDA increased, for the most part on an organic basis but also through the inclusion of MSCUSA, from €26 million to €68 million. The improvement was driven by the better business situation, with higher sales volumes and gross profits. Price increases were somewhat smaller but more sustained in the reporting period than in the Europe segment. The Americas segment likewise saw margins come under pressure since the end of the second quarter.
EBIT came to €129 million in the first nine months, about prior-year's level of €127 million. Higher finance expenses as a result of a higher debt meant that Group earnings before taxes, at €66 million, were down on the €79 million figure for the prior-year period.
The tax rate was approximately 43.0%, compared with 20.2% in the prior-year period. While the tax rate was influenced in the prior-year period by effects related to the acquisition of BSS, the tax rate for the current year was reduced due to effects not associated with the current fiscal period connected to non-deductable expenses in relation to internal dividends as well as to limitations on the deductibility of interest and due to the non-recognition of deferred tax assets on current losses from foreign subsidiaries. Net income decreased accordingly from €63 million in the prior-year period to €38 million.
Basic earnings per share stood at €0.47, compared with €0.92 in the prior-year period.
Rights issue strengthens basis for ongoing expansion The Company’s subscribed capital was increased by €83.1 million in the second quarter, from €166.3 million to €249.4 million. The additional capital was raised by issuing 33.25 million no-par-value shares each representing a notional €2.50 and entitled to dividends from January 1, 2011. The new shares were offered to Klöckner & Co shareholders in a one-for-two rights issue at a subscription price of €15.85 per share. The rights issue consequently generated gross proceeds of some €528 million. After issue-related costs and deferred taxes, the net increase came to €520 million. Klöckner & Co is planning to use the proceeds from the rights issue together with existing cash holdings as the basis for further growth.

8 3 Group interim management report
3 Key figures of the first nine months of
2011
5 Economic environment
6 Results of operations, financial position
and net assets
9 Subsequent events
9 Risk and opportunity management
10 Outlook
Group financial position continues to be shaped by completion of acquisitions and rights issue The condensed consolidated statement of financial position is as follows:
Consolidated balance sheet
(€ million) September 30, 2011 December 31, 2010
Non-current assets 1,292 856
Current assets
Inventories 1,447 899
Trade receivables 1,080 703
Other current assets 117 98
Liquid funds 1,014 935
Total assets 4,950 3,491
Equity 1,847 1,290
Non-current liabilities and provisions
Financial liabilities 1,179 1,020
Other non-current liabilities and provisions 463 341
Current liabilities
Financial liabilities 401 40
Trade payables 835 585
Other current liabilities and provisions 225 215
Total equity and liabilities 4,950 3,491
Total assets increased mainly as a result of the acquisitions and also due to the rights issue by 41.8% to €4.950 million. Non-current assets accordingly increased to €1.292 million (an increase of 50.9%). Intangible assets accounted for €323 million of the increase, mainly relating to goodwill, customer relationships and other intangible assets from the MSCUSA and Frefer acquisitions.
Current assets rose compared with the 2010 year-end by 38.8% to €3,658 million. This reflected a substantial increase in inventories (up 61.0%) and trade receivables (up 53.7%). Of the €925 million total increase in inventories and trade receivables at the reporting date, €507 million related to MSCUSA and Frefer. The same effect is visible in current liabilities, with trade payables rising from €585 million to €835 million, €112 million of which was accounted for by MSCUSA and Frefer. Net working capital, at €1.692 million, was consequently substantially higher than the 2010 year-end figure of €1.017 million.
Net working capital
(€ million) September 30, 2011 December 31, 2010
Inventories 1,447 899
Trade receivables 1,080 703
Trade payables – 835 – 585
Net working capital 1,692 1,017

9 3 Group interim management report
3 Key figures of the first nine months of
2011
4 Economic environment
6 Results of operations, financial position
and net assets
9 Subsequent events
9 Risk and opportunity management
10 Outlook
The inflow of resources from the rights issue was a key factor in maintaining liquid funds at the high level of €1.014 million, compared with €935 million as of December 31, 2010, despite the cash outflow on payment of the purchase price for the acquisitions and the higher net working capital.
The equity ratio came to some 37% as of September 30, 2011 and – as a result of the rights issue – was on a par with the 2010 fiscal year-end despite higher total assets.
The total assets' increase is countered on the total liabilities – likewise largely due to the acquisitions – by a rise in trade payables and significantly higher financial liabilities totaling €1,580 million (an increase of €520 million). Net financial debt stood at €580 million, compared with €137 million at the end of the prior fiscal year. The increase in deferred tax liabilities, which came to €172 million as of September 30, 2011 (December 31, 2010: €80 million), is likewise almost exclusively accounted for by the acquisitions.
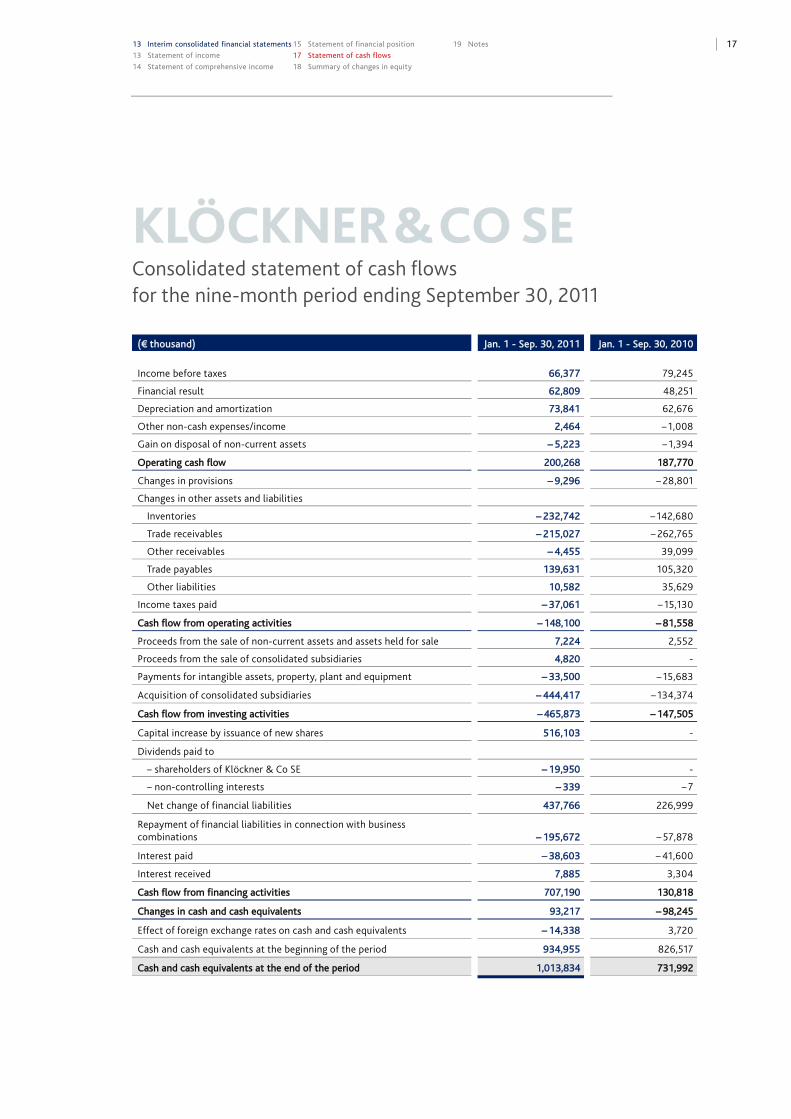
Consolidated statement of cash flows
(€ million) Jan. 1 - Sep.
30, 2011 Jan. 1 - Sep.
30, 2010
Operating cash flow 200 188
Cash flow from operating activities – 148 – 82
Cash flow from investing activities – 466 – 148
Cash flow from financing activities 707 131
Changes in cash and cash equivalents 93 – 98
Cash and cash equivalents at the beginning of the period 935 827
Cash and cash equivalents at the end of the period 1,014 732
Operating activities generated a larger cash outflow of €148 million compared with €82 million in the prior-year period, mainly reflecting the increase in resources tied up in net working capital. As a result of payment of the purchase price (less acquired cash and cash equivalents) of €444 million for MSCUSA and Frefer, investing activities likewise produced a larger cash outflow of €466 million than in the prior-year period (€148 million). The cash inflow from the rights issue was the main factor in the ability to generate a positive, €707 million cash flow from financing activities despite repayment of financial debt taken over in the MSCUSA acquisition.
Subsequent events No material events have arisen subsequent to the reporting date.
Risk and opportunity management We continuously monitor and analyze key risks and opportunities for the Company under our risk and opportunity management system. Coordination between country organizations and the holding company in this regard is based on a structured risk and opportunity reporting process. The core element of the risk and opportunity monitoring system is quarterly updating of identified risks and opportunities in an opportunities and risks report, supplemented by ad-hoc reporting of any going concern risks and material risks emerging at short notice. The internal auditing department once again reviewed compliance with prevailing risk management requirements and Group guidelines both domestically and internationally in the first nine months of 2011. The findings ensure timely risk detection and control. The Klöckner & Co Group’s internal risk management system is described in detail beginning on page 56 of the Annual Report 2010.
10 3 Group interim management report
3 Key figures of the first nine months of
2011
5 Economic environment
6 Results of operations, financial position
and net assets
9 Subsequent events
9 Risk and opportunity management
10 Outlook
Current assessment of opportunities and risks The Management Board believes that Klöckner & Co has recognized sufficient provisions to cover all risks required to be accounted for when preparing the financial statements.
Market risk for Klöckner & Co as a stockholding multi metal distributor is mostly determined by trends in demand and prices. After a sharp initial rise after the 2010 year-end followed by a fall since April, steel and metal prices could yet decrease further. Drawing down the relatively large inventories in distribution, particularly in Europe, could additionally put further downward pressure on prices, as inventories normally tend to be reduced throughout the value chain toward the year-end. Risk could also result from the current mood of uncertainty on financial markets in the face of high sovereign debt levels in a number of European countries and the USA, potentially resulting in liquidity shortfalls and increased borrowing costs for customer industries, combined with a decrease in capital investment. A leveling-off of economic output in our core markets could be enough to cause a drop in steel demand. This could have a negative impact on our financial position, cash flows and results of operations. The detailed fundamental information provided in the Opportunities and Risks section on pages 55-64 of the Annual Report 2010 also continues to apply.
In summary, the Management Board is confident that the systems for managing risks and opportunities in the Klöckner & Co Group are working well, that sufficient allowance has been made for all risks required to be accounted for in the financial statements, and that steps have been taken as necessary to cushion the impact of impending market risks. Given the current financing structure, no liquidity shortfalls are to be expected. There are no identifiable risks that raise doubt about the Company’s ability to continue as a going concern.
Outlook For fiscal 2011, despite softening demand, we continue to anticipate year-on-year growth of over 25% in sales volumes and more than 35% in sales, largely thanks to the contributions made by the acquisitions. Given the weak demand trend and the sustained price pressure, we project that fourth-quarter operating income (EBITDA) will be down on the third quarter. Restructuring costs in the low double-digit millions of euros will have an additional impact on income.
For 2012, we currently expect rising demand for steel in North and South America and at best stable demand for steel in Europe, with risks due to the public debt crisis in the euro zone remaining high. In light of this, we will not yet attain our 6% long-term EBITDA margin target in the next year. The initiated restructuring measures will, however, contribute to achieving this target as soon as possible thereafter.
Duisburg, November 9, 2011
Klöckner & Co SE
The Management Board

11 3 Group interim management report 11 Klöckner & Co share
13 Interim consolidated financial statements
KLÖCKNER & CO SHARE Klöckner & Co share: Key data
ISIN DE000KC01000 – German securities code (WKN) KC0100 Stock exchange symbol: KCO Bloomberg: KCO GR Reuters Xetra: KCOGn.DE MDAX® listing since January 29, 2007
Klöckner & Co shares: Key performance figures
Q3 2011 Q3 2010
Number of shares in shares 99,750,000 66,500,000
Closing price (XETRA, Close) € 9.31 16.64
Market capitalization € million 929 1,107
High (XETRA, Close) € 21.90 16.67
Low (XETRA, Close) € 9.14 14.10
Average daily trading volume in shares 2,263,886 827,336
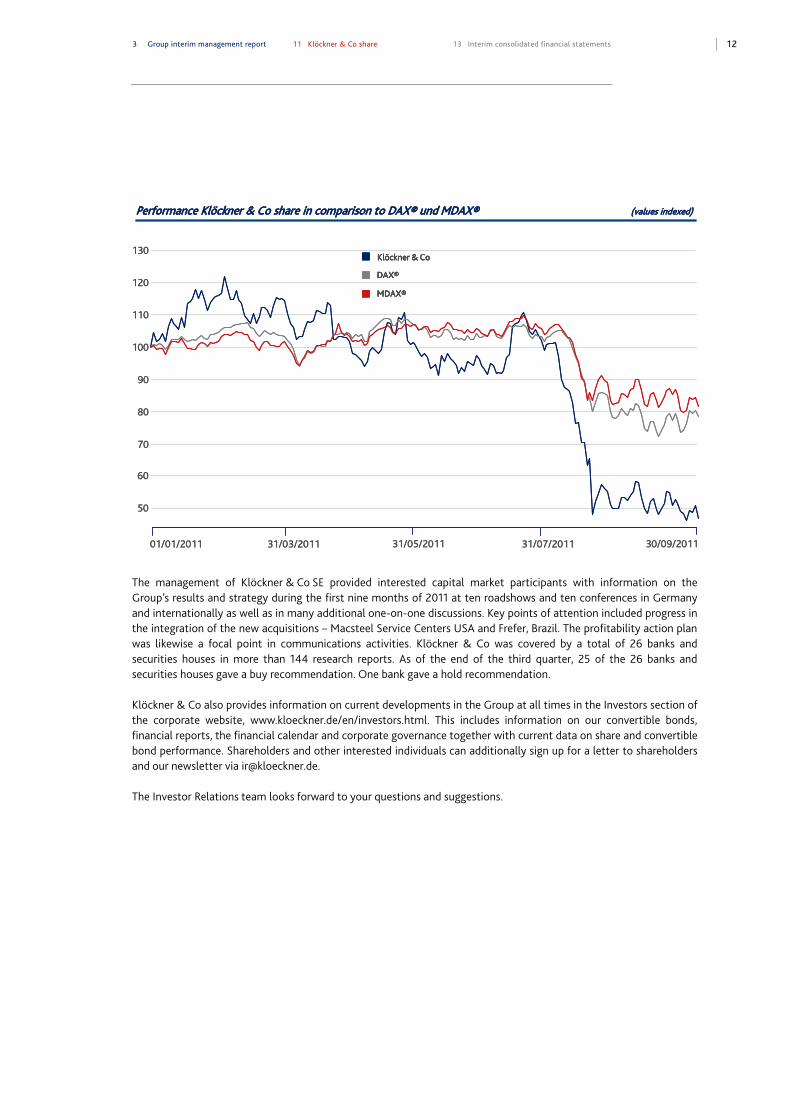
Share price impacted by uncertain expectations for the economy The share price trended upward until the beginning of the second quarter, mainly buoyed by the acquisitions and the positive price environment. In the second quarter, it initially lost some ground for technical reasons following the rights issue. Klöckner & Co being an early-cycle stock, the share price subsequently came under particularly strong pressure due to the uncertain macroeconomic environment from August. It was not possible to make good the lost ground by the end of the third quarter and the share price closed on September 30, 2011 at €9.31. This represents a fall of some 56% from the 2010 year-end closing share price, and approximately a 44% reduction compared with September 30, 2010. The MDAX® fell by about 18% against the 2010 year-end. The DAX® lost around 20% over the same period.
Ownership structure dominated by Anglo-Saxon investors We once again commissioned a shareholder identification analysis in the past quarter. The last survey, in September, identified 81% of shareholders. The identified institutional investors held 52% of the share capital, with a further 26% in the possession of private individuals.
Geographically, the largest proportion of identified institutional investors in our Company are located in the UK and the USA. Some 23% of the institutional investors are based in Germany, followed by 19% in the USA and 15% in Norway. The UK takes fourth place with 12%.
At the time of preparation, according to a mandatory notification of June 2011, our largest shareholder was Norges Bank with 5.58%.
12 3 Group interim management report 11 Klöckner & Co share
13 Interim consolidated financial statements
Performance Klöckner & Co share in comparison to DAX® und MDAX® (values indexed)
130
120
110
100
90
80
70
Klöckner & Co
DAX®
MDAX®
01/01/2011 31/03/2011 31/07/201131/05/2011 30/09/2011
60
50
Performance Klöckner & Co share in comparison to DAX® und MDAX® (values indexed)
130
120
110
100
90
80
70
Klöckner & Co
DAX®
MDAX®
Klöckner & CoKlöckner & Co
DAX®DAX®
MDAX®MDAX®
01/01/2011 31/03/2011 31/07/201131/05/2011 30/09/2011
60
50
The management of Klöckner & Co SE provided interested capital market participants with information on the Group’s results and strategy during the first nine months of 2011 at ten roadshows and ten conferences in Germany and internationally as well as in many additional one-on-one discussions. Key points of attention included progress in the integration of the new acquisitions – Macsteel Service Centers USA and Frefer, Brazil. The profitability action plan was likewise a focal point in communications activities. Klöckner & Co was covered by a total of 26 banks and securities houses in more than 144 research reports. As of the end of the third quarter, 25 of the 26 banks and securities houses gave a buy recommendation. One bank gave a hold recommendation.
Klöckner & Co also provides information on current developments in the Group at all times in the Investors section of the corporate website, www.kloeckner.de/en/investors.html. This includes information on our convertible bonds, financial reports, the financial calendar and corporate governance together with current data on share and convertible bond performance. Shareholders and other interested individuals can additionally sign up for a letter to shareholders and our newsletter via [email protected].
The Investor Relations team looks forward to your questions and suggestions.

13 13 Interim consolidated financial statements
13 Statement of income
14 Statement of comprehensive income
15 Statement of financial position
17 Statement of cash flows
18 Summary of changes in equity
19 Notes
KLÖCKNER & CO SE Consolidated statement of income for the nine-month period ending September 30, 2011
(€ thousand) Jan. 1 - Sep. 30,
2011Jan. 1 - Sep. 30,
2010 Q3 2011 Q3 2010
Sales 5,356,612 3,865,801 1,884,670 1,400,703
Other operating income 32,894 20,639 13,063 524
Change in inventory 6,560 – 2,212 1,505 971
Own work capitalized 7 34 6 11
Cost of materials – 4,355,146 – 3,002,473 – 1,568,659 – 1,107,558
Personnel expenses – 425,414 – 358,869 – 147,750 – 118,319
Depreciation and amortization – 73,841 – 62,676 – 29,026 – 21,967
Other operating expenses – 412,486 – 332,748 – 146,235 – 115,650
Operating result 129,186 127,496 7,574 38,715
Finance income 13,879 7,138 7,870 3,340
Finance expenses – 76,688 – 55,389 – 30,285 – 19,758
Financial result – 62,809 – 48,251 – 22,415 – 16,418
Income before taxes 66,377 79,245 – 14,841 22,297
Income taxes – 28,545 – 16,046 3,095 – 7,679
Net income 37,832 63,199 – 11,746 14,618
thereof attributable to
– shareholders of Klöckner & Co SE 38,107 61,349 – 10,846 14,136
– non-controlling interests – 275 1,850 – 900 482
Earnings per share
– basic 0.47 0.92 – 0.11 0.21
– diluted 0.47 0.92 – 0.11 0.21

14 13 Interim consolidated financial statements
13 Statement of income
14 Statement of comprehensive income
15 Statement of financial position
17 Statement of cash flows
18 Summary of changes in equity
19 Notes
KLÖCKNER & CO SE Statement of comprehensive income for the nine-month period ending September 30, 2011
(€ thousand) Jan. 1 - Sep. 30,
2011Jan. 1 - Sep. 30,
2010 Q3 2011 Q3 2010
Net income 37,832 63,199 – 11,746 14,618
Income/expenses directly recognized in equity
Foreign currency translation 26,215 51,022 39,832 – 35,674
Gain/loss from cash flow hedges – 3,156 – 27,405 – 30,376 27,926
Related income tax – 1,577 4,457 – 166 – 109
Other comprehensive income 21,482 28,074 9,290 – 7,857
Total comprehensive income 59,314 91,273 – 2,456 6,761
thereof attributable to
– shareholders of Klöckner & Co SE 62,265 89,404 1,277 6,231
– non-controlling interests – 2,951 1,869 – 3,733 530

15 13 Interim consolidated financial statements
13 Statement of income
14 Statement of comprehensive income
15 Statement of financial position
17 Statement of cash flows
18 Summary of changes in equity
19 Notes
KLÖCKNER & CO SE Consolidated statement of financial position as of September 30, 2011
Assets
(€ thousand) September 30, 2011 December 31, 2010
Non-current assets
Intangible assets 550,097 227,323
Property, plant and equipment 632,276 524,169
Investment property 10,486 10,486
Financial assets 4,349 2,721
Other assets 35,385 32,027
Deferred tax assets 59,532 59,235
Total non-current assets 1,292,125 855,961
Current assets
Inventories 1,446,889 898,841
Trade receivables 1,080,350 703,101
Income tax receivable 20,085 34,251
Other assets 94,408 62,898
Cash and cash equivalents 1,013,834 934,955
Assets held for sale 1,964 1,088
Total current assets 3,657,530 2,635,134
Total assets 4,949,655 3,491,095

16 13 Interim consolidated financial statements
13 Statement of income
14 Statement of comprehensive income
15 Statement of financial position
17 Statement of cash flows
18 Summary of changes in equity
19 Notes
Equity and liabilities
(€ thousand) September 30, 2011 December 31, 2010
Equity
Subscribed capital 249,375 166,250
Capital reserves 900,759 464,243
Retained earnings 595,952 596,162
Accumulated other comprehensive income 72,879 48,721
Equity attributable to shareholders of Klöckner & Co SE 1,818,965 1,275,376
Non-controlling interests 27,994 15,118
Total equity 1,846,959 1,290,494
Non-current liabilities and provisions
Provisions for pensions and similar obligations 185,238 174,442
Other provisions 30,254 31,513
Financial liabilities 1,179,155 1,020,582
Other liabilities 74,991 54,945
Deferred tax liabilities 172,021 79,910
Total non-current liabilities 1,641,659 1,361,392
Current liabilities
Other provisions 110,112 107,259
Income tax liabilities 13,389 31,638
Financial liabilities 401,285 39,578
Trade payables 834,811 584,614
Other liabilities 101,440 76,120
Total current liabilities 1,461,037 839,209
Total liabilities 3,102,696 2,200,601
Total equity and liabilities 4,949,655 3,491,095
17 13 Interim consolidated financial statements
13 Statement of income
14 Statement of comprehensive income
15 Statement of financial position
17 Statement of cash flows
18 Summary of changes in equity
19 Notes
KLÖCKNER & CO SE Consolidated statement of cash flows for the nine-month period ending September 30, 2011
(€ thousand) Jan. 1 - Sep. 30, 2011 Jan. 1 - Sep. 30, 2010
Income before taxes 66,377 79,245
Financial result 62,809 48,251
Depreciation and amortization 73,841 62,676
Other non-cash expenses/income 2,464 – 1,008
Gain on disposal of non-current assets – 5,223 – 1,394
Operating cash flow 200,268 187,770
Changes in provisions – 9,296 – 28,801
Changes in other assets and liabilities
Inventories – 232,742 – 142,680
Trade receivables – 215,027 – 262,765
Other receivables – 4,455 39,099
Trade payables 139,631 105,320
Other liabilities 10,582 35,629
Income taxes paid – 37,061 – 15,130
Cash flow from operating activities – 148,100 – 81,558
Proceeds from the sale of non-current assets and assets held for sale 7,224 2,552
Proceeds from the sale of consolidated subsidiaries 4,820 -
Payments for intangible assets, property, plant and equipment – 33,500 – 15,683
Acquisition of consolidated subsidiaries – 444,417 – 134,374
Cash flow from investing activities – 465,873 – 147,505
Capital increase by issuance of new shares 516,103 -
Dividends paid to
– shareholders of Klöckner & Co SE – 19,950 -
– non-controlling interests – 339 – 7
Net change of financial liabilities 437,766 226,999
Repayment of financial liabilities in connection with business combinations – 195,672 – 57,878
Interest paid – 38,603 – 41,600
Interest received 7,885 3,304
Cash flow from financing activities 707,190 130,818
Changes in cash and cash equivalents 93,217 – 98,245
Effect of foreign exchange rates on cash and cash equivalents – 14,338 3,720
Cash and cash equivalents at the beginning of the period 934,955 826,517
Cash and cash equivalents at the end of the period 1,013,834 731,992

18 13 Interim consolidated financial statements
13 Statement of income
14 Statement of comprehensive income
15 Statement of financial position
17 Statement of cash flows
18 Summary of changes in equity
19 Notes
KLÖCKNER & CO SE Summary of changes in equity
Accumulated other
comprehensive income
(€ thousand)
Subscribed capital of Klöckner & Co SE
Capital reserves of Klöckner &
Co SERetained earnings
Currency translation
adjustment
Fair value adjustments
of financial instruments
Equity attributable
to shareholders of Klöckner
& Co SE
Non-control-
ling interests Total
Balance as of January 1, 2010 166,250 429,493 518,621 10,994 – 17,163 1,108,195 15,068 1,123,263
Accumulated other comprehensive income
Foreign currency translation 51,003 51,003 19 51,022
Gain/loss from cash flow hedges – 27,405 – 27,405 – 27,405
Related income tax – 3,967 8,424 4,457 4,457
Net income 61,349 61,349 1,850 63,199
Total comprehensive income 89,404 1,869
Dividends – 7 – 7
Balance as of September 30, 2010 166,250 429,493 579,970 58,030 – 36,144 1,197,599 16,930 1,214,529
Balance as of January 1, 2011 166,250 464,243 596,162 84,717 – 35,996 1,275,376 15,118 1,290,494
Accumulated other comprehensive income
Foreign currency translation 28,891 28,891 – 2,676 26,215
Gain/loss from cash flow hedges – 3,156 – 3,156 – 3,156
Related income tax – 2,545 968 – 1,577 – 1,577
Net income 38,107 38,107 – 275 37,832
Total comprehensive income 62,265 – 2,951
Acquisition of non-controlling interests
Change in scope of consolidation*) – 18,724 – 18,724 16,522 – 2,202
Capital increase 83,125 436,516 519,641 519,641
Acquisition of non-controlling interests 356 356 – 356
Dividends – 19,950 – 19,950 – 339 – 20,289
Balance as of September 30, 2011 249,375 900,759 595,952 111,063 – 38,184 1,818,965 27,994 1,846,959
*) Incl. put option for non-controlling interests of Frefer Group (see note 3).

19 13 Interim consolidated financial statements
13 Statement of income
14 Statement of comprehensive income
15 Statement of financial position
17 Statement of cash flows
18 Summary of changes in equity
19 Notes
Selected explanatory notes to the interim consolidated financial statements of Klöckner & Co SE for the nine-month period ending September 30, 2011
(1) BASIS OF PRESENTATION The interim consolidated financial statements of Klöckner & Co SE for the nine-month period ending September 30, 2011 were prepared for the interim presentation in accordance with Sec. 37x para. 3 WpHG in connection with Sec. 37w para. 2 WpHG as well as International Financial Reporting Standards (IFRS) and the respective interpretations issued by the International Accounting Standards Board (IASB) as adopted for use within the EU.
The interim consolidated financial statements were not reviewed by an independent auditor.
Except for the application of new standards as discussed in Note 2 below, the accounting policies applied to the interim financial statements as of September 30, 2011 are consistent with those used for the consolidated financial statements of Klöckner & Co SE as of December 31, 2010 under consideration of the IAS 34 regulations (Interim Financial Reporting). A detailed description of those policies is provided in the notes to the consolidated financial statements on pages 80 to 89 of the 2010 Annual Report.
As part of the preparation of an interim consolidated financial statement in accordance with the IAS 34 for the period ending September 30, 2011, Klöckner & Co SE's management is required to make judgments, estimates and assumptions affecting the application of accounting policies and reported amounts of assets and liabilities, income and expenses. The actual amounts can differ from these estimates. In the current interim consolidated financial statement no significant changes were made to such estimates compared to the period ending December 31, 2010.
In the opinion of the Management Board, the interim consolidated financial statements are reflecting all adjustments deemed necessary to provide a true and fair view of the results. Results for the period ending September 30, 2011 are not necessarily indicative of future results.
The present interim consolidated financial statements for the nine-month period ending September 30, 2011 were authorized for issuance by the Management Board after discussion with the Audit Committee of the Supervisory Board on November 9, 2011. Unless otherwise indicated, all amounts are stated in million euros (€ million). Discrepancies to the unrounded figures may arise.

20 13 Interim consolidated financial statements
13 Statement of income
14 Statement of comprehensive income
15 Statement of financial position
17 Statement of cash flows
18 Summary of changes in equity
19 Notes
(2) NEW STANDARDS AND INTERPRETATIONS In the reporting period the Klöckner & Co Group applied the following standards and interpretations for the first time:
Standard/Interpretation
Annual Improvements 2010
Amendment to IFRIC 14 (Prepayments of a Minimum Funding Liability)
IAS 24 (rev.) (Related Party Disclosures)
IFRIC 19 (Extinguishing Financial Liabilities with Equity Instruments)
The initial application of the revised standards and interpretations did not have any impact on the consolidated financial statements.
In addition, the International Accounting Standards Board (IASB) and International Financial Reporting Interpretations Committee (IFRIC) issued the following standards and interpretations that are applicable for the Group but whose application is not yet mandatory in the reporting period. The application of the standards and interpretations is subject to endorsement by the EU, which for certain standards and interpretations is yet outstanding.
In May 2011, the IASB published IFRS 10 (Consolidated Financial Statements), IFRS 11 (Joint Arrangements) and IFRS 12 (Disclosure of Interests in Other Entities).
IFRS 10 provides a consistent definition of control as the determining factor in whether an entity should be included in the consolidated financial statements of the parent company and thus limiting the scope of consolidated entities. IFRS 11 governs the accounting for joint arrangements in which two or more parties have joint control. A joint arrangement is either a joint venture or a joint operation. The standard addresses inconsistencies and is improving comparability in the reporting of joint arrangements by requiring a single method to account for interests in jointly controlled entities. IFRS 12 is a new and comprehensive standard on disclosure requirements for all forms of interests in other entities, including joint arrangements, associates, special purpose vehicles and other off balance sheet vehicles.
Also in May, the IASB issued revisions to IAS 27 (Separate Financial Statements) in consequence to the new standards described in the preceding paragraph, which now only contains the unchanged requirements for separate financial statements of an entity and to IAS 28 (Investments in Associates and Joint Ventures).
Furthermore, the IASB issued IFRS 13 standards (Fair Value Measurement) in May replacing the guidance on fair value measurement in existing IFRS pronouncements by a single standard. IFRS 13 defines fair value, provides guidance on its determination and requires disclosure about fair value measurements. However, it does not change the requirements for the items that should be measured or disclosed at fair value.
In June, the IASB published amendments to IAS 1 (Presentation of Financial Intruments) and IAS 19 (Employee Benefits).

21 13 Interim consolidated financial statements
13 Statement of income
14 Statement of comprehensive income
15 Statement of financial position
17 Statement of cash flows
18 Summary of changes in equity
19 Notes
The amendments to IAS 1 modify the presentation of the OCI and income statement in a way that requires separate subtotals for recyclable (e.g. cash-flow hedges, foreign currency translation of international subsidiaries) and non-recyclable entries. The amendments also reaffirm existing requirements that items in OCI and profit or loss should be presented as either a single statement or two separate statements.
By amending IAS 19, the option to defer the recognition of gains and losses, known as the ‘corridor method’, was eliminated. The revised standard streamlines the presentation of changes in assets and liabilities arising from defined benefit plans, including the requirement of remeasurements to be presented in other comprehensive income. Annual expenses for funded plans will include net interest expense or income, calculated by applying the discount rate to the net defined benefit asset or liability. Asset returns may therefore no longer be based on expected returns. The revised standard will also enhance disclosure requirements for defined benefit plans.
Except for IAS 1 which must be applied effective July 1, 2012, the new or revised pronouncements must be applied from the fiscal year starting January 1, 2013 forward. Klöckner & Co is currently evaluating the impact of the new or revised standards on its consolidated financial statements.
(3) BUSINESS COMBINATIONS AND DISPOSALS In pursuit of the application of the "Klöckner & Co 2020" strategy, the following business combinations were consummated in 2011.
Macsteel Service Centers, USA, Inc. At the end of April, the acquistion of 100% of Macsteel Service Centers, USA, Inc. ("MSCUSA") was closed. MSCUSA has 30 locations and is one of the leading metal service center companies in the US. In 2010, MSCUSA generated sales of approximately USD 1.3 billion and had approximately 1,200 employees. Klöckner & Co is strengthening its market position by more than doubling its sales in the US and is expanding its product and service range through expansion of its high value-adding steel service center business. The purchase price adjustment mechanism agreed with the seller was cancelled in September 2011. As such, the purchase price was set to USD 600 million (approximately €404 million). MSCUSA was initially consolidated on May 1, 2011.
Frefer At the end of May, Klöckner & Co started its planned entry into emerging markets by acquiring a 70% share of the third-largest independent steel and metal distributor in Brazil as part of its "Klöckner & Co 2020" strategy. The Frefer Group is a flat steel focussed distribution and service center company with around 360 employees at 14 locations in Brazil and 2010 sales of approx. BRL 340 million (approx. €150 million). The initial consolidation was carried out on June 1, 2011. For a subsequent transfer of minority interest put and call options were negotiated. The put option constitutes a financial liability and is subsequently to be measured at fair value through profit and loss. On September 30, 2011, €17 million were determined as valuation.

22 13 Interim consolidated financial statements
13 Statement of income
14 Statement of comprehensive income
15 Statement of financial position
17 Statement of cash flows
18 Summary of changes in equity
19 Notes
The transactions are deemed to be material business combinations under IFRS 3. Due to the proximity to the date on which the financial statements were authorized for issuance, the calculation of the fair values of the acquired assets and adopted liabilities, which is yet provisional (especially with regard to intangible assets and inventories) is as follows:
(€ million) Fair values
MSCUSA Frefer
Assets
Goodwill 102.3 42.2
Other intangible assets 158.3 29.4
thereof customer relationships 129.5 27.1
thereof trade names 7.8 2.0
Property, plant and equipment 110.7 2.2
Other non-current assets 9.1 0.3
Inventories 276.6 19.3
Trade receivables 137.7 12.5
Other current assets 21.4 1.7
Cash and cash equivalents*) 8.3 32.4
Total acquired assets 824.4 140.0
Liabilities and provisions
Non-current financial liabilities 10.4 15.8
Other non-current liabilities and provisions 12.2 0.0
Deferred tax liabilities 82.4 9.9
Trade payables 99.9 4.1
Current financial liabilities 198.9 10.7
Other current liabilities and provisions 16.2 2.3
Total assumed liabilities 420.0 42.8
Acquired net assets 404.4 97.2
Non-controlling interests 0.0 16.5
Purchase price*) 404.4 80.7
thereof paid in cash and cash equivalents 404.4 80.7
Reconciliation transaction volume
Assumed financial liabilities 209.3 26.5
Acquired cash and cash equivalents*) – 8.3 – 32.4
Transaction volume 605.4 74.8
*) including capital increase at Frefer.
Goodwill is primarily representing future earnings potential and synergies.
The non-controlling interests of the Frefer-Group were measured at their share of the fair values of identifiable assets and liabilities (net assets), i.e. the full goodwill method was not applied.

23 13 Interim consolidated financial statements
13 Statement of income
14 Statement of comprehensive income
15 Statement of financial position
17 Statement of cash flows
18 Summary of changes in equity
19 Notes
Additional information according to IFRS 3.B64
(€ million) MSCUSA Frefer
Sales contribution since initial consolidation 502.6 36.2
Contribution to net income since initial consolidation – 4.1 – 3.7
Gross contractual amounts trade receivable 139.1 14.2
Acquisition related expenses (other operating expenses) 0.9 1.0
Consolidated sales would have been €5,773 million and net income would have been €32 million, if the acquisitions had been consolidated since the beginning of the reporting period. Potential effects from a retrospective valuation of inventories as of January 1 are not included.
The 100% interest in the Dutch subsidiary Teuling Staal B.V. was sold by contract dated August 11, 2011. The purchase price was agreed upon the same amount as the net assets disposed.
(4) SHARE-BASED PAYMENT In 2006, the Group established share-based payment programs. Eligible for share-based payments are Management Board members as well as certain national and international members of the senior management. The Group's programs are cash-settled virtual stock option plans.
A total of 602,700 virtual stock options (December 31, 2010: 602,700) still apply to the Management Board's programs as of September 30, 2011. In addition to the Management Board's program, 151,500 virtual stock options for 2011 (2010: 122,000) were granted to certain national and international members of the senior management during the current business year. The exercise conditions are fundamentally identical to the Management Board's programs of VSO I and VSO III as described in the 2010 annual report of Klöckner & Co SE. The 2011 grants are subject to several years' waiting periods.
The total number of outstanding virtual stock options developed as follows:
(Number of virtual stock options) Management
Board programsOther
executives Total
Outstanding at the beginning of the year 602,700 188,000 790,700
Granted - 151,500 151,500
Exercised - – 17,500 – 17,500
Outstanding at the end of the reporting period 602,700 322,000 924,700
therof vested 60,000 58,500 118,500
During the first nine months of 2011, 17,500 (2010: 178,100) virtual stock options were exercised. Payments for share-based compensation amounted to €0.1 million (2010: €1.3 million). The pro rata provision for share-based payments to the Management Board and the senior management amounted to €1.3 million (December 31, 2010: €2.7 million) with a total of €1.2 million income recognized (2010: €0.4 million expense) during the reporting period.

24 13 Interim consolidated financial statements
13 Statement of income
14 Statement of comprehensive income
15 Statement of financial position
17 Statement of cash flows
18 Summary of changes in equity
19 Notes
To limit expenses and cash flows for the granted and approved grants of virtual stock options for the period including the financial year 2011, the Group entered into certain derivative financial instruments in prior years. These instruments (options) were accounted for at fair value through profit or loss in accordance with IAS 39 (Financial Instruments: Recognition and Measurement). In the beginning of 2011, the remaining options were settled at a settlement gain of €0.2 million (2010: positive fair value changes of hedging instruments amounted to €0.9 million) and were recorded in personnel expenses.
(5) EARNINGS PER SHARE Earnings per share are calculated by dividing the net income attributable to shareholders by the weighted average number of shares outstanding during the period. In accordance with IAS 33.41, 18,447 thousand (2010: 9,943 thousand) potential dilutive shares of the convertible bonds were not included in the computation of diluted earnings per share as they were anti-dilutive.
Jan. 1 - Sep. 30,
2011 Jan. 1 - Sep. 30,
2010
Net income attributable to shareholders of Klöckner & Co SE (€ thousand) 38,107 61,349
Weighted average number of shares (thousands of shares) 80,506 66,500
Basic earnings per share (€/share) 0.47 0.92
Diluted earnings per share (€/share) 0.47 0.92
(6) INVENTORIES
(€ million) September 30,
2011 December 31,
2010
Cost 1,501.0 942.8
Valuation allowance (net realizable value) – 54.1 – 44.0
Inventories 1,446.9 898.8
(7) SHAREHOLDERS’ EQUITY Subscribed capital Effective with registration on June 8, 2011, the Company’s subscribed capital was increased from €166,250,000 by €83,125,000 to €249,375,000. The increase from authorized capital was achieved by issuance of 33,250,000 no-par value shares with a calculated pro rata share of the capital stock of €2.50 per share with full dividend rights from January 1, 2011. The issue price for the new shares amounted to €15.85 per share, resulting in gross issue proceeds of about €528 million.
After utilization of the residual rights and deduction of issuance cost (including deferred taxes of €3 million) of €8 million the net increase amounted to €520 million of which €437 million were attributed to capital reserves.
Authorized capital The authorized capital of €83,125,000 was fully utilized by the increase of the subscribed capital.

25 13 Interim consolidated financial statements
13 Statement of income
14 Statement of comprehensive income
15 Statement of financial position
17 Statement of cash flows
18 Summary of changes in equity
19 Notes
Conditional capital 2011 By resolution of the Annual General Meeting on May 20, 2011, Klöckner & Co’s conditional share capital 2010 was modified to the extent that the conditional increase was reduced to up to €16,625,000 by issue of up to 6,650,000 newly registered no-par value shares entitled to profits from the beginning of the business year in which they were issued. Simultaneously, the share capital was conditionally increased up to €33,250,000 by issue of up to 13,300,000 newly registered no-par value shares which also are entitled to profits from the beginning of the business year in which they were issued.
The conditional capital serves to grant subscription and/or conversion rights to the holders of option bonds and/or convertible bonds that are issued by Klöckner & Co SE or a Group company in accordance with the authority of the Annual General Meetings.
(8) FINANCIAL LIABILITIES
(€ million) September 30, 2011 December 31, 2010
Non-current financial liabilities
Bonds 258.4 527.8
Liabilities to banks 357.6 256.5
Promissory notes 340.6 144.4
Liabilities under ABS programs 219.7 87.2
Finance lease liabilities 2.9 4.7
1,179.2 1,020.6
Current financial liabilities
Bonds 333.7 5.5
Liabilities to banks 58.4 29.9
Promissory notes 6.4 2.0
Liabilities under ABS programs 0.4 0.1
Finance lease liabilities 2.3 2.1
401.2 39.6
Financial liabilities as per consolidated balance sheet 1,580.4 1,060.2
Net financial debt developed as follows:
(€ million) September 30, 2011 December 31, 2010
Financial liabilities as per consolidated balance sheet 1,580.4 1,060.2
Transaction cost 13.6 11.7
Gross financial liabilities 1,594.0 1,071.9
Cash and cash equivalents – 1,013.8 – 935.0
Net financial debt Klöckner & Co Group 580.2 136.9

26 13 Interim consolidated financial statements
13 Statement of income
14 Statement of comprehensive income
15 Statement of financial position
17 Statement of cash flows
18 Summary of changes in equity
19 Notes
In March 2011, the syndicated loan (Multi Currency Revolving Credit Facility) was extended early until May 28, 2014 and its terms were modified to allow for more flexibility with regard to additional debt ("Priority Debt") to be incurred in connection with future acquisitions.
The non-current financing of the MSCUSA acquisition was hedged by cross currency swaps of USD 300 million. This securization was presented as hedge accounting in the Group interim financial statements.
Also in March, the European ABS-Program was extended by one year and the pricing was revised.
In May and June 2011, Klöckner & Co issued promissory notes with a total volume of €198 million. The terms and conditions predominately comply with the promissory notes issued during the previous year. The instruments' time to maturity is ranging between 3 and 5 years.
(9) SUBSEQUENT EVENTS No material events have arisen subsequent to the reporting date.
(10) RELATED PARTY TRANSACTIONS Within the framework of its ordinary business activities, the Klöckner & Co Group has business relationships with numerous companies. These also include related parties that were accounted for at cost. Business relations with these companies do not fundamentally differ from trade relationships with other companies. No material transactions were conducted with any of these companies in the year under review.
Certain members of the Supervisory Board were or are Members of the Supervisory Board or Management Board of other entities. Klöckner & Co is holding business relations to certain of such entities. Business with such entities is transacted at arm’s length.

27 13 Interim consolidated financial statements
13 Statement of income
14 Statement of comprehensive income
15 Statement of financial position
17 Statement of cash flows
18 Summary of changes in equity
19 Notes
(11) SEGMENT REPORTING In accordance with internal responsibilities and the management reporting, MSCUSA and Frefer activities were assigned to the former "North America" segment, kept as the segment "Americas" starting in the second quarter in 2011. Comparative information for 2010 is exclusively containing the data of the former "North America" segment.
Europe Americas*) Headquarters/ Consolidation Total
(€ million) 2011 2010 2011 2010 2011 2010 2011 2010
Segment sales 3,905.8 3,207.0 1,450.8 658.8 - - 5,356.6 3,865.8
EBITDA (segment result) 155.2 177.9 67.8 26.6 – 20.0 – 14.3 203.0 190.2
EBIT 115.7 134.0 34.4 8.8 – 20.9 – 15.3 129.2 127.5
Net working capital September 30, 2011 (December 31, 2010) 1,095.8 850.8 589.1 158.2 7.6 8.3 1,692.5 1,017.3
Employees as of September 30, 2011 (December 31, 2010) 8,385 8,187 3,061 1,381 131 131 11,577 9,699
*) 2010: North America
Reconciliation of EBIT to income before taxes:
(€ million) 2011 2010
Earnings before interest and taxes (EBIT) 129.2 127.5
Financial result (Group) – 62.8 – 48.3
Income before taxes (Group) 66.4 79.2
Duisburg, November 9, 2011
Klöckner & Co SE
Management Board

FINANCIAL CALENDAR
March 7, 2012 Annual Financial Statements 2011 Financial statement press conference Analyst conference
May 9, 2012 Q1 interim report 2012 Conference Call with journalists Conference Call with analysts
May 25, 2012 Annual General Meeting 2012 Düsseldorf
August 8, 2012 Q2 interim report 2012 Conference Call with journalists Conference Call with analysts
November 7, 2012 Q3 interim report 2012 Conference Call with journalists Conference Call with analysts
Subject to subsequent changes
CONTACT
Klöckner & Co SE Dr. Thilo Theilen Head of Investor Relations & Corporate Communications Telephone: +49 (0) 203 307-2050 Telefax: +49 (0) 203 307-5025 E-Mail: [email protected]

Disclaimer
This Report (particularly the “Forecast” section) contains forward-looking statements that reflect the current views of the Klöckner & Co SE management with respect to future events. They are generally identified by the words “expect”, “anticipate”, “assume, “intend”, “estimate”, “target”, “aim”, “plan”, “will”, “endeavor”, “outlook” and comparable expressions and include generally any information that relates to expectations or targets for economic conditions, sales or other performance measures.
Forward-looking statements are based on current plans, estimates and projections. You should consider them with caution. Such statements are subject to risks and uncertainties, most of which are difficult to predict and are generally beyond Klöckner & Co SE’s control. Among the relevant factors are the impacts of important strategic and operating initiatives, including the acquisition or disposal of companies.
If these or other risks or uncertainties materialize, or if the assumptions underlying any of the statements prove incorrect, Klöckner & Co SE’s actual results may be materially different from those stated or implied by such statements. Klöckner & Co SE can offer no assurance that its expectations or targets will be achieved.
Without prejudice to existing obligations under capital market law, Klöckner & Co SE does not assume any obligation to update forward-looking statements to take information or future events into account or otherwise.
In addition to the figures prepared in line with IFRS, Klöckner & Co SE presents non-GAAP financial performance measures, e. g. EBITDA, EBIT, net working capital and net financial debt. These non-GAAP measures should be considered in addition to, but not as a substitute for, the information prepared in accordance with IFRS. Non-GAAP measures are not subject to IFRS or to other generally accepted accounting principles. Other companies may define these terms in different ways.