cafr - statistical section - office of financial …820 1,628 1,502 1,470 1,305 556 552 ......
TRANSCRIPT

S t a t e o f W a s h i n g t o n
Statistical Section
271
STATISTICAL SECTION

S t a t e o f W a s h i n g t o n
Statistical Section
272
This page intentionally left blank.
S t a t e o f W a s h i n g t o n
Statistical Section
273
Statistical Section This section of the state of Washington’s comprehensive annual financial report presents detailed information as a context for understanding what the information in the financial statements, note disclosures, and required supplementary information says about the state’s overall financial health. Financial Trends ............................................................................................................................................. 274-285 These schedules contain trend information to help the reader understand how the state’s financial performance and fiscal health has changed over time. Revenue Capacity ........................................................................................................................................... 286-291 These schedules contain information to help the reader assess the state’s most significant revenue sources: Retail sales tax and business and occupation tax. Debt Capacity .................................................................................................................................................... 292-296 These schedules present information to help the reader assess the affordability of the state’s current levels of outstanding debt, and the state’s ability to issue additional debt in the future. Demographic Information ........................................................................................................................ 297-305 These schedules offer demographic and economic indicators to help the reader understand the environment in which the state’s financial activities take place. Operating Information ............................................................................................................................... 306-317 These schedules offer operating data to help the reader understand how the information in the state’s financial report relates to the services it provides and the activities it performs.

S t a t e o f W a s h i n g t o n
Statistical Section
274
FINANCIAL TRENDS Schedule 1 – Net Position by Component Last Ten Fiscal Years (expressed in millions) (accrual basis of accounting)
2016 2015 2014 2013 2012
GOVERNMENTAL ACTIVITIESNet investment in capital assets 19,942$ 19,958$ 19,816$ 19,706$ 19,561$
Restricted 8,518 8,320 6,589 6,524 5,296
Unrestricted (2,691) (3,944) 399 111 233
Total governmental activities net position 25,769$ 24,334$ 26,804$ 26,341$ 25,090$
BUSINESS-TYPE ACTIVITIESNet investment in capital assets 745$ $ 973 $ 625 740$ 797$
Restricted 4,485 4,240 3,815 3,469 3,225
Unrestricted (8,724) (8,945) (8,318) (9,067) (8,599)
Total business-type activities net position (3,494)$ $ (3,732) $ (3,878) (4,858)$ (4,577)$
PRIMARY GOVERNMENTNet investment in capital assets 20,687$ 20,931$ 20,441$ 20,446$ 20,358$
Restricted 13,002 12,560 10,404 9,993 8,521
Unrestricted (11,415) (12,889) (7,919) (8,956) (8,366)
Total primary government net position 22,274$ $ 20,602 $ 22,926 21,483$ 20,513$
COMPONENT UNITSNet investment in capital assets 354$ 379$ 420$ 320$ 322$
Restricted 15 20 22 13 16
Unrestricted 477 432 374 131 109
Total component units net position 846$ $ 831 $ 816 464$ 446$
Figures may not total due to rounding.
Source: Washington State Office of Financial Management, Accounting Division

S t a t e o f W a s h i n g t o n
Statistical Section
275
2011 2010 2009 2008 2007
18,723$ 18,201$ 17,551$ 17,029$ 16,189$
4,847 5,214 4,887 5,524 5,072
1,160 (217) 1,417 3,544 4,269
24,730$ 23,198$ 23,855$ 26,097$ 25,530$
718$ 913$ 721$ 521$ 598$
3,199 2,930 3,800 4,406 3,891
(9,662) (10,864) (9,737) (9,211) (7,256)
(5,745)$ (7,021)$ (5,216)$ (4,284)$ (2,767)$
19,441$ 19,114$ 18,272$ 17,550$ 16,787$
8,046 8,144 8,687 9,930 8,963
(8,502) (11,081) (8,320) (5,667) (2,986)
18,985$ 16,177$ 18,639$ 21,813$ 22,764$
332$ 343$ 354$ 365$ 372$
20 21 23 24 31
102 96 87 82 74
454$ 460$ 464$ 471$ 477$

S t a t e o f W a s h i n g t o n
Statistical Section
276
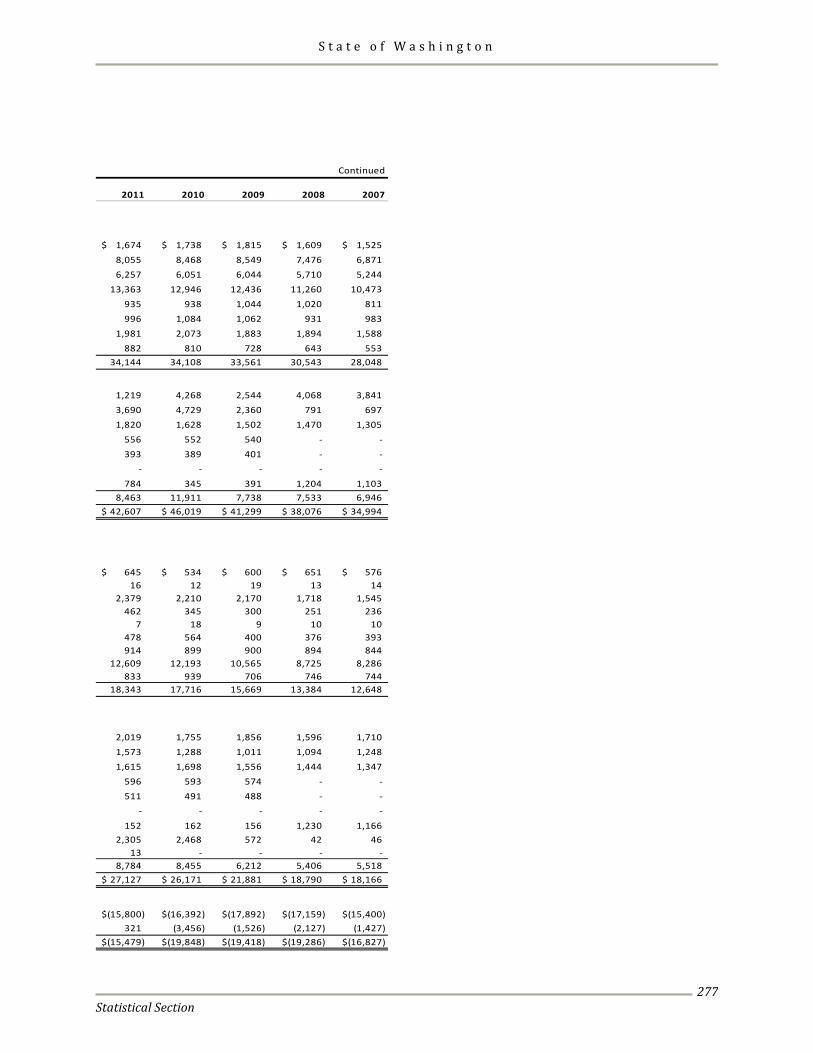
FINANCIAL TRENDS Schedule 2 – Changes in Net Position Last Ten Fiscal Years (expressed in millions) (accrual basis of accounting)
2016 2015 2014 2013 2012
EXPENSESGovernmental activities:
General government 1,658$ 1,987$ 1,607$ 1,537$ 1,219$ Education - elementary and secondary (K-12) 10,153 9,426 8,914 8,237 8,257 Education - higher education 7,531 7,095 6,910 6,992 6,526 Human services 17,209 16,890 15,052 13,182 13,168 Adult corrections 983 956 911 844 886 Natural resources and recreation 1,264 1,335 1,137 1,096 982 Transportation 2,363 2,309 2,400 2,379 2,396 Interest on long-term debt 991 981 938 955 910
Total governmental activities expenses 42,153 40,978 37,869 35,222 34,345
Business-type activities:Workers' compensation 3,238 3,018 3,142 3,329 1,919 Unemployment compensation 1,020 968 1,380 1,983 2,817 Higher education student services 2,495 2,314 2,080 1,927 1,834
Liquor control (1)(2) - - - - 566
Washington's lottery (1) 535 466 463 437 407
Guaranteed education tuition program (3) (152) (585) 185 (105) - Other 161 157 133 126 210
Total business-type activities expenses 7,296 6,338 7,383 7,697 7,754 Total primary government expenses 49,449$ 47,317$ 45,252$ 42,919$ 42,099$
PROGRAM REVENUESGovernmental activities:
Charges for services:General government 853$ 887$ 870$ 977$ 702$ Education - elementary and secondary (K-12) 21 21 26 14 10 Education - higher education 2,762 2,815 2,741 2,760 2,662 Human services 724 659 612 544 531 Adult corrections 7 8 8 8 8 Natural resources and recreation 468 455 510 421 434 Transportation 1,206 1,139 1,082 1,025 878
Operating grants and contributions 15,358 15,158 13,240 12,027 11,790 Capital grants and contributions 1,113 867 1,066 997 944
Total governmental activities program revenues 22,510 22,010 20,155 18,773 17,960
Business-type activities:Charges for services:
Workers' compensation 2,557 2,375 2,237 2,154 2,046 Unemployment compensation 1,139 1,257 1,349 1,308 1,346 Higher education student services 2,395 2,216 1,987 1,857 1,762
Liquor control (1)(2) - - - - 582
Washington's lottery (1) 698 603 595 570 535
Guaranteed education tuition program (3) (348) 53 138 174 - Other 155 126 110 103 121
Operating grants and contributions 70 77 326 870 1,443 Capital grants and contributions - - - - 1
Total business-type activities program revenues 6,666 6,707 6,742 7,036 7,836 Total primary government program revenues 29,176$ 28,717$ 26,897$ 25,809$ 25,796$
NET (EXPENSE)/REVENUEGovernmental activities (19,643)$ (18,969)$ (17,714)$ (16,449)$ (16,385)$ Business-type activities (630) 369 (641) (661) 83 Total primary government net expense (20,273)$ (18,600)$ (18,355)$ (17,110)$ (16,302)$
Refer to footnotes on page 278.
S t a t e o f W a s h i n g t o n
Statistical Section
277
Continued
2011 2010 2009 2008 2007
1,674$ 1,738$ 1,815$ 1,609$ 1,525$ 8,055 8,468 8,549 7,476 6,871 6,257 6,051 6,044 5,710 5,244
13,363 12,946 12,436 11,260 10,473 935 938 1,044 1,020 811 996 1,084 1,062 931 983
1,981 2,073 1,883 1,894 1,588 882 810 728 643 553
34,144 34,108 33,561 30,543 28,048
1,219 4,268 2,544 4,068 3,841 3,690 4,729 2,360 791 697 1,820 1,628 1,502 1,470 1,305
556 552 540 - - 393 389 401 - -
- - - - - 784 345 391 1,204 1,103
8,463 11,911 7,738 7,533 6,946 42,607$ 46,019$ 41,299$ 38,076$ 34,994$
645$ 534$ 600$ 651$ 576$ 16 12 19 13 14
2,379 2,210 2,170 1,718 1,545 462 345 300 251 236
7 18 9 10 10 478 564 400 376 393 914 899 900 894 844
12,609 12,193 10,565 8,725 8,286 833 939 706 746 744
18,343 17,716 15,669 13,384 12,648
2,019 1,755 1,856 1,596 1,710 1,573 1,288 1,011 1,094 1,248 1,615 1,698 1,556 1,444 1,347
596 593 574 - - 511 491 488 - -
- - - - - 152 162 156 1,230 1,166
2,305 2,468 572 42 46 13 - - - -
8,784 8,455 6,212 5,406 5,518 27,127$ 26,171$ 21,881$ 18,790$ 18,166$
(15,800)$ (16,392)$ (17,892)$ (17,159)$ (15,400)$ 321 (3,456) (1,526) (2,127) (1,427)
(15,479)$ (19,848)$ (19,418)$ (19,286)$ (16,827)$

S t a t e o f W a s h i n g t o n
Statistical Section
278
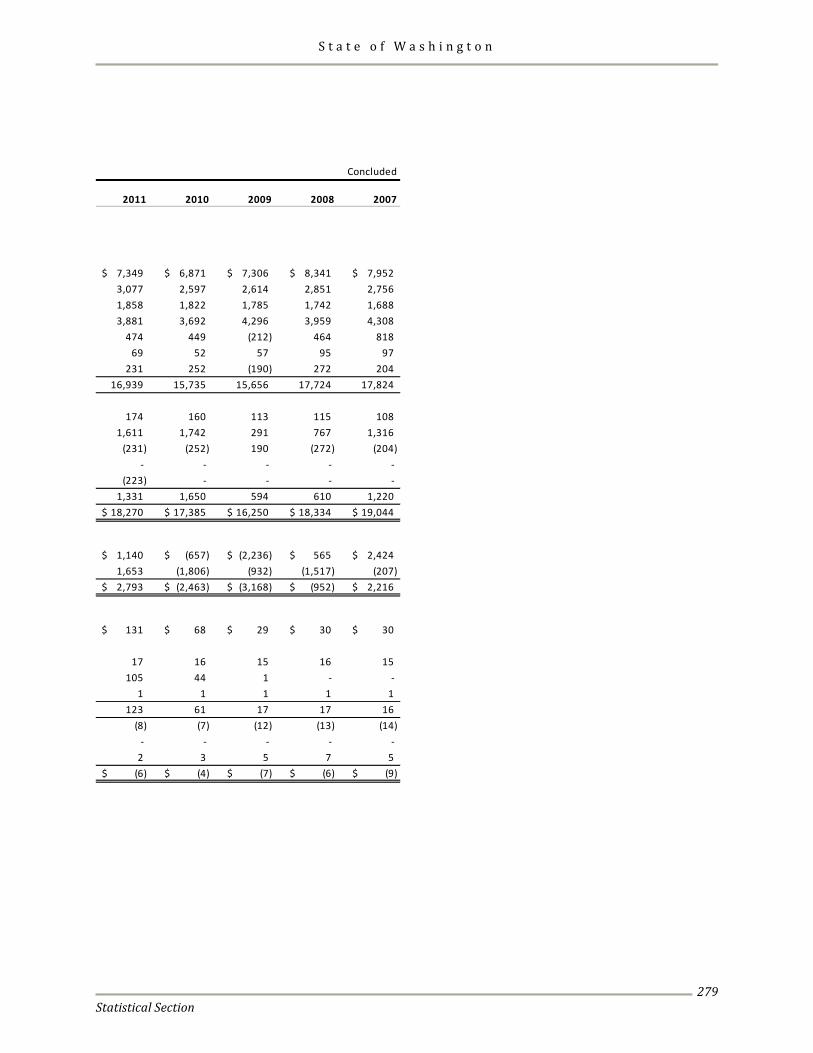
FINANCIAL TRENDS Schedule 2 – Changes in Net Position Last Ten Fiscal Years (expressed in millions) (accrual basis of accounting)
2016 2015 2014 2013 2012
GENERAL REVENUES & OTHER CHANGES IN NET POSITIONGovernmental activities:
Taxes:Sales and use tax 9,740$ 9,001$ 8,365$ 7,710$ 7,349$ Business and occupation 3,636 3,394 3,267 3,294 3,149 Property 2,062 2,018 1,974 1,940 1,897 Other 5,254 3,719 4,244 4,128 3,946
Interest and investment earnings (loss) 168 307 621 397 169 Contributions to endowments 66 65 66 63 47 Transfers 152 136 94 114 165
Total governmental activities 21,078 18,641 18,631 17,646 16,722 Business-type activities:
Taxes - other 21 20 22 22 72 Interest and investment earnings 999 377 1,618 523 1,150 Transfers (152) (136) (94) (114) (165)
Other general revenue (4) - - - - 30
Special item (5) - - - - - Total business-type activities 868 261 1,546 431 1,088
Total primary government 21,946$ 18,902$ 20,177$ 18,077$ 17,810$
CHANGE IN NET POSITIONGovernmental activities 1,435$ (328)$ 917$ 1,197$ 337$ Business-type activities 237 630 905 (230) 1,171 Total primary government 1,672$ 302$ 1,822$ 967$ 1,508$
COMPONENT UNITSTotal expenses 1,165$ 1,080$ 859$ 46$ 60$ Program revenues:
Charges for services 1,093 945 802 33 18 Operating grants and contributions 68 126 95 29 32 Capital grants and contributions - - - 2 1
Total program revenues 1,161 1,071 897 64 51 Net (expense) / revenue (4) (9) 38 18 (9) General revenues - property taxes and other 20 18 17 - - General revenues - interest and investment earnings (loss) 9 5 (14) - 2 Total component units - change in net position 25$ 14$ 41$ 18$ (8)$
(1) Liquor control and Washington's lottery were separated from other business-type activities in 2009.(2) The Liquor control distribution and sale of spirits ceased with the passage of Initative 1183. The remaining
activities of Liquor control for enforcement and regulation of alcohol and tobacco sales were reclassified to a governmental activity.
(3) Guaranteed education tuition program was separated from other business-type activities in 2013.(4) Liquor and Cannabis Board auctioned off "Right to Sell" at state owned liquor stores as part
of the closeout process in 2012.(5) The Convention and Trade Center was transferred to another government in 2011.
Figures may not total due to rounding.
Source: Washington State Office of Financial Management, Accounting Division
S t a t e o f W a s h i n g t o n
Statistical Section
279
Concluded
2011 2010 2009 2008 2007
7,349$ 6,871$ 7,306$ 8,341$ 7,952$ 3,077 2,597 2,614 2,851 2,756 1,858 1,822 1,785 1,742 1,688 3,881 3,692 4,296 3,959 4,308
474 449 (212) 464 818 69 52 57 95 97
231 252 (190) 272 204 16,939 15,735 15,656 17,724 17,824
174 160 113 115 108 1,611 1,742 291 767 1,316
(231) (252) 190 (272) (204) - - - - -
(223) - - - - 1,331 1,650 594 610 1,220
18,270$ 17,385$ 16,250$ 18,334$ 19,044$
1,140$ (657)$ (2,236)$ 565$ 2,424$ 1,653 (1,806) (932) (1,517) (207) 2,793$ (2,463)$ (3,168)$ (952)$ 2,216$
131$ 68$ 29$ 30$ 30$
17 16 15 16 15 105 44 1 - -
1 1 1 1 1 123 61 17 17 16
(8) (7) (12) (13) (14) - - - - -
2 3 5 7 5 (6)$ (4)$ (7)$ (6)$ (9)$
S t a t e o f W a s h i n g t o n
Statistical Section
280
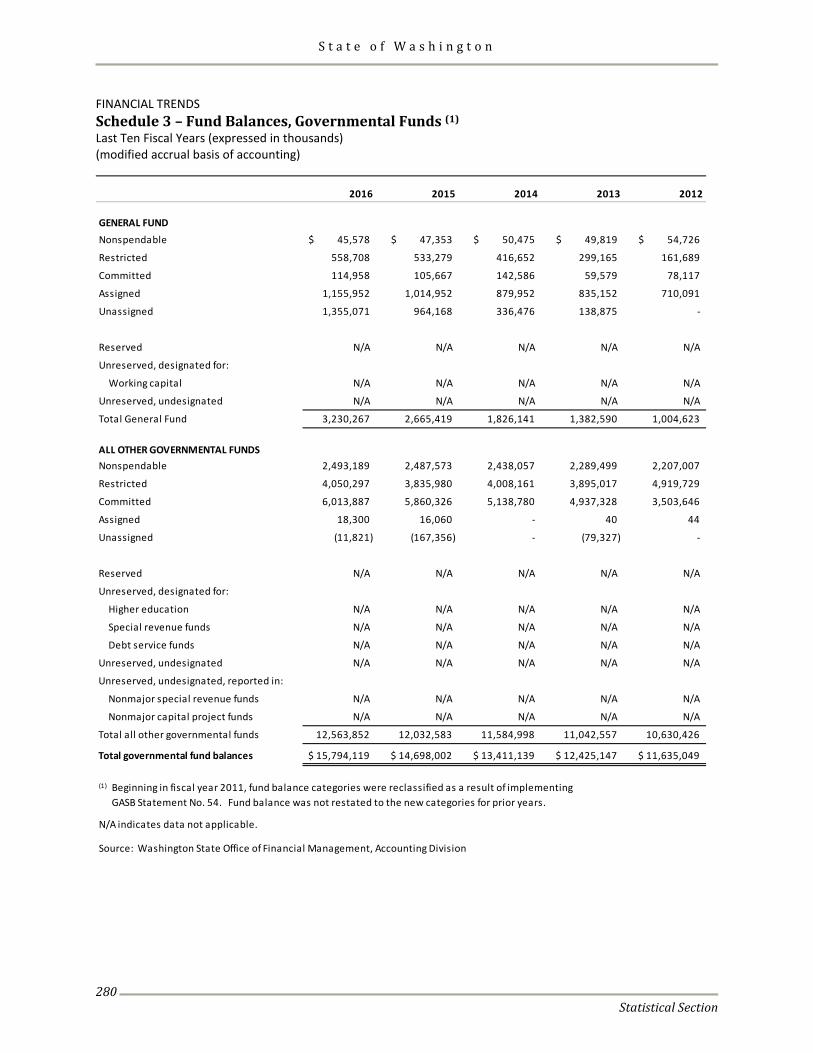
FINANCIAL TRENDS Schedule 3 – Fund Balances, Governmental Funds (1) Last Ten Fiscal Years (expressed in thousands) (modified accrual basis of accounting)
2016 2015 2014 2013 2012
GENERAL FUNDNonspendable 45,578$ 47,353$ 50,475$ 49,819$ 54,726$
Restricted 558,708 533,279 416,652 299,165 161,689
Committed 114,958 105,667 142,586 59,579 78,117
Assigned 1,155,952 1,014,952 879,952 835,152 710,091
Unassigned 1,355,071 964,168 336,476 138,875 -
Reserved N/A N/A N/A N/A N/A
Unreserved, designated for:
Working capital N/A N/A N/A N/A N/A
Unreserved, undesignated N/A N/A N/A N/A N/A
Total General Fund 3,230,267 2,665,419 1,826,141 1,382,590 1,004,623
ALL OTHER GOVERNMENTAL FUNDSNonspendable 2,493,189 2,487,573 2,438,057 2,289,499 2,207,007
Restricted 4,050,297 3,835,980 4,008,161 3,895,017 4,919,729
Committed 6,013,887 5,860,326 5,138,780 4,937,328 3,503,646
Assigned 18,300 16,060 - 40 44
Unassigned (11,821) (167,356) - (79,327) -
Reserved N/A N/A N/A N/A N/A
Unreserved, designated for:
Higher education N/A N/A N/A N/A N/A
Special revenue funds N/A N/A N/A N/A N/A
Debt service funds N/A N/A N/A N/A N/A
Unreserved, undesignated N/A N/A N/A N/A N/A
Unreserved, undesignated, reported in:
Nonmajor special revenue funds N/A N/A N/A N/A N/A
Nonmajor capital project funds N/A N/A N/A N/A N/A
Total all other governmental funds 12,563,852 12,032,583 11,584,998 11,042,557 10,630,426
Total governmental fund balances 15,794,119$ 14,698,002$ 13,411,139$ 12,425,147$ 11,635,049$
(1) Beginning in fiscal year 2011, fund balance categories were reclassified as a result of implementingGASB Statement No. 54. Fund balance was not restated to the new categories for prior years.
N/A indicates data not applicable.
Source: Washington State Office of Financial Management, Accounting Division

S t a t e o f W a s h i n g t o n
Statistical Section
281
2011 2010 2009 2008 2007
89,916$ N/A N/A N/A N/A
23,273 N/A N/A N/A N/A
98,077 N/A N/A N/A N/A
1,114,699 N/A N/A N/A N/A
(107,764) N/A N/A N/A N/A
N/A 76,164$ 74,929$ 200,794$ 119,687$
N/A 863,652 897,763 1,040,563 1,002,963
N/A (561,067) 189,258 677,431 780,510
1,218,201 378,749 1,161,950 1,918,788 1,903,160
3,664,194 N/A N/A N/A N/A
3,790,577 N/A N/A N/A N/A
2,052,523 N/A N/A N/A N/A
45 N/A N/A N/A N/A
(174,472) N/A N/A N/A N/A
N/A 6,298,440 4,993,402 6,549,844 5,435,860
N/A 107,624 155,679 155,679 155,679
N/A 157 165 220 221
N/A 170,200 267,470 362,122 220,474
N/A 2,297,145 814,231 1,006,121 1,151,829
N/A 1,219,705 1,848,410 2,432,112 3,040,036
N/A 69,192 307,556 106,741 246,060
9,332,867 10,162,463 8,386,913 10,612,839 10,250,159
10,551,068$ 10,541,212$ 9,548,863$ 12,531,627$ 12,153,319$

S t a t e o f W a s h i n g t o n
Statistical Section
282
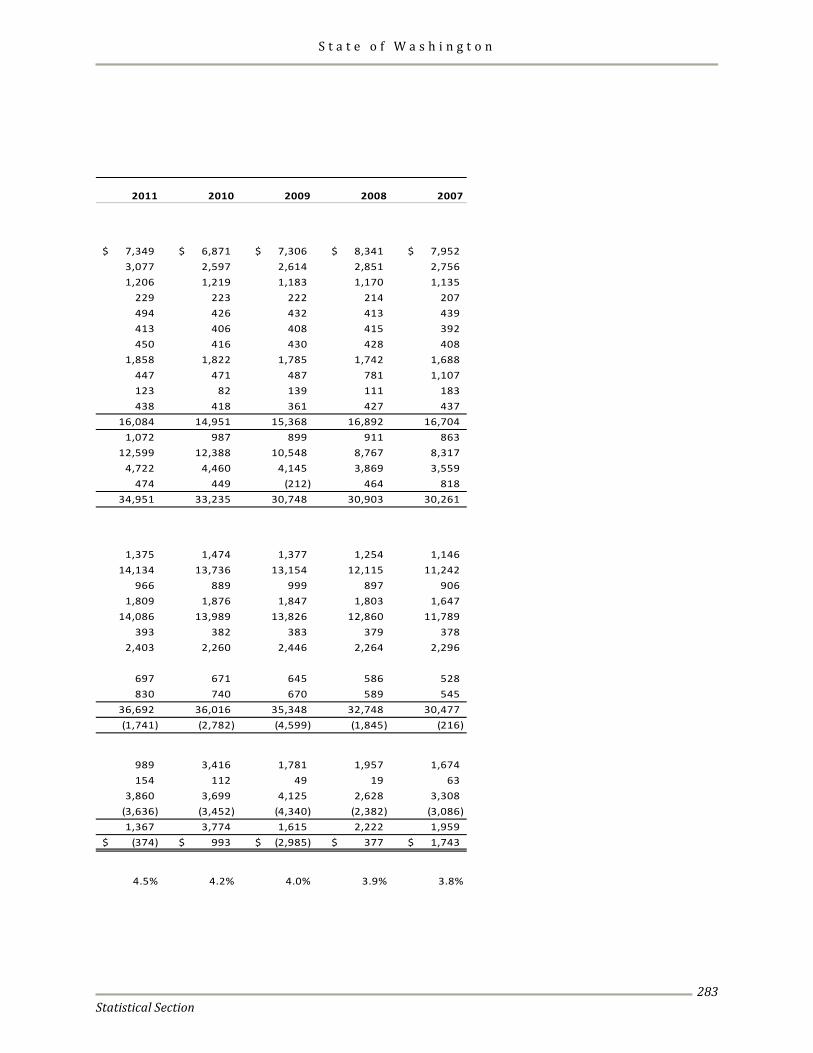
FINANCIAL TRENDS Schedule 4 – Revenues, Expenditures, and Other Financing Sources (Uses) All Governmental Fund Types Last Ten Fiscal Years (expressed in millions)
2016 2015 2014 2013 2012
REVENUESTaxes:
Retail sales and use 9,740$ 9,001$ 8,365$ 7,710$ 7,349$ Business and occupation 3,636 3,394 3,267 3,294 3,149 Motor vehicle and fuel 1,486 1,253 1,215 1,195 1,178 Liquor, beer, and wine 348 331 321 365 323 Cigarette and tobacco 451 474 443 465 471 Insurance premiums 535 556 467 436 430 Public utilities 469 455 464 440 438 Property 2,062 2,018 1,974 1,940 1,897 Excise 1,203 927 717 651 495 Gift and inheritance 136 150 157 104 105 Other taxes 430 410 474 444 424
Total Taxes 20,496 18,969 17,864 17,044 16,260 Licenses, permits, and fees 1,766 1,660 1,627 1,599 1,244 Federal grants-in-aid 15,034 14,712 13,168 11,889 11,905 Charges and miscellaneous revenue 5,831 5,751 5,369 5,321 4,852 Investment income (loss) 168 307 621 397 169 Total Revenues 43,295 41,399 38,649 36,250 34,431
EXPENDITURESCurrent:
General government 1,289 1,330 1,280 1,162 1,169 Human services 18,037 17,566 15,733 13,957 13,903 Natural resources and recreation 1,214 1,239 1,037 1,043 920 Transportation 1,955 1,883 1,817 1,797 1,788 Education 16,922 15,915 15,130 14,551 14,275
Intergovernmental 492 465 456 440 399 Capital outlays 2,200 2,247 2,293 2,456 2,224 Debt service:
Principal 1,040 944 868 784 728 Interest 999 982 939 921 884
Total Expenditures 44,147 42,572 39,552 37,111 36,288 Revenues Over (Under) Expenditures (852) (1,174) (903) (861) (1,858)
OTHER FINANCING SOURCES (USES):Bonds issued, net of refunding 1,709 1,368 2,038 1,344 2,759 Other debt issued, net of refunding 102 31 45 156 21 Transfers in 4,317 5,062 4,356 3,152 2,669 Transfers out (4,180) (4,937) (4,274) (3,051) (2,517)
Net Other Financing Sources (Uses) 1,948 1,524 2,165 1,601 2,931 Net Change in Fund Balances 1,096$ 350$ 1,262$ 740$ 1,074$
Debt service as a percentage ofnoncapital expenditures (1) 4.8% 4.7% 4.8% 4.9% 4.7%
(1) Percentage is calculated by dividing principal and interest by total expenditures less capital outlays. The capital outlays total can be found on the Reconciliation of the Statement of Revenues, Expenditures
and Changes in Fund Balancees to the Statement of Activities.
Figures may not total due to rounding.Source: Washington State Office of Financial Management, Accounting Division
S t a t e o f W a s h i n g t o n
Statistical Section
283
2011 2010 2009 2008 2007
7,349$ 6,871$ 7,306$ 8,341$ 7,952$ 3,077 2,597 2,614 2,851 2,756 1,206 1,219 1,183 1,170 1,135
229 223 222 214 207 494 426 432 413 439 413 406 408 415 392 450 416 430 428 408
1,858 1,822 1,785 1,742 1,688 447 471 487 781 1,107 123 82 139 111 183 438 418 361 427 437
16,084 14,951 15,368 16,892 16,704 1,072 987 899 911 863
12,599 12,388 10,548 8,767 8,317 4,722 4,460 4,145 3,869 3,559
474 449 (212) 464 818 34,951 33,235 30,748 30,903 30,261
1,375 1,474 1,377 1,254 1,146 14,134 13,736 13,154 12,115 11,242
966 889 999 897 906 1,809 1,876 1,847 1,803 1,647
14,086 13,989 13,826 12,860 11,789 393 382 383 379 378
2,403 2,260 2,446 2,264 2,296
697 671 645 586 528 830 740 670 589 545
36,692 36,016 35,348 32,748 30,477 (1,741) (2,782) (4,599) (1,845) (216)
989 3,416 1,781 1,957 1,674 154 112 49 19 63
3,860 3,699 4,125 2,628 3,308 (3,636) (3,452) (4,340) (2,382) (3,086) 1,367 3,774 1,615 2,222 1,959
(374)$ 993$ (2,985)$ 377$ 1,743$
4.5% 4.2% 4.0% 3.9% 3.8%

S t a t e o f W a s h i n g t o n
Statistical Section
284
FINANCIAL TRENDS Schedule 5 – Revenues, Expenditures, and Other Financing Sources (Uses) General Fund Last Ten Fiscal Years (expressed in millions)
2016 2015 2014 2013 2012
REVENUESTaxes:
Retail sales and use 9,623$ 8,903$ 8,275$ 7,629$ 7,274$ Business and occupation 3,632 3,389 3,262 3,291 3,145 Liquor, beer, and wine 284 282 274 340 296 Cigarette and tobacco 451 474 443 465 471 Insurance premiums 510 529 457 426 421 Public utilities 449 437 447 423 427 Property 2,062 2,018 1,974 1,940 1,897 Excise 933 787 650 583 434 Gift and inheritance - (1) - 3 - Other taxes 245 207 226 194 183
Total Taxes 18,189 17,025 16,008 15,294 14,547 Licenses, permits, and fees 116 115 108 105 99 Federal grants-in-aid 12,196 12,053 10,226 8,780 8,824 Charges and miscellaneous revenue 611 583 506 540 520 Investment income (loss) 26 8 7 (17) (6) Total Revenues 31,138 29,784 26,855 24,702 23,983
EXPENDITURESCurrent:
General government 802 846 833 721 745 Human services 17,072 16,794 14,920 13,236 13,209 Natural resources and recreation 534 445 409 420 373 Transportation 67 37 42 48 42 Education 11,403 10,177 9,754 9,115 9,169
Intergovernmental 119 117 114 108 105 Capital outlays 111 52 51 76 67 Debt service:
Principal 8 8 9 18 16 Interest 3 1 3 - 1
Total Expenditures 30,121 28,477 26,134 23,742 23,728
Revenues Over (Under) Expenditures 1,016 1,308 721 960 256
OTHER FINANCING SOURCES (USES)Bonds issued, net of refunding 102 192 170 127 76 Other debt issued, net of refunding 75 7 - 4 15 Transfers in 577 466 518 596 496 Transfers out (1,205) (1,119) (965) (1,312) (1,056) Net Other Financing Sources (Uses) (452) (454) (277) (585) (470)
Net Change in Fund Balances 565$ 854$ 444$ 375$ (214)$
Figures may not total due to rounding.
Source: Washington State Office of Financial Management, Accounting Division

S t a t e o f W a s h i n g t o n
Statistical Section
285
2011 2010 2009 2008 2007
7,275$ 6,802$ 7,234$ 8,256$ 7,870$ 3,072 2,593 2,530 2,760 2,685
202 198 163 157 154 498 349 68 47 58 404 397 253 261 249 449 400 417 415 395
1,858 1,822 1,529 1,495 1,442 414 418 433 707 1,014
1 - - 4 4 250 192 163 205 226
14,424 13,169 12,791 14,307 14,097 88 86 95 97 92
9,597 9,648 8,311 6,557 6,204 556 481 326 364 327 (15) (9) 64 123 106
24,650 23,375 21,587 21,449 20,826
923 822 726 663 640 13,473 13,209 11,912 10,921 10,191
388 360 340 336 361 41 44 37 42 39
9,211 9,243 9,044 8,235 7,765 102 30 32 31 30
49 54 69 57 49
16 20 18 15 15 1 1 1 - -
24,203 23,783 22,179 20,300 19,090
447 (408) (592) 1,149 1,736
340 - - - - 14 4 27 12 5
939 1,187 952 72 128 (1,154) (1,566) (1,144) (1,217) (1,843)
139 (375) (165) (1,133) (1,710)
586$ (783)$ (757)$ 16$ 26$

S t a t e o f W a s h i n g t o n
Statistical Section
286
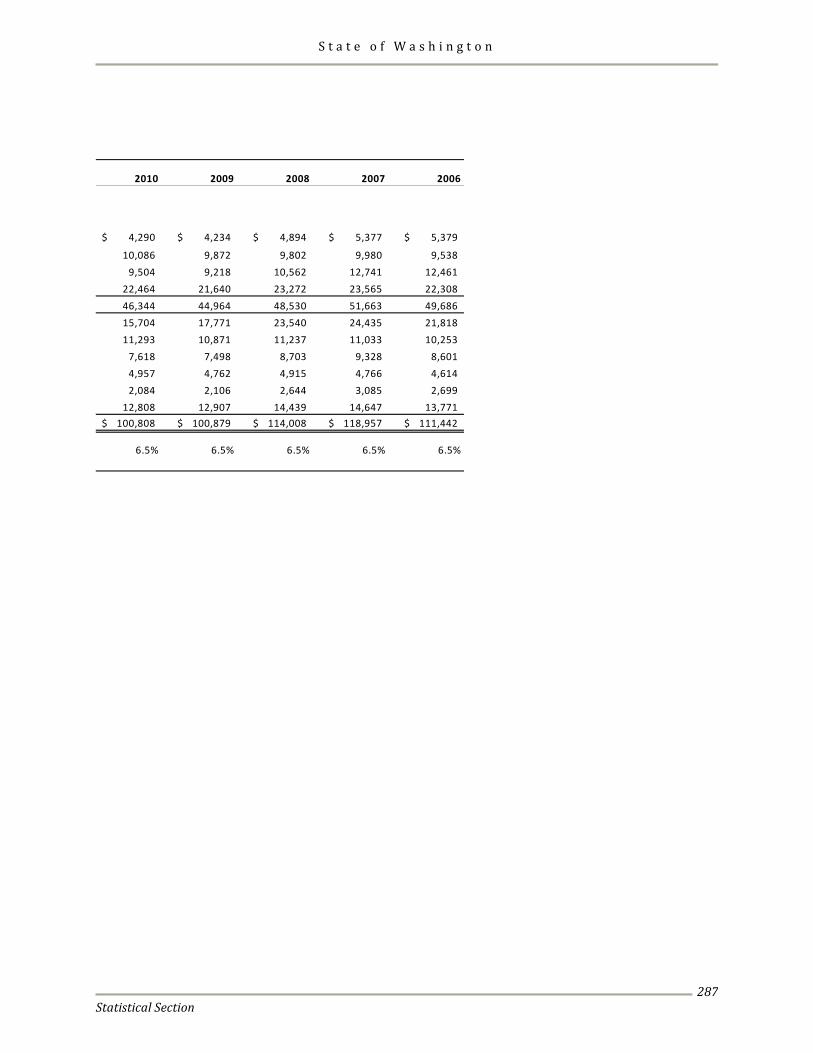
REVENUE CAPACITY Schedule 6 – Sales Subject to Retail Sales Tax by Industry Last Ten Calendar Years (expressed in millions)
Industry (1) 2015 2014 2013 2012 2011
Retail trade:Building materials, garden equipment
and supplies 5,909$ 5,348$ 4,982$ 4,537$ 4,280$
General merchandise stores 11,086 10,711 10,511 10,311 10,063 Motor vehicles & parts 14,987 13,540 12,565 11,359 10,178 All other retail trade 27,691 26,725 25,582 24,261 23,436
Total retail sales 59,673 56,324 53,640 50,468 47,957 Construction 24,459 21,086 19,256 16,628 15,445 Accommodations & food services 15,677 14,365 13,334 12,611 11,866 Wholesale trade 9,295 9,053 8,750 8,266 8,048 Information 6,754 5,972 5,429 5,117 4,997 Manufacturing 2,589 2,478 2,286 2,114 2,207 All other industries 16,917 15,566 14,506 13,849 13,221 Total sales subject to retail sales tax 135,364$ 124,844$ 117,201$ 109,053$ 103,741$
Direct retail sales tax rate (2) 6.5% 6.5% 6.5% 6.5% 6.5%
(1) Industry classifications are based on North American Industry Classification System (NAICS) codes.(2) State retail sales tax rate only; excludes local retail sales tax rate.
Source: Washington State Department of Revenue, Quarterly Business Review
S t a t e o f W a s h i n g t o n
Statistical Section
287
2010 2009 2008 2007 2006
4,290$ 4,234$ 4,894$ 5,377$ 5,379$
10,086 9,872 9,802 9,980 9,538 9,504 9,218 10,562 12,741 12,461
22,464 21,640 23,272 23,565 22,308 46,344 44,964 48,530 51,663 49,686 15,704 17,771 23,540 24,435 21,818 11,293 10,871 11,237 11,033 10,253
7,618 7,498 8,703 9,328 8,601 4,957 4,762 4,915 4,766 4,614 2,084 2,106 2,644 3,085 2,699
12,808 12,907 14,439 14,647 13,771 100,808$ 100,879$ 114,008$ 118,957$ 111,442$
6.5% 6.5% 6.5% 6.5% 6.5%

S t a t e o f W a s h i n g t o n
Statistical Section
288
REVENUE CAPACITY Schedule 7 – Number of Retail Sales Taxpayers by Industry Current Calendar Year and Nine Years Ago
Percent PercentNumber of of Total Number of of Total
Industry (1) Businesses Rank Businesses Businesses Rank Businesses
Retail trade 50,590 1 25.0% 51,031 1 26.5%
Construction 39,482 2 19.5% 39,120 2 20.3%
Other services (2) 20,084 3 9.9% 21,254 3 11.0%
Management, education & health services 19,629 4 9.7% 17,444 4 9.0%
Accommodations & food services 18,930 5 9.3% 16,943 5 8.8%
Professional, scientific & technical services 13,446 6 6.6% 12,080 7 6.3%
All other industries (3) 12,237 7 6.0% 12,157 6 6.3%
Manufacturing 11,393 8 5.6% 8,575 9 4.4%
Wholesale trade 10,884 9 5.4% 10,142 8 5.3%
Arts, entertainment & recreation 5,875 10 3.0% 4,095 10 2.1%
Total 202,550 100% 192,841 100%
(1)
of Washington is legally prohibited from disclosing the names of individual taxpayers. The information in this table is intended to assist readers in understanding the degree to which the state's retail sales tax revenuemay be concentrated.
(2) Other services consist of repair and maintenance, personal service, and religious, civic and other organizations.(3) All other industries include real estate and rental leasing, transportation and warehousing, and information.
Source: Washington State Department of Revenue
2006
Industry classifications are based on North American Industry Classification System (NAICS) codes. The state
2015

S t a t e o f W a s h i n g t o n
Statistical Section
289
REVENUE CAPACITY Schedule 8 – Number of Business and Occupation (B&O) Taxpayers by Industry Current Calendar Year and Nine Years Ago
Percent PercentNumber of of Total Number of of TotalBusinesses Rank Businesses Businesses Rank Businesses
Retailing 195,093 1 40.1% 176,243 1 42.1%Service and other activities, and gambling
contests less than $50,000/year 168,652 2 34.7% 128,590 2 30.7%Wholesaling 89,105 3 18.3% 83,879 3 20.0%Manufacturing 10,079 4 2.1% 10,237 4 2.4%
Other B&O tax classifications 7,012 5 1.4% 6,765 5 1.6%Insurance agents/insurance brokers commissions 5,780 6 1.2% 4,768 6 1.1%Royalties and child care 4,139 7 0.9% 2,846 7 0.7%Warehousing, radio and TV broadcasting, public
road construction, and government contracting 2,256 8 0.5% 2,355 8 0.6%Travel agent commissions/international
charter, freight brokers, and stevedoring 1,985 9 0.4% 1,455 10 0.4%Processing for hire, and printing and publishing 1,758 10 0.4% 1,745 9 0.4%
Total 485,859 100% 418,883 100%
(1)
Source: Washington State Department of Revenue
in understanding the degree to which the state's business and occupation tax revenue may be concentrated.
2006
Industry classifications are based on North American Industry Classification System (NAICS) codes. The state of Washington is
Industry (1)
2015
legally prohibited from disclosing the names of individual taxpayers. The information in this table is intended to assist readers

S t a t e o f W a s h i n g t o n
Statistical Section
290
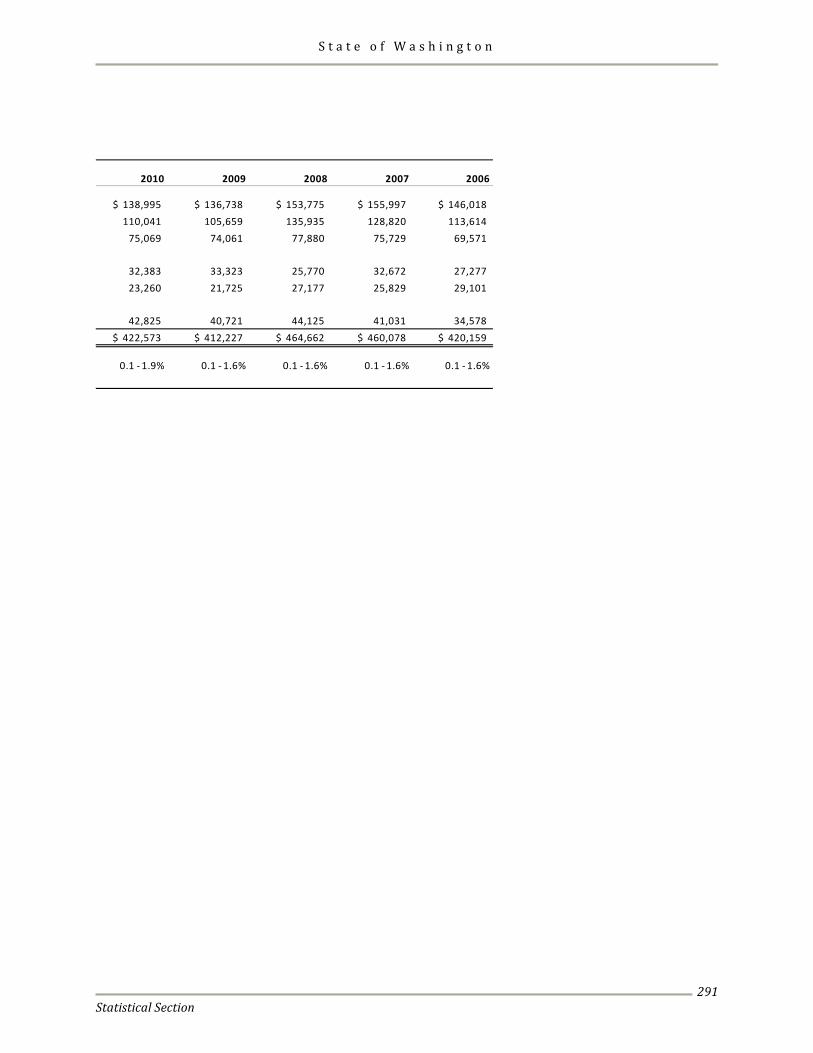
REVENUE CAPACITY Schedule 9 – Taxable Sales by Business and Occupation Tax Classification Last Ten Calendar Years (expressed in millions)
Industry (1) 2015 2014 2013 2012 2011
Retailing $ 181,856 $ 173,663 $ 163,752 $ 153,467 $ 146,698Wholesaling 142,875 142,992 136,837 131,471 125,471 Service and other activities 101,555 93,327 88,826 83,537 78,617
Manufacturing, wholesaling, andretailing of airplanes and components 63,497 61,433 54,744 48,788 35,414
Manufacturing 25,188 28,848 28,320 26,556 26,020
Other business & occupationtax classifications 53,897 52,131 48,833 46,974 46,173
Total $ 568,868 $ 552,394 $ 521,312 $ 490,793 $ 458,393
State B&O tax rate range 0.1 - 1.6% 0.1 - 1.6% 0.1 - 1.6% 0.1 - 1.9% 0.1 - 1.9%
(1) Industry classifications are based on North American Industry Classification System (NAICS) codes.
Source: Washington State Department of Revenue, Quarterly Business Review
S t a t e o f W a s h i n g t o n
Statistical Section
291
2010 2009 2008 2007 2006
$ 138,995 $ 136,738 $ 153,775 $ 155,997 $ 146,018110,041 105,659 135,935 128,820 113,614
75,069 74,061 77,880 75,729 69,571
32,383 33,323 25,770 32,672 27,277 23,260 21,725 27,177 25,829 29,101
42,825 40,721 44,125 41,031 34,578 $ 422,573 $ 412,227 $ 464,662 $ 460,078 $ 420,159
0.1 - 1.9% 0.1 - 1.6% 0.1 - 1.6% 0.1 - 1.6% 0.1 - 1.6%
S t a t e o f W a s h i n g t o n
Statistical Section
292
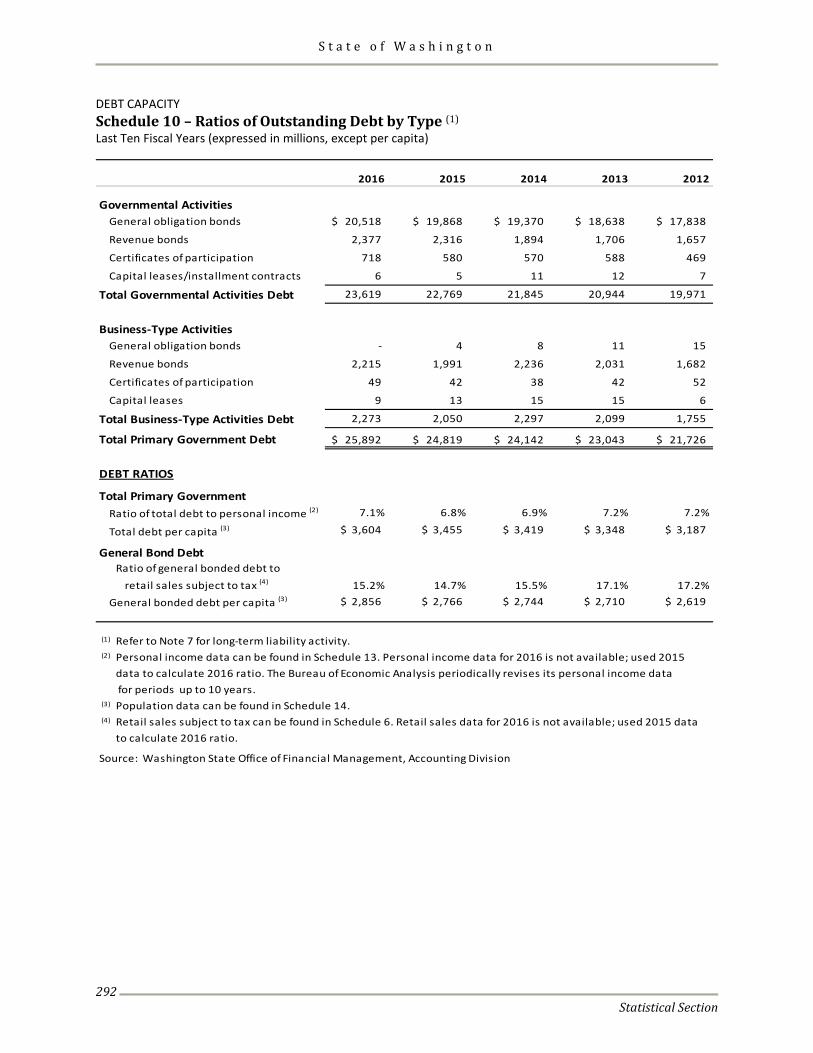
DEBT CAPACITY Schedule 10 – Ratios of Outstanding Debt by Type (1) Last Ten Fiscal Years (expressed in millions, except per capita)
2016 2015 2014 2013 2012
Governmental ActivitiesGeneral obligation bonds 20,518$ 19,868$ 19,370$ 18,638$ 17,838$
Revenue bonds 2,377 2,316 1,894 1,706 1,657
Certificates of participation 718 580 570 588 469
Capital leases/installment contracts 6 5 11 12 7
Total Governmental Activities Debt 23,619 22,769 21,845 20,944 19,971
Business-Type ActivitiesGeneral obligation bonds - 4 8 11 15
Revenue bonds 2,215 1,991 2,236 2,031 1,682
Certificates of participation 49 42 38 42 52
Capital leases 9 13 15 15 6
Total Business-Type Activities Debt 2,273 2,050 2,297 2,099 1,755
Total Primary Government Debt 25,892$ 24,819$ 24,142$ 23,043$ 21,726$
DEBT RATIOS
Total Primary GovernmentRatio of total debt to personal income (2) 7.1% 6.8% 6.9% 7.2% 7.2%
Total debt per capita (3) $ 3,604 $ 3,455 $ 3,419 $ 3,348 $ 3,187
General Bond DebtRatio of general bonded debt to retail sales subject to tax (4) 15.2% 14.7% 15.5% 17.1% 17.2%
General bonded debt per capita (3) $ 2,856 $ 2,766 $ 2,744 $ 2,710 $ 2,619
(1) Refer to Note 7 for long-term liability activity.(2) Personal income data can be found in Schedule 13. Personal income data for 2016 is not available; used 2015
for periods up to 10 years.(3)
(4)
to calculate 2016 ratio.
Source: Washington State Office of Financial Management, Accounting Division
data to calculate 2016 ratio. The Bureau of Economic Analysis periodically revises its personal income data
Population data can be found in Schedule 14. Retail sales subject to tax can be found in Schedule 6. Retail sales data for 2016 is not available; used 2015 data

S t a t e o f W a s h i n g t o n
Statistical Section
293
2011 2010 2009 2008 2007
16,750$ 16,540$ 14,049$ 12,927$ 11,573$
740 743 616 555 608
482 449 395 383 382
6 14 10 15 20
17,978 17,746 15,070 13,880 12,583
18 60 69 80 101
1,423 1,084 1,074 1,115 889
62 293 310 261 246
6 6 10 15 21
1,509 1,443 1,463 1,471 1,257
19,487$ 19,189$ 16,533$ 15,351$ 13,840$
6.5% 6.8% 6.0% 5.3% 5.1%$ 2,879 $ 2,854 $ 2,478 $ 2,323 $ 2,121
16.2% 16.5% 14.0% 11.4% 9.8%$ 2,478 $ 2,469 $ 2,116 $ 1,968 $ 1,789
S t a t e o f W a s h i n g t o n
Statistical Section
294
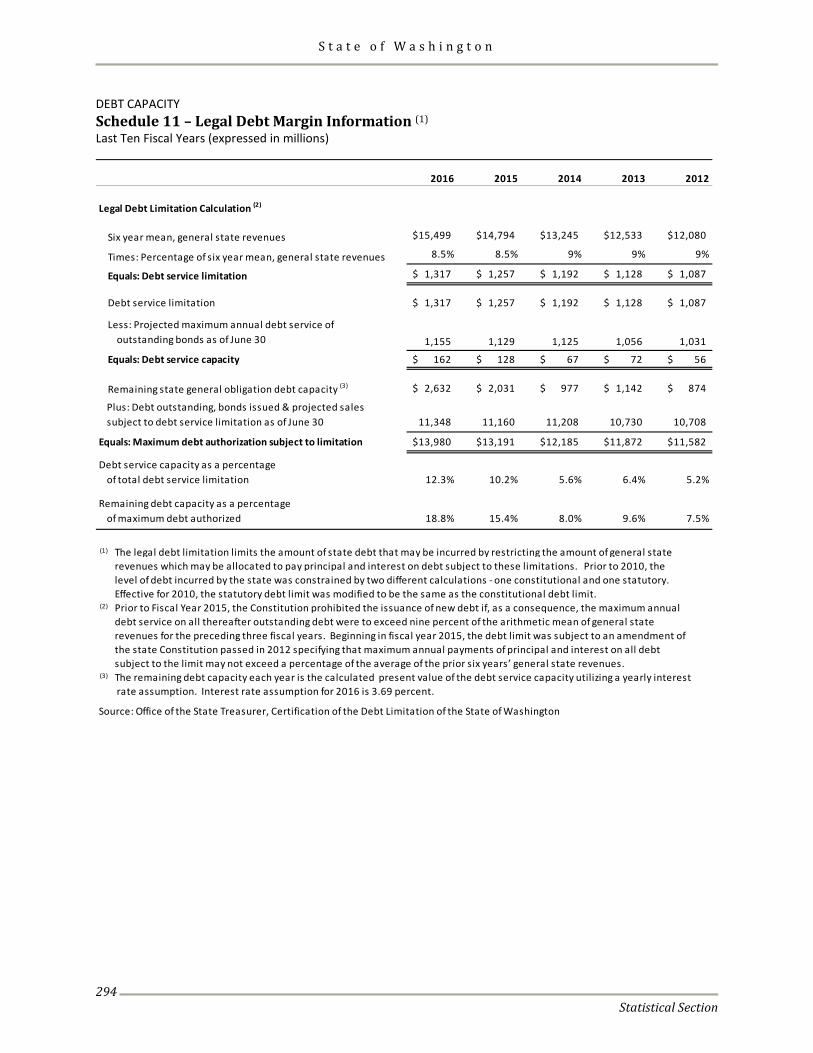
DEBT CAPACITY Schedule 11 – Legal Debt Margin Information (1) Last Ten Fiscal Years (expressed in millions)
2016 2015 2014 2013 2012
Legal Debt Limitation Calculation (2)
Six year mean, general state revenues 15,499$ 14,794$ 13,245$ 12,533$ 12,080$
Times: Percentage of six year mean, general state revenues 8.5% 8.5% 9% 9% 9%
Equals: Debt service limitation 1,317$ 1,257$ 1,192$ 1,128$ 1,087$
Debt service limitation 1,317$ 1,257$ 1,192$ 1,128$ 1,087$
Less: Projected maximum annual debt service ofoutstanding bonds as of June 30 1,155 1,129 1,125 1,056 1,031
Equals: Debt service capacity 162$ 128$ 67$ 72$ 56$
Remaining state general obligation debt capacity (3) 2,632$ 2,031$ 977$ 1,142$ 874$
Plus: Debt outstanding, bonds issued & projected sales subject to debt service limitation as of June 30 11,348 11,160 11,208 10,730 10,708
Equals: Maximum debt authorization subject to limitation 13,980$ 13,191$ 12,185$ 11,872$ 11,582$
Debt service capacity as a percentage of total debt service limitation 12.3% 10.2% 5.6% 6.4% 5.2%
Remaining debt capacity as a percentage of maximum debt authorized 18.8% 15.4% 8.0% 9.6% 7.5%
(1)
(2) Prior to Fiscal Year 2015, the Constitution prohibited the issuance of new debt if, as a consequence, the maximum annual debt service on all thereafter outstanding debt were to exceed nine percent of the arithmetic mean of general state revenues for the preceding three fiscal years. Beginning in fiscal year 2015, the debt limit was subject to an amendment of the state Constitution passed in 2012 specifying that maximum annual payments of principal and interest on all debt subject to the limit may not exceed a percentage of the average of the prior six years’ general state revenues.
(3) The remaining debt capacity each year is the calculated present value of the debt service capacity utilizing a yearly interest rate assumption. Interest rate assumption for 2016 is 3.69 percent.
Source: Office of the State Treasurer, Certification of the Debt Limitation of the State of Washington
The legal debt limitation limits the amount of state debt that may be incurred by restricting the amount of general state revenues which may be allocated to pay principal and interest on debt subject to these limitations. Prior to 2010, the level of debt incurred by the state was constrained by two different calculations - one constitutional and one statutory. Effective for 2010, the statutory debt limit was modified to be the same as the constitutional debt limit.

S t a t e o f W a s h i n g t o n
Statistical Section
295
2011 2010 2009 2008 2007
12,176$ 12,518$ 14,422$ 13,545$ 10,315$
9% 9% 7% 7% 9%
1,096$ 1,127$ 1,010$ 948$ 928$
1,096$ 1,127$ 1,010$ 948$ 928$
995 971 797 747 772
101$ 156$ 213$ 201$ 156$
1,425$ 2,267$ 2,791$ 2,889$ 2,390$
10,470 10,163 8,032 7,244 7,439
11,895$ 12,430$ 10,823$ 10,133$ 9,829$
9.2% 13.8% 21.1% 21.2% 16.8%
12.0% 18.2% 25.8% 28.5% 24.3%
S t a t e o f W a s h i n g t o n
Statistical Section
296
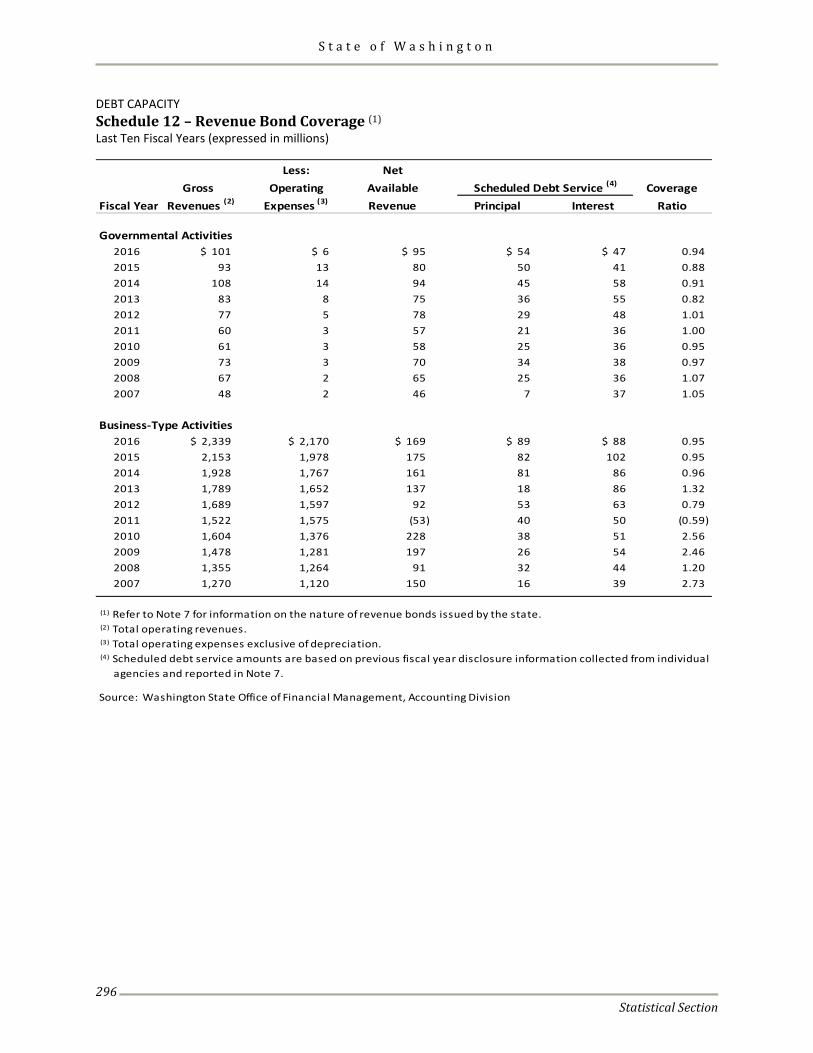
DEBT CAPACITY Schedule 12 – Revenue Bond Coverage (1) Last Ten Fiscal Years (expressed in millions)
Less: NetGross Operating Available Coverage
Fiscal Year Revenues (2) Expenses (3) Revenue Principal Interest Ratio
Governmental Activities2016 $ 101 $ 6 $ 95 $ 54 $ 47 0.94 2015 93 13 80 50 41 0.88 2014 108 14 94 45 58 0.91 2013 83 8 75 36 55 0.82 2012 77 5 78 29 48 1.01 2011 60 3 57 21 36 1.00 2010 61 3 58 25 36 0.95 2009 73 3 70 34 38 0.97 2008 67 2 65 25 36 1.07 2007 48 2 46 7 37 1.05
Business-Type Activities2016 $ 2,339 $ 2,170 $ 169 $ 89 $ 88 0.95 2015 2,153 1,978 175 82 102 0.95 2014 1,928 1,767 161 81 86 0.96 2013 1,789 1,652 137 18 86 1.32 2012 1,689 1,597 92 53 63 0.79 2011 1,522 1,575 (53) 40 50 (0.59) 2010 1,604 1,376 228 38 51 2.56 2009 1,478 1,281 197 26 54 2.46 2008 1,355 1,264 91 32 44 1.20 2007 1,270 1,120 150 16 39 2.73
(1)
(2)
(3)
(4)
Source: Washington State Office of Financial Management, Accounting Division
agencies and reported in Note 7.
Scheduled Debt Service (4)
Refer to Note 7 for information on the nature of revenue bonds issued by the state.
Scheduled debt service amounts are based on previous fiscal year disclosure information collected from individual
Total operating revenues.Total operating expenses exclusive of depreciation.

S t a t e o f W a s h i n g t o n
Statistical Section
297
DEMOGRAPHIC INFORMATION Schedule 13 – Personal Income Comparison Washington State vs. United States Last Ten Calendar Years (expressed in billions, except per capita)
2015 2014 2013 2012 2011 2010 2009 2008 2007 2006
Washington State Personal income 367$ 350$ 331$ 326$ 306$ 289$ 282$ 292$ 278$ 256$ Percent change 5% 6% 2% 7% 6% 3% -3% 5% 9% 9% Per capita 51,146$ 49,610$ 47,468$ 47,344$ 44,800$ 42,821$ 42,248$ 44,460$ 42,954$ 40,204$
United States Personal income 15,459$ 14,810$ 14,074$ 13,915$ 13,255$ 12,477$ 12,095$ 12,502$ 12,000$ 11,394$ Percent change 4% 5% 1% 5% 6% 3% -3% 4% 5% 7% Per capita 47,669$ 46,049$ 44,438$ 44,266$ 42,453$ 40,277$ 39,376$ 41,082$ 39,821$ 38,144$
Washington Per Capita Rate as %of United States Per Capita Rate 107% 108% 107% 107% 106% 106% 107% 108% 108% 105%
Note: The Bureau of Economic Analysis periodically revises its personal income data for periods up to 10 years.
Source: U.S. Department of Commerce, Bureau of Economic Analysis
Schedule 14 – Population and Components of Change Washington State vs. United States Last Ten Years (expressed in thousands)
2016 2015 2014 2013 2012 2011 2010 2009 2008 2007
Washington State (1)
Population 7,183.7 7,061.4 6,968.2 6,882.4 6,817.8 6,767.9 6,724.5 6,672.2 6,608.3 6,525.1 Net increase 122.3 93.2 85.8 64.6 49.9 43.4 52.4 63.9 83.2 104.8 Percent change 1.7% 1.3% 1.2% 0.9% 0.7% 0.6% 0.8% 1.0% 1.3% 1.6%Components of change:
Births 89.8 88.5 87.0 87.3 87.1 86.4 88.4 89.8 89.6 87.8 Deaths 54.6 52.8 50.7 51.1 49.2 48.8 47.7 48.1 47.9 46.2 Net migration 87.1 57.6 49.5 28.5 12.0 5.8 11.5 22.2 41.5 63.2
United States (2)
Population N/A 321,419 318,907 316,427 314,103 311,719 309,347 306,772 304,094 301,231 Percent change N/A 0.8% 0.8% 0.7% 0.8% 0.8% 0.8% 0.9% 1.0% 1.0%
(1)
(2) United States population intercensal estimates are as of July 1 of each year.
N/A indicates data not available.
Sources: Washington State Office of Financial ManagementU.S. Census Bureau, Population Division
Washington state population estimates are as of April 1 each year. Population estimates for 2007 through 2009 have been revised to reflect intercensal estimates. Intercensal estimates are estimates of population between official census dates. Intercensal estimates are more accurate than postcensal estimates because they are bracketed on both sides by decennial or state-certified special census counts. Estimates for 2010 have been replaced with the 2010 U.S. Census Bureau count. Estimates for 2011 through 2016 are postcensal estimates developed by the Washington State Office of Financial Management.

S t a t e o f W a s h i n g t o n
Statistical Section
298
DEMOGRAPHIC INFORMATION Schedule 15 – Annual Average Civilian Labor Force Unemployment Rates Washington State vs. United States Last Ten Calendar Years
2015 2014 2013 2012 2011
Washington State (in thousands)Civilian labor force 3,540 3,490 3,457 3,463 3,482 Employment 3,340 3,277 3,217 3,185 3,162
Total unemployment 200 213 240 278 320
Unemployment percentage rate 5.7% 6.1% 6.9% 8.0% 9.2%
United States (in millions)Civilian labor force 157.1 155.9 155.4 155.0 153.6 Employment 148.8 146.3 143.9 142.5 139.9
Total unemployment 8.3 9.6 11.5 12.5 13.7
Unemployment percentage rate 5.3% 6.2% 7.4% 8.1% 8.9%
Washington Unemployment Rate as % ofUnited States Unemployment Rate 107.5% 98.4% 93.2% 98.8% 103.4%
Note: The Washington State Economic and Revenue Forecast Council periodically revises its civilian labor force andemployment data for periods up to five years.
Source: Washington State Economic and Revenue Forecast, June 2016

S t a t e o f W a s h i n g t o n
Statistical Section
299
2010 2009 2008 2007 2006
3,515 3,535 3,479 3,393 3,319 3,167 3,206 3,286 3,237 3,155
348 329 193 156 164
9.9% 9.3% 5.5% 4.6% 5.0%
153.9 154.2 154.3 153.1 151.4 139.1 139.9 145.4 146.0 144.4
14.8 14.3 8.9 7.1 7.0
9.6% 9.3% 5.8% 4.6% 4.6%
103.1% 100.0% 94.8% 100.0% 108.7%

S t a t e o f W a s h i n g t o n
Statistical Section
300
DEMOGRAPHIC INFORMATION Schedule 16 – Annual Average Wage Rates by Industry Last Ten Calendar Years
Industry (2) 2015(3) 2014 2013 2012 2011
Information 150,562$ 148,429$ 135,304$ 131,872$ 119,968$
Management of companies and enterprises 108,469 106,518 105,501 105,535 102,009
Utilities 92,790 87,212 86,373 84,024 82,058
Finance and insurance 85,977 82,102 79,587 77,455 73,154
Professional, scientific, and technical services 85,647 84,883 81,893 79,972 77,178
Manufacturing 73,870 74,303 70,798 69,306 68,065
Wholesale trade 72,554 70,169 68,230 68,481 65,831
Mining 67,466 63,404 62,444 60,231 58,871
Government 57,240 55,603 53,733 52,871 52,174
Construction 56,944 55,037 53,735 53,056 52,304
Transportation and warehousing 54,395 52,293 51,967 50,876 49,628
Health care and social assistance (5) 47,469 44,245 47,733 47,067 45,852
Real estate, rental and leasing 46,950 45,181 43,426 42,040 39,816
Administrative and support services (4) 45,922 44,382 43,261 43,381 42,942
Retail trade 38,299 36,127 34,084 32,364 30,917
Education services 37,502 36,918 36,775 36,226 35,576
Other services (5) 36,417 35,571 26,717 25,651 24,549
Arts, entertainment, and recreation 30,545 29,725 27,771 25,276 25,023
Agriculture, forestry, fishing, and hunting 28,507 27,758 26,880 26,295 25,097
Accommodation and food services 20,449 19,561 19,136 18,698 18,062
(1)
private firms or disclosure of employers.(2)
(3)
(4)
services.(5)
Source: Washington State Employment Security Department, Quarterly Census of Employment and Wages
Annual Average Wages (1)
services to increase. Wages classified as other services do not include public administration.
Wages include only employment covered by unemployment insurance. Wages may not include individual
Industry classifications and wages are based on North American Industry Classification System (NAICS) codes. 2015 data is preliminary. Wages classified under administrative and support services include waste management and remediation
A number of state-funded programs that provide nonmedical, home-based services for the elderly and personswith disabilities were incorrectly classified as other services. Effective January 2014, these were classified correctly as health care and social assistance. This reclassification caused the average annual wage for other

S t a t e o f W a s h i n g t o n
Statistical Section
301
2010 2009 2008 2007 2006
109,777$ 105,715$ 104,053$ 96,240$ 91,081$ 95,731 87,642 87,431 86,867 85,031 77,591 84,410 76,945 73,736 70,404 70,137 71,304 72,653 70,044 66,684 75,376 71,837 70,120 70,104 63,687 64,925 62,931 61,260 59,568 58,196 63,348 61,569 61,041 59,345 56,572 55,654 52,981 54,718 58,056 54,924 51,394 50,420 48,705 46,914 44,745 51,127 51,043 49,443 46,783 43,746 47,743 46,522 45,433 45,320 44,078 44,673 43,561 41,424 39,474 37,654 38,359 36,777 36,669 36,334 34,948 41,466 39,571 37,536 36,463 34,533 30,021 29,356 29,268 29,082 28,174 35,158 34,505 33,550 32,076 30,901 24,227 24,881 25,637 24,385 23,009 25,121 25,527 26,949 27,643 27,139 24,034 23,675 24,491 23,413 22,239 17,632 17,063 16,430 16,019 15,469

S t a t e o f W a s h i n g t o n
Statistical Section
302
DEMOGRAPHIC INFORMATION Schedule 17 – Principal Employers by Industry Current Calendar Year and Nine Years Ago
Number of Percent Number of Number of Percent Number ofIndustry (1) Employees (2) of Total Employers Employees (2) of Total Employers
Government 533,671 17.1% 2,126 504,618 17.7% 2,039 Health care and social assistance (3) 389,712 12.5% 54,020 288,031 10.1% 13,338 Retail trade 349,642 11.2% 14,849 315,136 11.1% 14,400 Manufacturing 287,498 9.2% 7,136 281,520 9.9% 7,193 Accommodation and food services 257,079 8.2% 13,866 222,814 7.8% 12,086 Professional, scientific, and technical services 181,926 5.8% 22,802 141,709 5.0% 16,143 Construction 162,760 5.2% 22,967 182,112 6.4% 24,090 Administrative and support services (4) 155,656 5.0% 11,384 145,201 5.1% 8,692 Wholesale trade 130,254 4.2% 13,402 123,275 4.3% 12,472 Information 113,635 3.6% 3,301 97,744 3.4% 2,443 Agriculture, forestry, fishing, and hunting 102,574 3.3% 7,378 83,978 2.9% 7,941 Other services (3) 92,095 2.9% 17,982 112,542 3.9% 49,364 Finance and insurance 91,672 2.9% 5,660 103,493 3.6% 5,866 Transportation and warehousing 90,714 2.9% 4,514 83,397 2.9% 3,957 Real estate, rental and leasing 47,657 1.5% 6,597 49,647 1.7% 6,706 Arts, entertainment, and recreation 47,512 1.5% 2,710 44,408 1.6% 2,350 Mgmt. of companies and enterprises 41,885 1.4% 639 33,577 1.2% 628 Education services 39,828 1.3% 3,088 29,833 1.1% 1,963 Utilities 4,848 0.2% 228 4,509 0.2% 228 Mining 2,339 0.1% 158 3,357 0.1% 163
Total average employment (5) 3,122,957 100.0% 214,807 2,850,901 100.0% 192,062
(1)
(2)
(3)
(4)
(5)
2006 Annual Averages
Source: Washington State Employment Security Department, Quarterly Census of Employment and Wages
Industry classifications are based on North American Industry Classification System (NAICS) codes. The state of Washington is legally prohibited
The number of employees is based on annual averages and represents only employees covered by unemployment insurance.
Total employment is based on annual averages and may not include private firms or disclosure of individual employers.
2015 Annual Averages
Employment classified under administrative and support services include waste management and remediation services.
A number of state-funded programs that provide nonmedical, home-based services for the elderly and persons with disabilities were incorrectly
from disclosing the names of individual employers. The information in this table is intended to assist readers in understanding the degree of concentration in the state's employment base.
caused the annual average wage for other services to increase. Wages classified as other services do not include public administration.classified as other services. Effective January 2014, these were classified correctly as health care and social assistance. This reclassification

S t a t e o f W a s h i n g t o n
Statistical Section
303
DEMOGRAPHIC INFORMATION Schedule 18 – Fortune 500 Companies Headquartered in Washington Last Two Calendar Years (Ranked by Company Revenues)
Revenues Profit / (Loss) Employees2015 2014 Company (in millions) (in millions) Worldwide Headquarters
15 18 Costco Wholesale $ 116,199 $ 2,377 161,000 Issaquah18 29 Amazon.com 107,006 596 230,800 Seattle25 31 Microsoft 93,580 12,193 118,000 Redmond
146 187 Starbucks 19,163 2,757 238,000 Seattle147 158 Paccar 19,115 1,604 23,000 Bellevue197 224 Nordstrom 14,437 600 72,500 Seattle373 355 Weyerhaeuser 7,082 506 12,600 Federal Way385 458 Expedia 6,672 765 18,730 Bellevue390 413 Expeditors Intl. of Washington 6,617 457 15,397 Seattle459 484 Alaska Air Group 5,598 848 13,858 Seattle
Source: Fortune Magazine, June 6, 2016
Rank
Schedule 19 – Principal Agricultural Commodities Value (1) Last Ten Calendar Years (dollars in millions)
% ChangeCommodities 2015 vs. 2014 2015 2014 2013 2012 2011 2010 2009 2008 2007 2006
Apples 27% 2,396$ 1,893$ 2,134$ 2,482$ 1,831$ 1,541$ 1,413$ 1,288$ 1,780$ 1,403$ Milk (2) -30% 1,136 1,624 1,299 1,160 1,277 950 684 1,002 1,062 688 Cattle/calves 7% 858 806 715 659 592 568 473 496 574 584 Potatoes 0% 772 771 792 700 771 654 646 693 675 562 Wheat -16% 600 715 1,014 1,162 1,138 925 594 745 949 618 Hay, all -29% 499 703 675 626 716 509 452 581 498 401 Cherries, all -12% 448 510 385 499 534 367 231 297 327 273 Eggs 87% 332 177 147 137 140 121 106 136 105 57Grapes, all -2% 297 302 278 249 189 214 209 199 174 147 Hops 34% 280 208 185 144 157 163 265 259 137 88
(1) Acreage and/or yield data is preliminary. The value may not be finalized until up to two years after production.(2)
Source: United States Department of Agriculture, National Agricultural Statistics Service
Value at average returns per 100 pounds of milk in combined marketings of milk and cream plus value of milk used for home consumption and milk fed to calves.

S t a t e o f W a s h i n g t o n
Statistical Section
304
DEMOGRAPHIC INFORMATION Schedule 20 – International Trade Facts (All Washington Ports) Last Ten Calendar Years (expressed in millions)
International Trade 2015 2014 2013 2012 2011 2010 2009 2008 2007 2006
Exports (1) 94,781$ 93,908$ 98,740$ 84,187$ 77,284$ 64,723$ 58,468$ 77,088$ 78,453$ 68,202$
Imports 91,496 90,639 89,559 93,614 86,997 80,020 67,896 87,511 85,469 81,953
Trade balance 3,285$ 3,269$ 9,181$ (9,427)$ (9,713)$ (15,297)$ (9,428)$ (10,422)$ (7,016)$ (13,752)$
Two-way trade 186,277$ 184,547$ 188,299$ 177,801$ 164,281$ 144,743$ 126,364$ 164,599$ 163,922$ 150,155$
Source: Washington State Department of Commerce
(1) Export figures indicate total international trade from the state of Washington, including bonded shipments to other states and Canada
Figures may not total due to rounding.
(includes Boeing Company figures).
Schedule 21 – Value of Trade with Major Export Trading Partners Last Ten Calendar Years (expressed in millions)
Export Partners (1) 2015 2014 2013 2012 2011 2010 2009 2008 2007 2006
Canada 17,052$ 18,937$ 27,635$ 18,135$ 17,353$ 14,936$ 13,326$ 17,049$ 15,267$ 12,894$ China (Mainland) 16,315 18,880 16,390 14,027 11,962 11,695 7,607 8,614 9,357 8,030 Japan 7,569 8,908 8,465 9,850 8,036 7,368 6,475 10,677 10,567 9,810 Korea, Republic of 5,071 3,644 3,371 3,903 4,096 3,378 2,584 4,003 3,683 3,161 Taiwan 3,902 2,734 2,295 1,866 2,070 2,556 1,917 3,142 3,702 3,332 Singapore 3,377 1,695 1,596 1,273 1,476 965 988 2,011 1,636 1,947 United Arab Emirates 3,174 3,212 3,969 5,017 2,715 909 2,897 2,160 2,119 2,980 Chile 2,974 520 1,349 1,165 604 335 414 271 165 409 United Kingdom 2,514 2,710 2,530 1,452 1,921 1,083 1,356 1,316 1,753 1,022 Saudi Arabia 1,907 602 1,579 1,175 285 153 91 92 76 65
(1) Export figures are based on all Washington state ports, all methods of transportation.
Source: Washington State Department of Commerce
Schedule 22 – Value of Trade with Major Import Trading Partners Last Ten Calendar Years (expressed in millions)
Import Partners (1) 2015 2014 2013 2012 2011 2010 2009 2008 2007 2006
China (Mainland) $29,910 $28,968 $31,776 $33,820 $31,100 $32,228 $27,341 $30,632 $28,684 $24,198Japan 17,682 16,816 17,036 19,129 16,198 13,886 11,656 17,274 15,858 15,980 Canada 16,873 18,953 17,529 16,430 16,284 13,948 10,916 15,877 16,925 18,555 Korea, Republic of 5,014 4,945 4,529 4,380 3,760 3,315 2,719 3,875 4,235 4,264 Taiwan 3,574 3,347 3,131 3,442 3,291 3,141 2,414 4,072 3,610 3,451 Vietnam 1,996 1,346 1,326 1,637 1,421 1,234 1,160 1,092 1,130 904 Thailand 1,505 1,151 1,039 1,050 959 974 804 1,154 1,221 1,389 United Kingdom 1,074 1,661 1,303 1,013 697 625 633 581 792 913 Australia 1,068 931 666 619 807 648 432 918 654 567Singapore 1,060 638 576 275 258 515 1,631 1,289 1,413 475
(1) Import figures are based on all Washington state ports, all methods of transportation.
Source: Washington State Department of Commerce

S t a t e o f W a s h i n g t o n
Statistical Section
305
DEMOGRAPHIC INFORMATION Schedule 23 – Property Value and Construction Last Ten Calendar Years (expressed in millions)
2015 2014 2013 2012 2011 2010 2009 2008 2007 2006
Value of all taxable property:Assessed value 949,759$ 880,155$ 808,328$ 767,064$ 793,703$ 824,885$ 862,108$ 919,505$ 841,309$ 738,395$
Property value ofexemptions:Senior citizen $ 3,590 $ 3,183 $ 2,491 $ 2,689 $ 4,170 $ 5,362 $ 6,491 $ 8,715 $ 8,022 $ 6,604
Head of household 58 60 56 61 65 72 77 84 105 44
Total exemptions $ 3,648 $ 3,243 $ 2,547 $ 2,750 $ 4,236 $ 5,434 $ 6,568 $ 8,799 $ 8,127 $ 6,648
New constructionand improvements:Assessed value $ 13,656 $ 11,213 $ 9,198 $ 6,598 $ 7,207 $ 9,001 $ 13,443 $ 19,435 $ 20,861 $ 19,680
Source: Washington State Department of Revenue, Property Tax Statistics Report
Schedule 24 – Residential Building Activity Last Ten Calendar Years (dollars in millions)
2015 2014 2013 2012 2011 2010 2009 2008 2007 2006
Permits 40,374 33,898 32,962 28,118 20,864 20,691 17,011 28,919 47,397 50,033
Valuations $ 8,519 $ 7,017 $ 6,684 $ 5,649 $ 4,036 $ 3,891 $ 3,186 $ 5,063 $ 8,130 $ 8,540
Source: U.S. Census Bureau

S t a t e o f W a s h i n g t o n
Statistical Section
306
OPERATING INFORMATION Schedule 25 – Full-Time Equivalent Staff Comparison (Budgeted Funds) Last Ten Fiscal Years
2016 2015 2014 2013 2012 2011 2010 2009 2008 2007
General government 8,420 8,386 8,256 8,268 9,082 9,196 9,696 9,899 9,734 9,508
Human services 33,722 33,105 32,744 32,205 31,766 32,133 34,034 35,015 34,720 33,669
Natural resources 6,661 6,520 6,256 6,232 6,011 5,928 6,120 6,479 6,596 6,507
Transportation 10,185 10,230 10,334 10,457 10,458 10,783 11,037 11,264 11,300 11,025
Education 52,216 52,296 51,303 50,406 48,603 49,454 49,086 49,889 49,070 47,984
Total 111,204 110,537 108,893 107,568 105,920 107,494 109,973 112,546 111,420 108,693
Percentage change 0.6% 1.5% 1.2% 1.6% -1.5% -2.3% -2.3% 1.0% 2.5% 1.9%
Notes:
Source: Washington State Office of Financial Management
work hours in a year). It is not the number of employees on the payroll, nor is it the number of positions in state government. It is a computed average number of state employees based upon cumulative FTE staff months during one fiscal year or cumulative hours paid during one fiscal year. Figures include budgeted operating and capital FTEs and FTEs for nonbudgeted higher education funds.
Function
A Full-Time Equivalent (FTE) is one full calendar year of paid employment, or the equivalent of 2,088 hours (the number of available

S t a t e o f W a s h i n g t o n
Statistical Section
307
OPERATING INFORMATION Schedule 26 – Full-Time Equivalent Staff Comparison (General Fund State) Last Ten Fiscal Years
2016 2015 2014 2013 2012 2011 2010 2009 2008 2007
General government 2,794 2,825 2,740 2,870 2,845 3,060 3,234 3,285 3,225 3,175
Human services 18,791 18,508 18,487 17,569 17,192 16,962 16,984 17,699 17,944 17,548
Natural resources 1,819 1,341 1,474 1,667 1,595 1,712 2,080 2,505 2,462 2,193
Transportation 358 306 360 354 367 371 418 373 449 343
Education 15,257 15,087 14,189 14,969 14,941 16,535 17,675 21,269 21,082 20,171
Total 39,019 38,067 37,250 37,429 36,940 38,640 40,391 45,131 45,162 43,430
Percentage change 2.5% 2.2% -0.5% 1.3% -4.4% -4.3% -10.5% -0.1% 4.0% 2.6%
Notes:
Source: Washington State Office of Financial Management
computed average number of state employees based upon cumulative FTE staff months during one fiscal year or cumulative hours paid during one fiscal year. Figures include operating and capital FTEs.
A Full-Time Equivalent (FTE) is one full calendar year of paid employment, or the equivalent of 2,088 hours (the number of available
Function
work hours in a year). It is not the number of employees on the payroll, nor is it the number of positions in state government. It is a
S t a t e o f W a s h i n g t o n
Statistical Section
308
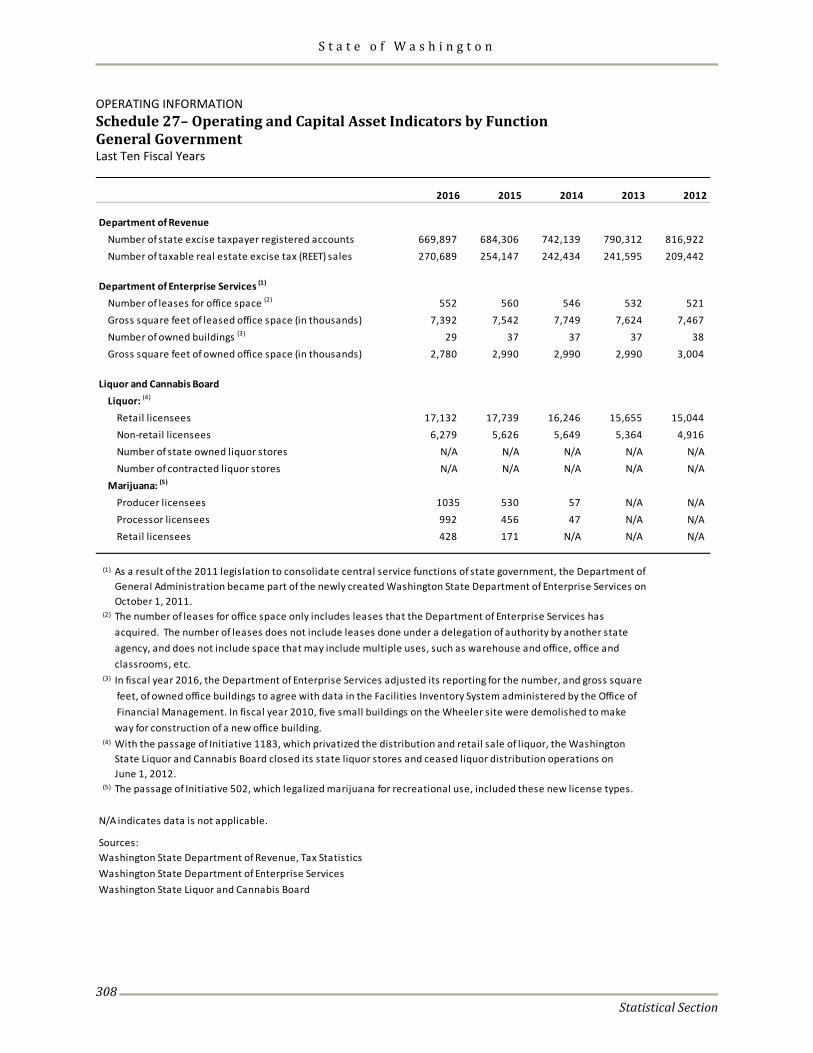
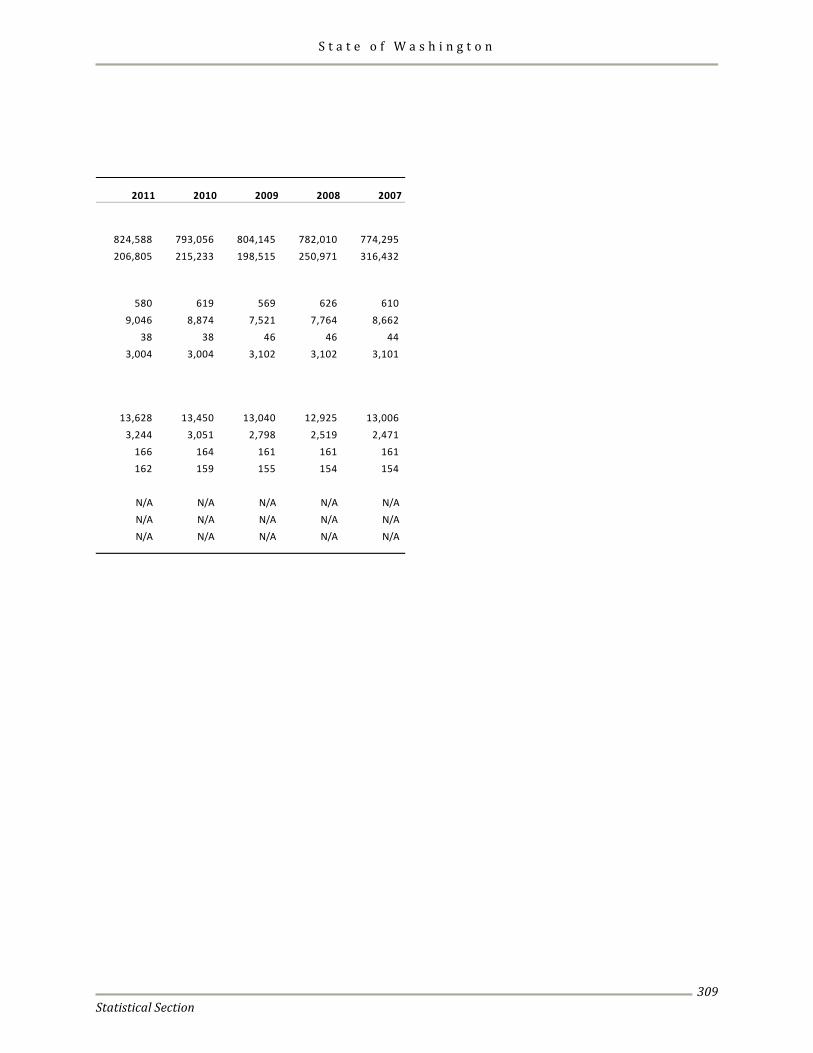
OPERATING INFORMATION Schedule 27– Operating and Capital Asset Indicators by Function General Government Last Ten Fiscal Years
2016 2015 2014 2013 2012
Department of RevenueNumber of state excise taxpayer registered accounts 669,897 684,306 742,139 790,312 816,922 Number of taxable real estate excise tax (REET) sales 270,689 254,147 242,434 241,595 209,442
Department of Enterprise Services (1)
Number of leases for office space (2) 552 560 546 532 521 Gross square feet of leased office space (in thousands) 7,392 7,542 7,749 7,624 7,467 Number of owned buildings (3) 29 37 37 37 38 Gross square feet of owned office space (in thousands) 2,780 2,990 2,990 2,990 3,004
Liquor and Cannabis BoardLiquor: (4)
Retail licensees 17,132 17,739 16,246 15,655 15,044 Non-retail licensees 6,279 5,626 5,649 5,364 4,916 Number of state owned liquor stores N/A N/A N/A N/A N/ANumber of contracted liquor stores N/A N/A N/A N/A N/A
Marijuana: (5)
Producer licensees 1035 530 57 N/A N/AProcessor licensees 992 456 47 N/A N/ARetail licensees 428 171 N/A N/A N/A
(1)
(2)
(3)
(4)
(5)
N/A indicates data is not applicable.
Sources:Washington State Department of Revenue, Tax StatisticsWashington State Department of Enterprise ServicesWashington State Liquor and Cannabis Board
The passage of Initiative 502, which legalized marijuana for recreational use, included these new license types.
As a result of the 2011 legislation to consolidate central service functions of state government, the Department of
The number of leases for office space only includes leases that the Department of Enterprise Services has
In fiscal year 2016, the Department of Enterprise Services adjusted its reporting for the number, and gross square
With the passage of Initiative 1183, which privatized the distribution and retail sale of liquor, the Washington
October 1, 2011.General Administration became part of the newly created Washington State Department of Enterprise Services on
acquired. The number of leases does not include leases done under a delegation of authority by another state agency, and does not include space that may include multiple uses, such as warehouse and office, office and classrooms, etc.
feet, of owned office buildings to agree with data in the Facilities Inventory System administered by the Office of Financial Management. In fiscal year 2010, five small buildings on the Wheeler site were demolished to make way for construction of a new office building.
June 1, 2012.State Liquor and Cannabis Board closed its state liquor stores and ceased liquor distribution operations on
S t a t e o f W a s h i n g t o n
Statistical Section
309
2011 2010 2009 2008 2007
824,588 793,056 804,145 782,010 774,295 206,805 215,233 198,515 250,971 316,432
580 619 569 626 610 9,046 8,874 7,521 7,764 8,662
38 38 46 46 44 3,004 3,004 3,102 3,102 3,101
13,628 13,450 13,040 12,925 13,006 3,244 3,051 2,798 2,519 2,471
166 164 161 161 161 162 159 155 154 154
N/A N/A N/A N/A N/AN/A N/A N/A N/A N/AN/A N/A N/A N/A N/A
S t a t e o f W a s h i n g t o n
Statistical Section
310
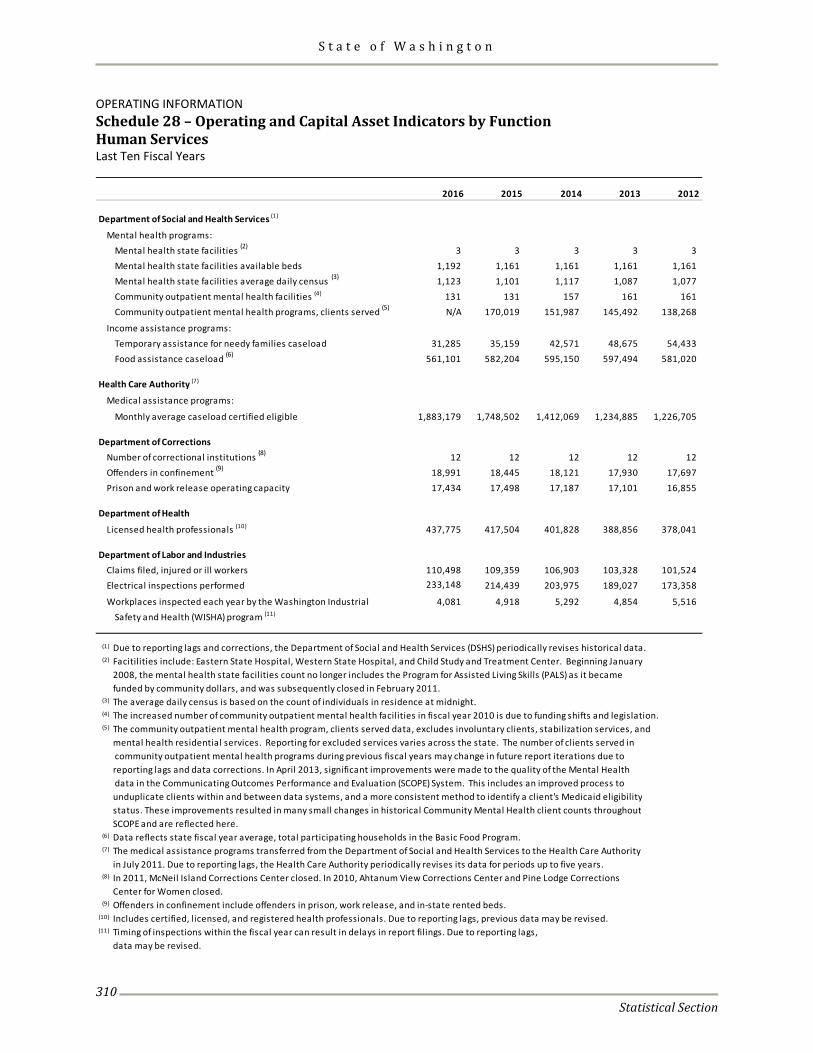
OPERATING INFORMATION Schedule 28 – Operating and Capital Asset Indicators by Function Human Services Last Ten Fiscal Years
2016 2015 2014 2013 2012
Department of Social and Health Services (1)
Mental health programs:Mental health state facilities (2) 3 3 3 3 3 Mental health state facilities available beds 1,192 1,161 1,161 1,161 1,161 Mental health state facilities average daily census (3) 1,123 1,101 1,117 1,087 1,077 Community outpatient mental health facilities (4) 131 131 157 161 161 Community outpatient mental health programs, clients served (5) N/A 170,019 151,987 145,492 138,268
Income assistance programs:Temporary assistance for needy families caseload 31,285 35,159 42,571 48,675 54,433 Food assistance caseload (6) 561,101 582,204 595,150 597,494 581,020
Health Care Authority (7)
Medical assistance programs:
Monthly average caseload certified eligible 1,883,179 1,748,502 1,412,069 1,234,885 1,226,705
Department of CorrectionsNumber of correctional institutions (8) 12 12 12 12 12 Offenders in confinement (9) 18,991 18,445 18,121 17,930 17,697 Prison and work release operating capacity 17,434 17,498 17,187 17,101 16,855
Department of Health
Licensed health professionals (10) 437,775 417,504 401,828 388,856 378,041
Department of Labor and IndustriesClaims filed, injured or ill workers 110,498 109,359 106,903 103,328 101,524 Electrical inspections performed 233,148 214,439 203,975 189,027 173,358
Workplaces inspected each year by the Washington Industrial 4,081 4,918 5,292 4,854 5,516 Safety and Health (WISHA) program (11)
(1) Due to reporting lags and corrections, the Department of Social and Health Services (DSHS) periodically revises historical data.(2) Facitilities include: Eastern State Hospital, Western State Hospital, and Child Study and Treatment Center. Beginning January
2008, the mental health state facilities count no longer includes the Program for Assisted Living Skills (PALS) as it becamefunded by community dollars, and was subsequently closed in February 2011.
(3) The average daily census is based on the count of individuals in residence at midnight.(4) The increased number of community outpatient mental health facilities in fiscal year 2010 is due to funding shifts and legislation.(5) The community outpatient mental health program, clients served data, excludes involuntary clients, stabilization services, and
mental health residential services. Reporting for excluded services varies across the state. The number of clients served in community outpatient mental health programs during previous fiscal years may change in future report iterations due toreporting lags and data corrections. In April 2013, significant improvements were made to the quality of the Mental Health data in the Communicating Outcomes Performance and Evaluation (SCOPE) System. This includes an improved process tounduplicate clients within and between data systems, and a more consistent method to identify a client's Medicaid eligibilitystatus. These improvements resulted in many small changes in historical Community Mental Health client counts throughoutSCOPE and are reflected here.
(6) Data reflects state fiscal year average, total participating households in the Basic Food Program.(7) The medical assistance programs transferred from the Department of Social and Health Services to the Health Care Authority
in July 2011. Due to reporting lags, the Health Care Authority periodically revises its data for periods up to five years.(8) In 2011, McNeil Island Corrections Center closed. In 2010, Ahtanum View Corrections Center and Pine Lodge Corrections
Center for Women closed.(9) Offenders in confinement include offenders in prison, work release, and in-state rented beds.
(10) Includes certified, licensed, and registered health professionals. Due to reporting lags, previous data may be revised.(11)
data may be revised.Timing of inspections within the fiscal year can result in delays in report filings. Due to reporting lags,

S t a t e o f W a s h i n g t o n
Statistical Section
311
2011 2010 2009 2008 2007
3 3 3 4 4 1,176 1,197 1,264 1,359 1,380 1,078 1,101 1,172 1,251 1,292
184 177 149 144 150 137,768 132,112 125,467 122,576 119,384
65,140 64,451 56,459 50,122 51,939 536,635 458,123 351,617 288,281 279,985
1,218,534 1,158,205 1,066,606 972,444 887,966
12 13 15 15 15 18,483 18,457 18,627 18,551 18,471 17,060 16,856 16,756 15,785 15,222
372,657 357,766 335,830 330,850 331,147
100,690 102,734 116,616 136,791 140,308 171,861 189,763 216,305 265,564 282,100
6,240 7,689 7,565 5,414 6,810
N/A indicates data not available or not applicable.
Sources:Washington State Department of Social and Health ServicesWashington State Health Care AuthorityWashington State Department of CorrectionsWashington State Department of HealthWashington State Department of Labor and Industries

S t a t e o f W a s h i n g t o n
Statistical Section
312
OPERATING INFORMATION Schedule 29 – Operating and Capital Asset Indicators by Function Transportation Last Ten Fiscal Years
2016 2015 2014 2013 2012
Department of TransportationNumber of ferries 24 24 22 22 23 Vehicles on ferries (in thousands) 10,563 10,372 10,156 10,045 9,983 Passengers on ferries (in thousands) 13,525 13,261 12,651 12,350 12,236
State highway miles of travel (1)
Rural (in millions) N/A 11,098 10,641 10,371 11,252 Urban (in millions) N/A 22,237 21,536 21,278 19,963
State highway lane milesRural 13,113 13,091 13,085 13,798 13,814 Urban 7,650 7,641 7,606 6,882 6,817 Total 20,763 20,732 20,691 20,680 20,631
Pavement patching & repair (square feet) (2) 3,826,649 74,263 86,948 82,415 113,304 Pavement striping maintenance (miles) 19,600 23,156 16,835 17,203 18,763 Anti & de-icing liquid application (gallons in thousands) 1,688 1,210 2,721 2,154 2,421 Litter pickup (cubic yards) 18,169 18,876 22,586 29,428 25,537
Department of Licensing (3)
Total vehicle registrations (in thousands) 7,214 7,039 6,866 6,755 6,683 Licensed drivers (in thousands) 5,639 5,520 5,404 5,310 5,230
Washington State Patrol (4)
Total contacts 1,141,899 1,228,396 1,225,768 1,262,584 1,256,569 Citations issued 464,021 509,689 506,862 516,593 518,315 Motorist assists 328,199 316,659 300,806 296,170 301,511 Collisions investigated 45,300 37,996 35,479 33,989 34,995 Number of traffic officers 539 589 585 635 626
(1) N/A indicates data is not available.(2)
(3)
(4)
Sources: Washington State Department of TransportationWashington State Department of LicensingWashington State Patrol
Notes regarding WSDOT ferries:
Two new 144-car vessels were placed into service in 2015.
Two new 64-car vessels were placed into service in 2012. One 64-car vessel was placed into service in 2011. The last two passenger-only vessels were sold in 2010. Four steel electric ferries went out of service in 2008.
The Maintenance Operations Division has a new mobile application to track units, HATS (Highway Activity Tracking System), that began July 1, 2015. With this new system, the maintenance personnel are able to more accurately track the type of work they are doing as well as the amount.Vehicle count includes all registered vehicles for which registration fees were paid. Driver count includes all licensed drivers.Due to time and activity adjustments, the Washington State Patrol periodically revises its data up to three years.

S t a t e o f W a s h i n g t o n
Statistical Section
313
2011 2010 2009 2008 2007
21 22 22 24 28 9,973 10,134 9,910 10,391 10,827
12,374 12,504 12,598 12,901 13,163
11,353 11,521 11,362 10,988 11,564 20,103 20,243 20,093 19,754 20,406
13,795 13,744 13,724 13,685 13,668 6,792 6,755 6,668 6,566 6,505
20,587 20,499 20,392 20,251 20,173
135,952 179,585 128,076 100,124 92,216 26,608 16,801 18,140 20,020 20,328
1,774 2,834 4,724 3,938 4,541 27,320 26,739 12,230 18,452 17,234
6,662 6,631 6,655 6,637 6,733 5,180 5,108 5,028 4,955 4,774
1,272,526 1,258,637 1,257,774 1,237,584 1,255,500
520,447 523,786 540,181 570,691 592,122
310,013 296,887 305,421 306,650 309,864
37,106 34,182 36,922 39,289 40,666
624 636 633 616 626

S t a t e o f W a s h i n g t o n
Statistical Section
314
OPERATING INFORMATION Schedule 30 – Operating and Capital Asset Indicators by Function Natural Resources and Recreation Last Ten Fiscal Years
2016 2015 2014 2013 2012
State Parks and Recreation CommissionNumber of official, developed state parks 124 123 123 116 116
Number of owned or managed properties (1) 91 93 93 243 243
Acreage of state parks 138,613 137,781 138,266 123,952 121,711
Attendance at state parks (in thousands) 35,055 33,045 34,000 35,625 35,338
Department of Fish and WildlifeRecreational licenses issued (2)
Hunting licenses 607,849 595,169 556,745 548,873 533,420
Fishing licenses 1,525,780 1,546,250 1,503,651 1,407,714 1,456,268
Hatchery releases (pounds in thousands) (3)
Salmon releases 3,466 3,868 3,766 4,150 4,034 Trout releases (4) 1,402 1,580 1,643 1,587 1,513
Department of Natural Resources (3)
Common schools trust land acreage (in thousands) 1,788 1,790 1,791 1,780 1,794 Total trust land acreage (in thousands) 3,125 3,122 3,122 3,072 2,918
Timber acres harvested 24,402 23,499 21,966 20,303 22,250 Timber volume harvested (thousand board feet) 479,862 449,115 471,343 480,140 514,039
Timber volume sold (thousand board feet) 527,071 467,555 489,917 497,447 549,229 Natural area preserve sites 56 55 55 55 55
Natural area preserve acreage 37,273 36,342 36,245 36,156 38,284 Natural resources conservation area sites 36 36 36 35 35
Natural resources conservation area acreage 118,579 114,244 113,116 113,032 111,136
(1) In 2014, approximately 143 state park owned or managed properties formerly considered to be stand-alone properties were incorporated into larger, developed state parks.
(2) Recreational licenses issued include secondary license documents such as endorsements, catch cards, and duplicates.(3)
(4) Trout releases do not include trout lodge fish purchased by DFW.
Sources: Washington State Parks and Recreation CommissionWashington State Department of Fish and Wildlife Washington State Department of Natural Resources
Fiscal year 2016 data is preliminary.

S t a t e o f W a s h i n g t o n
Statistical Section
315
2011 2010 2009 2008 2007
116 118 120 120 120 241 183 219 231 231
121,547 121,506 121,152 121,010 120,146
38,896 44,315 41,535 41,590 39,297
594,673 626,491 539,708 543,054 525,497 1,355,967 1,383,337 1,234,575 1,158,688 1,163,672
4,206 4,395 4,332 4,435 4,788 1,396 1,384 1,411 1,410 1,523
1,803 1,810 1,813 1,799 1,757 2,929 2,944 2,947 2,923 2,877
20,609 26,841 27,168 24,625 29,687 669,442 805,946 504,939 504,796 493,341
597,083 741,666 545,634 660,247 570,531 54 54 53 52 52
36,896 35,585 35,365 31,207 29,991 31 30 30 29 31
108,100 97,293 96,989 93,534 88,862

S t a t e o f W a s h i n g t o n
Statistical Section
316
OPERATING INFORMATION Schedule 31 – Operating and Capital Asset Indicators by Function Education Last Ten Academic Years
2015-16 2014-15 2013-14 2012-13 2011-12
K-12 Enrollment (1)
K-8 726,144 705,175 696,390 680,696 676,539 9-12 307,622 307,417 306,030 306,819 307,949 Private and home based 3 7 5 8 12 Summer (2) 916 993 1,010 929 821 Running start 18,553 17,070 15,090 13,623 12,767 Open doors [1418] youth reengagement program (3) 3,550 2,905 2,058 747 119 UW transition 116 108 107 114 113
Total 1,056,904 1,033,675 1,020,690 1,002,937 998,320
High school graduates (4) N/A 62,598 60,680 60,475 60,552
Higher EducationCommunity and Technical Colleges:
Number of campuses 34 34 34 34 34 Enrollment (1) (5) 135,108 138,724 143,292 147,433 153,395 Associate degrees granted 29,624 29,137 28,758 28,191 27,846 Baccalaureate degrees granted (6) 497 286 244 192 155 Student achievement points (7) 470,380 486,326 502,179 342,424 361,715
Public Universities: (8)
Number of campuses 11 11 11 11 10 Enrollment (1) N/A 107,935 106,038 105,112 104,702 Baccalaureate degrees granted N/A 24,946 24,167 24,616 24,280 Masters degrees granted N/A 5,858 5,761 5,809 5,597 Doctors degrees granted N/A 1,131 1,022 1,032 915 Professional degrees granted N/A 774 781 799 777
(1) K-12 enrollment figures are preliminary for academic year 2015-16. Enrollment is based on a full-time equivalent student, which is defined as:
• Kindergarten: 4 classroom hours per day for 90 days or 2 classroom hours per day for 180 days.• Grades 1 through 3: 4 classroom hours per day for 180 days.• Grades 4 through 12: 5 classroom hours per day for 180 days.• Undergraduate student: 15 credit hours per term.• Graduate student: 10 credit hours per term.
(2) The increase in skills center summer students beginning in 2009-10 is due to reporting and funding changes.(3) The youth reengagement program, beginning in academic year 2011-12, was created to provide educational
opportunities for youth ages 16-21, who have dropped out of high school or are not accumulating sufficient creditsto reasonably complete a high school diploma in a public school before the age of twenty one.
(4) Beginning with the 2010-2011 academic year, high school graduates are calculated using an adjusted (four-year) cohort method that tracks students expected to graduate high school within a four year period of time. Total high school graduates consist of students who received high school diplomas, graduated with Associates degrees, and graduated under Individualized Education Plans (IEPs). Prior to 2010-11, high school graduates were calculated using thetraditional estimated (four-year) on-time cohort method which was based on students enrolled within a single school year.
(5) Enrollment figures include all non-Running Start students, which may include students under the age of 18. Figures also include students enrolled in baccalaureate partnership programs.
(6) Baccalaureate degrees awarded by community and technical colleges, beginning in academic year 2008-09.(7) Student achievement points are the number of intermediate steps achieved by students that are shown to be
predictors of the degree or certificate outcome. Student achievement points are essential to the Student Achievement Initiative (SAI) within the community and technical college system. The initiative was implemented in 2007 to increaseeducational attainment in Washington state, therefore data is not available for prior academic years. In 2012, afterreviewing the data from the first six years of implementation, the State Board approved revisions to SAI which wereeffective in 2013-14. The revisions included additional points awarded for student retention and critical transitionsfor students starting less than college-ready, and for second year achievement.

S t a t e o f W a s h i n g t o n
Statistical Section
317
2010-11 2009-10 2008-09 2007-08 2006-07
673,558 668,055 663,124 653,862 648,975 312,691 314,318 312,954 313,598 313,370
9 14 12 19 23 1,155 1,222 642 538 333
12,824 12,487 11,824 11,176 10,811 N/A N/A N/A N/A N/A108 104 102 103 100
1,000,345 996,200 988,658 979,296 973,612
59,732 60,835 58,687 58,005 58,875
34 34 34 34 34 162,328 160,778 148,000 136,723 132,346
26,434 22,368 21,295 20,911 20,763 138 51 35 N/A N/A
390,300 393,135 352,419 308,800 295,259
10 10 10 10 10 103,214 101,165 98,292 94,310 92,215
23,289 22,794 22,036 21,685 21,654 5,498 5,138 4,787 4,739 4,751 1,035 1,114 1,107 1,107 838
661 523 495 504 719
(8) Public Universities include all 4-year public institutions and branch campuses. The universities periodically update the number of degreesgranted to more accurately reflect the data at the institution level.
N/A indicates data not available or not applicable.
Sources:Washington State Office of Financial ManagementWashington State Office of Superintendent of Public InstructionWashington State Board for Community and Technical CollegesWashington Student Achievement Council

S t a t e o f W a s h i n g t o n
Statistical Section
318
This page intentionally left blank.