cahsee d iagnostic w orkshop. u nderstanding cahsee 2
TRANSCRIPT
CAHSEE DIAGNOSTIC WORKSHOP
UNDERSTANDING CAHSEE
2
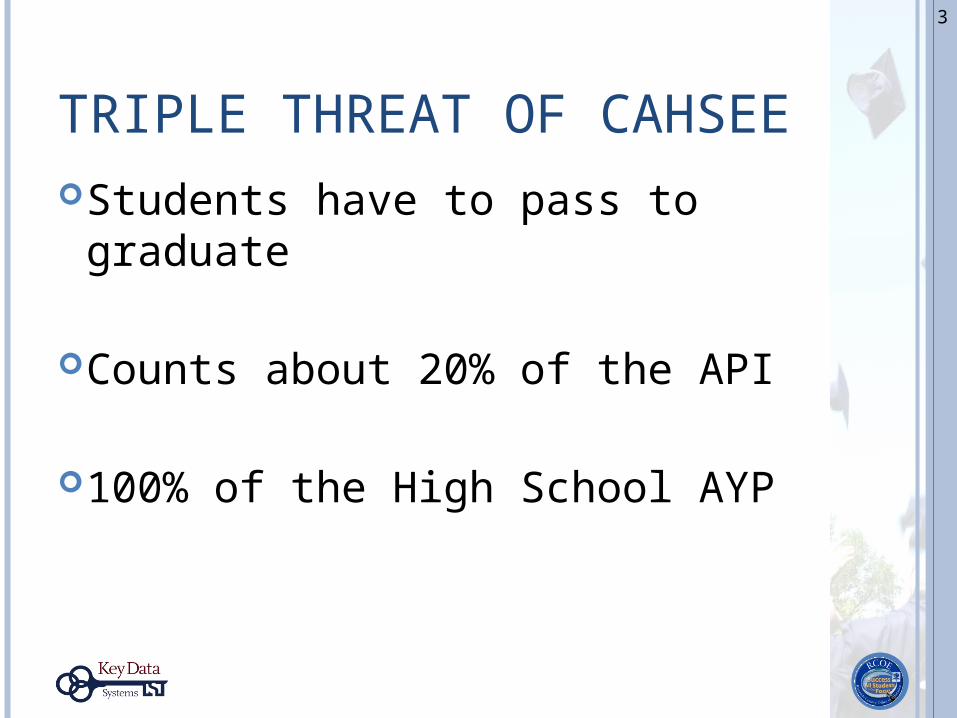
TRIPLE THREAT OF CAHSEEStudents have to pass to
graduate
Counts about 20% of the API
100% of the High School AYP
3
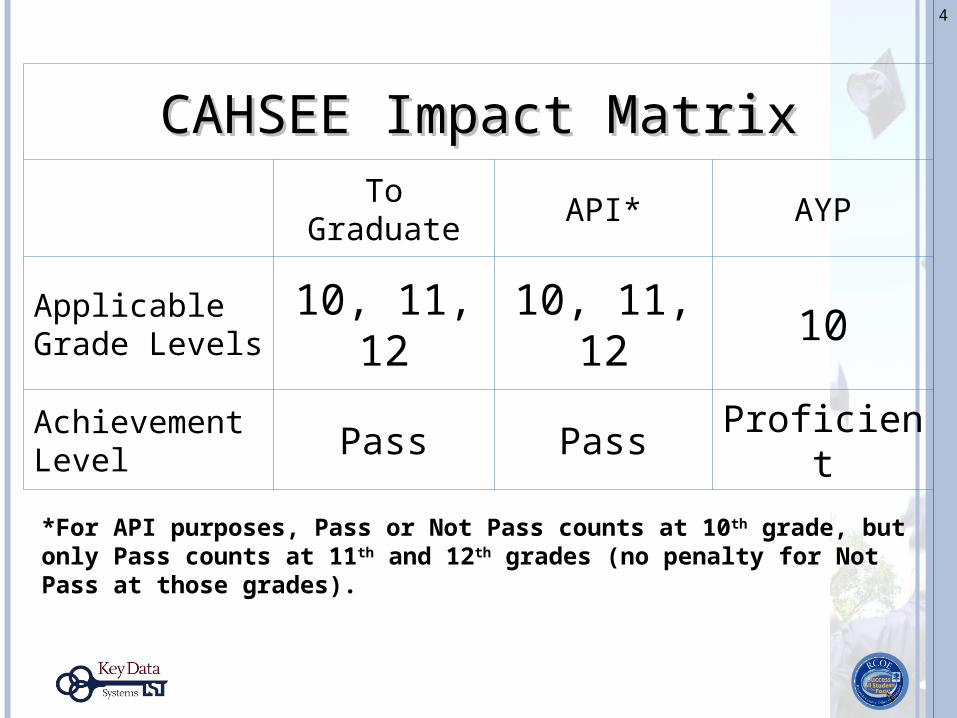
CAHSEE Impact MatrixCAHSEE Impact Matrix
To Graduate API* AYP
Applicable Grade Levels
10, 11, 12
10, 11, 12
10
Achievement Level Pass Pass Proficient
*For API purposes, Pass or Not Pass counts at 10th grade, but only Pass counts at 11th and 12th grades (no penalty for Not Pass at those grades).
4
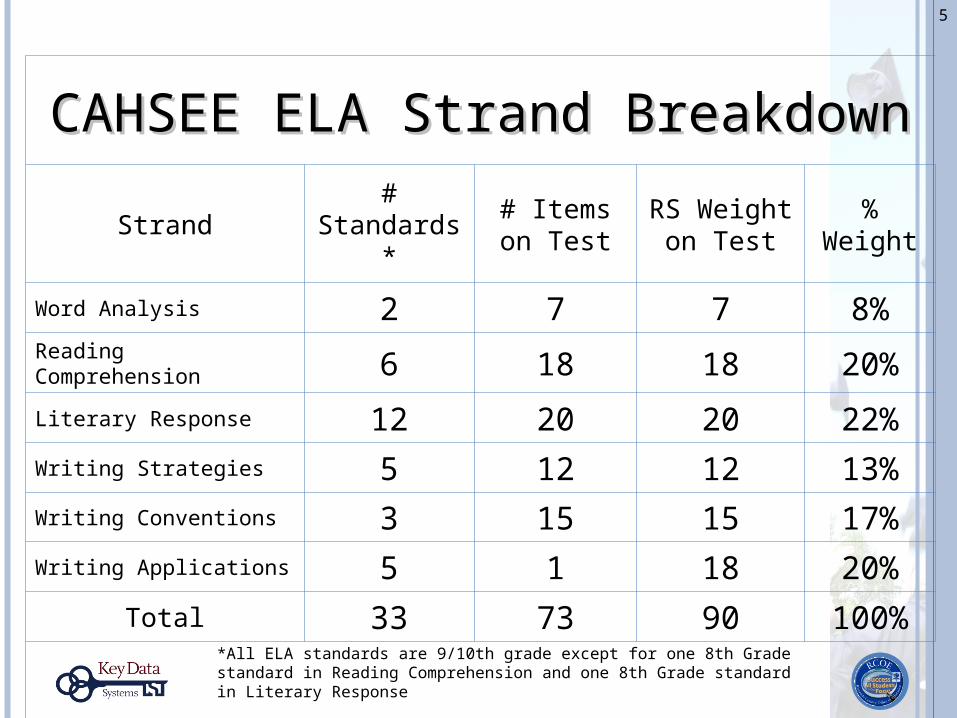
CAHSEE ELA Strand BreakdownCAHSEE ELA Strand Breakdown
Strand#
Standards*# Items on Test
RS Weight on Test
% Weight
Word Analysis 2 7 7 8%Reading Comprehension 6 18 18 20%
Literary Response 12 20 20 22%Writing Strategies 5 12 12 13%Writing Conventions 3 15 15 17%Writing Applications 5 1 18 20%
Total 33 73 90 100%
*All ELA standards are 9/10th grade except for one 8th Grade standard in Reading Comprehension and one 8th Grade standard in Literary Response
5
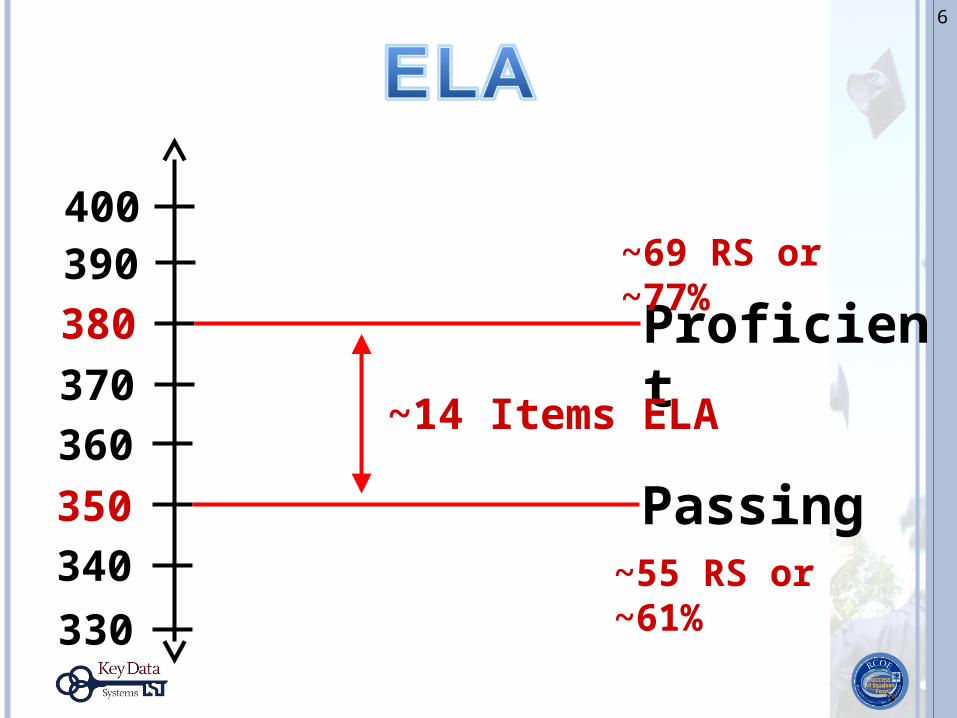
350
380
340
330
360
370
390400
Passing
Proficient
~55 RS or ~61%
~69 RS or ~77%
~14 Items ELA
6
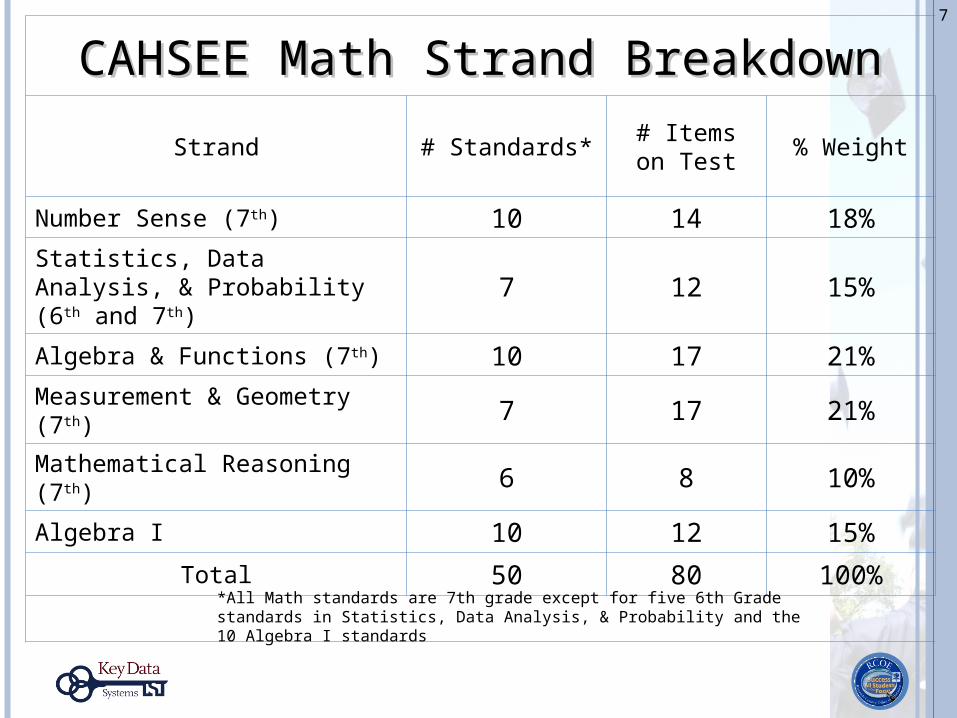
CAHSEE Math Strand BreakdownCAHSEE Math Strand Breakdown
Strand # Standards*# Items on
Test% Weight
Number Sense (7th) 10 14 18%
Statistics, Data Analysis, & Probability (6th and 7th) 7 12 15%
Algebra & Functions (7th) 10 17 21%
Measurement & Geometry (7th) 7 17 21%
Mathematical Reasoning (7th) 6 8 10%
Algebra I 10 12 15%
Total 50 80 100%
*All Math standards are 7th grade except for five 6th Grade standards in Statistics, Data Analysis, & Probability and the 10 Algebra I standards
7
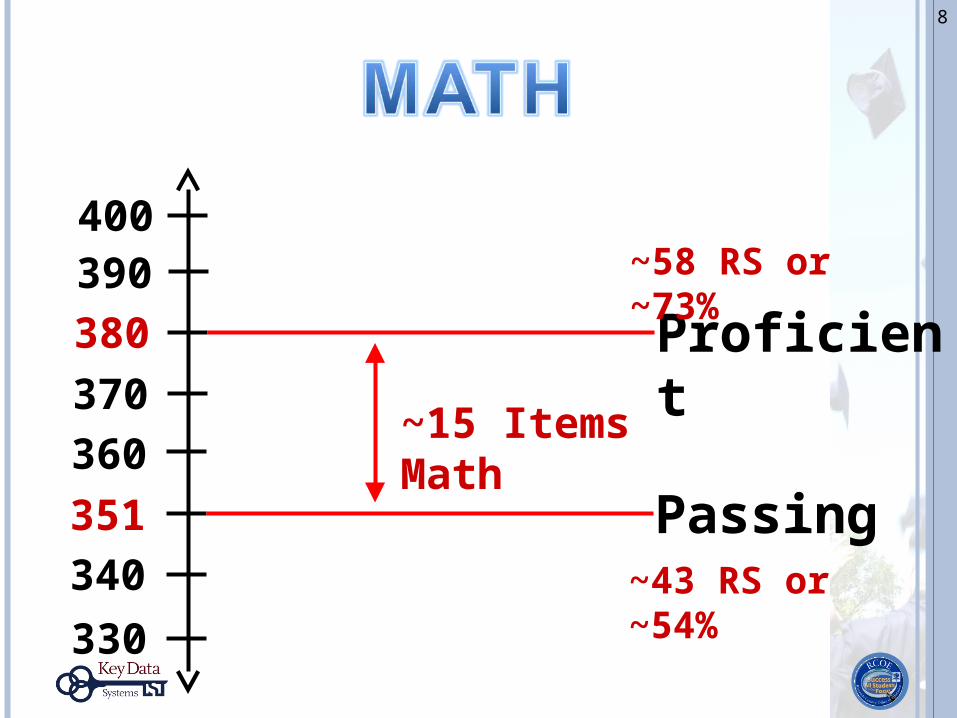
351
380
340
330
360
370
390400
Passing
Proficient
~43 RS or ~54%
~58 RS or ~73%
~15 Items Math
8
DISCUSSSION QUESTION
As a table, discuss:
What motivation is there for a student to aim to be proficient on the CAHSEE as opposed to simply passing? What motivation is there for the school to push students to be proficient?
9
EXAMINING CAHSEE DATAHow many students are close to passing or scoring proficient on CAHSEE?
10

11
2007 2008 2009
Number of Students NOT Passing CAHSEE ELA 24145 22945 23004Number of Students Missed Passing by 10 or Fewer Scaled Score 5381 5713 5554Percent of Students Missed Passing by 10 or Fewer Scaled Score 22.29% 24.90% 24.14%
12
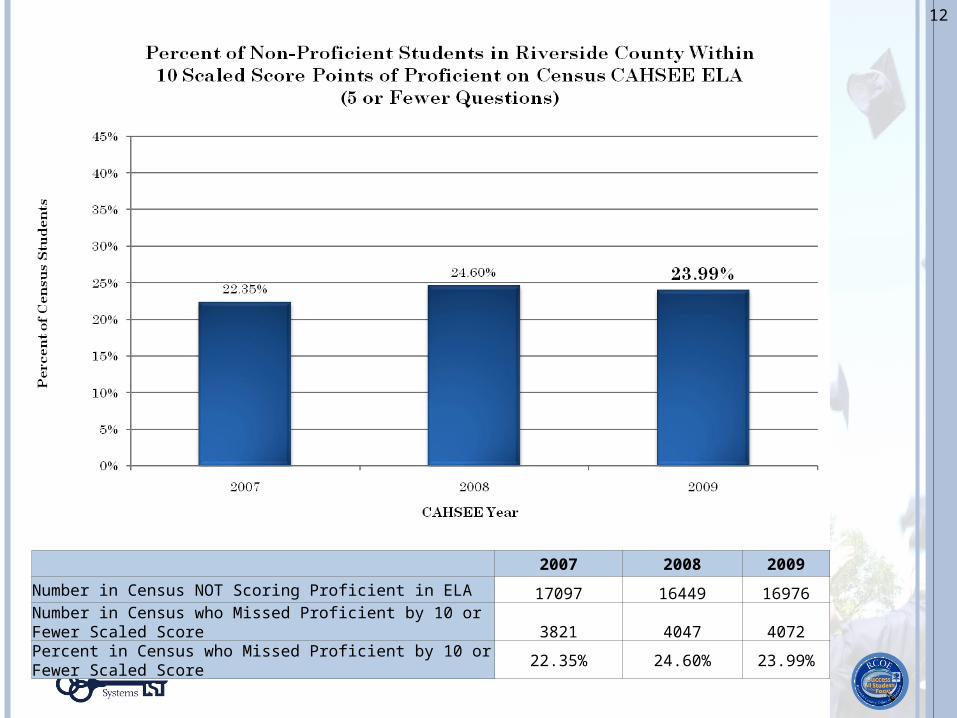
2007 2008 2009
Number in Census NOT Scoring Proficient in ELA 17097 16449 16976Number in Census who Missed Proficient by 10 or Fewer Scaled Score 3821 4047 4072Percent in Census who Missed Proficient by 10 or Fewer Scaled Score 22.35% 24.60% 23.99%
13
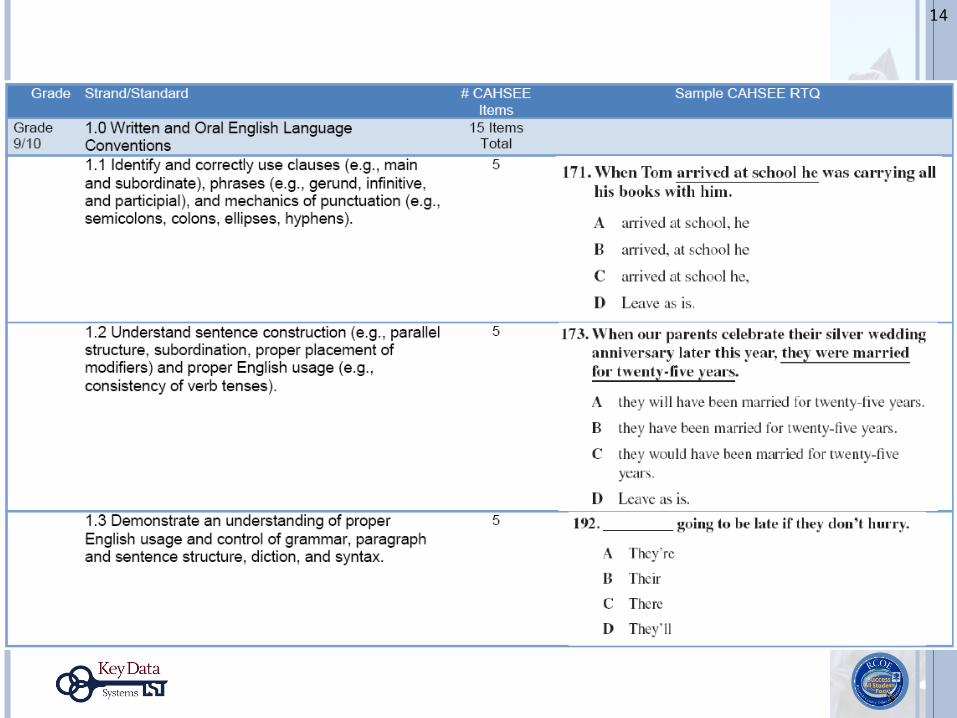
14
15
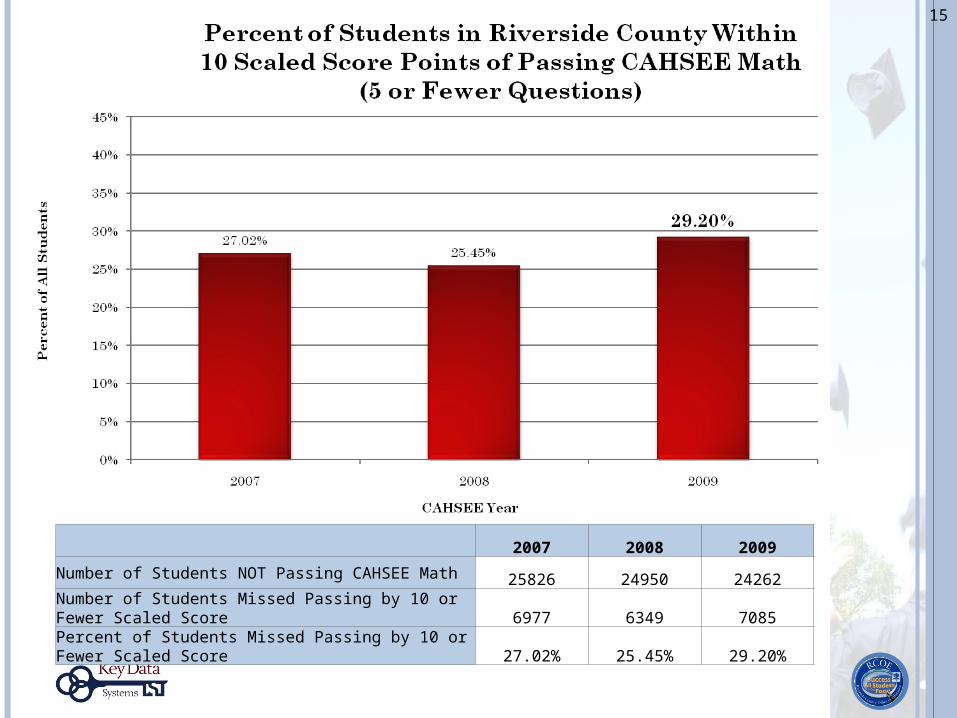
2007 2008 2009
Number of Students NOT Passing CAHSEE Math 25826 24950 24262
Number of Students Missed Passing by 10 or Fewer Scaled Score 6977 6349 7085
Percent of Students Missed Passing by 10 or Fewer Scaled Score 27.02% 25.45% 29.20%
16
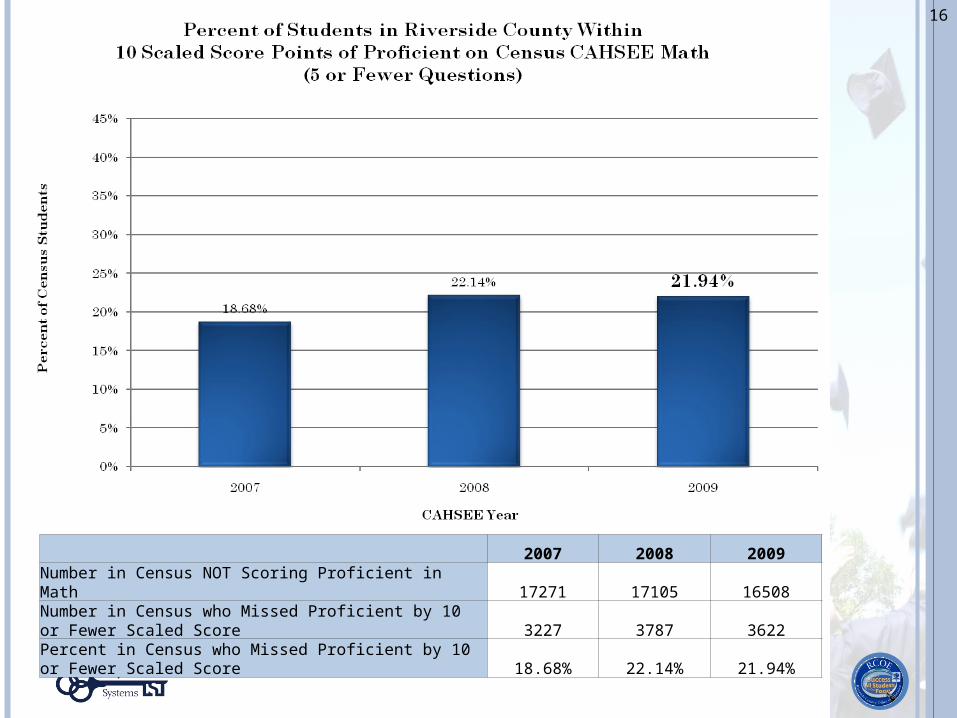
2007 2008 2009Number in Census NOT Scoring Proficient in Math 17271 17105 16508Number in Census who Missed Proficient by 10 or Fewer Scaled Score 3227 3787 3622Percent in Census who Missed Proficient by 10 or Fewer Scaled Score 18.68% 22.14% 21.94%
17
18
19
DISCUSSSION QUESTION
With a partner, discuss:
Which would have the best payoff: - focusing instruction on an area where students
already do well or an area that they struggle with?
- focusing on foundational topics, or advanced topics?
- teaching all of the standards or narrowing the focus?
CAHSEE DIAGNOSTIC PROCESS
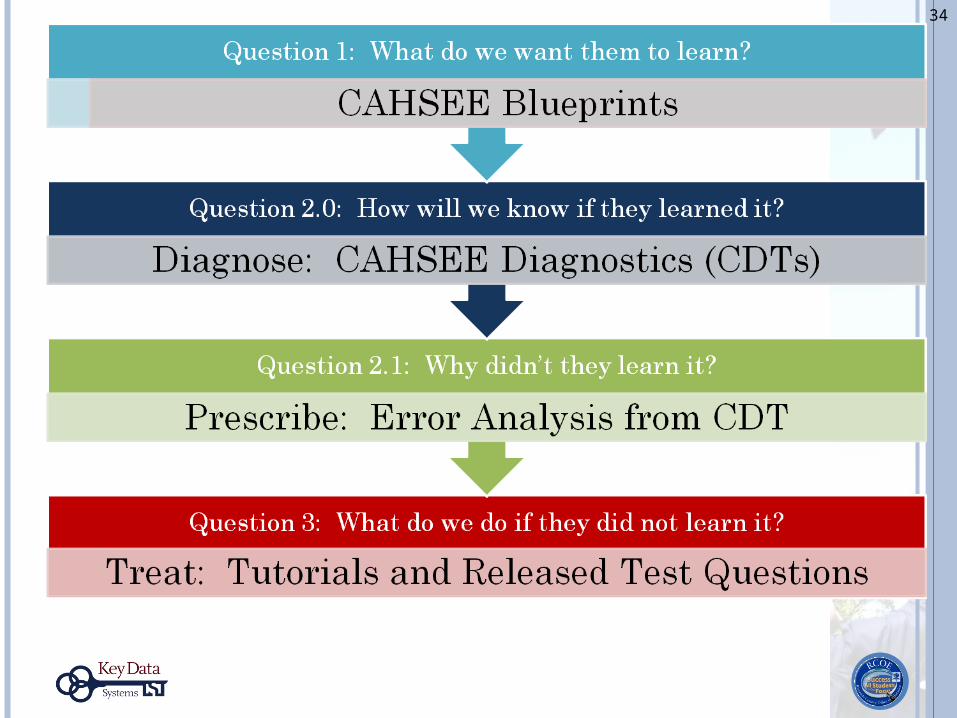
START WITH THE KEY QUESTIONS
What do we want them to know?
How will we know if they learned it? If they did not learn it, why?
What will we do if they did not learn it?
21
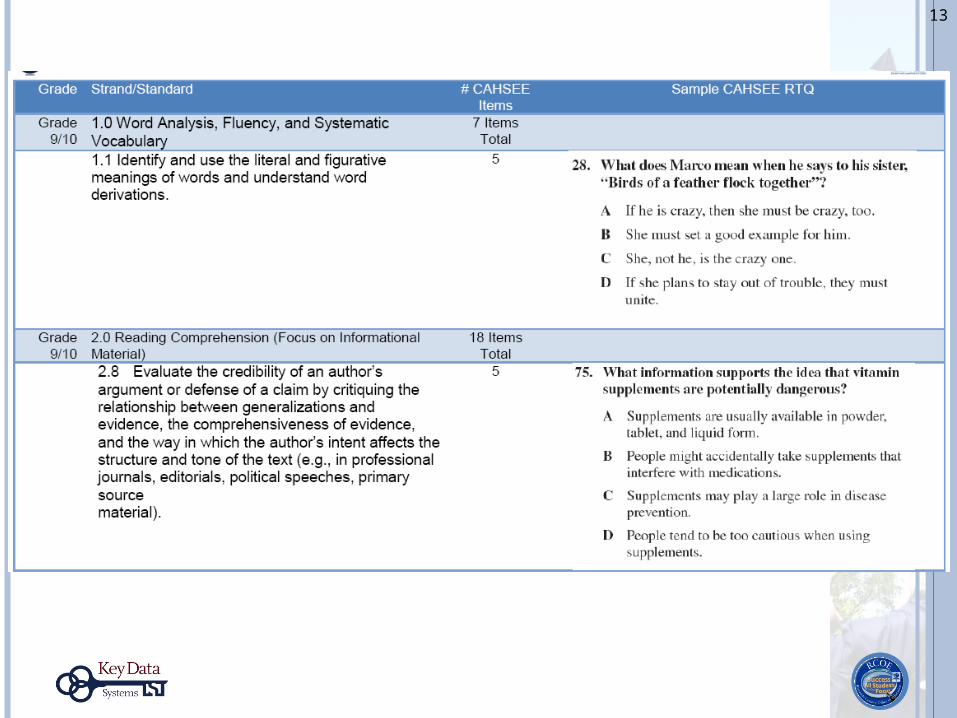
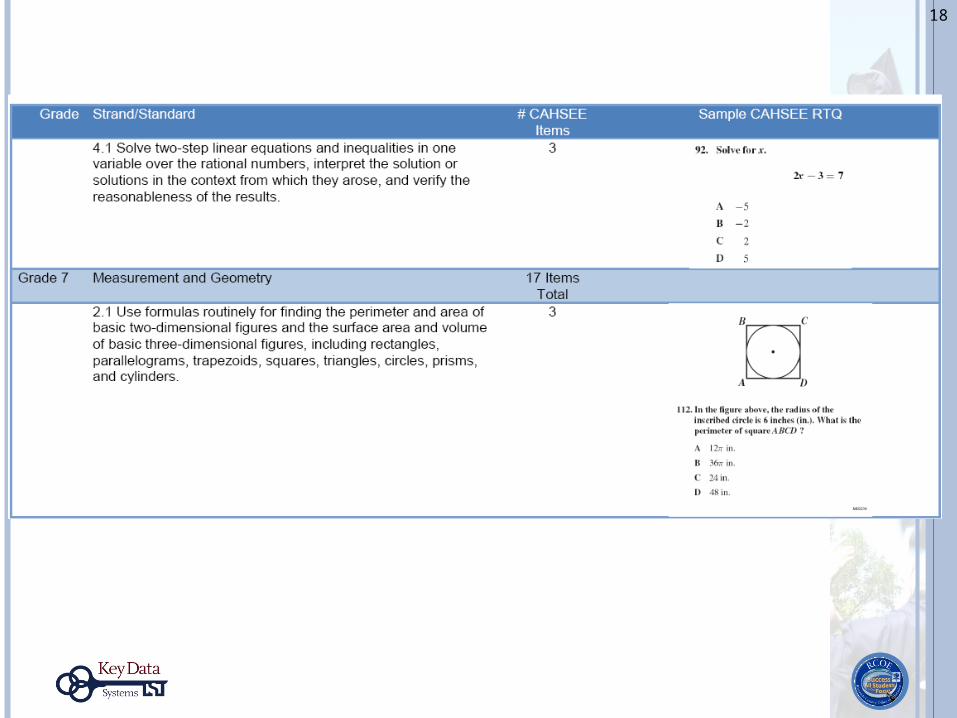
WHAT DO WE WANT THEM TO KNOW?CAHSEE STANDARDS INDICATED ON BLUEPRINTS
How many questions will be asked of each standard?
What is the weight of each strand/standard?
What standards are not tested?
Use Released Test Questions to gauge rigor.
22
23
HOW WILL WE KNOW IF THEY LEARNED IT?TWO APPROACHES
Failure on First CAHSEE Attempt INTERVENTION—the students that are already at
high school level Retake Preparation
CAHSEE Diagnostic PREVENTION—preparation for CAHSEE before
attempting
24
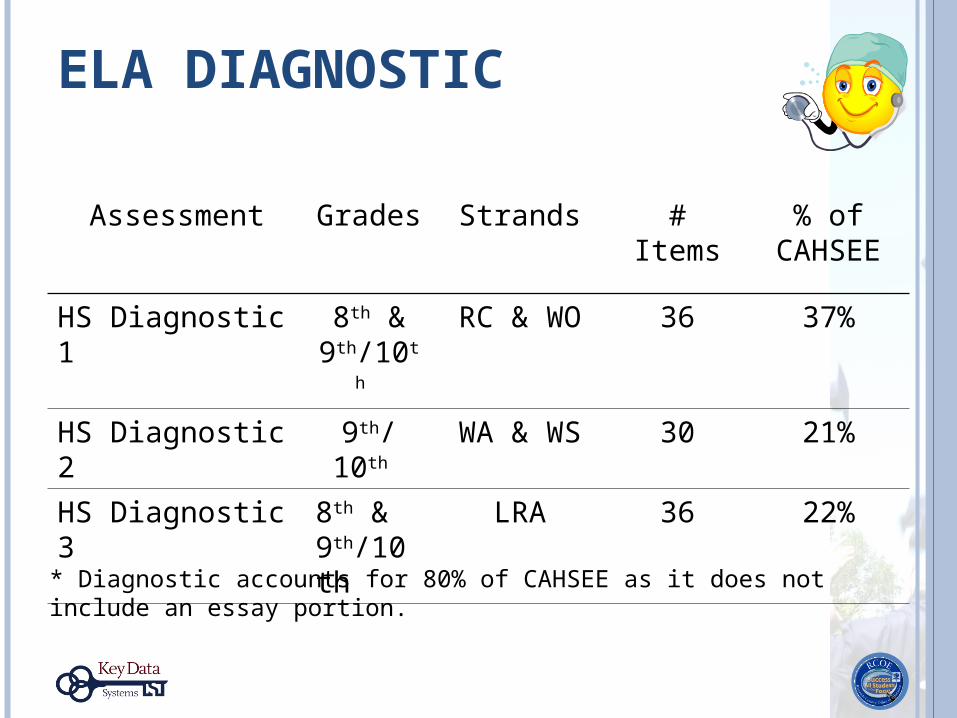
ELA DIAGNOSTIC
Assessment Grades Strands # Items % of CAHSEE
HS Diagnostic 1 8th & 9th/10th
RC & WO 36 37%
HS Diagnostic 2 9th/10th WA & WS 30 21%
HS Diagnostic 3 8th & 9th/10th
LRA 36 22%
* Diagnostic accounts for 80% of CAHSEE as it does not include an essay portion.
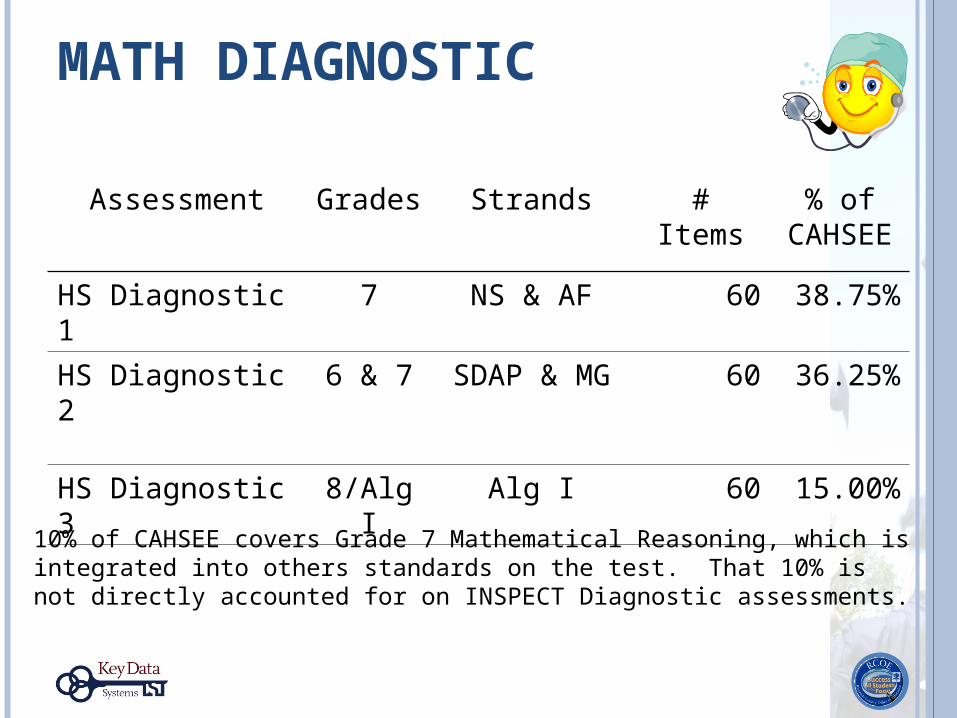
MATH DIAGNOSTIC
Assessment Grades Strands # Items % of CAHSEE
HS Diagnostic 1 7 NS & AF 60 38.75%
HS Diagnostic 2 6 & 7 SDAP & MG 60 36.25%
HS Diagnostic 3 8/Alg I Alg I 60 15.00%
10% of CAHSEE covers Grade 7 Mathematical Reasoning, which is integrated into others standards on the test. That 10% is not directly accounted for on INSPECT Diagnostic assessments.
CAHSEE DIAGNOSTICS
With EADMS or OARS, you have the ability to create individual standards-level formative assessments within the intervention classes. These may be used as part of the exit criteria or for progress monitoring.
INSPECT has CAHSEE Diagnostics that cover a few highly-tested standards each
INSPECT has full Blueprint Exams which match the structure of a full CAHSEE test
27
Where to find these in OARS
IF THEY DID NOT LEARN IT, WHY?WHAT WILL WE DO IF THEY DID NOT LEARN IT?
Results from Diagnostics to determine the “WHY” Error analysis Where to find results from Diagnostics
CAHSEE Resources by CDE
CAHSEE Tutorials
Other district or school resources
28
CDE RESOURCES Released Test Questions
CAHSEE Blueprints
Student Study Guides
Teacher Guides
See http://hsee.notlong.com
29
RELEASED TEST QUESTIONS (RTQS) Understanding the format of test questions, discussing testing with
students, and modeling teacher-created tests after the CAHSEE can improve student performance.
Familiarize students and teachers with the format of CAHSEE questions.
Allow teachers to use real questions as samples to discuss incorrect answer elimination, metacognition, etc.
Not intended to be used as a sample test but may be broken down and used for information and familiarization.
30
CAHSEE TUTORIALS
Succinct summaries of what students need to know for a particular standard. Sample problems with solutions worked out.
Tutorials are intended as support and background information to guide teachers in their interventions.
The CAHSEE Tutorials also provide information on common student errors which will help teachers perform “Wrong Answer Analysis” and to vary instruction during re-teaching.
31
QUESTIONS ? ? ?
How could you use error analysis to determine intervention strategies?
How could the blueprints, tutorials, and RTQ’s be used to help science, physical education, history, and elective teachers support CAHSEE math and ELA standards in their courses?
32

HOPE IS NOT A STRATEGYYOU MUST HAVE A PLAN
If you don't know where you are going, you will wind up somewhere else. -Yogi Berra
33
34
35
SIMPLE STATISTICS DIAGNOSTIC SAMPLE
Standards covered:
Mean, median, mode, and normal distribution
Directions:Take out a pencil or pen, please
Take about 7 minutes to complete the diagnostic
When everyone is finished at your table, compile how many people chose each option for each of the 5 questions (note: on a real diagnostic, OARS will do this for you)Example:1)A-3 B-0 C-2 D-12)A-5 B-0 C-1 D-0. . .Write it on a scratch sheet of paper and bring it to me.
36
SIMPLE STATISTICS DIAGNOSTIC DISCUSSION
Discuss with an elbow partner:
1)What do you see in this data?
2)What, specifically was/were the problem(s)?
3)What would you do about it?
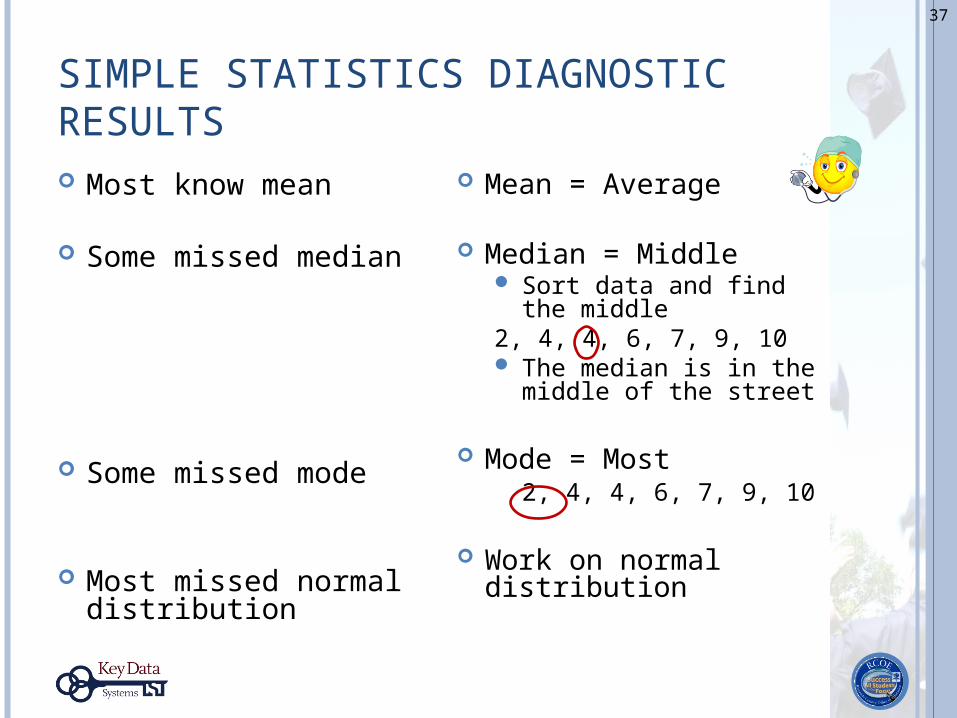
SIMPLE STATISTICS DIAGNOSTIC RESULTS
37
Most know mean
Some missed median
Some missed mode
Most missed normal distribution
Mean = Average
Median = Middle Sort data and find the
middle2, 4, 4, 6, 7, 9, 10 The median is in the
middle of the street
Mode = Most2, 4, 4, 6, 7, 9, 10
Work on normal distribution
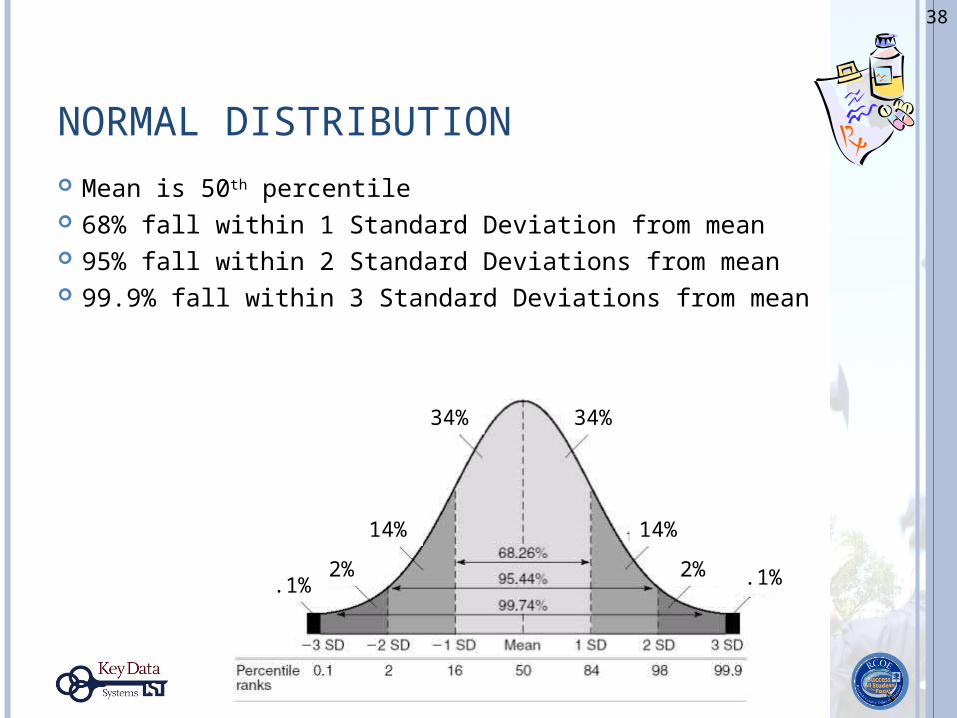
NORMAL DISTRIBUTION
Mean is 50th percentile 68% fall within 1 Standard Deviation from mean 95% fall within 2 Standard Deviations from mean 99.9% fall within 3 Standard Deviations from mean
38
68% 95%.1%
2%
14%
34%
.1%2%
14%
34%
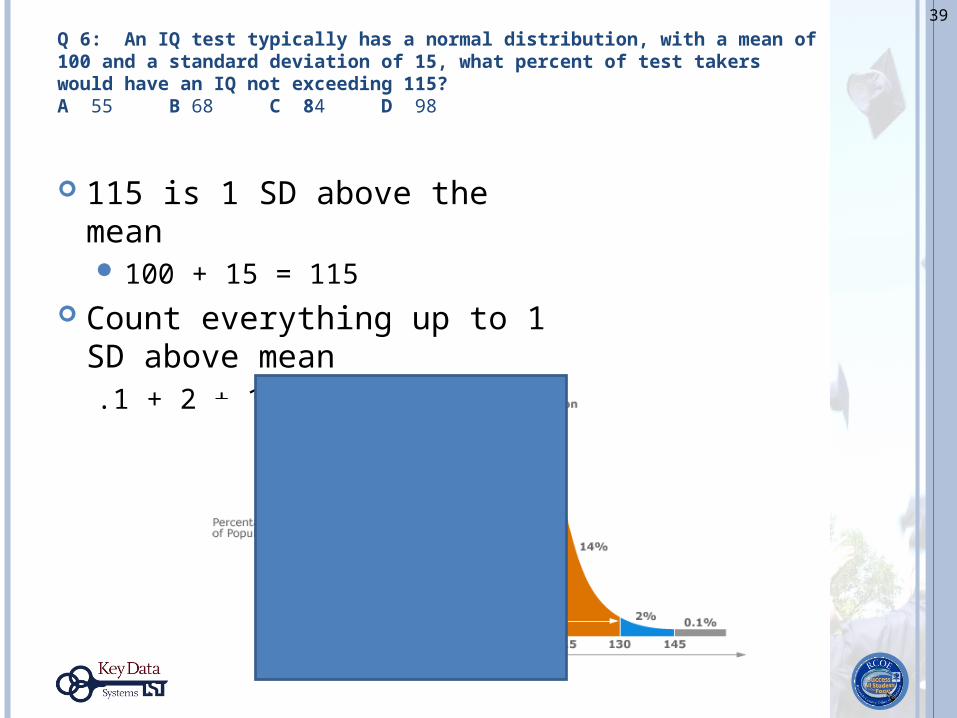
Q 6: An IQ test typically has a normal distribution, with a mean of 100 and a standard deviation of 15, what percent of test takers would have an IQ not exceeding 115?A 55 B 68 C 84 D 98
39
115 is 1 SD above the mean 100 + 15 = 115
Count everything up to 1 SD above mean.1 + 2 + 14 + 34 + 34 = 84
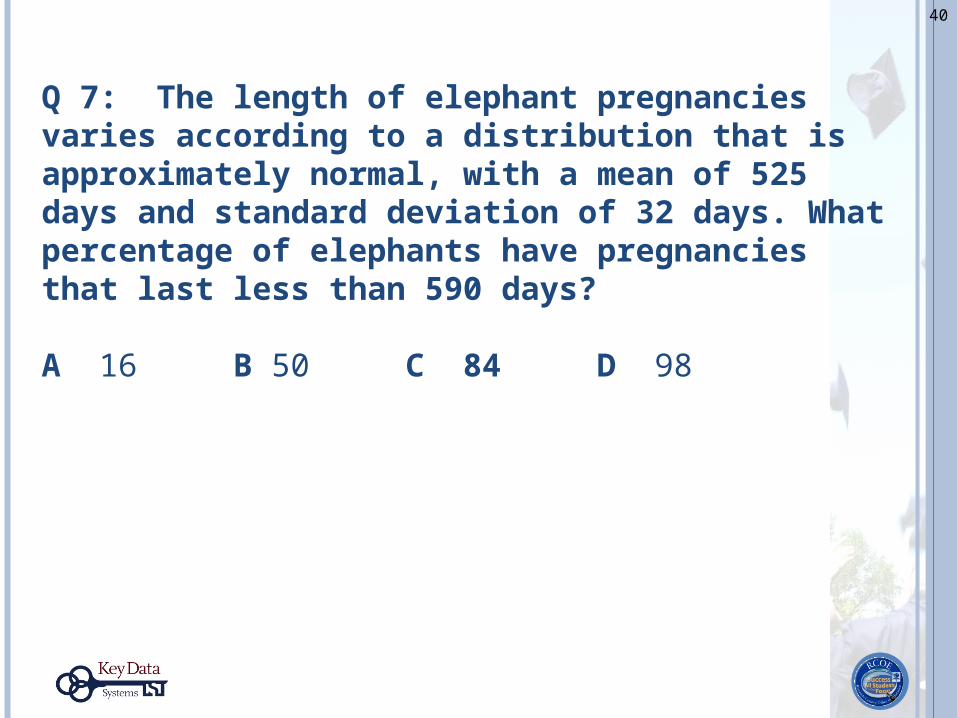
Q 7: The length of elephant pregnancies varies according to a distribution that is approximately normal, with a mean of 525 days and standard deviation of 32 days. What percentage of elephants have pregnancies that last less than 590 days?
A 16 B 50 C 84 D 98
40
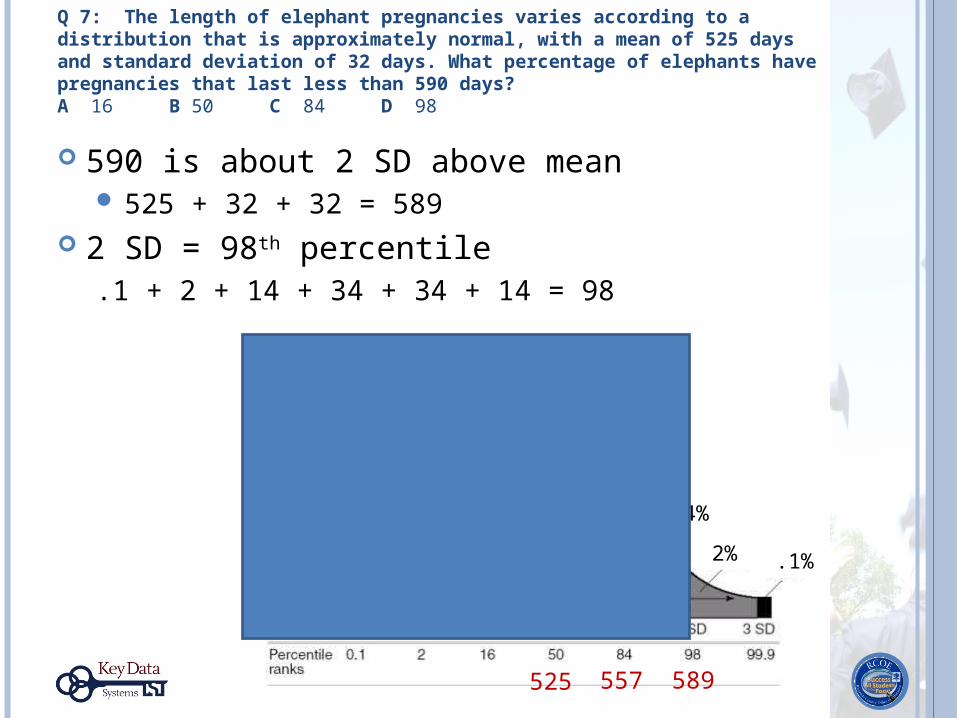
590 is about 2 SD above mean 525 + 32 + 32 = 589
2 SD = 98th percentile.1 + 2 + 14 + 34 + 34 + 14 = 98
.1%2%
14%
34%
.1%2%
14%
34%
525 557 589
Q 7: The length of elephant pregnancies varies according to a distribution that is approximately normal, with a mean of 525 days and standard deviation of 32 days. What percentage of elephants have pregnancies that last less than 590 days? A 16 B 50 C 84 D 98
NORMAL DISTRIBUTION PRACTICE QUESTIONS
42
Why are incorrect answer choices wrong?
How could you change the stem to make each incorrect response correct?
Write a new question and justify your incorrect answer choices.
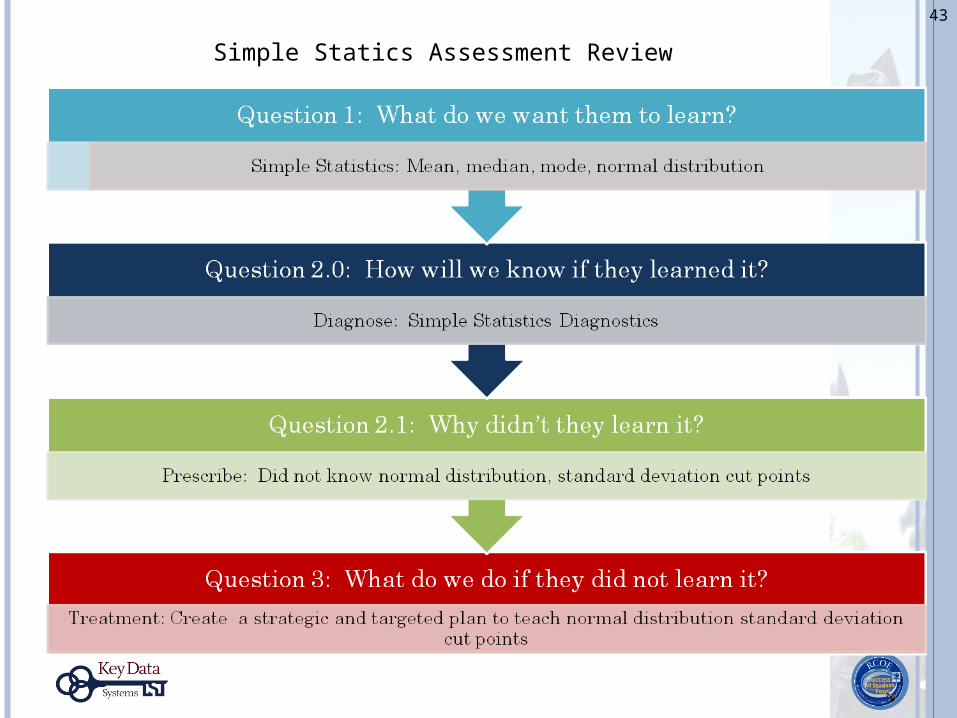
Simple Statics Assessment Review
43
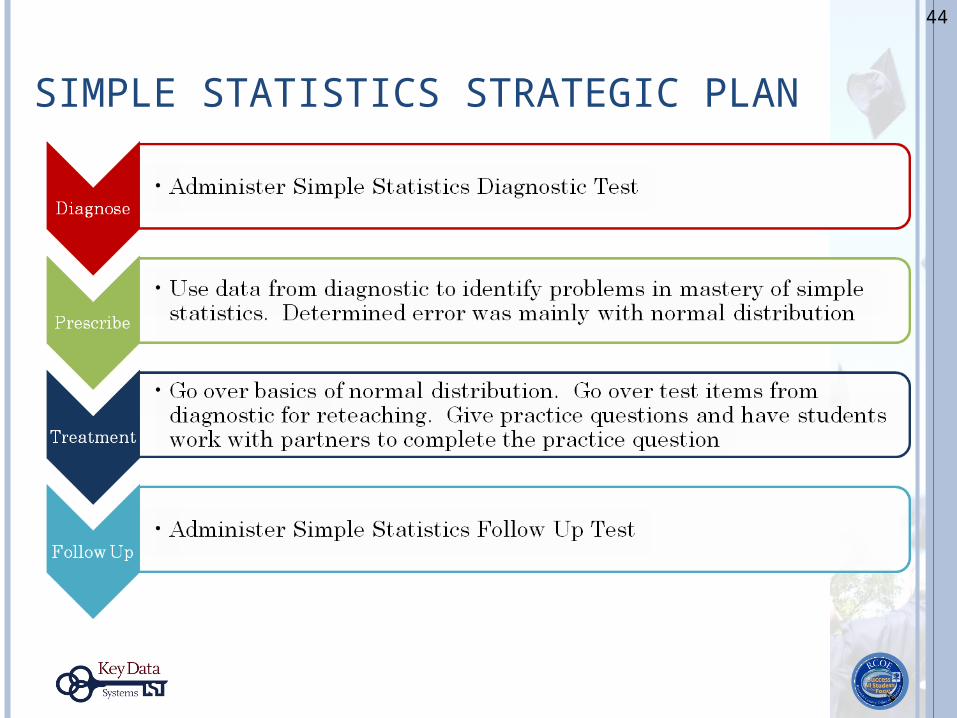
SIMPLE STATISTICS STRATEGIC PLAN
44
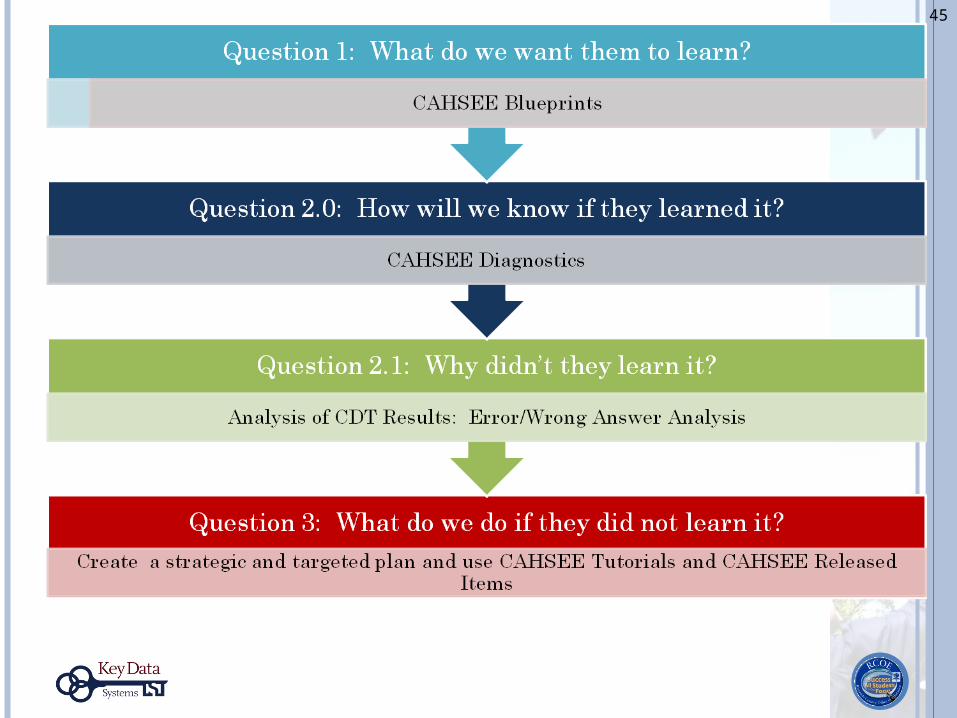
45
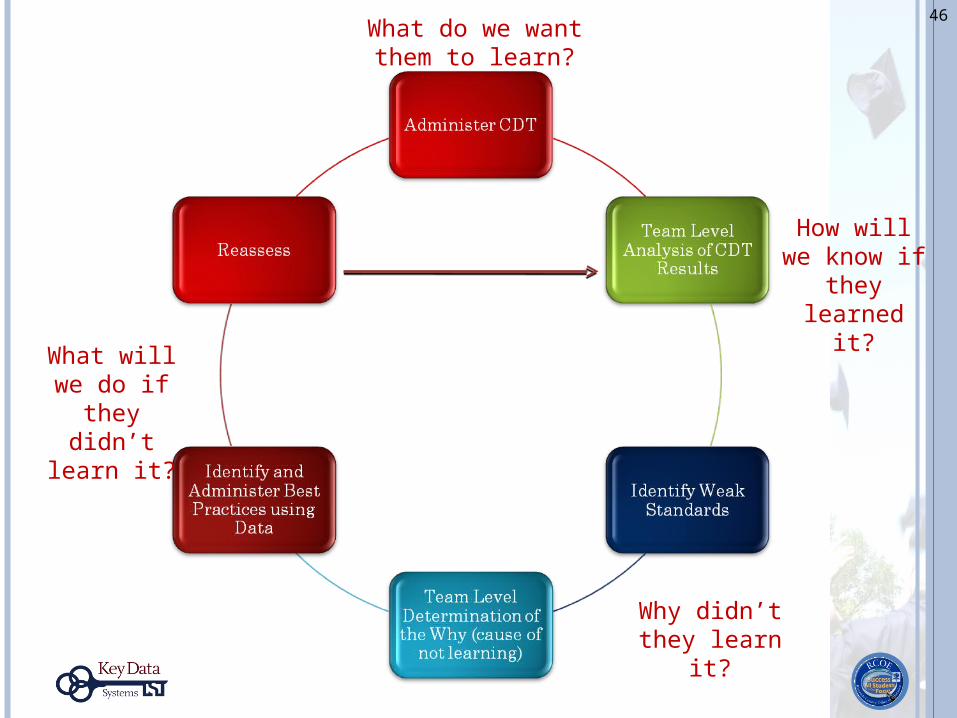
What do we want them to learn?
How will we know if they learned it?
Why didn’t they learn it?
What will we do if they didn’t
learn it?
46