calamos global convertible · pdf filecalamos investments llc, ... united states treasury note...
TRANSCRIPT

NOT FDIC INSURED | MAY LOSE VALUENO BANK GUARANTEE
CONVERTIBLE DATA AS OF 3/31/18
OVERVIEWThe fund invests in globalconvertible securities, striving tobalance risk/reward while providinggrowth and income.
KEY FEATURES» Provides broadly diversified
exposure to the globalconvertible bond universe
» Leverages more than 40 yearsof research in convertiblesecurity investing
» Seeks to provide upsideparticipation in equity marketswith less exposure to downsidethan an equity-only portfolioover a full market cycle
» Blends global investmentthemes and fundamentalresearch via active management
PORTFOLIO FITConsisting of convertible securitiesthat can participate in upside equitymovements with potentially limiteddownside exposure, the fund canprovide a means to manage risk inconjunction with an equityallocation. The fund can also servea role within a fixed-incomeallocation, as convertibles haveperformed well during periods ofrising interest rates and inflation.
FUND TICKER SYMBOLSA Shares C Shares I SharesCAGCX CCGCX CXGCX
Convertibles (BofA ML Global 300 Convertible Index) Bonds (BBgBarc Global Aggregate Bond Index)
-10%
0%
10%
20%
30%
40%
50%
60%
JUL '16 - DEC '16
JUL '12 - DEC '13
OCT '10 - FEB '11
DEC '08 - JUN '09
JUN '05 - JUN '06
JUN '03 - JUN '04
NOV '01 - APR '02
OCT '98 - JAN '00
48.96
-3.79-0.94 -4.54
8.030.65
10.81
-1.62
17.30
-1.41
7.92
-3.01
25.49
-0.43
3.77
-8.18
Yield Increase (BPS)
263 122 176 134 187 134 157 123
Notable Global Convertible Outperformance vs. Bonds in the Faceof Rate Increases
The chart below shows how global convertibles have outperformed global bonds during periods when the
10-year Treasury bond yields rose more than 100 basis points.
Performance data quoted represents past performance, which is no guarantee of future results. Current performance may belower or higher than the performance quoted. Indexes are unmanaged, do not reflect fees or expenses and are not available fordirect investment. See last page for index definitions. Source: Morningstar Direct. Most recent data as of 3/31/18. Rising rateenvironment periods from troughs to peak from October 1998 to December 2016. The indexes shown are not intended as proxiesfor the Fund’s actual performance an may differ significantly once the Fund has a performance history. A basis point is equal to 1/100th of 1%.
AVERAGE ANNUAL RETURNS
Calamos Global Convertible Fund
I Shares - at NAV (Inception–12/31/14)
A Shares - at NAV (Inception–12/31/14)
A Shares - Load adjusted*
ICE BofAML VG00 - Global 300
1-YEAR
11.70%
11.47
8.93
14.30
3-YEAR
4.97%
4.68
2.98
8.35
SINCE A SHAREINCEPTION
N/A%
5.36
3.79
8.41
SINCE I SHAREINCEPTION
5.63%
N/A
N/A
8.41
Performance data quoted represents past performance, which is no guarantee of future results. Current performance may belower or higher than the performance quoted. The principal value and return of an investment will fluctuate so thatyour shares, when redeemed, may be worth more or less than their original cost. Performance reflected at NAV doesnot include the Fund’s maximum front-end sales load of 2.25%.* Had it been included, the Fund’s return would havebeen lower. For the most recent fund month-end performance information visit www.calamos.com.In calculating net investment income, all applicable fees and expenses are deducted from the returns.Class I shares are offered primarily for direct investment by investors through certain tax-exempt retirement plans (including 401(k)plans, 457 plans, employer-sponsored 403(b) plans, profit sharing and money purchase pension plans, defined benefit plans andnon-qualified deferred compensation plans) and by institutional clients, provided such plans or clients have assets of at least $1million. Class I shares may also be offered to certain other entities or programs, including, but not limited to, investmentcompanies, under certain circumstances.*Prior to 2/28/17, the Fund had a maximum front-end sales charge of 4.75%.
LARGEST 10 HOLDINGS† INDUSTRY SECURITY DESCRIPTION %
United States Treasury Note Other 3.1United States Treasury Note Other 2.9Bank of America Corp. Diversified Banks 7.25% Cv Pfd 2.6Wells Fargo & Company Diversified Banks 7.50% Cv Pfd 2.4Corestate Capital Holding, SA Real Estate Operating Companies 1.38% Cv Due 2022 2.4Salesforce.com, Inc. Application Software 0.25% Cv Due 2018 2.3America Movil, SAB de CV Integrated Telecommunication Services 0% Cv Due 2020 2.2Citrix Systems, Inc. Application Software 0.50% Cv Due 2019 1.9Safran, SA Aerospace & Defense 0% Cv Due 2020 1.9Altaba, Inc. Internet Software & Services 0% Cv Due 2018 1.8TOTAL 23.5
Calamos Global Convertible Fund
Holdings and weightings are subject to change daily. Holdings are provided for informational purposes only and should not be deemed as arecommendation to buy or sell the securities mentioned.†Top 10 Holdings and Sector Weightings are calculated as a percentage of net assets and exclude cash or cash equivalents. The SectorWeightings table also excludes any security class that is not assigned to a GICS sector, such as but not limited to government/sovereignbonds, mutual funds or index options. You can obtain a complete listing of holdings by visiting www.calamos.com.
There can be no assurance that the Fund willachieve its investment objective.
CONVERTIBLE DATA AS OF 3/31/18
Calamos Financial Services LLC, Distributor2020 Calamos Court | Naperville, IL 60563-2787800.582.6959 | www.calamos.com | [email protected]© 2018 Calamos Investments LLC. All Rights Reserved.Calamos® and Calamos Investments® are registered trademarks ofCalamos Investments LLC.
GCVFCT 1205 0318Q R
Calamos Global Convertible Fund
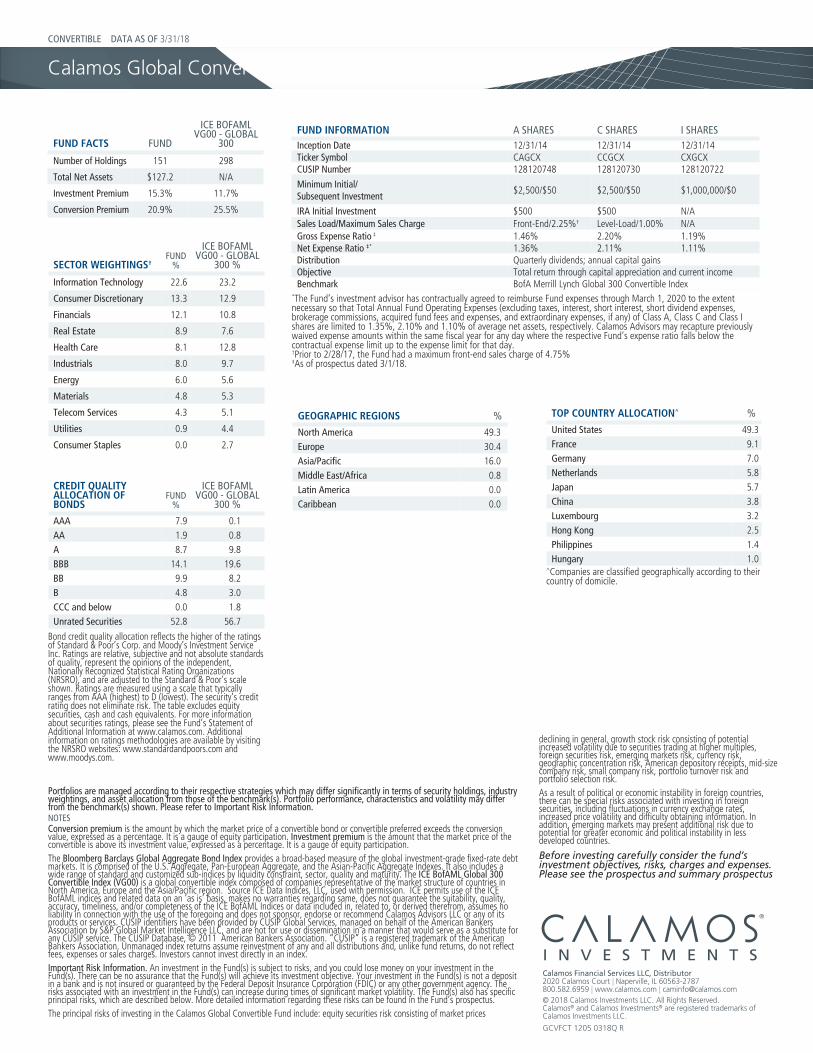
FUND FACTS FUND
ICE BOFAMLVG00 - GLOBAL
300
Number of Holdings 151 298
Total Net Assets $127.2 N/A
Investment Premium 15.3% 11.7%
Conversion Premium 20.9% 25.5%
SECTOR WEIGHTINGS†FUND
%
ICE BOFAMLVG00 - GLOBAL
300 %
Information Technology 22.6 23.2
Consumer Discretionary 13.3 12.9
Financials 12.1 10.8
Real Estate 8.9 7.6
Health Care 8.1 12.8
Industrials 8.0 9.7
Energy 6.0 5.6
Materials 4.8 5.3
Telecom Services 4.3 5.1
Utilities 0.9 4.4
Consumer Staples 0.0 2.7
Portfolios are managed according to their respective strategies which may differ significantly in terms of security holdings, industryweightings, and asset allocation from those of the benchmark(s). Portfolio performance, characteristics and volatility may differfrom the benchmark(s) shown. Please refer to Important Risk Information.NOTESConversion premium is the amount by which the market price of a convertible bond or convertible preferred exceeds the conversionvalue, expressed as a percentage. It is a gauge of equity participation. Investment premium is the amount that the market price of theconvertible is above its investment value, expressed as a percentage. It is a gauge of equity participation.The Bloomberg Barclays Global Aggregate Bond Index provides a broad-based measure of the global investment-grade fixed-rate debtmarkets. It is comprised of the U.S. Aggregate, Pan-European Aggregate, and the Asian-Pacific Aggregate Indexes. It also includes awide range of standard and customized sub-indices by liquidity constraint, sector, quality and maturity. The ICE BofAML Global 300Convertible Index (VG00) is a global convertible index composed of companies representative of the market structure of countries inNorth America, Europe and the Asia/Pacific region. Source ICE Data Indices, LLC, used with permission. ICE permits use of the ICEBofAML indices and related data on an ‘as is’ basis, makes no warranties regarding same, does not guarantee the suitability, quality,accuracy, timeliness, and/or completeness of the ICE BofAML Indices or data included in, related to, or derived therefrom, assumes noliability in connection with the use of the foregoing and does not sponsor, endorse or recommend Calamos Advisors LLC or any of itsproducts or services. CUSIP identifiers have been provided by CUSIP Global Services, managed on behalf of the American BankersAssociation by S&P Global Market Intelligence LLC, and are not for use or dissemination in a manner that would serve as a substitute forany CUSIP service. The CUSIP Database, © 2011 American Bankers Association. “CUSIP” is a registered trademark of the AmericanBankers Association. Unmanaged index returns assume reinvestment of any and all distributions and, unlike fund returns, do not reflectfees, expenses or sales charges. Investors cannot invest directly in an index.Important Risk Information. An investment in the Fund(s) is subject to risks, and you could lose money on your investment in theFund(s). There can be no assurance that the Fund(s) will achieve its investment objective. Your investment in the Fund(s) is not a depositin a bank and is not insured or guaranteed by the Federal Deposit Insurance Corporation (FDIC) or any other government agency. Therisks associated with an investment in the Fund(s) can increase during times of significant market volatility. The Fund(s) also has specificprincipal risks, which are described below. More detailed information regarding these risks can be found in the Fund’s prospectus.The principal risks of investing in the Calamos Global Convertible Fund include: equity securities risk consisting of market prices
GEOGRAPHIC REGIONS %
North America 49.3Europe 30.4Asia/Pacific 16.0Middle East/Africa 0.8Latin America 0.0Caribbean 0.0
TOP COUNTRY ALLOCATION^ %
United States 49.3France 9.1Germany 7.0Netherlands 5.8Japan 5.7China 3.8Luxembourg 3.2Hong Kong 2.5Philippines 1.4Hungary 1.0
^Companies are classified geographically according to theircountry of domicile.
CREDIT QUALITYALLOCATION OFBONDS
FUND%
ICE BOFAMLVG00 - GLOBAL
300 %
AAA 7.9 0.1AA 1.9 0.8A 8.7 9.8BBB 14.1 19.6BB 9.9 8.2B 4.8 3.0CCC and below 0.0 1.8Unrated Securities 52.8 56.7
Bond credit quality allocation reflects the higher of the ratingsof Standard & Poor’s Corp. and Moody’s Investment ServiceInc. Ratings are relative, subjective and not absolute standardsof quality, represent the opinions of the independent,Nationally Recognized Statistical Rating Organizations(NRSRO), and are adjusted to the Standard & Poor’s scaleshown. Ratings are measured using a scale that typicallyranges from AAA (highest) to D (lowest). The security’s creditrating does not eliminate risk. The table excludes equitysecurities, cash and cash equivalents. For more informationabout securities ratings, please see the Fund’s Statement ofAdditional Information at www.calamos.com. Additionalinformation on ratings methodologies are available by visitingthe NRSRO websites: www.standardandpoors.com andwww.moodys.com.
FUND INFORMATION A SHARES C SHARES I SHARESInception Date 12/31/14 12/31/14 12/31/14Ticker Symbol CAGCX CCGCX CXGCXCUSIP Number 128120748 128120730 128120722
Minimum Initial/Subsequent Investment
$2,500/$50 $2,500/$50 $1,000,000/$0
IRA Initial Investment $500 $500 N/ASales Load/Maximum Sales Charge Front-End/2.25%† Level-Load/1.00% N/AGross Expense Ratio ‡ 1.46% 2.20% 1.19%Net Expense Ratio ‡* 1.36% 2.11% 1.11%Distribution Quarterly dividends; annual capital gainsObjective Total return through capital appreciation and current incomeBenchmark BofA Merrill Lynch Global 300 Convertible Index
*The Fund’s investment advisor has contractually agreed to reimburse Fund expenses through March 1, 2020 to the extentnecessary so that Total Annual Fund Operating Expenses (excluding taxes, interest, short interest, short dividend expenses,brokerage commissions, acquired fund fees and expenses, and extraordinary expenses, if any) of Class A, Class C and Class Ishares are limited to 1.35%, 2.10% and 1.10% of average net assets, respectively. Calamos Advisors may recapture previouslywaived expense amounts within the same fiscal year for any day where the respective Fund’s expense ratio falls below thecontractual expense limit up to the expense limit for that day.†Prior to 2/28/17, the Fund had a maximum front-end sales charge of 4.75%‡As of prospectus dated 3/1/18.
declining in general, growth stock risk consisting of potentialincreased volatility due to securities trading at higher multiples,foreign securities risk, emerging markets risk, currency risk,geographic concentration risk, American depository receipts, mid-sizecompany risk, small company risk, portfolio turnover risk andportfolio selection risk.As a result of political or economic instability in foreign countries,there can be special risks associated with investing in foreignsecurities, including fluctuations in currency exchange rates,increased price volatility and difficulty obtaining information. Inaddition, emerging markets may present additional risk due topotential for greater economic and political instability in lessdeveloped countries.
Before investing carefully consider the fund’sinvestment objectives, risks, charges and expenses.Please see the prospectus and summary prospectus