calculating equity risk premium for russian...
TRANSCRIPT

Academic Society Journal: Social Science Insight, Vol. 1, No. 5, pp. 4-15. ISSN 2029-0365 GLOBAL ACADEMIC SOCIETY JOURNAL: SOCIAL SCIENCE INSIGHT II
DISCLAMER: The views expressed in this paper are exclusively of the authors and need not necessarily belong to the organisation for which they belong.
© All rights are reserved www.ScholarArticles.net
4
CALCULATING EQUITY RISK PREMIUM FOR
RUSSIAN MARKET – AN EMPIRICAL ANALYSIS
Teimuraz Vashakmadze
Academy of National Economy under the Government of Russian Federation, Russia
Abstract
If we look at equity researchers’ analytical reports in Russia we will see that weighted
average cost of capital (WACC) for Russian companies is between 9% and 11%. It might be
supposed that these figures are relatively low and are not showing all the risks of Russian
companies.
In the paper, cost of equity (COE) for the Russian market is calculated using empirical
data. For COE calculation, modified capital asset pricing model (CAPM) with country risk
premium (CRP) involved is used. For CRP calculation, three approaches are used: default spread,
relative equity market standard deviations, and default spread plus relative standard deviations.
In the research, two hypotheses are set and proved:
1. Equity researchers were trying to give proof of high prices of Russian companies before
financial crisis by calculating lower WACC than it was in reality;
2. Risks of investing in Russian companies have not declined in spite of pushed up ratings
of sovereign Eurobonds of Russia.
Keywords: country risk premium, equity risk premium, cost of equity (COE), cost of
equity for Russia, capital asset pricing model (CAPM), weighted average cost of capital (WACC).
Introduction
The equity risk premium (ERP) is the incremental return over risk-free assets that investors
require to accept the risks associated with owning stocks. The ERP is the key input into estimating
cost of equity and hence it is key input in discount cash flow valuation.
Knowing its importance in valuation of assets, it is surprising how equity researchers in
Russia were calculating weighted average cost of capital (WACC). If we look at equity researchers’
analytical reports in Russia we will see that WACC for Russian companies is between 9% and 11%
(these figures were in equity research reports, which were published before August 2008). The
Vashakmadze T . (2008). Calculating equity risk premium for Russian market – an empirical analysis. Global

Academic Society Journal: Social Science Insight, Vol. 1, No. 5, pp. 4-15. ISSN 2029-0365 GLOBAL ACADEMIC SOCIETY JOURNAL: SOCIAL SCIENCE INSIGHT II
DISCLAMER: The views expressed in this paper are exclusively of the authors and need not necessarily belong to the organisation for which they belong.
© All rights are reserved www.ScholarArticles.net
5
Table 1 below shows the short list of Russian companies and WACC calculated by different
investment companies. It might be supposed that these figures are relatively low and are not
showing all the risks of Russian companies.
Table 1. Historical Equity Risk Premium
Company Date WACC Source
Rosneft 09.07.2008 8.70% Bank of Moscow
Lukoil 09.07.2008 9.30% Bank of Moscow
Gazprom Neft 30.04.2008 9.40% PIO GLOBAL
Raspadskaya 07.06.2008 10.20% MIRINVEST
Norilsk Nickel 30.07.2008 10.70% A'LEMAR
Norilsk Nickel 09.06.2008 10.60% UniCredit Aton
CTC-Media 30.04.2008 10.44% Veles Capital
MTS 18.04.2008 10.40% Bank Petrocommerce
This paper calculates ERP, cost of equity and WACC for the Russian market using
empirical data and assumptions, which are introduced below.
Research methodology
The paper suggests a better approach to CRP calculation for Russia and tests two
hypotheses:
1. Equity researchers were trying to give proof of high prices of Russian companies before
financial crisis by calculating lower WACC than it was in reality;
2. Risks of investing in Russian companies have not declined in spite of pushed up ratings
of sovereign Eurobonds of Russia.
For testing above mentioned hypotheses, the methodology described below is used:
Cost of equity calculation for Russia: for calculating COE for Russia, modified CAPM
(appendix #1, equation #1) is used.
Equity risk premium calculation for the US market: historical risk premium approach is
used to calculate ERP for the US market. Historical premium approach looks at history, assesses
equity returns in the past, and compares them with risk free returns. The difference between annual
returns represents the historical risk premium.
Russian country risk calculation: for CRP calculation (Damodaran, 2008) three
approaches are used: default spread (appendix #1, equation #2), relative equity market standard
Vashakmadze T . (2008). Calculating equity risk premium for Russian market – an empirical analysis. Global
Academic Society Journal: Social Science Insight, Vol. 1, No. 5, pp. 4-15. ISSN 2029-0365 GLOBAL ACADEMIC SOCIETY JOURNAL: SOCIAL SCIENCE INSIGHT II
DISCLAMER: The views expressed in this paper are exclusively of the authors and need not necessarily belong to the organisation for which they belong.
© All rights are reserved www.ScholarArticles.net
6
deviations (appendix #1, equation #3), and default spread plus relative standard deviations
(appendix #1, equation #4).
Data analysis and hypotheses testing: the results of different CRP calculation
approaches are compared, analyzed and the hypotheses are tested by calculation of WACC
(appendix #1, equation #5) using different CRP calculation approaches and synthetic cost of debt
calculation method (appendix #1, equation #6). Besides, implied premium approach is used for
hypotheses testing. Implied premium approach is a forward looking approach where we look at P/E
of the market. From P/E we can find earnings cap rate g - COE
1
Rate Cap Earning
1
E
P
(Hitchner
2008), where g is a long-term sustainable growth rate; hence from P/E we can see what cost of
equity is in current market prices.
Assumptions
The research is based on the following assumptions:
Risk free rate equals Tbond yield;
For historical returns of S&P500 and Tbond calculation, geometric averages are used;
For historical returns of S&P500 and Tbond calculation, the time period starting from
1928 is taken;
For relative equity market standard deviations approach, annualized monthly returns of
RTSI and S&P500 standard deviations of 1995-2008 are used;
For default spread + relative standard deviations approach, annualized weekly returns of
RTSI and Russia30 standard deviations of 2003-2008 are used;
Beta of the security equals 1;
D/E ratio equals 1;
Tax on profit equals 24%;
Bank margin equals to 1%.
Calculations and data analysis (data as of 14th November 2008):
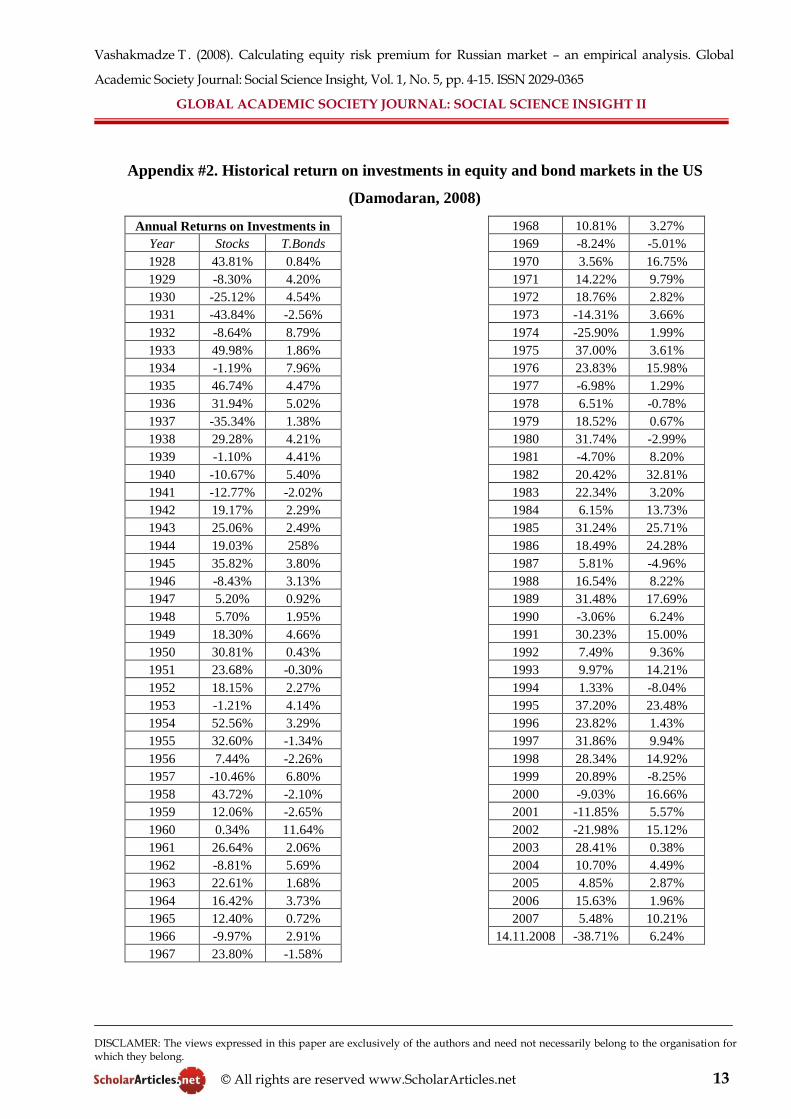
The Table 2 bellow shows that historical equity risk premium in the US dropped from
4.79% to 3.99% because of the financial crisis we are facing today.
The data of returns for 1928-2007 were taken from www.damodaran.com and updated on
14.11.2008 using www.finance.yahoo.com and http://www.indexarb.com internet resources. The
Vashakmadze T . (2008). Calculating equity risk premium for Russian market – an empirical analysis. Global

Academic Society Journal: Social Science Insight, Vol. 1, No. 5, pp. 4-15. ISSN 2029-0365 GLOBAL ACADEMIC SOCIETY JOURNAL: SOCIAL SCIENCE INSIGHT II
DISCLAMER: The views expressed in this paper are exclusively of the authors and need not necessarily belong to the organisation for which they belong.
© All rights are reserved www.ScholarArticles.net
7
full data about historical returns of the US market is presented in appendix #2.
Table 2. Historical Equity Risk Premium
Time period Geometric Equity Returns Geometric Tbond Returns Equity Risk Premium
1928-2007 9.81% 5.01% 4.79%
1928-2008 (14.11.2008) 9.02% 5.03% 3.99%
Now that ERP for the US market is found, calculation of ERP for the Russian market using
3 approaches is provided below:
Default spread approach is calculated using equation #2 (appendix #1):
10.98% 3.75%)-(10.74% 3.99% ) US10Tbond- Russia30(ERPERP USRussia
Relative equity market standard deviations approach is calculated using equation #3
(appendix #1).
%77.13%69.15
%12.54%99.3
deviation Standard
deviation StandardERPERP
P500&S
RTSIUSRussia
Default spread + relative standard deviations approach is calculated using equation #4
(appendix #1):
30 Russia
RTSIUSRussia
deviation Standard
deviation Standard) US10Tbond- Russia30(ERPERP
%74.1454.1%99.6%99.326.49%
40.74%3.75%) - %74.10(3.99%
In appendix #3, annualized standard deviations calculations of RTSI, S&P500 and
Russia30 are presented.
Using equation #1 (appendix #1) cost of equity for Russia can be calculated.
Table 3. Comparison of CRP, ERP and COE for Russia using different approaches
(calculations on 14th
November 2008) CRP calculation approach ERP(US) CRP(Russia) ERP(Russia) =
ERP(US)+CRP(Russia)
COE(Russia)
Default spread 3.99% 6.99% 10.98% 14.73%
Relative equity market standard
deviations
3.99% 9.78% 13.77% 17.52%
Default spread + relative standard
deviations
3.99% 10.75% 14.74% 18.49%
In Table 3, we can see that the maximum cost of equity is calculated by default spread +
Vashakmadze T . (2008). Calculating equity risk premium for Russian market – an empirical analysis. Global

Academic Society Journal: Social Science Insight, Vol. 1, No. 5, pp. 4-15. ISSN 2029-0365 GLOBAL ACADEMIC SOCIETY JOURNAL: SOCIAL SCIENCE INSIGHT II
DISCLAMER: The views expressed in this paper are exclusively of the authors and need not necessarily belong to the organisation for which they belong.
© All rights are reserved www.ScholarArticles.net
8
relative standard deviations approach. But if we look at Figure 1, we can see that from 2005 to 2008
COE calculated by relative equity market standard deviations approach was twice higher on average
than COE calculated by default spread based approaches.
Figure 1. COE by years using different approaches
There are two drivers why COE calculated by relative equity market standard deviations
approach has dropped, the first driver we discussed already is decreased ERP in the US market
because of the financial crisis and the second driver is increased default spread of Russia30 and
US10Tbond also because of the financial crisis.
If we try to understand why default spread of Russia30 increased during the crisis we can
see two main reasons: (a) decrease in commodity prices and (b) capital outflow from Russia and
usage of reserves to help the economy.
Rising commodity prices pushed up Russian sovereign bond ratings, hence by using
default spread related approaches the risks of investing in Russian companies would have been
artificially calculated twice as low as in the case of calculating COE by relative equity market
standard deviations approach.
Hence the hypothesis that risks of investing in Russian companies have not declined in
spite of pushed up ratings of sovereign Eurobonds of Russia can be proved.
In my opinion, for an emerging country like Russia it is better to use the relative equity
market standard deviations approach because it is less affected by commodity prices.
Now that COE is found, WACC can be calculated using equations #5 and #6 (appendix
22.13% 22.12% 22.93% 21.58%
12.37% 10.81% 11.35% 11.49%
11.50% 10.39% 10.65% 10.36%
17.52% 18.49%
14.73%
0%
5%
10%
15%
20%
25%
Jan-04 Jan-05 Jan-06 Jan-07 Jan-08 Jan-09
Relative Default+Relative Default
Vashakmadze T . (2008). Calculating equity risk premium for Russian market – an empirical analysis. Global

Academic Society Journal: Social Science Insight, Vol. 1, No. 5, pp. 4-15. ISSN 2029-0365 GLOBAL ACADEMIC SOCIETY JOURNAL: SOCIAL SCIENCE INSIGHT II
DISCLAMER: The views expressed in this paper are exclusively of the authors and need not necessarily belong to the organisation for which they belong.
© All rights are reserved www.ScholarArticles.net
9
#1). For cost of debt calculation, synthetic approach and the given assumptions are used. The
calculations show that AAA ranked company at 14th November 2008 equals 12.49%, after tax cost
of debt equals 9.49%. The corporate default spread for AAA ranked company is 0.75%. In Table 4
cost of debt and after tax cost of debt by years 2005-2008 are presented.
marginBank spreaddefault Corporate spreaddefault Country R COD f
= 3.75% + 6.99% + 0.75% + 1% = 12.49%.
After tax cost of debt = 12.49*(1-24%) = 9.29%.
Table 4. Cost of debt and after tax cost of debt by years Time period Cost of debt After tax cost of debt
2005 8.41% 6.39%
2006 7.34% 5.58%
2007 7.49% 5.69%
2008 7.32% 5.56%
14.11.2008 12.49% 9.49%
The next step is to calculate WACC for different CRP calculations approach and try to
understand whether it was correct for equity researchers to use WACC figures around 9%-11% or
analysts were using this figures just to prove the high prices of Russian companies.
Table 5. Comparison of WACC for AAA ranked company in Russia using different
approaches of COE calculations (calculations on 14th
November 2008) CRP calculation approach COE(Russia) After tax cost of debt WACC
Default spread 14.73% 9.49% 12.11%
Relative equity market standard
deviations
17.52% 9.49% 13.51%
Default spread + relative standard
deviations
18.49% 9.49% 13.99%
Analyzing data from Table 5 and Figure 2 we can see why equity researchers were using
low WACC in the reports: probably they were using default spread approaches, but as it was
already mentioned, for Russia it is not correct to use default spread based approaches. This is due to
the fact that increasing prices in commodity will reflect as lowering default spread of sovereign
bonds and increase in rating of Russia. This however does not mean that risks of investing in Russia
are declining when commodity prices are increasing.
Vashakmadze T . (2008). Calculating equity risk premium for Russian market – an empirical analysis. Global
Academic Society Journal: Social Science Insight, Vol. 1, No. 5, pp. 4-15. ISSN 2029-0365 GLOBAL ACADEMIC SOCIETY JOURNAL: SOCIAL SCIENCE INSIGHT II
DISCLAMER: The views expressed in this paper are exclusively of the authors and need not necessarily belong to the organisation for which they belong.
© All rights are reserved www.ScholarArticles.net
10
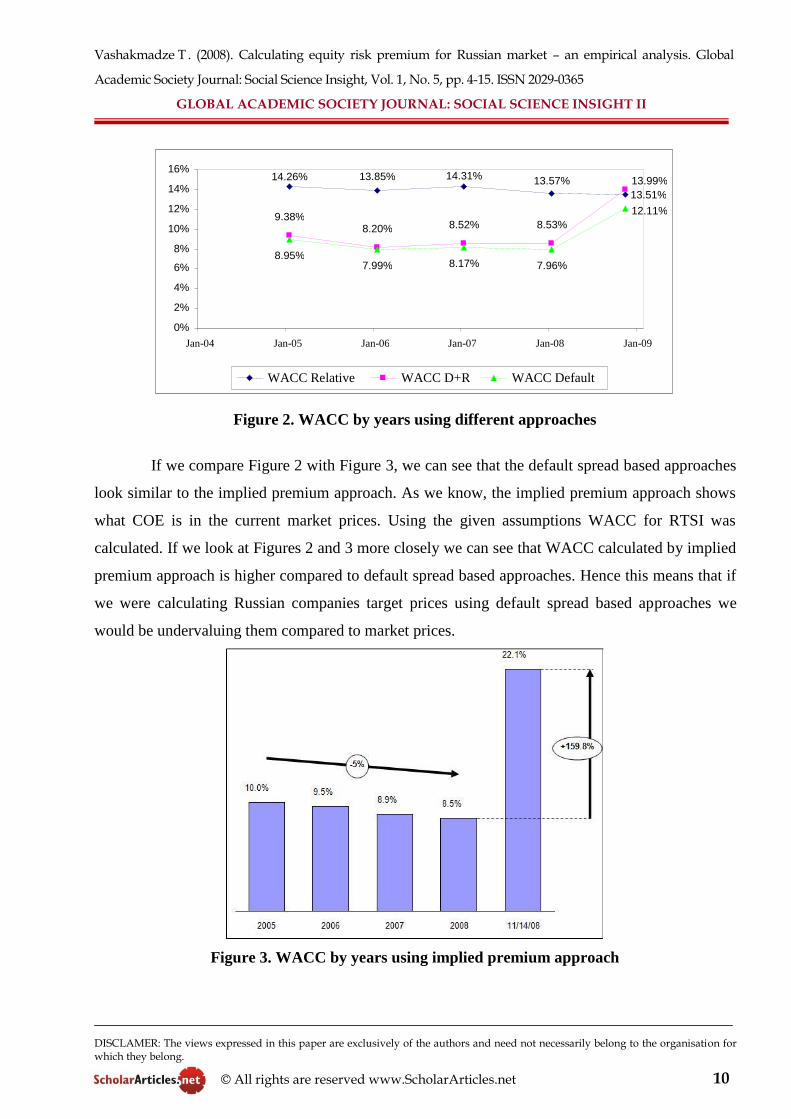
Figure 2. WACC by years using different approaches
If we compare Figure 2 with Figure 3, we can see that the default spread based approaches
look similar to the implied premium approach. As we know, the implied premium approach shows
what COE is in the current market prices. Using the given assumptions WACC for RTSI was
calculated. If we look at Figures 2 and 3 more closely we can see that WACC calculated by implied
premium approach is higher compared to default spread based approaches. Hence this means that if
we were calculating Russian companies target prices using default spread based approaches we
would be undervaluing them compared to market prices.
Figure 3. WACC by years using implied premium approach
14.26% 13.85% 14.31% 13.57%
9.38% 8.20% 8.52% 8.53%
8.95% 7.99% 8.17% 7.96%
13.51% 13.99%
12.11%
0%
2%
4%
6%
8%
10%
12%
14%
16%
Jan-04 Jan-05 Jan-06 Jan-07 Jan-08 Jan-09
WACC Relative WACC D+R WACC Default
Vashakmadze T . (2008). Calculating equity risk premium for Russian market – an empirical analysis. Global

Academic Society Journal: Social Science Insight, Vol. 1, No. 5, pp. 4-15. ISSN 2029-0365 GLOBAL ACADEMIC SOCIETY JOURNAL: SOCIAL SCIENCE INSIGHT II
DISCLAMER: The views expressed in this paper are exclusively of the authors and need not necessarily belong to the organisation for which they belong.
© All rights are reserved www.ScholarArticles.net
11
The analysis proved the hypothesis that equity researchers were trying to give proof of
high prices of Russian companies before financial crisis by calculating lower WACC than it was in
reality.
We cannot be sure that implied premium approach is showing currently fair cost of equity
mainly because of the panic and sell off we are facing now.
Conclusions
The paper has calculated and analyzed CRP calculation using three different approaches
and suggested that for an emerging country like Russia it is better to use the relative equity market
standard deviations approach.
The analysis has shown that rising commodity prices pushed up Russian sovereign bond
ratings; and by using default spread based approaches the risks of investing in Russian companies
were artificially underestimated. This proved the hypothesis that risks of investing in Russian
companies have not declined in spite of the pushed up ratings of sovereign Eurobonds of Russia.
The analysis of WACC calculated by three different CRP approaches and WACC
calculated using the implied premium approach proved the hypothesis that equity researchers were
trying to give proof of high prices of Russian companies before financial crisis by calculating lower
WACC than it was in reality.
References
1. Damodaran A. (2008) Equity Risk Premiums (ERP): Determinants, Estimation and Implications. pp. 41 –
48. Available at: http://www.damodaran.com.
2. IndexArb (2008) Index Insights and Market Timing Tools: Futures, Equities, Options. Available at:
http://www.indexarb.com/dividendYieldSortedsp.html.
3. Hitchner J. R. (2008) Cost of Capital. Maroseika. p. 20.
4. Yahoo! Finance (2008) Available at: http http://finance.yahoo.com/q?s=^TNX.
Vashakmadze T . (2008). Calculating equity risk premium for Russian market – an empirical analysis. Global
Academic Society Journal: Social Science Insight, Vol. 1, No. 5, pp. 4-15. ISSN 2029-0365 GLOBAL ACADEMIC SOCIETY JOURNAL: SOCIAL SCIENCE INSIGHT II
DISCLAMER: The views expressed in this paper are exclusively of the authors and need not necessarily belong to the organisation for which they belong.
© All rights are reserved www.ScholarArticles.net
12
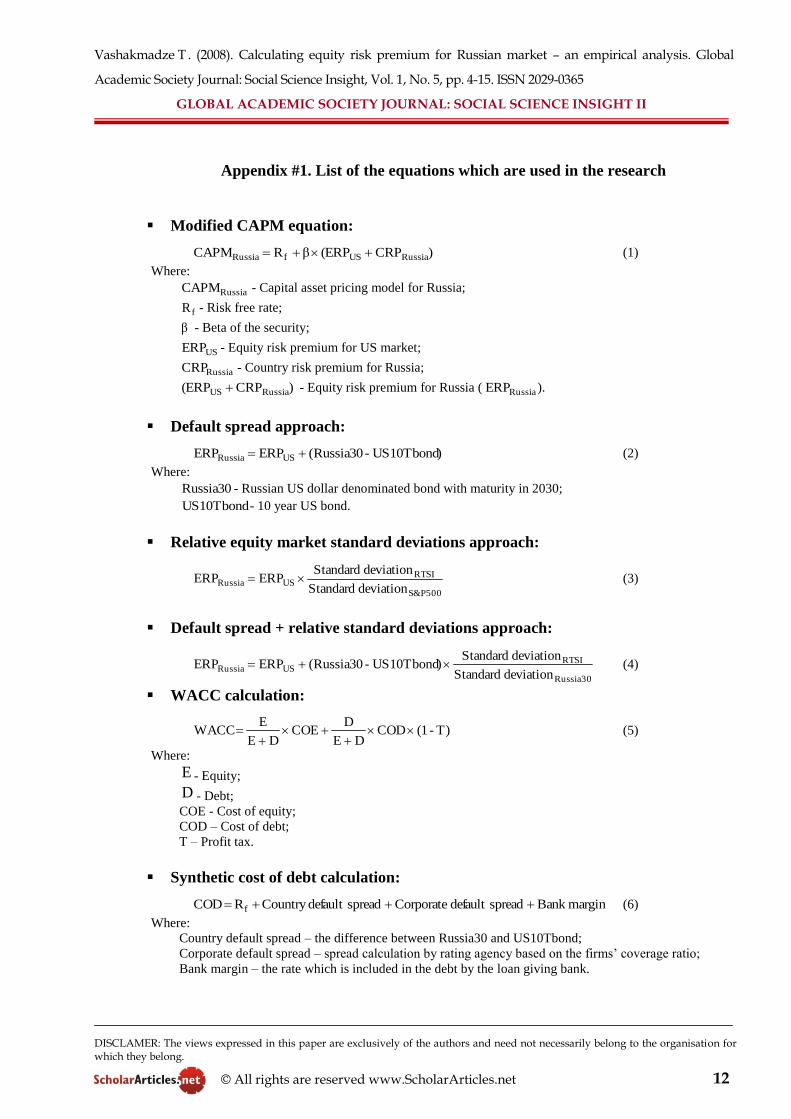
Appendix #1. List of the equations which are used in the research
Modified CAPM equation:
)CRP(ERPβRCAPM RussiaUSfRussia (1)
Where:
RussiaCAPM - Capital asset pricing model for Russia;
fR - Risk free rate;
β - Beta of the security;
USERP - Equity risk premium for US market;
RussiaCRP - Country risk premium for Russia;
)CRP(ERP RussiaUS - Equity risk premium for Russia ( RussiaERP ).
Default spread approach:
) US10Tbond- Russia30(ERPERP USRussia (2)
Where:
Russia30 - Russian US dollar denominated bond with maturity in 2030;
US10Tbond- 10 year US bond.
Relative equity market standard deviations approach:
P500&S
RTSIUSRussia
deviation Standard
deviation StandardERPERP (3)
Default spread + relative standard deviations approach:
30 Russia
RTSIUSRussia
deviation Standard
deviation Standard) US10Tbond- Russia30(ERPERP (4)
WACC calculation:
T)-(1CODDE
DCOE
DE
E WACC
(5)
Where:
E - Equity;
D - Debt;
COE - Cost of equity;
COD – Cost of debt;
T – Profit tax.
Synthetic cost of debt calculation:
marginBank spreaddefault Corporate spreaddefault Country R COD f (6)
Where:
Country default spread – the difference between Russia30 and US10Tbond;
Corporate default spread – spread calculation by rating agency based on the firms’ coverage ratio;
Bank margin – the rate which is included in the debt by the loan giving bank.
Vashakmadze T . (2008). Calculating equity risk premium for Russian market – an empirical analysis. Global
Academic Society Journal: Social Science Insight, Vol. 1, No. 5, pp. 4-15. ISSN 2029-0365 GLOBAL ACADEMIC SOCIETY JOURNAL: SOCIAL SCIENCE INSIGHT II
DISCLAMER: The views expressed in this paper are exclusively of the authors and need not necessarily belong to the organisation for which they belong.
© All rights are reserved www.ScholarArticles.net
13
Appendix #2. Historical return on investments in equity and bond markets in the US
(Damodaran, 2008)
Annual Returns on Investments in
Year Stocks T.Bonds
1928 43.81% 0.84%
1929 -8.30% 4.20%
1930 -25.12% 4.54%
1931 -43.84% -2.56%
1932 -8.64% 8.79%
1933 49.98% 1.86%
1934 -1.19% 7.96%
1935 46.74% 4.47%
1936 31.94% 5.02%
1937 -35.34% 1.38%
1938 29.28% 4.21%
1939 -1.10% 4.41%
1940 -10.67% 5.40%
1941 -12.77% -2.02%
1942 19.17% 2.29%
1943 25.06% 2.49%
1944 19.03% 258%
1945 35.82% 3.80%
1946 -8.43% 3.13%
1947 5.20% 0.92%
1948 5.70% 1.95%
1949 18.30% 4.66%
1950 30.81% 0.43%
1951 23.68% -0.30%
1952 18.15% 2.27%
1953 -1.21% 4.14%
1954 52.56% 3.29%
1955 32.60% -1.34%
1956 7.44% -2.26%
1957 -10.46% 6.80%
1958 43.72% -2.10%
1959 12.06% -2.65%
1960 0.34% 11.64%
1961 26.64% 2.06%
1962 -8.81% 5.69%
1963 22.61% 1.68%
1964 16.42% 3.73%
1965 12.40% 0.72%
1966 -9.97% 2.91%
1967 23.80% -1.58%
1968 10.81% 3.27%
1969 -8.24% -5.01%
1970 3.56% 16.75%
1971 14.22% 9.79%
1972 18.76% 2.82%
1973 -14.31% 3.66%
1974 -25.90% 1.99%
1975 37.00% 3.61%
1976 23.83% 15.98%
1977 -6.98% 1.29%
1978 6.51% -0.78%
1979 18.52% 0.67%
1980 31.74% -2.99%
1981 -4.70% 8.20%
1982 20.42% 32.81%
1983 22.34% 3.20%
1984 6.15% 13.73%
1985 31.24% 25.71%
1986 18.49% 24.28%
1987 5.81% -4.96%
1988 16.54% 8.22%
1989 31.48% 17.69%
1990 -3.06% 6.24%
1991 30.23% 15.00%
1992 7.49% 9.36%
1993 9.97% 14.21%
1994 1.33% -8.04%
1995 37.20% 23.48%
1996 23.82% 1.43%
1997 31.86% 9.94%
1998 28.34% 14.92%
1999 20.89% -8.25%
2000 -9.03% 16.66%
2001 -11.85% 5.57%
2002 -21.98% 15.12%
2003 28.41% 0.38%
2004 10.70% 4.49%
2005 4.85% 2.87%
2006 15.63% 1.96%
2007 5.48% 10.21%
14.11.2008 -38.71% 6.24%
Vashakmadze T . (2008). Calculating equity risk premium for Russian market – an empirical analysis. Global

Academic Society Journal: Social Science Insight, Vol. 1, No. 5, pp. 4-15. ISSN 2029-0365 GLOBAL ACADEMIC SOCIETY JOURNAL: SOCIAL SCIENCE INSIGHT II
DISCLAMER: The views expressed in this paper are exclusively of the authors and need not necessarily belong to the organisation for which they belong.
© All rights are reserved www.ScholarArticles.net
14
Appendix #3. Relative equity market standard deviation calculation
Volatility of RTSI relative to the S&P500 14/11/2008
(annualized
monthly
standard
deviation 1995-
2008)
2008
(annualized
monthly
standard
deviation 1995-
2007)
2007
(annualized
monthly
standard
deviation 1995-
2006)
2006
(annualized
monthly
standard
deviation 1995-
2005)
2005
(annualized
monthly
standard
deviation 1999-
2004)
RTSI 54.12% 53.00% 55.06% 57.05% 59.48%
S&P500 15.69% 14.47% 14.84% 15.46% 16.08%
sigmaRTSI/sigmaS&P
500
3.45 3.66 3.71 3.69 3.70
Volatility of RTSI relative to the country Eurobond Russia30 14/11/2008
(annualized
weekly
standard
deviation 2003-
2008)
2008
(annualized
weekly
standard
deviation 2003-
2007)
2007
(annualized
weekly
standard
deviation 2003-
2006)
2006
(annualized
weekly
standard
deviation 2003-
2005)
2005
(annualized
weekly
standard
deviation 2003-
2004)
RTSI 40.74% 27.93% 29.89% 28.46% 32.47%
Russia30 26.46% 16.18% 17.96% 21.12% 23.95%
sigmaRTSI/sigmaRuss
ia30
1.54 1.73 1.66 1.35 1.36
Vashakmadze T . (2008). Calculating equity risk premium for Russian market – an empirical analysis. Global

Academic Society Journal: Social Science Insight, Vol. 1, No. 5, pp. 4-15. ISSN 2029-0365 GLOBAL ACADEMIC SOCIETY JOURNAL: SOCIAL SCIENCE INSIGHT II
DISCLAMER: The views expressed in this paper are exclusively of the authors and need not necessarily belong to the organisation for which they belong.
© All rights are reserved www.ScholarArticles.net
15
Appendix #4. Equity risk premium and cost of equity calculations for Russia (in calculations
beta = 1) using relative equity market standard deviation and default spread + relative
standard deviation approaches (2005 – 2008)
Calculation on 14th November 2008:
Relative Equity Market Standard Deviation
Risk free rate 3.75%
Equity Risk Premium (US) 3.99%
Relative Equity Market Standard Deviation 3.45
Equity Risk Premium (Russia) 13.77%
Cost of Equity in Russia 17.52%
Default Spread + Relative Standard Deviation
Russia-2030 10.74%
Spread 6.99%
Sigma 2003-2008 RTSI 40.74%
Sigma 2003-2008 R30 26.49%
Relative Equity Market Standard Deviation 1.54
Country Risk Premium 10.75%
Equity Risk Premium (Russia) 14.74%
Cost of Equity in Russia 18.49%
Calculation on 1st January 2008:
Relative Equity Market Standard Deviation
Risk free rate 4.02%
Equity Risk Premium (US) 4.79%
Relative Equity Market Standard Deviation 3.66
Equity Risk Premium (Russia) 17.56%
Cost of Equity in Russia 21.58%
Default Spread + Relative Standard Deviation
Russia-2030 5.57%
Spread 1.55%
Sigma 2003-2007 RTSI 27.93%
Sigma 2003-2007 R30 16.18%
Relative Equity Market Standard Deviation 1.73
Country Risk Premium 2.68%
Equity Risk Premium (Russia) 7.47%
Cost of Equity in Russia 11.49%
Calculation on 1st January 2007:
Relative Equity Market Standard Deviation
Risk free rate 4.70%
Equity Risk Premium (US) 4.91%
Relative Equity Market Standard Deviation 3.71
Equity Risk Premium (Russia) 18.23%
Cost of Equity in Russia 22.93%
Default Spread + Relative Standard Deviation
Russia-2030 5.74%
Spread 1.04%
Sigma 2003-2006 RTSI 29.89%
Sigma 2003-2006 R30 17.96%
Relative Equity Market Standard Deviation 1.66
Country Risk Premium 1.73%
Equity Risk Premium (Russia) 6.65%
Cost of Equity in Russia 11.35%
Calculation on 1st January 2006:
Relative Equity Market Standard Deviation
Risk free rate 4.39%
Equity Risk Premium (US) 4.80%
Relative Equity Market Standard Deviation 3.69
Equity Risk Premium (Russia) 17.73%
Cost of Equity in Russia 22.12%
Default Spread + Relative Standard Deviation
Russia-2030 5.59%
Spread 1.20%
Sigma 2003-2005 RTSI 28.46%
Sigma 2003-2005 R30 21.12%
Relative Equity Market Standard Deviation 1.35
Country Risk Premium 1.62%
Equity Risk Premium (Russia) 6.42%
Cost of Equity in Russia 10.81%
Calculation on 1st January 2005:
Relative Equity Market Standard Deviation
Risk free rate 4.22%
Equity Risk Premium (US) 4.84%
Relative Equity Market Standard Deviation 3.70
Equity Risk Premium (Russia) 17.91%
Cost of Equity in Russia 22.13%
Default Spread + Relative Standard Deviation
Russia-2030 6.66%
Spread 2.44%
Sigma 2003-2004 RTSI 32.47%
Sigma 2003-2004 R30 23.95%
Relative Equity Market Standard Deviation 1.36
Country Risk Premium 3.31%
Equity Risk Premium (Russia) 8.15%
Cost of Equity in Russia 12.37%
Vashakmadze T . (2008). Calculating equity risk premium for Russian market – an empirical analysis. Global