calculation of surface ship annual energy usage, …calculation of surface ship annual energy usage,...
TRANSCRIPT

DDS 200-2
DESIGN DATA SHEET
CALCULATION OF SURFACE SHIP ANNUAL ENERGY
USAGE, ANNUAL ENERGY COST, AND
FULLY BURDENED COST OF ENERGY
DEPARTMENT OF THE NAVY
NAVAL SEA SYSTEMS COMMAND
WASHINGTON, DC 20376-5124
DISTRIBUTION STATEMENT A. APPROVED FOR PUBLIC RELEASE; DISTRIBUTION
UNLIMITED.
07 AUGUST 2012

Report Documentation Page Form ApprovedOMB No. 0704-0188
Public reporting burden for the collection of information is estimated to average 1 hour per response, including the time for reviewing instructions, searching existing data sources, gathering andmaintaining the data needed, and completing and reviewing the collection of information. Send comments regarding this burden estimate or any other aspect of this collection of information,including suggestions for reducing this burden, to Washington Headquarters Services, Directorate for Information Operations and Reports, 1215 Jefferson Davis Highway, Suite 1204, ArlingtonVA 22202-4302. Respondents should be aware that notwithstanding any other provision of law, no person shall be subject to a penalty for failing to comply with a collection of information if itdoes not display a currently valid OMB control number.
1. REPORT DATE 07 AUG 2012
2. REPORT TYPE Final
3. DATES COVERED -
4. TITLE AND SUBTITLE Design Data Sheet: Calculation of Surface Ship Annual Energy Usage,Annual Energy Cost, and Fully Burdened Cost of Energy
5a. CONTRACT NUMBER
5b. GRANT NUMBER
5c. PROGRAM ELEMENT NUMBER
6. AUTHOR(S) 5d. PROJECT NUMBER
5e. TASK NUMBER
5f. WORK UNIT NUMBER
7. PERFORMING ORGANIZATION NAME(S) AND ADDRESS(ES) Naval Sea Systems Command 1333 Isaac Hull Ave SE Washington NavyYard, DC 20376
8. PERFORMING ORGANIZATIONREPORT NUMBER DDS 200-2
9. SPONSORING/MONITORING AGENCY NAME(S) AND ADDRESS(ES) 10. SPONSOR/MONITOR’S ACRONYM(S)
11. SPONSOR/MONITOR’S REPORT NUMBER(S)
12. DISTRIBUTION/AVAILABILITY STATEMENT Approved for public release, distribution unlimited
13. SUPPLEMENTARY NOTES The original document contains color images.
14. ABSTRACT The lifecycle cost of energy is a function of three important factors, all of which include varying amounts ofuncertainty: the operational profile of the ship, the future Fully Burdened Cost of Energy (FBCE), and thephysical characteristics of the ship and its equipment. This Design Data Sheet (DDS) outlines the procedureto estimate the annual energy consumption and annual energy cost of non-nuclear surface ships
15. SUBJECT TERMS
16. SECURITY CLASSIFICATION OF: 17. LIMITATION OF ABSTRACT
UU
18. NUMBEROF PAGES
50
19a. NAME OFRESPONSIBLE PERSON
a. REPORT unclassified
b. ABSTRACT unclassified
c. THIS PAGE unclassified
Standard Form 298 (Rev. 8-98) Prescribed by ANSI Std Z39-18

DDS 200-2
ii
DDS 200-2
07 August 2012
CONTENTS
PARAGRAPH PAGE
1. APPLICABLE DOCUMENTS 1
1.1 General 1
1.2 Government documents 1
1.2.1 Specifications, standards, and handbooks 1
1.2.2 Other Government documents, drawings, and publications 1
1.3 Non-Government publications 2
1.4 Order of precedence 2
2. INTRODUCTION 2
3. DEFINITIONS 3
3.1 Baseline Security Posture (BSP) 3
3.2 Major Combat Operations (MCO) scenario 3
3.3 Tactical Situations (TACSITs) 3
3.4 Future naval force architecture 3
3.5 Ship mission and mobility capabilities list 3
3.6 Ship state 3
3.7 Operational modes 3
3.8 Ship deployment and employment profile 3
3.9 Ship state participation table 3
3.10 Ambient condition profile 3
3.11 Electric Power Load Analysis 4
3.12 Electrical generation, conversion, and distribution efficiencies 4
3.13 Electric and propulsion plant Concept of Operations 4
3.14 Propulsion motor module efficiency (electric drive) 4
3.15 Reduction gear efficiency (mechanical drive) 4
3.16 Prime mover Specific Fuel Consumption (SFC) curves 4
3.17 Plant deterioration allowance 4
3.18 Sea state and fouling factor 4
3.19 Annual energy usage table 4
3.20 Standard price for fuel 5
3.21 Commodity price for electricity 5
3.22 Table of fully burdened cost of fuel 5
3.23 Annual cost of energy table 5
3.24 Lifecycle cost of energy 5
3.25 Average annual energy cost 5
3.26 Study guide 5
3.27 Design service life 5
4. SYMBOLS 5
5. GENERAL REQUIREMENTS 7
5.1 Operational profile 7
5.1.1 Introduction 7
5.1.2 Operational profile inputs 7
5.1.3 Operational profile outputs 7

DDS 200-2
iii
PARAGRAPH PAGE
5.2 Annual energy usage 7
5.2.1 Introduction 7
5.2.2 Annual fuel consumption inputs 7
5.2.3 Annual fuel consumption outputs 8
5.3 Fully Burdened Cost of Energy (FBCE) 8
5.3.1 Introduction 8
5.3.2 FBCE cost inputs 8
5.3.3 FBCE outputs 8
5.4 Annual energy cost 8
5.4.1 Introduction 8
5.4.2 Annual energy cost inputs 8
5.4.3 Annual energy cost outputs 8
6. SPECIFIC REQUIREMENTS 9
6.1 Operational profile 9
6.1.1 Introduction 9
6.1.2 Operational mode development 9
6.1.3 Ship state development 9
6.1.4 Ship state participation table development 10
6.1.5 Ship deployment and employment profile development 10
6.2 Annual energy usage 10
6.2.1 Introduction 10
6.2.2 Fuel consumed by the ship 10
6.2.3 Shore power used by the ship 11
6.2.4 Fuel consumed by embarked vehicles 11
6.3 Fully Burdened Cost of Energy 11
6.3.1 Introduction 11
6.3.2 Fully burdened cost of fuel 11
6.3.3 Fully burdened cost of shore power 13
6.4 Annual energy cost 13
6.4.1 Annual cost of energy table 13
6.4.2 Lifecycle cost of energy 13
6.4.3 Average annual energy cost 13
TABLES
Table 6-1. FY 2011 DLA Energy Standard Price Buildup 12
Table A-1. Cost Structure of Navy Fuel A-2
Table A-2. Prediction of Fleet Fuel Consumption A-7
Table A-3. Breakdown of Fully Burdened Cost of F76 in FY 2011 A-9
Table B-1. Speed-Time Profile Sources B-1
Table B-2. AOE 6 Class (Gas Turbine) B-1
Table B-3. CG 47 Class B-2
Table B-4. DD 963 Class B-2
Table B-5. DDG 51 Class B-3
Table B-6. FFG 7 Class B-3
Table B-7. LHA 1 Class B-4
Table B-8. LHD 1 Class B-4

DDS 200-2
iv
PARAGRAPH PAGE
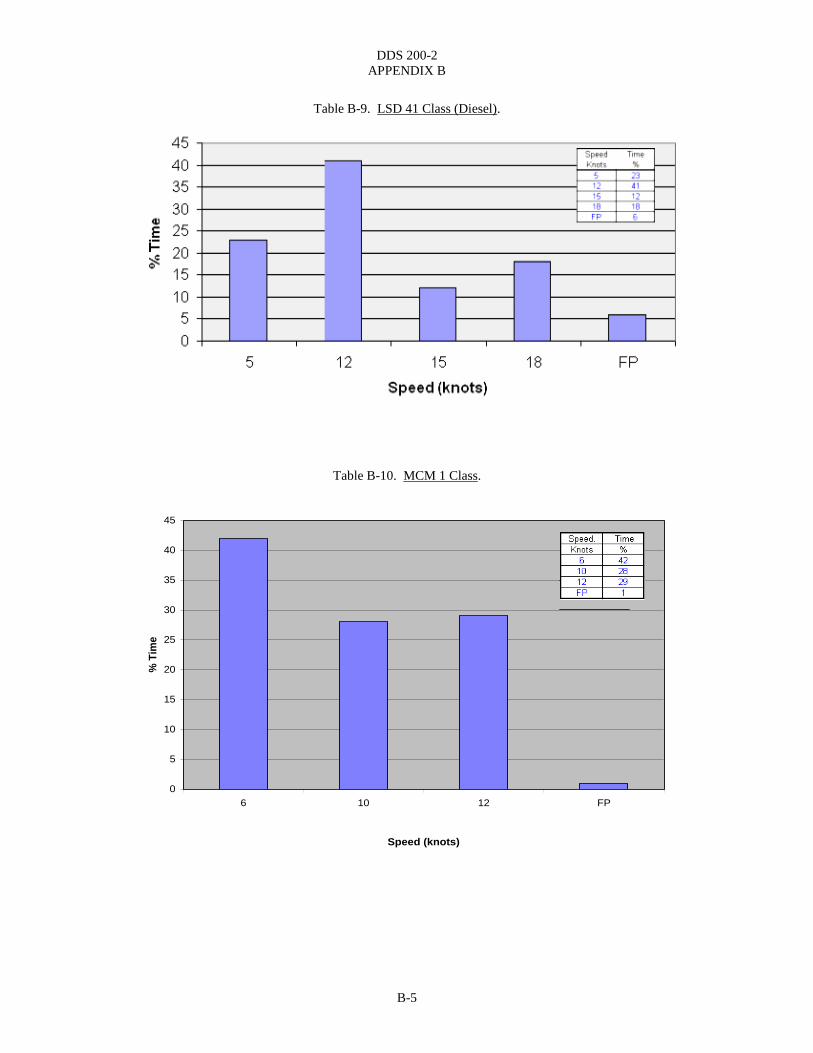
Table B-9. LSD 41 Class (Diesel) B-5
Table B-10. MCM 1 Class B-5
Table B-11. MHC 51 Class B-6
Table C-1. AOE 6 (Gas Turbine) Five Year Class Average 1998-2002 C-1
Table C-2. ARS 50 Five Year Class Average 1998-2002 C-1
Table C-3. AS (AS 33 + AS 39) Five Year Class Average 1998-2002 C-1
Table C-4. CG 47 Five Year Class Average 1998-2002 C-1
Table C-5. DD 963 Five Year Class Average 1998-2002 C-2
Table C-6. DDG 51 Five Year Class Average 1998-2002 C-2
Table C-7. FFG 7 Five Year Class Average 1998-2002 C-2
Table C-8. LCC 19 Five Year Class Average 1998-2002 C-2
Table C-9. LHD 1 Five Year Class Average 1998-2002 C-3
Table C-10. LSD 41 (Diesel) Five Year Class Average 1998-2002 C-3
Table C-11. LSD 49 (Diesel) Five Year Class Average 1998-2002 C-3
Table C-12. MCM 1 Five Year Class Average 1998-2002 C-3
Table C-13. MHC 51 Five Year Class Average 1998-2002 C-4
FIGURES
Figure 2-1. Annual Energy Cost Tasks 2
Figure A-1. Breakdown of Fully Burdened Cost of F76 A-2
Figure D-1. AEO 2011 Projected Average Annual World Oil Prices (2009 Dollars Per Barrel) D-10
APPENDICES
APPENDIX A. FULLY BURDENED COST OF ENERGY (FBCE) FOR F76 A-1
APPENDIX B. SPEED VS. PERCENT-TIME PROFILE REFERENCE DATA B-1
APPENDIX C. OPERATING HOURS REFERENCE DATA C-1
APPENDIX D. EXAMPLE D-1

DDS 200-2
1
1. APPLICABLE DOCUMENTS
1.1 General. The documents listed in this section are specified in the main body of this document. This section
does not include documents cited in the Appendices.
1.2 Government documents.
1.2.1 Specifications, standards, and handbooks. The following specifications, standards, and handbooks form
part of this document to the extent specified herein. Unless otherwise specified, the issues of these documents are
those cited in the solicitation or contract.
DEPARTMENT OF DEFENSE SPECIFICATIONS
MIL-DTL-5624 - Turbine Fuel, Aviation, Grades JP-4 and JP-5
MIL-DTL-16884 - Fuel, Naval Distillate
DEPARTMENT OF DEFENSE STANDARDS
DOD-STD-1399-301 - Interface Standard for Shipboard Systems, Section 301, Ship Motion and
Attitude
(Copies of these documents are available online at https://assist.dla.mil or http://assistdocs.com.)
1.2.2 Other Government documents, drawings, and publications. The following other Government documents,
drawings, and publications form a part of this document to the extent specified herein. Unless otherwise specified,
the issues of these documents are those cited in the solicitation or contract.
NAVAL SEA SYSTEMS COMMAND (NAVSEA) DESIGN DATA SHEETS (DDS)
DDS 051-1 - Prediction of Smooth-Water Powering Performance for Surface-Displacement Ships
DDS 200-1 - Calculation of Surface Ship Endurance Fuel Requirements
DDS 310-1 - Electric Power Load Analysis for Surface Ships
(Copies of these documents are available from Commander, Naval Sea Systems Command, ATTN: SEA 05S, 1333
Isaac Hull Avenue, SE, Stop 5160, Washington Navy Yard DC 20376-5160, or by email at
[email protected] with the subject line “DDS request”.)
OPNAV INSTRUCTIONS
OPNAVINST 3500.38 - Universal Naval Task List (UNTL)
OPNAVINST 3501 - Required Operational Capabilities/Projected Operational Environments
(ROC/POE)
(Copies of these documents are available from the Department of the Navy Issuances, SECNAV/OPNAV Directives
Control Office (DNS-5), Washington Navy Yard, Bldg. 36, 720 Kennon Street, SE Rm. 203, Washington Navy
Yard, DC 20374-5074 or online at http://doni.daps.dla.mil/default.aspx.)

DDS 200-2
2
1.3 Non-Government publications. The following documents form a part of this document to the extent
specified herein. Unless otherwise specified, the issues of these documents are those cited in the solicitation or
contract.
SOCIETY OF NAVAL ARCHITECTS AND MARINE ENGINEERS (SNAME)
T&R Bulletin 3-28 - Marine Gas Turbine Power Plant Performance Practices
T&R Bulletin 3-49 - Marine Diesel Power Plant Practices
(Copies of these documents are available from the Society of Naval Architects and Marine Engineers, 601 Pavonia
Avenue, Jersey City, NY 07306 or online at www.sname.org.)
1.4 Order of precedence. Unless otherwise noted herein or in the contract, in the event of a conflict between
the text of this document and the references cited herein, the text of this document takes precedence. Nothing in this
document, however, supersedes applicable laws and regulations unless a specific exemption has been obtained.
2. INTRODUCTION
A major consideration in the design of any naval ship or craft is its total ownership cost. One important input to
total ownership cost estimation is the annual energy consumption. The Navy generally uses NATO F76 for ship
propulsion and power generation and JP5 for aircraft. JP5 is also used occasionally for ship propulsion and power
generation. While inport, naval ships typically will use electricity (shore power) for their energy needs.
The lifecycle cost of energy is a function of three important factors, all of which include varying amounts of
uncertainty: the operational profile of the ship, the future Fully Burdened Cost of Energy (FBCE), and the physical
characteristics of the ship and its equipment. This Design Data Sheet (DDS) outlines the procedure to estimate the
annual energy consumption and annual energy cost of non-nuclear surface ships. As shown in Figure 2-1, this
procedure is decomposed into four distinct tasks that individually estimate the three important factors and then
combine them into an actual estimate.
Operational ProfileDevelopment
Annual EnergyUsage
Calculation
Fully BurdenedCost of Energy
Calculation
Annual EnergyCost
Calculation
Figure 2-1. Annual Energy Cost Tasks.

DDS 200-2
3
This document is organized in a task oriented approach. The General Requirements section, intended primarily
for use by study planners, details the input and outputs of the Annual Energy Usage and Annual Energy Cost
Calculation Process. These inputs and outputs are defined in the Definition section. The Specific Requirements
section provides details on the method to calculate the process outputs based on the inputs for the individuals tasked
with completing the work. Appendix A provides details on calculating the burden to apply to fuel as part of the
FBCE Calculation task. Appendix B and C provide data to support the development of Operational Profiles.
Appendix D provides a worked example.
3. DEFINITIONS
3.1 Baseline Security Posture (BSP). Baseline Security Posture describes the steady-state military capability
requirements needed to address the day-to-day activities supporting long-term security commitments.
3.2 Major Combat Operations (MCO) scenario. A Major Combat Operations scenario is a planning concept for
large-scale operations conducted against a nation state(s) that possesses significant regional military capability, with
global reach in selected capabilities, and the will to employ that capability in opposition to or in a manner
threatening to U.S. national security. An MCO scenario generally incorporates several Tactical Situations.
3.3 Tactical Situations (TACSITs). A Tactical Situation is a planning concept for tactical employment of both
friendly and enemy forces. A TACSIT includes a description of all forces involved (including their capabilities), a
notional timeline, and behavior rules for each force element.
3.4 Future naval force architecture. The future naval force architecture provides the Office of the Chief of
Naval Operations (OPNAV) projection of the number and types of ships comprising the battle force for each year
over an extended period of time, typically 30 years. If the OPNAV projection is incomplete or does not extend to
the end of the design service life of the ship, then the assumptions for extending the OPNAV projection should be
described in the study guide.
3.5 Ship mission and mobility capabilities list. For each of the warfare areas, the ship mission and mobility
capabilities list provides levels of capability. For the ship missions, the levels correspond to specific mission
systems equipment and associated watchstanders needed to perform the mission to an associated level of
performance. The mobility capability is generally specified in the range of speeds (typically from bare steerageway
to sustained speed) that the propulsion plant is capable of achieving. Taxonomies for the ship mission and mobility
capabilities list can be derived from OPNAVINST 3501 from related ships, or from the Universal Naval Task List
(UNTL) detailed in OPNAVINST 3500.38.
3.6 Ship state. A ship state assigns a level of capability to each element of the ship mission and mobility
capabilities list. The mobility capability level consists of a speed vs. percent time profile (commonly referred to as a
“speed-time profile”).
3.7 Operational modes. Operational modes typically include operational deployments, training cycles, in port
periods, and maintenance and modernization availabilities over the life of the ship. It may prove beneficial to have
more than one operational mode to discriminate among different types of operational deployments. For example, an
anti-piracy deployment may be very different from a Theater Ballistic Missile Defense (TBMD) deployment.
Operational modes are associated with one or more ship states through the ship state participation table.
3.8 Ship deployment and employment profile. A ship deployment and employment profile provides the
number of hours in each year for each of the ship’s operational modes over the ship’s design service life. These
profiles are generally used to model different operational tempos (OPTEMPOs) for the ship. A low OPTEMPO
profile would model essentially constant peacetime operations, while a high OPTEMPO profile would model
multiple MCOs over the ship’s design service life.
3.9 Ship state participation table. A ship state participation table consists of participation factors (fraction of
time) of each ship state for each operational mode.
3.10 Ambient condition profile. The ambient condition profile consists of a number of temperature/relative
humidity ambient conditions and an associated percentage of time spent operating in the particular ambient
condition.

DDS 200-2
4
3.11 Electric Power Load Analysis (EPLA). Electric Power Load Analysis is used to calculate the ship service
loads in the specified operational condition over the ambient condition profile. The EPLA includes margins.
DDS 310-1 describes how to prepare an EPLA.
3.12 Electrical generation, conversion, and distribution efficiencies. Electrical generation, conversion, and
distribution efficiencies are used to convert the ship service load (and propulsion load for electric propulsion) into
load sustained by the prime movers. The efficiencies should account for all losses associated with the electrical
generation, conversion, and distribution. The efficiencies are typically a function of power. If the Specific Fuel
Consumption (SFC) curve for an electrical generator set includes the generator efficiency, then the generator
efficiency is not required to be known independently.
3.13 Electric and propulsion plant Concept of Operations (CONOPS). The electric and propulsion plant
Concept of Operations is used to determine which prime movers are online, how propulsion power is shared among
the propulsors, and for determining how power is shared among the prime movers for given operational conditions
and loads. In early stages of design, the electric and propulsion plant CONOPS is included as part of the study
guide. In later stages of design, it typically is a stand-alone document.
3.14 Propulsion motor module efficiency (electric drive). Propulsion motor module efficiency is used to
convert the propulsion power (kW) measured at the output of the motor to electrical power at the input of the motor
drive (including transformer, if applicable). The efficiency should account for all losses associated with the
propulsion motor module including those losses associated with thrust bearings if incorporated into the motor
design. The efficiency is typically a function of power.
3.15 Reduction gear efficiency (mechanical drive). Reduction gear efficiency is used to convert the propulsion
power (kW) measured at output of the reduction gear to the power (kW) at the output of the attached engine. The
efficiency should account for all losses associated with the reduction gear including thrust bearings and couplings.
The efficiency is typically a function of power. For early stages of design, T&R Bulletin 3-49 and T&R Bulletin
3-28 may be used to estimate reduction gear efficiency.
3.16 Prime mover Specific Fuel Consumption (SFC) curves. Prime mover Specific Fuel Consumption
(kg/kW-h) curves are used to calculate the amount of fuel burned per hour (kg/h) for each prime mover for a given
load (kW). The prime mover SFC curves may require correction factors to account for conditions such as higher
than normal exhaust backpressure, higher temperatures, and attached pumps. For electrical generator sets, the SFC
curve may include the generator efficiency. In later stages of design, or earlier if known, the SFC curves should
reflect the impact of the ambient condition profile.
Where available, use manufacturer guidance to interpolate between constant SFC lines on fuel consumption
contour plots. If such guidance is not provided, use the SFC value of the closest contour line; if equally distant to
two contour lines, use the higher SFC value. Where the difference between the SFC values of the two bounding
contour lines is greater than 5 percent of the higher SFC value, interpolating between the contour lines is also
permissible.
3.17 Plant deterioration allowance. The plant deterioration allowance accounts for increased fuel consumption
as the equipment ages.
3.18 Sea state and fouling factor. Sea state and fouling factor accounts for additional drag to the ship’s hull due
to average fouling and sea state. The impact of sea state is determined for a specified operating area, in head seas, at
the high end of sea state 4 as defined in the latest revision of DOD-STD-1399-301 using the propeller coating,
bottom coating, and cleaning methods intended for the ship. The sea state and fouling factor may be a function of
speed.
3.19 Annual energy usage table. The annual energy usage table provides the fuel(s) consumed in kg and the
shore power used in kW-h for each operational mode for each year in the ship deployment and employment profiles.
The fuel consumed accounts for fuel used by the ship itself and the fuel consumed for embarked vehicles (aircraft,
boats, and unmanned vehicles).

DDS 200-2
5
3.20 Standard price for fuel. The standard price for fuel is the anticipated cost to the Government for providing
a barrel (42 gallons) of fuel to Department of Defense customers by the Defense Logistics Agency Energy (DLA
Energy).
3.21 Commodity price for electricity. The commodity price for electricity is the anticipated cost to the
Government for providing a kW-h of electrical energy to Department of Defense customers. Because the price for
electricity is very dependent on geographical location, it may be advantageous to express the commodity price for
electricity as a random variable.
3.22 Table of fully burdened cost of fuel. The table of fully burdened cost of fuel (dollars per kg) provides the
fully burdened cost of fuel for each operational mode for each year in the ship deployment and employment profiles.
Each cost element of the table is typically expressed as a random variable (probability density function) to account
for the uncertainty in the underlying estimation method.
3.23 Annual cost of energy table. The annual cost of energy table provides the estimated energy cost for each
year of the ship’s service life for each ship deployment and employment profile. Each cost element of the table is
typically expressed as a random variable (probability density function). For energy provided as fuel, the table
entries have units of $/kg. For energy provided as electricity to the ship (shore power), the table entries have units
of $/kW-h.
3.24 Lifecycle cost of energy. The lifecycle cost of energy is the total estimated cost of energy over the service
life of the ship for each ship deployment and employment profile. It is typically expressed as a random variable
(probability density function).
3.25 Average annual energy cost. The average annual energy cost is obtained by dividing the lifecycle cost of
energy by the design service life of the ship. It is typically expressed as a random variable (probability density
function).
3.26 Study guide. A study guide is a planning document intended to align customer expectations with work
accomplished in a technical study. Among many other items, study guides include the general approach for
conducting the study and a list of key assumptions.
3.27 Design service life. The design service life is the number of years the customer intends for a ship to be
operationally relevant. Ship system design, maintenance strategies, and modernization strategies are all impacted by
the design service life.
4. SYMBOLS
$/kg Dollars per Kilogram
$/kW-h Dollars per Kilowatt-Hour
AAW Anti-air Warfare
AEO Annual Energy Outlook
AoA Analysis of Alternatives
ASN(RD&A) Assistant Secretary of the Navy for Research, Development and Acquisition
ASuW Anti-surface Warfare
ASW Anti-submarine Warfare
bbl Barrel (42 U.S. gallons)
BCA Business Case Analysis
BSP Baseline Security Posture
CONOPS Concept of Operations

DDS 200-2
6
CP Conventionally Propelled
DESC Defense Energy Support Center
DFM Diesel Fuel Marine
DLA Defense Logistics Agency
DoD Department of Defense
DRM Design Reference Mission
DWCF Defense Working Capital Fund
EIA Energy Information Administration
EPLA Electric Plant Load Analysis
FBCE Fully Burdened Cost of Energy
FISC Fleet Industrial Supply Centers
IAC Initial Acquisition Cost
kg Kilogram
kg/h Kilograms per Hour
kg/kW-h Kilograms per Kilowatt-Hour
kg/L Kilogram per Liter
kW Kilowatt
kW-h Kilowatt-Hour
MCO Major Combat Operations
MSC Military Sealift Command
NAVFAC Naval Facilities Engineering Command
NAVSEA Naval Sea Systems Command
NEURS Navy Energy Utilization Reporting System
NOLSC Navy Operational Logistics Support Center
O&S Operating and Support
OMB Office of Management and Budget
OPNAV Office of the Chief of Naval Operations
OPTEMPO Operational Tempo
OSD Office of the Secretary of Defense
OSD(PA&E) Office of the Security of Defense for Program Analysis and Evaluation
POE Projected Operational Environment
ROC Required Operational Capability
SFC Specific Fuel Consumption

DDS 200-2
7
SV Salvage Value
SYSCOM Systems Command
TACSIT Tactical Situation
TBMD Theater Ballistic Missile Defense
TLR Top Level Requirements
UL Useful Life
UNREP Underway Replenishment
UNTL Universal Naval Task List
VAMOSC Visibility and Management of Operating and Support Costs
5. GENERAL REQUIREMENTS
5.1 Operational profile.
5.1.1 Introduction. The operational profile describes the number of hours a ship operates for each year within
the ship’s design service life in each of its operational modes and with a corresponding speed-percent time profile.
In early stages of design, the operational profile is often assumed identical for every year based on average expected
OPTEMPOs. As the design evolves, the operational profile is typically refined to reflect periods of peace, limited
conflicts, major conflicts, and the maintenance and modernization strategy.
5.1.2 Operational profile inputs.
1. BSP
2. MCO scenarios and associated TACSITs
3. Future naval force architecture
4. Ship mission and mobility capabilities list
5.1.3 Operational profile outputs.
1. Table of “ship states”
2. Operational modes list
3. One or more ship deployment and employment profiles
4. Ship state participation table
5.2 Annual energy usage.
5.2.1 Introduction. Annual energy usage calculations use the operational profile outputs and the characteristics
of the ship design to calculate the amount of fuel and/or electricity (shore power) consumed in each year of the
ship’s design service life for each of the operational modes.
Some studies may not require the calculation of fuel used by embarked vehicles, or the amount of electrical
power consumed from shore power, to address the goals of the study. The rationale for eliminating these
calculations should be documented in the study guide.
5.2.2 Annual fuel consumption inputs.
1. Ship characteristics (required for DDS 200-1 calculations)
a. Electric and propulsion plant CONOPS
b. Electrical generation, conversion, and distribution efficiencies
c. Propulsion motor module efficiency (electric drive) or reduction gear efficiency (mechanical drive)
d. Propulsion speed power curve

DDS 200-2
8
e. Electric power load analysis including margins – see DDS 310-1
f. Electric power service life allowance
g. Prime mover SFC curves
h. Plant deterioration allowance – see DDS 200-1 for default values
i. Sea state and fouling factor – see DDS 200-1 for default values
j. Ambient condition profile – see DDS 200-1 for default values
2. Operational profile outputs
a. Table of “ship states”
b. Operational modes list
c. Ship deployment and employment profiles
d. Ship state participation table
3. Embarked vehicle energy usage
5.2.3 Annual fuel consumption outputs.
1. Annual energy usage tables
5.3 Fully Burdened Cost of Energy (FBCE).
5.3.1 Introduction. The FBCE incorporates the following costs for each operational mode of the ship for each
year of the ship’s service life:
1. Standard commodity cost.
2. The cost, including personnel costs, of operating service-owned fuel delivery assets that are required for
resupply of the platform or weapon systems.
3. The costs associated with force protection/convoy escorts that are required for fuel delivery to the platform
or weapon system.
4. The depreciation costs of the associated fuel delivery and force protection/convoy assets.
5.3.2 FBCE cost inputs.
1. Energy Information Administration (EIA) Annual Energy Outlook (AEO)
2. DLA Energy standard price buildup
5.3.3 FBCE outputs.
1. Table of FBCE
5.4 Annual energy cost.
5.4.1 Introduction. Annual energy cost calculations use the annual energy consumption and FBCE to calculate
the annual fuel cost for each ship deployment and employment profile.
5.4.2 Annual energy cost inputs.
1. Annual energy usage tables
2. Table of fully burdened cost of fuel
3. Ship deployment and employment profiles
5.4.3 Annual energy cost outputs.
1. Annual cost of energy table
2. Lifecycle cost of energy for each ship deployment and employment profile
3. Average annual energy cost for each ship deployment and employment profile
DDS 200-2
9
6. SPECIFIC REQUIREMENTS
While this document provides data for specific years in the past, it also provides sources for obtaining more
recent data. The user of this document is encouraged to use more recent data when such data is available. Specific
sources of data should be detailed in the study guide.
6.1 Operational profile.
6.1.1 Introduction. Developing a useful and representative operational profile is perhaps the most challenging
activity in performing annual fuel calculations. In many cases, the simplest manner to construct the operational
profile products is to modify the operational profile used in a previous study. Care must be taken to ensure the
assumptions of the original study are consistent with the current study. In some cases, it will be necessary to
develop an operational profile from scratch.
The methods in this section are derived from those developed for the study conducted to produce the Report to
Congress on Alternative Propulsion Methods for Surface Combatants and Amphibious Warfare Ships of January
2007.
6.1.2 Operational mode development. The operational modes describe the capability sets that a ship must
support for a given period of time (generally at least a month in duration). Examples of operational modes include:
1. Presence and training at home
2. Presence overseas
3. TBMD operations
4. Lesser contingencies
5. MCO
6. Maintenance and modernization
The goal is to be able to capture the entire range of ship activities over its service life in a relatively few number
of categories.
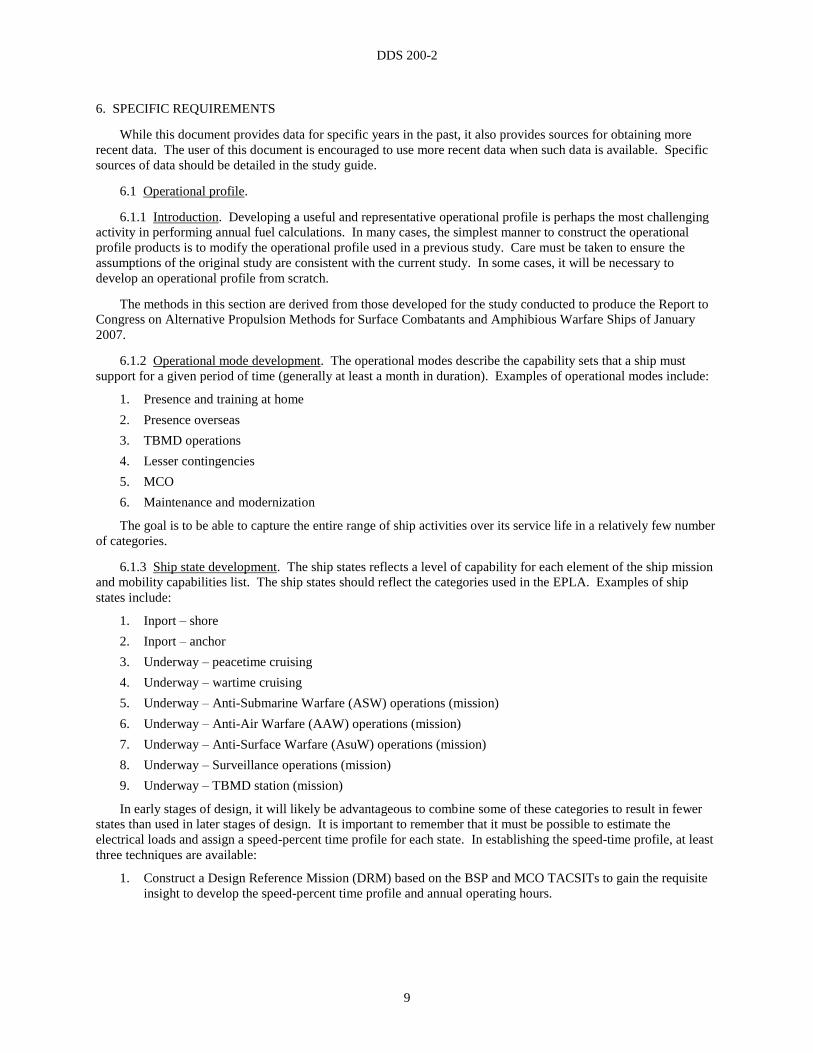
6.1.3 Ship state development. The ship states reflects a level of capability for each element of the ship mission
and mobility capabilities list. The ship states should reflect the categories used in the EPLA. Examples of ship
states include:
1. Inport – shore
2. Inport – anchor
3. Underway – peacetime cruising
4. Underway – wartime cruising
5. Underway – Anti-Submarine Warfare (ASW) operations (mission)
6. Underway – Anti-Air Warfare (AAW) operations (mission)
7. Underway – Anti-Surface Warfare (AsuW) operations (mission)
8. Underway – Surveillance operations (mission)
9. Underway – TBMD station (mission)
In early stages of design, it will likely be advantageous to combine some of these categories to result in fewer
states than used in later stages of design. It is important to remember that it must be possible to estimate the
electrical loads and assign a speed-percent time profile for each state. In establishing the speed-time profile, at least
three techniques are available:
1. Construct a Design Reference Mission (DRM) based on the BSP and MCO TACSITs to gain the requisite
insight to develop the speed-percent time profile and annual operating hours.

DDS 200-2
10
2. Use measured data from ships with a similar mission to develop representative speed-percent time profiles
and annual operating hours. The Navy Energy Utilization Reporting System (NEURS) is a good source of
information for annual operating hours and total energy consumption (useful for validating speed-time
profiles).
3. Use data from Appendix B and Appendix C for ships with a similar mission. Document any adjustments
made and the rationale.
6.1.4 Ship state participation table development. The ship state participation table is produced by examining
the BSP, MCO scenarios, and the associated TACSITs to estimate the fraction of time (participation factor) spent in
each state for each operational mode.
6.1.5 Ship deployment and employment profile development. Generally three ship deployment and
employment profiles should be sufficient for many studies. These three profiles correspond to:
1. Low: peacetime operation with no MCOs and a limited number of lesser contingencies.
2. Medium: adds a single MCO to the Low profile.
3. High: adds two MCOs to the Low profile.
For each year in the projected service life of the ship, the number of hours the ship spends in each operational
mode is estimated and recorded in the ship deployment and employment profile. In determining the number and
length of deployments, the projected number of ships in the future naval force architecture in any one year must be
considered in determining the operational needs for both the BSP and the MCOs.
6.2 Annual energy usage.
6.2.1 Introduction. The output of the annual energy usage process consist of an annual energy usage table for
each ship deployment and employment profile. The annual energy usage table provides the fuel(s) consumed in kg
and, unless otherwise specified in the study guide, the shore power used in kW-h for each operational mode for each
year in the ship deployment and employment profiles. Unless otherwise specified in the study guide, the fuel
consumed accounts for fuel used by the ship itself and the fuel consumed for embarked vehicles (aircraft, boats, and
unmanned vehicles). For many studies, point estimates for annual energy usage provide sufficient insight. In some
cases, stochastic modeling and simulation techniques may be needed to understand the anticipated variance of the
annual energy usage. DDS 310-1 provides guidance for stochastic load analysis in estimating the electrical load. In
the following discussion, variables can be considered either point estimates or random variables depending on the
needs of the study as documented in the study guide.
The annual energy usage table elements are comprised of three sub-elements:
a. Fuel (kg) consumed by the ship
b. Shore power (kW-h) used by the ship
c. Fuel (kg) consumed by embarked vehicles
6.2.2 Fuel consumed by the ship. The EPLA provides the 24-hour average ship service power profiles for each
ship state. For each year in the ship’s operating life, this value should be adjusted to reflect consumption of service
life allowance in one of the following ways:
a. Apply 50 percent of the service life allowance to all years.
b. Incrementally apply the service life allowance in equal amounts for each year in the ship’s life.
c. Apply the service life allowance in a manner defined in the study guide.
This electric load (corresponding to the 24-hour average mission ship service electric load profile) and the
speed-time profile for the ship state are used to compute a calculated operational presence fuel rate (kg/h) using the
method detailed in DDS 200-1 for the operational presence burnable fuel load. For each ship state, the calculated
ship state fuel rate (kg/h) is equal to the corresponding calculated operational presence fuel rate (kg/h) multiplied by
the plant deterioration allowance.

DDS 200-2
11
For each operational mode, the calculated operational mode fuel rate (kg/h) is calculated by summing the
product of each calculated ship state fuel rate (kg/h) with its corresponding participation factor from the ship state
participation table.
The ship contribution to the fuel consumption elements of the annual energy usage table (kg) is constructed by
multiplying the appropriate calculated operational mode fuel rate (kg/h) by the number of hours for that operational
mode as provided in the corresponding ship deployment and employment profile.
6.2.3 Shore power used by the ship. The EPLA provides the 24-hour average ship service power profiles for
“shore power” ship state. The ambient condition profile is applied to the 24-hour average ship service power profile
for “shore power” to calculate the 24-hour average shore power load.
For each operational mode, the calculated operational mode shore power (kW) is calculated by summing the
product of the 24-hour average shore power load with its corresponding participation factor from the ship state
participation table.
The ship contribution to the shore power elements of the annual energy usage table (kW-h) is constructed by
multiplying the appropriate calculated operational mode shore power (kW) by the number of hours for that
operational mode as provided in the corresponding ship deployment and employment profile.
6.2.4 Fuel consumed by embarked vehicles. The fuel consumed by embarked vehicles is determined by
modeling the embarked vehicles and their CONOPS to determine an embarked vehicle fuel rate (kg/h) for each ship
state. The method for modeling the embarked vehicles and the CONOPS should be documented in the study guide.
For each operational mode, the calculated embarked vehicle operational mode fuel rate (kg/h) is calculated by
summing the product of each embarked vehicle fuel rate (kg/h) for each ship state with its corresponding
participation factor from the ship state participation table.
The embarked vehicle contribution to the fuel consumption elements of the annual energy usage table (kg) is
constructed by multiplying the appropriate calculated embarked vehicle operational mode fuel rate (kg/h) by the
number of hours for that operational mode as provided in the corresponding ship deployment and employment
profile.
6.3 Fully Burdened Cost of Energy (FBCE).
6.3.1 Introduction. The output of the FBCE process is a table of fully burdened cost of fuel ($/kg) and fully
burdened cost of electricity ($/kW-h) for each operational mode for each year in the ship deployment and
employment profiles. Typically expressed as a random variable (probability density function) to account for the
uncertainty in the underlying estimation method.
6.3.2 Fully burdened cost of fuel. The fully burdened cost of fuel consists of two elements: the DLA Energy
standard price for fuel and the fuel burden. Appendix A provides the method for calculating the fuel burden for F76.
This method should be adapted to calculate the burden for JP5.
The DLA Energy standard price of fuel is not a marketplace price, but rather reflects the anticipated cost to the
Government for providing the commodity to DoD customers. Table 6-1 shows the buildup of the DLA Energy
standard price for FY 2011. Note that DLA Energy only provides the breakout for the composite standard price,
which represents the average for all types.

DDS 200-2
12
Table 6-1. FY 2011 DLA Energy Standard Price Buildup.
Distillate/F76
Oct-10 - May-11 Jun-11 - Sep-11
Crude Oil
Refined Product
Adjustments
Storage, Transport
& Management
Standard Price $139.72
FY11 Fuel Prices - COMPOSITE
(FY11 Weighted average $140.14)
$14.60
$127.26 $165.90
$85.02 $105.00
$25.51 $31.50
$2.01
( 1 ) ( 2 )
OSD and ASN
(FM&C) Guidance
as of 7/25/2011
Represents
Weighted Average
for all FY11
$14.80
$14.72
In estimating the range of crude oil prices, the EIA publishes an AEO which includes world crude oil price
projections. The AEO includes a reference case, a low price case, and a high price case for roughly 5, 15, and 25
years in the future to bound the uncertainty of future crude oil prices. These estimates can be interpolated or
extrapolated to develop estimates for other years. Based on data from AEO 1998 through AEO 2009, the high price
case has proven a more accurate predictor of price than the low price case. Historically, AEOs have underestimated
crude oil prices in the long-term.
If better information is not available, the product refinement cost can be estimated as 30 percent of the crude oil
price.
The cost recovery from prior years should normally be estimated as negligible.
The cost to store, transport, and manage DLA Energy bulk petroleum products should be escalated using
standard escalation indices from the last year data is available.
In most studies, a single fuel burden can be applied to all the fuel consumed by a ship without significant impact
on design decisions. Some studies; however, may require different burdens be calculated for fuel delivered inport
and fuel delivered at sea. In this case, the methods described in Appendix A would require some modification.
The great volatility of crude oil prices (AEO 2011 shows a 4 to 1 ratio of the long-term high oil price to low oil
price projections) suggests that a simple projection of fuel price in the future will not be sufficient to gain the insight
needed for many decisions. If better insight is needed, the impact of the variability of crude oil prices can be
accounted for in several ways including:
a. Use the current DLA Energy price as a baseline, then show the impact of varying this amount both upwards
and downwards to reflect the anticipated volatility.
b. Use the AEO to predict future DLA Energy prices for the baseline, high price and low price to reflect the
volatility.
c. Use the AEO to develop a stochastic model of the DLA Energy price as a function of year.
Note that the fully burdened cost of fuel is generally expressed per barrel (1 bbl = 42 U.S. gallons) while fuel
consumption is expressed in kg. The specific gravity (kg/L) of JP5 is between 0.788 and 0.845 (per
MIL-DTL-5624) depending on temperature and the crude oil the fuel is derived from. An average value of 0.81 is
representative. For F76, a representative value is 0.84 (Note the maximum value per MIL-DTL-16884 is 0.876).
Hence, the mass per barrel of JP5 is: 0.81 kg/L x 3.785 L/gal x 42 gal/bbl = 129 kg/bbl
The mass per barrel of F76 is: 0.84 kg/L x 3.785 L/gal x 42 gal/bbl = 134 kg/bbl

DDS 200-2
13
6.3.3 Fully burdened cost of shore power. The fully burdened cost of shore power is very dependent on the
particular port from which a ship operates. For example, the price of electricity charged to ships on the west coast
can be double that charged on the east coast.
The major element of the fully burdened cost of shore power is the commodity price for electricity. The Naval
Facilities Engineering Command (NAVFAC) tracks the usage and cost of electricity by naval facilities. Rate
information is provided in the Defense Utility Energy Reporting System (DUERS) Energy Audit Reports (EAR16)
available from https://navyenergy.navfac.navy.mil/.
The AEO includes projections for the commodity price for electricity. The 2011 edition predicts average
electricity prices to be essentially constant through 2035 with a price of roughly $0.09 (±$0.003) per kW-h in FY09
dollars. The price for electrical power in west coast ports is typically higher than this average while the price in east
coast ports is typically lower.
While not explicitly known, the additional burden to cover Navy owned electrical system infrastructure is
expected to be low. Hence, using the AEO average price of $0.09 (±$0.003) per kW-h in FY09 dollars is likely
conservative in cases where the homeport is not known or will vary greatly. If the homeport is known, then DUERS
data for the ship’s homeport may be used.
6.4 Annual energy cost.
6.4.1 Annual cost of energy table. The annual cost of energy table is constructed by summing the product of
the sub-elements of each element of the annual energy usage table with the corresponding fully burdened cost of
fuel/electricity. The resulting table provides the cost of energy for each year over the ship’s design service life. As
documented in the study guide, some studies may require energy usage and energy cost data for different categories
of energy use (i.e., propulsion). Some studies may also require a roll-up of annual energy costs of all the ships in a
class where the commissioning and decommissioning schedule of ships in the class are detailed in the study guide.
6.4.2 Lifecycle cost of energy. The lifecycle cost of energy for each ship deployment and employment profile
is the sum of the annual cost of energy over the design service life.
6.4.3 Average annual energy cost. The average annual energy cost is the lifecycle cost of energy for each ship
deployment and employment profile by the design service life.

DDS 200-2
APPENDIX A
A-1
APPENDIX A. FULLY BURDENED COST OF ENERGY (FBCE) FOR F76
A.1 Introduction/Background.
DoD Instruction 5000.02 requires that the fully burdened cost of delivered energy (fuel) be used in trade-off
analyses for all DoD tactical systems with end items that create a demand for energy.
ASN (RD&A) memo “Energy Evaluation Factors in the Acquisition Process” dated 20 June 2011 states,
“System Commands (SYSCOMS) will develop a uniform method for calculating FBCE to support their respective
acquisition programs.” Per the memo, all FBCE methodologies should, at a minimum, contemplate (i) a standard
commodity cost; (ii) the cost, including personnel costs, of operating service-owned fuel delivery assets that are
required for resupply of the platform or weapon system; (iii) the cost associated with force protection/convoy escorts
that are required for fuel delivery to the platform or weapon system; and (iv) the depreciation costs of the associated
fuel delivery and force protection/convoy assets. The memo also states that all cost projections must be tied to
planning scenarios in the AoA Guidance, and scenarios must represent both steady-state and surge OPTEMPO.
For Analyses of Alternatives (AoAs), Business Case Analyses (BCAs), or other analyses comparing alternatives
with different fuel/energy demands, analysts should use the FBCE to capture the additional indirect/burdened cost
for each alternative. Different energy/fuel demands may include not only nuclear vs. conventional propulsion, but
also conventional propulsion systems that have different fuel consumptions or efficiencies. Operating and Support
(O&S) cost estimates to support budget planning for a specific system should not include the additional
indirect/burdened cost of energy in their estimates. The FBCE does not represent a direct budget charge to a
program.
For naval ship applications, the FBCE includes the acquisition cost of a barrel of ship propulsion fuel burdened
with the additional indirect costs associated with delivering it to the warfighter. The acquisition cost of bulk
petroleum products is established by OSD and reported by the DLA Energy, previously known as the Defense
Energy Support Center (DESC). The DoD standard price includes storage, handling, management, and
transportation of the fuel to DoD fuel supply points worldwide. DLA Energy/OSD issues a standard price of fuel
for all bulk petroleum products including naval distillate fuel (NATO Symbol F76 formerly known as Diesel Fuel
Marine (DFM)) and jet propulsion (JP5) fuel. F76 is the primary propulsion and electrical power generation fuel for
naval vessels in shipboard boilers, gas turbines, and diesel engines. JP5 is typically used to power aircraft, but can
be used for ship propulsion and electrical power generation under certain operational scenarios.
For sea systems, the majority of the additional indirect costs are associated with the Underway Replenishment
(UNREP) of naval vessels by fuel delivery ships. The burdened costs also include Navy fuel barge maintenance
costs and potential environmental liability costs. The NAVSEA 05C FBCE methodology calculates the additional
burdened cost associated with ship propulsion fuel (F76).
The total cost of naval fuel is made up of four major components: acquisition cost, storage and handling cost,
delivery cost, and other. The elements of the cost structure are shown in Table A-1. This cost structure was defined
in the OSD Program Analysis and Evaluation (PA&E) memo dated 16 July 2007 entitled, “Fully Burdened Cost of
Fuel Methodology.”

DDS 200-2
APPENDIX A
A-2
Table A-1. Cost Structure of Navy Fuel.
Category Element Description
Acquisition Commodity Cost of Fuel
DLA Energy DoD standard price for the appropriate
type or types of fuel.
BU
RD
EN
ED
EL
EM
EN
TS
Storage & Handling
Direct Fuel Infrastructure
O&S and Recapitalization
Cost
Cost of fuel infrastructure that is not operated by
DLA Energy and directly tied to energy delivery.
Indirect Fuel Infrastructure
O&S Cost
Cost of base infrastructure that is shared
proportionally among all base tenants.
Delivery
Depreciation Cost of
Primary Fuel Delivery
Assets
Measures the decline in value of fuel delivery assets
with finite service lives using straight-line
depreciation over total service life.
Primary Fuel Delivery Asset
O&S Cost
Cost of operating service-owned fuel delivery assets
including the cost of military and civilian personnel
dedicated to the fuel delivery mission.
Other
Environmental Cost Cost representing carbon trading credit prices,
hazardous waste control, and related subjects.
Other Service & Platform
Delivery Specific Costs
Includes potential costs associated with delivering
fuel such as convoy escort, force protection,
regulatory compliance, contracting, and other costs
as appropriate.
The cost structure can also be illustrated by Figure A-1.
Figure A-1. Breakdown of Fully Burdened Cost of F76.

DDS 200-2
APPENDIX A
A-3
In this appendix, Sections 2 through 5, each cost component, its derivation, and the data sources will be
discussed in greater detail. Section 6 summarizes the results of the most recent fuel study analysis and Section 7
provides future considerations for determination of the FBCE.
A.2 Acquisition cost.
Fuel for all DoD components is centrally managed and supplied by the DLA Energy. DLA Energy contracts,
distributes, and controls DoD fuel. DLA Energy charges all DoD customers the same standard price for specific
types/grades of fuel. Standard prices were created by DoD fiscal managers to insulate the military services from the
normal ups and downs of the fuel marketplace. It provides the military services and OSD with budget stability
despite the commodity market swings, with gains and losses being absorbed by a revolving fund known as Defense
Working Capital Fund (DWCF). In years where the market price of the fuel is higher than the estimated price, the
DWCF loses money and vice versa. The gains and losses are made up by adjusting future standard prices.
The standard price includes the following:
1. Estimate of a barrel of crude oil for a given year (typically estimated 18 months in advance of application)
2. Product refinement costs
3. Cost recovery (profits/losses) from prior years through a DWCF
4. Costs to store, transport, and manage DLA Energy bulk petroleum products at DoD fuel supply points
worldwide
The standard price of fuel is not a marketplace price because of the substantial lead time in the estimation of
crude oil prices and the buying power of DoD. It is not intended that the standard price of fuel be comparable to
similar fuels in the commercial marketplace.
Standard prices are updated at least annually. Mid-year price changes have occurred since 2005 due to large
fluctuations in the price of crude oil.
DoD standard prices can be accessed from the website http://www.energy.dla.mil under “Home > Customer >
Standard Prices of Fuel”.
F76, also known as Naval Distillate, is the primary fuel used for Navy ship propulsion and electrical power
generation. JP5 is primarily used for powering aircraft.
The FY 2011 DoD composite standard price of distillate (including F76) fuels as of 1 June 2011 is $165.48 per
barrel, up from the 1 October 2010 price of $126.84. This price includes an amount for cost recovery. The FY 2011
average price specifically for F76 through 30 September 2011 is $139.72. The breakdown of the DoD standard
price per barrel into individual line items is shown in Table 6-1.
A.3 Burdened cost: storage and handling cost derivation.
Storage and handling is the first element of the additional burdened costs. The majority of naval fuel is
provided by Fleet Industrial Supply Centers (FISCs) throughout the world. As of 2003, the Navy transferred
ownership and operation of the Navy FISC bulk fuel terminals to DLA Energy. The depreciation and operating
costs associated with these fuel terminals are now included as part of the DoD standard price as described in Section
2. Non-DLA Energy storage and handling costs include the storage and handling of the fuel after DLA Energy
delivers the fuel to DoD fuel service points. The fuel stored at fuel service points is delivered either to the delivery
vessels transporting fuel to battle-force ships or directly to the docked end user. The additional storage and handling
costs primarily reflect the overhaul and maintenance costs of Navy fuel barges that transport fuel between fuel
supply points and delivery vessels.
The cost to deliver fuel to the docked end user has not been assessed and is anticipated to be insignificant, as
only minimal logistics are required to fuel the docked end user.

DDS 200-2
APPENDIX A
A-4
The O&S costs for Navy-owned fuel barges are funded by DLA Energy with the rest of the FISC fuel terminal
operating costs, and are included in the DLA Energy “storage, transport, and management” cost element of the
acquisition costs described earlier. The only cost not included in the DoD standard price is the overhaul and
maintenance of the fuel barges. Based on information provided by the Navy Operational Logistics Support Center
(NOLSC) Petroleum, each fuel barge is overhauled once every 6 years and the average cost of an overhaul is
$600,000 (FY06). This equates to an average annual cost of $100K per barge per year. For the 14 Navy-owned fuel
barges, the total average annual cost is $1.4M.
14 barges x [($0.6M per overhaul)/(6 years)] = $1.4M/year
Fuel barges deliver various types of fuel, so it is difficult to apportion overhaul costs to specific fuel types. The
annual amount of $1.4M divided over 29.1M bbls of all fuel consumed by the fleet in FY 2006 resulted in an
estimated additional cost of $0.05 per barrel of fuel for barge overhauls.
A.4 Delivery cost derivation.
A.4.1 Overview.
The delivery cost of fuel consists of the acquisition/depreciation and O&S costs for fuel replenishment/delivery
ships. Different cost components are associated with different types of fuel delivery ships, based on the ownership
and the operation of the ships. In general, there are two different types of ships:
Type (1) - Navy-owned and Navy-operated ships
(Depreciation and O&S Costs)
Type (2) - Navy-owned and Military Sealift Command (MSC)-operated ships
(Depreciation and MSC per diem charges for O&S)
Currently, all fuel delivery ships are Navy-owned and MSC-operated.
A.4.2 Acquisition/Depreciation cost of fuel delivery ships.
There are several classes of Navy-owned ships capable of delivering fuel, including T-AO, T-AOE, T-AKE,
T-AE, and T-AFS. Delivery ships’ acquisition costs are depreciated over the period of their respective service lives.
Although OMB Circular A-76 guidance states that the expected Useful Life (UL) of cargo and tanker vessels is 30
years, with a disposal/Salvage Value (SV) at the end of the UL of 8.54 percent of the Initial Acquisition Cost (IAC),
MSC assumes the expected service life of cargo and tanker ships to be 40 years. Delivery vessel inventory is phased
based on a first-in, first-out methodology. The future acquisition strategy and inventory counts over time are based
on the President’s budget battleforce tables provided by OPNAV. This information includes the dates (years) when
fuel delivery ships are projected to enter into and retire from service.
The IAC for each hull currently in operation is obtained from the NAVSEA 05C Cost Information Management
System historical ship cost database. Costs for future ships are based on NAVSEA 05C estimates or class average
costs for similar ship types. The NAVSEA 05C SCN Shipbuilding Composite Inflation Index is used to update the
acquisition cost from the acquisition year dollars to FY dollars for which the FBCE is being calculated.
Annual depreciation for a given hull for each year over its projected service life is calculated by applying the
straight line depreciation method. As mentioned earlier, the SV for each hull is assumed to be 8.54 percent of the
IAC at the end of 30 years of UL according to OMB guidance. The standard straight line depreciation formula for
each year is as follows:
Depreciation ($/year) = (IAC – SV)/UL
Where: IAC = Initial Acquisition Cost ($)
SV = Salvage Value ($)
UL = Useful Life (years)

DDS 200-2
APPENDIX A
A-5
Substituting SV = IAC * 0.0854, the equation becomes
Depreciation = (IAC – (IAC * 0.0854))/30 ($/year)
= IAC * (1 - 0.0854)/30 ($/year)
= IAC * (0.03049) ($/year)
Although UL is 30 years, the actual or expected service life of a fuel delivery ship could be longer than 30
years. If the service life is longer than 30 years, the assumed SV at the end of 30 years needs to be depreciated until
the asset value reaches zero or the ship is salvaged, whichever occurs first. Once the asset is fully depreciated, the
depreciation amount for any remaining years of service life is set to zero.
Using straight line depreciation, the formula for the asset value in year n is as follows:
Asset Valuen = IAC – n*(Depreciationn) ($)
= IAC – n*(IAC * (0.03049)) ($)
To determine the point (year n) at which the asset value is zero, set Asset Valuen to zero and solve the equation
for n:
n = 1.0/(0.03049) = 32.8 years
The asset value will be completely depreciated by 33 years of service life. The annual depreciation amount for
each hull is expressed as follows:
Years 1 through 32:
Depreciation amount = IAC * (0.03049) ($/year)
Year 33:
Depreciation amount = IAC * [1 - (0.03049*32)] ($/year)
Accounts for residual depreciation needed after year 32 so that:
Total depreciation amount = IAC ($)
Years 34 and beyond:
Depreciation amount = 0 ($/year)
The annual depreciation for each ship (hull) in service for that class for that year is summed to calculate the
total depreciation value for each class in any given year.
Depreciation cost for each class is the average annual depreciation cost for the period of 35 years, assuming
average service life of the delivery ships to be 35 years as shown below (mid-point of OMB guidance of 30 years of
UL and MSC assumption of 40 years of service life).

DDS 200-2
APPENDIX A
A-6
Because FBCE is calculated as $/barrel to be applied over the entire life of Navy programs, the above formula
allows for factoring in the effect of the long range shipbuilding plan on the number of fuel delivery ships, as well as
any changes in costs for reasons other than inflation. Other factors influencing future acquisition costs may include
changes in specifications, environmental or legislative requirements, such as the Federal law passed after the Exxon
Valdez spill requiring all oil tankers to be double-hulled by 2015.
A.4.3 Apportioning depreciation cost to ship propulsion fuel.
As mentioned previously, there are several classes of delivery ships, including T-AO, T-AOE, T-AKE, T-AE,
and T-AFS. These ships also deliver other items in addition to fuel, including ammunition, food, stores, and other
supplies. Hence, only a portion of the depreciation costs are applied to fuel delivery. The depreciation costs for
these ships are apportioned based on the portion of the ship’s mission operations dedicated to fuel
replenishment/delivery. The information on mission percentages dedicated to fuel operations is provided by the
cognizant ship program managers. The following percentages represent the current baseline case assuming
peacetime operations: T-AO 100%, T-AOE 90%, T-AKE 10%, T-AE 0%, and T-AFS 0%. The percentages for
T-AOE and T-AKE may be modified as needed to represent specific scenarios.
Navy ships primarily use F76 propulsion fuel and Navy aircraft use JP5 propulsion fuel. Because the delivery
ships carry F76 and JP5, as well as other types of fuels, acquisition costs are further apportioned based on the ship
propulsion F76 fuel portion of total fuel replenishment operations, as measured by the quantities of types of fuel
delivered. Out of the total JP5 delivered to the ships, only a small portion is used for ship propulsion. The majority
of the JP5 delivered is consumed for the use by aircraft aboard ships. Hence, for the sea systems ship propulsion
FBCE, costs are not further apportioned based on the small amount of JP5 consumed for ship propulsion.
NOLSC Petroleum provides the amount of fuel (in bbls) delivered annually to the Navy fleet by each fuel
delivery ship, broken out by fuel type (F76, JP5, other). F76 delivered as a percentage of total fuel delivered
(average by fuel delivery ship class) is calculated based on this information. These percentages are used to
apportion the depreciation cost for each fuel delivery ship. Historically, T-AOs deliver approximately 75% F76 as a
percentage of total fuel delivered, T-AOEs 65%, and T-AKEs 90%.
The apportioned depreciation cost is divided by the total barrels of F76 ship propulsion fuel consumed by the
fleet in a given year to calculate a cost per barrel.
The following references are used to project fuel consumption:
1. Navy Visibility and Management of Operating & Support Costs (VAMOSC) provides the consumption of
propulsion fuels for the Navy and MSC fleets.
2. President’s Budget Battleforce Tables (produced by OPNAV) governs the shipbuilding outlook for the next
30 years.
The following variables are extracted from the above references:
1. Number of Conventionally Propelled (CP) ships, non-nuclear, in a given year
2. bbls F76 consumed per CP ship (average)
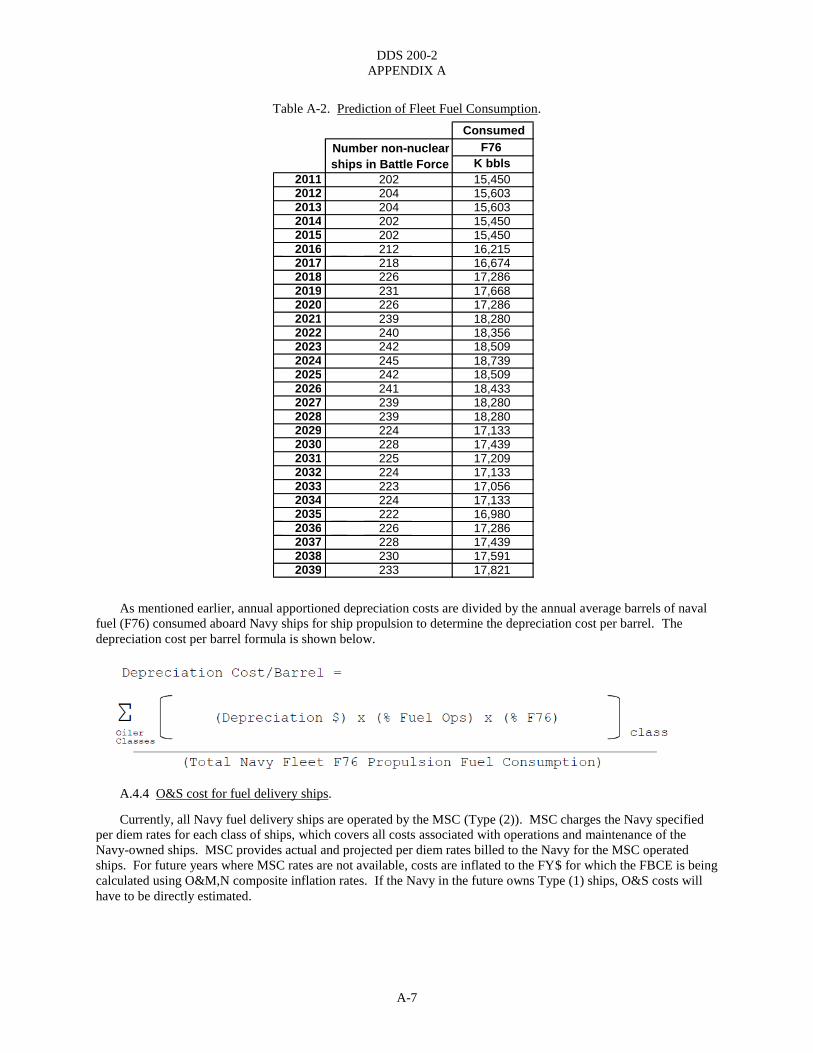
Table A-2 is an example of the fleet fuel consumption profile assumed in estimating the FBCE for future years.
The assumption made in calculating this profile is that the fuel consumption per ship remains relatively constant
over years.
DDS 200-2
APPENDIX A
A-7
Table A-2. Prediction of Fleet Fuel Consumption.
As mentioned earlier, annual apportioned depreciation costs are divided by the annual average barrels of naval
fuel (F76) consumed aboard Navy ships for ship propulsion to determine the depreciation cost per barrel. The
depreciation cost per barrel formula is shown below.
A.4.4 O&S cost for fuel delivery ships.
Currently, all Navy fuel delivery ships are operated by the MSC (Type (2)). MSC charges the Navy specified
per diem rates for each class of ships, which covers all costs associated with operations and maintenance of the
Navy-owned ships. MSC provides actual and projected per diem rates billed to the Navy for the MSC operated
ships. For future years where MSC rates are not available, costs are inflated to the FY$ for which the FBCE is being
calculated using O&M,N composite inflation rates. If the Navy in the future owns Type (1) ships, O&S costs will
have to be directly estimated.
Consumed
F76
K bbls
2011 202 15,450 2012 204 15,603 2013 204 15,603 2014 202 15,450 2015 202 15,450 2016 212 16,215 2017 218 16,674 2018 226 17,286 2019 231 17,668 2020 226 17,286 2021 239 18,280 2022 240 18,356 2023 242 18,509 2024 245 18,739 2025 242 18,509 2026 241 18,433 2027 239 18,280 2028 239 18,280 2029 224 17,133 2030 228 17,439 2031 225 17,209 2032 224 17,133 2033 223 17,056 2034 224 17,133 2035 222 16,980 2036 226 17,286 2037 228 17,439 2038 230 17,591 2039 233 17,821
Number non-nuclear
ships in Battle Force

DDS 200-2
APPENDIX A
A-8
Annual O&S costs for each hull are calculated based on MSC charter/per diem rates. MSC operations assume
365 days of full operating status per year for each fuel delivery ship, unless a ship is in a reduced operating status or
maintenance cycle. Therefore, the annual cost is 365 days times the applicable per diem rate. The O&S cost for a
given year for each class is the sum of the annual O&S for each ship (hull) in service for that class for that year.
O&S cost for each class is the average annual O&S cost for the period of 35 years assuming average service life
of the delivery ships to be 35 years as shown below (mid-point of OMB guidance of 30 years of UL and MSC
assumption of 40 years of service life).
The above formula allows for factoring in the effect of the long range shipbuilding plan on the number of fuel
delivery ships, as well as any changes in costs for reasons other than inflation.
The O&S costs are apportioned in the same manner as the depreciation costs, based on the portion of the
delivery ship’s mission operations dedicated to fuel replenishment and percentage of type of fuel delivered. The
formula to calculate O&S costs per barrel is as follows:
A.5 Other costs.
A.5.1 Environmental costs.
For environmental costs, the OSD (PA&E) guidance of $0.10 per gallon is used. This information was
provided in the OSD (PA&E) memo dated 16 July 2007 entitled, “Fully Burdened Cost of Fuel Methodology”.
Based on 42 gallons per barrel, this cost is estimated to be $4.20 per barrel.
A.5.2 Platform delivery specific costs.
Depending on the platforms and scenarios under consideration, additional factors may need to be considered.
For example, an AoA for nuclear vs. conventionally fueled aircraft carriers must also determine if additional fuel
delivery ships would be required to support the conventional propulsion option, beyond those reflected in the long
range shipbuilding plan. The associated depreciation and O&S costs for those additional ships would need to be
included in the platform-specific FBCE. Other platform-specific design or operational characteristics may also
require adjustments to the delivery component of the burdened cost.

DDS 200-2
APPENDIX A
A-9
The current NAVSEA process for determining the baseline FBCE does not include the potential costs
associated with force protection or convoy escorts. Based on information from the MSC, fuel delivery ships (Naval
Fleet Auxiliary Force ships) are not specifically provided escorts, so no additional burdened costs are calculated to
reflect depreciation or other costs associated with force protection or convoy escort ships. In the future, costs
associated with force protection may be included should the operating practice of the fleet change to provide
delivery ships with dedicated force protection.
A.6 Summary.
The NAVSEA process for calculating the baseline FBCE captures the elements specified in the memo from
ASN (RD&A).
Considering all the factors of burdened elements, the preliminary FY 2011 additional burdened cost is estimated
to be $46.26 per barrel of ship propulsion fuel. The total FBCE is estimated to be $185.98 per barrel F76.
Table A-3 shows burdened elements broken out into individual line items.
Table A-3. Breakdown of Fully Burdened Cost of F76 in FY 2011.
A.7 Future considerations.
Options could be explored to incorporate risk analysis into the calculation of the FBCE. As the price of
fuel/energy can be highly volatile, risk analysis would provide Navy decision makers with better insight into the
costs and likelihood of various outcomes for the platform or system alternatives under consideration.
Per Barrel of F76 FY 2011
Acquisition $139.72
DLA Energy Price $139.72
Storage & Handling $0.05
Direct Fuel Infrastructure - Facilities Cost $0.00
Indirect Fuel Infrastructure - Barge Overhauls $0.05
Delivery $42.01
Fuel Delivery Ship Acquisition/Depreciation $11.67
T-AO $8.80
T-AOE $2.80
T-AKE $0.07
T-AE $0.00
T-AFS $0.00
Fuel Delivery Ship Operating & Support $30.34
T-AO $22.80
T-AOE $7.25
T-AKE $0.30
T-AE $0.00
T-AFS $0.00
Other $4.20
Environmental $4.20
Service/Platform Specific $0.00
Burdened Cost $46.26
Fully Burdened Cost $185.98

DDS 200-2
APPENDIX A
A-10
A.8 References.
1. DoD Instruction 5000.02, “Operation of the Defense Acquisition System”, 2 December 2008
2. ASN (RD&A) memo, “Energy Evaluation Factors in the Acquisition Process”, 20 June 2011
3. OSD Program Analysis and Evaluation (PA&E) memo, “Fully Burdened Cost of Fuel Methodology”, 16
July 2007
4. DoD standard prices from Defense Logistics Agency Energy (DLA Energy), http://www.energy.dla.mil,
“Home > Customer > Standard Prices of Fuel”
5. Office of Management and Budget Circular A-76 March 1996 Revised Supplemental Handbook, “Useful
Life and Disposal Value”
6. President’s Budget Battleforce Tables, OPNAV N8F
7. NAVSEA 05C Cost Information Management System historical ship cost database
8. NOLSC Petroleum data on fuel delivery
9. Navy Visibility and Management of Operating & Support Costs (VAMOSC) data for consumption of
propulsion fuels by the Navy and MSC fleets
10. Naval Center for Cost Analysis Joint Inflation Calculator, https://www.ncca.navy.mil/tools/inflation.cfm,
O&M,N composite inflation rates

DDS 200-2
APPENDIX B
B-1
APPENDIX B. SPEED VS. PERCENT-TIME PROFILE REFERENCE DATA
This appendix contains speed vs. percent-time profiles for surface ships of the U.S. Navy based on the sources
listed in Table B-1 and modified using data from the NEURS over the period FY 1998-2002.
Table B-1. Speed-Time Profile Sources.
Ship Class Original Sources for Speed-Time Profiles
AOE 6 Based on a previous AOE 1 Class Speed-Time Report 1985
CG 47 Derived from actual engine operating profile data (Westinghouse MTD report)
DD 963 Derived from actual engine operating profile data (Westinghouse MTD report)
DDG 51 Based on the CG 47 Speed-Time Profile derived from actual engine profile data
FFG 7 Derived from actual engine operating profile data (Westinghouse MTD report)
LHA 1 The calculations are based on the LHDX Speed-Time Profile (based on TLR)
LHD 1 The calculations are based on the LHDX Speed-Time Profile (based on TLR)
LSD 41/49 The calculations are based on the TLR for LSD 41 Class
MCM The calculations are based on actual engine operation data (MCM 3)
MHC 51 The calculations are based on actual engine operation data (MCM 51)
Table B-2. AOE 6 Class (Gas Turbine).

DDS 200-2
APPENDIX B
B-2
Table B-3. CG 47 Class.
Table B-4. DD 963 Class. DD 963 Class
0
5
10
15
20
25
30
35
40
45
50
4 9 11 13 15 17 19 21 FP
Speed (knots)
% T
ime
Speed. Time
Knots %
4 44
9 12
11 10
13 7
15 12
17 7
19 5
21 2
FP 1
DDS 200-2
APPENDIX B
B-3
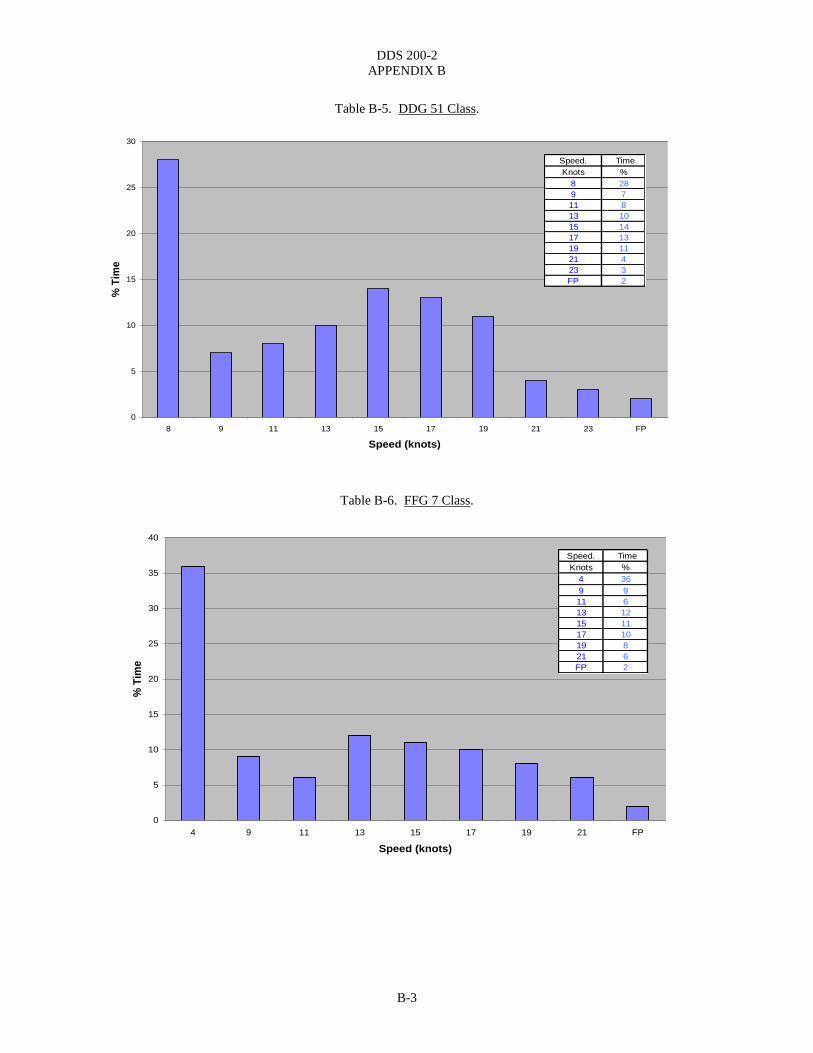
Table B-5. DDG 51 Class. DDG 51 Class
0
5
10
15
20
25
30
8 9 11 13 15 17 19 21 23 FP
Speed (knots)
% T
ime
Speed. Time
Knots %
8 28
9 7
11 8
13 10
15 14
17 13
19 11
21 4
23 3
FP 2
Table B-6. FFG 7 Class. FFG 7 Class
0
5
10
15
20
25
30
35
40
4 9 11 13 15 17 19 21 FP
Speed (knots)
% T
ime
Speed. Time
Knots %
4 36
9 9
11 6
13 12
15 11
17 10
19 8
21 6
FP 2
DDS 200-2
APPENDIX B
B-4
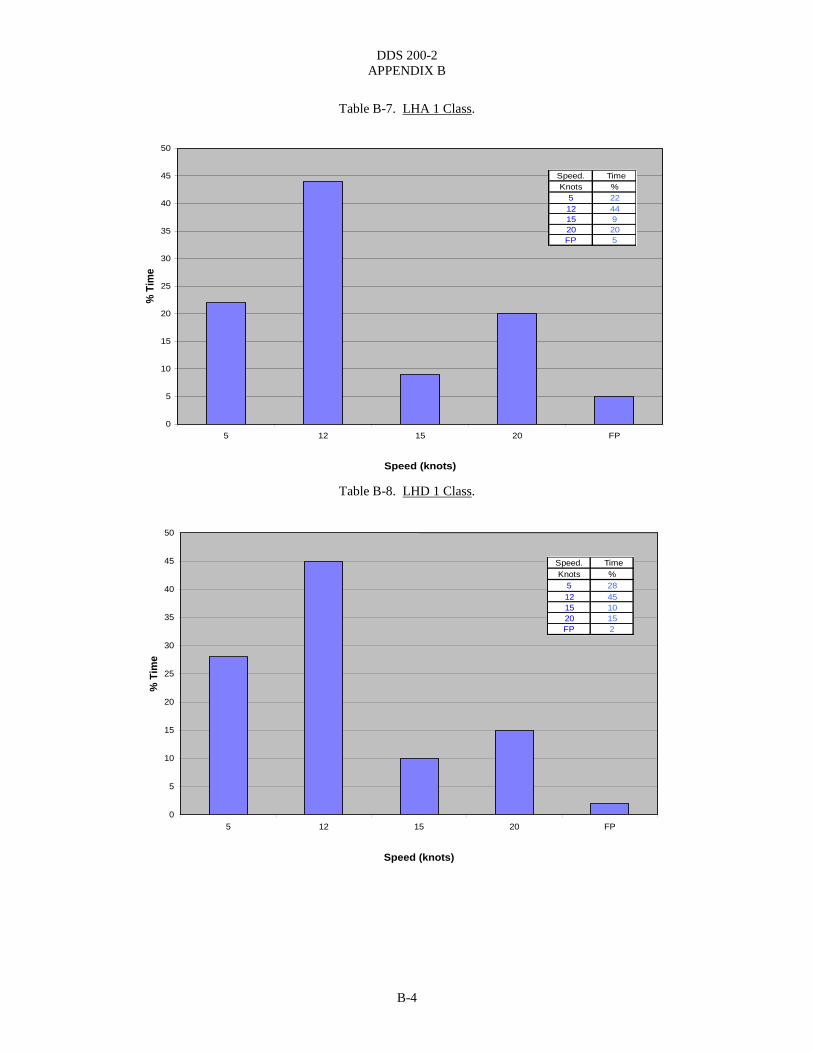
Table B-7. LHA 1 Class. LHA 1 Class
0
5
10
15
20
25
30
35
40
45
50
5 12 15 20 FP
Speed (knots)
% T
ime
Speed. Time
Knots %
5 22
12 44
15 9
20 20
FP 5
Table B-8. LHD 1 Class. LHD 1 Class
0
5
10
15
20
25
30
35
40
45
50
5 12 15 20 FP
Speed (knots)
% T
ime
Speed. Time
Knots %
5 28
12 45
15 10
20 15
FP 2
DDS 200-2
APPENDIX B
B-5
Table B-9. LSD 41 Class (Diesel).
Table B-10. MCM 1 Class. MCM 1 Class
0
5
10
15
20
25
30
35
40
45
6 10 12 FP
Speed (knots)
% T
ime

DDS 200-2
APPENDIX B
B-6
Table B-11. MHC 51 Class.

DDS 200-2
APPENDIX C
C-1
APPENDIX C. OPERATING HOURS REFERENCE DATA
This appendix contains operating hours and fuel consumption reference data for surface ships of the U.S. Navy
based on data from the NEURS over the period FY 1998-2002.
Table C-1. AOE 6 (Gas Turbine) Five Year Class Average 1998-2002.
Year
Underway
Hours
Not Underway
Hours
Underway Barrels
Used
Not Underway
Barrels Used
1998 2147 1726 72405 7398
1999 2847 1669 115833 7776
2000 2597 1456 102200 7270
2001 3235 1089 124901 5638
2002 2527 836 113499 4049
Average 2671 1355 105768 6426
Table C-2. ARS 50 Five Year Class Average 1998-2002.
Year
Underway
Hours
Not Underway
Hours
Underway Barrels
Used
Not Underway
Barrels Used
1998 1581 1860 5889 1678
1999 1570 801 5422 881
2000 2064 1522 7112 1649
2001 1573 1056 4677 957
2002 2044 955 6354 1071
Average 1766 1239 5891 1247
Table C-3. AS (AS 33 + AS 39) Five Year Class Average 1998-2002.
Year
Underway
Hours
Not Underway
Hours
Underway Barrels
Used
Not Underway
Barrels Used
1998 1107 840 26602 7453
1999 960 809 23645 6993
2000 1338 1282 28875 13713
2001 1467 1474 32133 14289
2002 1201 1074 27842 11332
Average 1215 1096 27819 10756
Table C-4. CG 47 Five Year Class Average 1998-2002.
Year
Underway
Hours
Not Underway
Hours
Underway Barrels
Used
Not Underway
Barrels Used
1998 2636 1160 81849 8144
1999 2663 1029 83115 6960
2000 2448 976 78195 7125
2001 2686 899 84149 6455
2002 3001 862 100970 5821
Average 2687 985 85656 6901
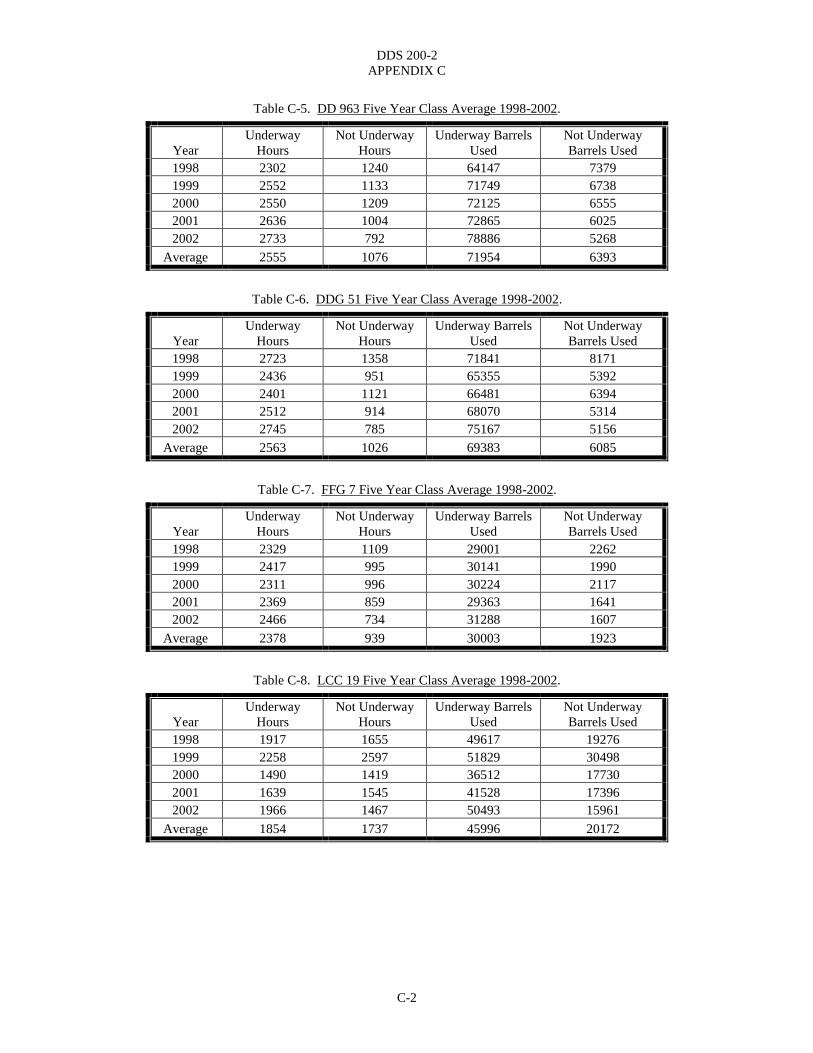
DDS 200-2
APPENDIX C
C-2
Table C-5. DD 963 Five Year Class Average 1998-2002.
Year
Underway
Hours
Not Underway
Hours
Underway Barrels
Used
Not Underway
Barrels Used
1998 2302 1240 64147 7379
1999 2552 1133 71749 6738
2000 2550 1209 72125 6555
2001 2636 1004 72865 6025
2002 2733 792 78886 5268
Average 2555 1076 71954 6393
Table C-6. DDG 51 Five Year Class Average 1998-2002.
Year
Underway
Hours
Not Underway
Hours
Underway Barrels
Used
Not Underway
Barrels Used
1998 2723 1358 71841 8171
1999 2436 951 65355 5392
2000 2401 1121 66481 6394
2001 2512 914 68070 5314
2002 2745 785 75167 5156
Average 2563 1026 69383 6085
Table C-7. FFG 7 Five Year Class Average 1998-2002.
Year
Underway
Hours
Not Underway
Hours
Underway Barrels
Used
Not Underway
Barrels Used
1998 2329 1109 29001 2262
1999 2417 995 30141 1990
2000 2311 996 30224 2117
2001 2369 859 29363 1641
2002 2466 734 31288 1607
Average 2378 939 30003 1923
Table C-8. LCC 19 Five Year Class Average 1998-2002.
Year
Underway
Hours
Not Underway
Hours
Underway Barrels
Used
Not Underway
Barrels Used
1998 1917 1655 49617 19276
1999 2258 2597 51829 30498
2000 1490 1419 36512 17730
2001 1639 1545 41528 17396
2002 1966 1467 50493 15961
Average 1854 1737 45996 20172

DDS 200-2
APPENDIX C
C-3
Table C-9. LHD 1 Five Year Class Average 1998-2002.
Year
Underway
Hours
Not Underway
Hours
Underway Barrels
Used
Not Underway
Barrels Used
1998 2473 1233 108820 19247
1999 2656 1192 122011 19112
2000 2536 1373 107993 23107
2001 2593 1288 113886 21686
2002 3203 883 138777 18354
Average 2692 1194 118297 20301
Table C-10. LSD 41 (Diesel) Five Year Class Average 1998-2002.
Year
Underway
Hours
Not Underway
Hours
Underway Barrels
Used
Not Underway
Barrels Used
1998 2264 1479 32025 6914
1999 2352 1285 29044 5582
2000 1856 1539 24086 6313
2001 2067 1041 25711 3946
2002 2899 982 38473 3986
Average 2288 1265 29868 5348
Table C-11. LSD 49 (Diesel) Five Year Class Average 1998-2002.
Year
Underway
Hours
Not Underway
Hours
Underway Barrels
Used
Not Underway
Barrels Used
1998 2028 1416 25392 6423
1999 1809 1426 23103 6176
2000 2583 1508 34803 7419
2001 2686 1188 36183 5451
2002 3231 889 43663 2957
Average 2467 1285 32629 5685
Table C-12. MCM 1 Five Year Class Average 1998-2002.
Year
Underway
Hours
Not Underway
Hours
Underway Barrels
Used
Not Underway
Barrels Used
1998 1270 608 1609 278
1999 1867 741 2656 375
2000 1435 565 1926 332
2001 1617 457 2242 279
2002 1569 615 2111 277
Average 1552 597 2109 308

DDS 200-2
APPENDIX C
C-4
Table C-13. MHC 51 Five Year Class Average 1998-2002.
Year
Underway
Hours
Not Underway
Hours
Underway Barrels
Used
Not Underway
Barrels Used
1998 1100 331 1229 124
1999 982 457 1174 205
2000 1330 685 1550 286
2001 1014 325 928 122
2002 1257 411 1243 172
Average 1137 442 1225 182

DDS 200-2
APPENDIX D
D-1
APPENDIX D. EXAMPLE
D.1 Introduction.
This appendix provides a fictional example demonstrating the mechanics of performing the annual energy usage
and annual energy cost calculations for an early stage ship concept. This example is not intended to be
representative of any current or future ship in the U.S. Navy.
D.2 Operational profile development.
D.2.1 Operational mode development.
For this fictional ship, an examination of the ships requirements and employment strategy identified the
following operational modes:
a. Maintenance and modernization
b. Predeployment training
c. Deployment
d. MCO
D.2.2 Ship state development.
The four operational modes can be characterized by the following ship states:
a. Inport – shore
b. Underway – economical transit
c. Underway – surge to theater
d. Underway – mission
The electric load (including margins, power system efficiencies, and 50 percent of service life allowance)
associated with each operational mode are:
Temperature
(°F)
Inport - Shore
(kW)
Underway -
Economical
Transit (kW)
Underway -
Surge to
Theater (kW)
Underway -
Mission (kW)
Shore Power Generators Generators Generators
10 1000 3000 3000 4800
59 500 1800 1800 3200
100 900 2400 2400 4000
The inport – shore operational mode does not have any propulsion power associated with it.
For the underway – economical transit operational mode, the design propulsion power is 7100 kW (equally split
between two shafts).
For the underway – surge to theater operational mode, the design propulsion power is 46,800 kW (equally split
between two shafts).

DDS 200-2
APPENDIX D
D-2
For the underway –mission operational mode, the design propulsion power is in accordance with the following:
Speed (knots) Profile % time
5 20%
10 30%
15 25%
20 15%
25 8%
30 2%
D.2.3 Other design details.
a. This ship is not part of a larger class of ships. The deployment and employment profile does not depend on
the number and type of other ships in the future naval force architecture.
b. The ship has a design service life of 15 years, with a single year-long modernization overhaul during its
midlife. Year 1 is assumed to be 2015.
c. Electric and propulsion plant CONOPS: The propulsion plant consists of two shafts each with a Propulsion
Motor Module (PMM) on each shaft. Propulsion power is shared equally between the two PMMs.
The electric plant consists of two 3000 kW gas turbine Auxiliary Turbine Generator (ATG) Power
Generation Modules (PGM) and three 24,000 kW gas turbine Main Turbine Generators (MTG) PGMs. At
least two PGMs are online at all times. Power is shared evenly (proportional to rating) among all online
PGMs. (Note: Power sharing in this manner is not always optimal, but is an acceptable assumption for
early stage design.)
d. Power generation configurations:
Power Low (kW) Power High (kW) Number MTG Number ATG
1200 5700 0 2
5700 25650 1 1
25650 45600 2 0
45600 68400 3 0
68400 78000 3 2
e. Propulsion speed power curve:
Speed (knots) Total Propulsion
Shaft Power (kW) Port Shaft (kW)
Starboard
Shaft (kW) PMM Efficiency
5 217 108 108 0.85
10 1733 867 867 0.89
15 5850 2925 2925 0.90
16 7100 3550 3550 0.91
20 13867 6933 6933 0.92
25 27083 13542 13542 0.94
30 46800 23400 23400 0.94
32.6 60000 30000 30000 0.94

DDS 200-2
APPENDIX D
D-3
Design propulsion power for smooth, deep water at full load displacement with margins and service life
allowance. Measured at the output of PMM. Design motor power per shaft is the electrical power measured at the
input to the PMM.
f. Prime mover SFC curves:
(1) MTG SFC:
Power (kW) SFC (kg/kW-h)
2400 0.465
4800 0.375
9600 0.263
14400 0.233
19200 0.210
24000 0.200
Power is measured at the output of the electrical generator.
For power levels below 2400 kW, use a constant fuel rate (kg/h) calculated at 2400 kW.
(2) ATG SFC:
Power (kW) SFC (kg/kW-h)
600 0.66
1200 0.42
1800 0.33
2400 0.27
3000 0.26
Power is measured at the output of the electrical generator.
For power levels below 600 kW, use a constant fuel rate (kg/h) calculated at 600 kW.
g. Plant deterioration allowance: Use default 1.05
h. Sea state and fouling factor: Use default 1.10 for every speed
i. Ambient condition profile: Use default:
Temperature (°F) Profile
10 25%
59 50%
100 25%
j. No embarked vehicles other than rescue boats

DDS 200-2
APPENDIX D
D-4
D.2.4 Ship state participation table.
For this fictional ship, an examination of the ships requirements and employment strategy identified the
following ship state participation table values:
Inp
ort
– s
ho
re
Un
der
wa
y –
Eco
no
mic
al
Tra
nsi
t
Un
der
wa
y –
Su
rge
to T
hea
ter
Un
der
wa
y –
Mis
sio
n
Maintenance and Modernization 0.9 0.05 0.0 0.05
Predeployment Training 0.6 0.2 0.0 0.2
Deployment 0.1 0.2 0.0 0.7
MCO 0.05 0.15 0.05 0.75
D.2.5 Ship deployment and employment profile.
For this fictional ship, an examination of the ships requirements and employment strategy identified the
following ship deployment and employment profiles. For this particular fictional study with the unusually short
service life, two profiles were deemed sufficient to provide the requisite insight.
Low OPTEMPO
(fraction of time)
High OPTEMPO
(fraction of time)
Year Ma
inte
na
nce
an
d
Mo
der
niz
ati
on
Pre
dep
loy
men
t
Tra
inin
g
Dep
loy
men
t
MC
O
Ma
inte
na
nce
an
d
Mo
der
niz
ati
on
Pre
dep
loy
men
t
Tra
inin
g
Dep
loy
men
t
MC
O
1 0.25 0.25 0.5 0.0 0.25 0.25 0.5 0.0
2 0.25 0.25 0.5 0.0 0.25 0.25 0.5 0.0
3 0.25 0.25 0.5 0.0 0.25 0.25 0.5 0.0
4 0.25 0.25 0.5 0.0 0.25 0.25 0.5 0.0
5 0.25 0.25 0.5 0.0 0.25 0.25 0.5 0.0
6 0.25 0.25 0.5 0.0 0.25 0.25 0.5 0.0
7 0.25 0.25 0.5 0.0 0.25 0.25 0.5 0.0
8 1.0 0.0 0.0 0.0 1.0 0.0 0.0 0.0
9 0.25 0.25 0.5 0.0 0.25 0.25 0.5 0.0
10 0.25 0.25 0.5 0.0 0.25 0.25 0.5 0.0
11 0.25 0.25 0.5 0.0 0.16 0.17 0.0 0.67
12 0.25 0.25 0.5 0.0 0.16 0.17 0.0 0.67
13 0.25 0.25 0.5 0.0 0.16 0.17 0.0 0.67
14 0.25 0.25 0.5 0.0 0.25 0.25 0.5 0.0
15 0.25 0.25 0.5 0.0 0.25 0.25 0.5 0.0

DDS 200-2
APPENDIX D
D-5
Applying these fractions to 8766 hours per year (365.25 days):
Low OPTEMPO (hours) High OPTEMPO (hours)
Year Ma
inte
na
nce
an
d
Mo
der
niz
ati
on
Pre
dep
loy
men
t
Tra
inin
g
Dep
loy
men
t
MC
O
Ma
inte
na
nce
an
d
Mo
der
niz
ati
on
Pre
dep
loy
men
t
Tra
inin
g
Dep
loy
men
t
MC
O
1 2191.5 2191.5 4383 0.0 2191.5 2191.5 4383 0.0
2 2191.5 2191.5 4383 0.0 2191.5 2191.5 4383 0.0
3 2191.5 2191.5 4383 0.0 2191.5 2191.5 4383 0.0
4 2191.5 2191.5 4383 0.0 2191.5 2191.5 4383 0.0
5 2191.5 2191.5 4383 0.0 2191.5 2191.5 4383 0.0
6 2191.5 2191.5 4383 0.0 2191.5 2191.5 4383 0.0
7 2191.5 2191.5 4383 0.0 2191.5 2191.5 4383 0.0
8 8766 0.0 0.0 0.0 8766 0.0 0.0 0.0
9 2191.5 2191.5 4383 0.0 2191.5 2191.5 4383 0.0
10 2191.5 2191.5 4383 0.0 2191.5 2191.5 4383 0.0
11 2191.5 2191.5 4383 0.0 1402.56 1490.22 0.0 5873.22
12 2191.5 2191.5 4383 0.0 1402.56 1490.22 0.0 5873.22
13 2191.5 2191.5 4383 0.0 1402.56 1490.22 0.0 5873.22
14 2191.5 2191.5 4383 0.0 2191.5 2191.5 4383 0.0
15 2191.5 2191.5 4383 0.0 2191.5 2191.5 4383 0.0
D.3 Annual energy usage.
D.3.1 Fuel consumed by ship.
The calculated ship state fuel rate (kg/h) is calculated for each ship state:
a. Inport – shore
For the inport – shore ship state, no fuel is consumed. All power is provided via shore power.
b. Underway – economical transit
See DDS 200-1, Rev 1, Appendix B, section B.3.a for the details of calculating the calculated ship state
fuel rate for the underway – economical transit condition. These calculations result in a calculated
underway - economical transit fuel rate of 3070 kg/h.
c. Underway – high speed transit
See DDS 200-1, Rev 1, Appendix B, section B.3.b for the details of calculating the calculated ship state
fuel rate for the underway – surge to theater condition. These calculations result in a calculated
underway - surge to theater fuel rate of 12,028 kg/h.

DDS 200-2
APPENDIX D
D-6
d. Underway – mission
See DDS 200-1, Rev 1, Appendix B, section B.3.c for the details of calculating the calculated ship state
fuel rate for the underway – mission condition. These calculations result in a calculated
underway - mission fuel rate of 3150 kg/h.
The calculated operational mode fuel rates are calculated by summing the product of the ship state participation
table elements and the appropriate fuel rate:
In
po
rt -
Sh
ore
Un
der
wa
y -
Eco
no
mic
al
Tra
nsi
t
Un
der
wa
y -
Su
rge
to T
hea
ter
Un
der
wa
y -
Mis
sio
n
Ca
lcu
late
d
Op
era
tio
na
l M
od
e
Fu
el R
ate
(k
g/h
)
Fuel Rate(kg/h) 0 3070 12028 3150
Maintenance and Modernization 90% 5% 0% 5% 311
Predeployment Training 60% 20% 0% 20% 1244
Deployment 10% 20% 0% 70% 2819
MCO 5% 15% 5% 75% 3424
Applying the fuel rates for each operational mode to the ship deployment and employment profile yields the
total fuel consumed each year and the total fuel consumed over the service life.
Low OPTEMPO:
Year
Maintenance and
Modernization
(1000 kg)
Predeployment
Training
(1000 kg)
Deployment
(1000 kg)
MCO
(1000 kg)
Total Fuel
(1000 kg)
1 682 2,726 12,356 0 15,763
2 682 2,726 12,356 0 15,763
3 682 2,726 12,356 0 15,763
4 682 2,726 12,356 0 15,763
5 682 2,726 12,356 0 15,763
6 682 2,726 12,356 0 15,763
7 682 2,726 12,356 0 15,763
8 2,726 0 0 0 2,726
9 682 2,726 12,356 0 15,763
10 682 2,726 12,356 0 15,763
11 682 2,726 12,356 0 15,763
12 682 2,726 12,356 0 15,763
13 682 2,726 12,356 0 15,763
14 682 2,726 12,356 0 15,763
15 682 2,726 12,356 0 15,763
Lifetime Fuel
(1000 kg) 223,415
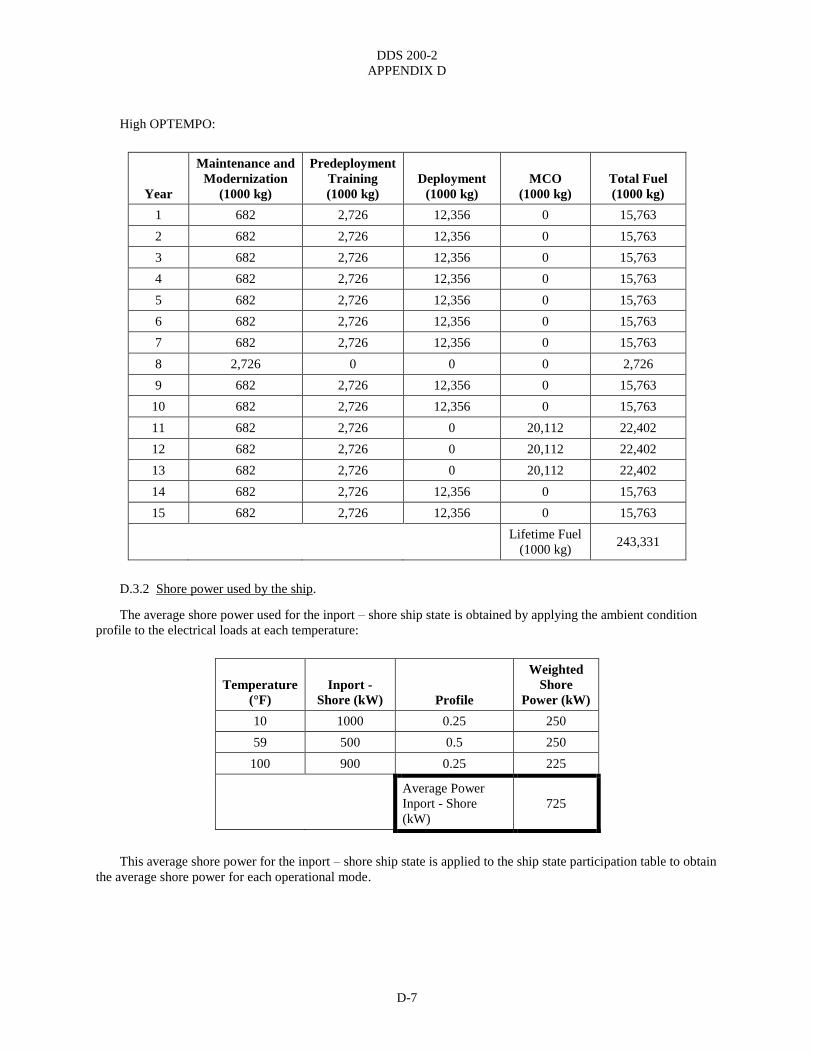
DDS 200-2
APPENDIX D
D-7
High OPTEMPO:
Year
Maintenance and
Modernization
(1000 kg)
Predeployment
Training
(1000 kg)
Deployment
(1000 kg)
MCO
(1000 kg)
Total Fuel
(1000 kg)
1 682 2,726 12,356 0 15,763
2 682 2,726 12,356 0 15,763
3 682 2,726 12,356 0 15,763
4 682 2,726 12,356 0 15,763
5 682 2,726 12,356 0 15,763
6 682 2,726 12,356 0 15,763
7 682 2,726 12,356 0 15,763
8 2,726 0 0 0 2,726
9 682 2,726 12,356 0 15,763
10 682 2,726 12,356 0 15,763
11 682 2,726 0 20,112 22,402
12 682 2,726 0 20,112 22,402
13 682 2,726 0 20,112 22,402
14 682 2,726 12,356 0 15,763
15 682 2,726 12,356 0 15,763
Lifetime Fuel
(1000 kg) 243,331
D.3.2 Shore power used by the ship.
The average shore power used for the inport – shore ship state is obtained by applying the ambient condition
profile to the electrical loads at each temperature:
Temperature
(°F)
Inport -
Shore (kW) Profile
Weighted
Shore
Power (kW)
10 1000 0.25 250
59 500 0.5 250
100 900 0.25 225
Average Power
Inport - Shore
(kW)
725
This average shore power for the inport – shore ship state is applied to the ship state participation table to obtain
the average shore power for each operational mode.

DDS 200-2
APPENDIX D
D-8
Inp
ort
- S
ho
re
Un
der
wa
y -
Eco
no
mic
al
Tra
nsi
t
Un
der
wa
y -
Su
rge
to
Th
eate
r
Un
der
wa
y -
Mis
sio
n
Av
era
ge
Sh
ore
Po
wer
(kW
)
Shore Power(Kw) 725 0 0 0
Maintenance and Modernization 90% 5% 0% 5% 653
Predeployment Training 60% 20% 0% 20% 435
Deployment 10% 20% 0% 70% 73
MCO 5% 15% 5% 75% 36
Applying the average shore power for each operational mode to the ship deployment and employment profile
yields the total shore power (kW-h) consumed each year and the total shore power (kW-h) consumed over the
service life.
Low OPTEMPO:
Year
Maintenance and
Modernization
(1000 kW-h)
Predeployment
Training
(1000 kW-h)
Deployment
(1000 kW-h)
MCO
(1000 kW-h)
Total Shore Power
(1000 kW-h)
1 1,430 953 318 0 2,701
2 1,430 953 318 0 2,701
3 1,430 953 318 0 2,701
4 1,430 953 318 0 2,701
5 1,430 953 318 0 2,701
6 1,430 953 318 0 2,701
7 1,430 953 318 0 2,701
8 5,720 0 0 0 5,720
9 1,430 953 318 0 2,701
10 1,430 953 318 0 2,701
11 1,430 953 318 0 2,701
12 1,430 953 318 0 2,701
13 1,430 953 318 0 2,701
14 1,430 953 318 0 2,701
15 1,430 953 318 0 2,701
Lifetime Shore
Power
(1000 kW-h)
43,534

DDS 200-2
APPENDIX D
D-9
High OPTEMPO:
Year
Maintenance and
Modernization
(1000 kW-h)
Predeployment
Training
(1000 kW-h)
Deployment
(1000 kW-h)
MCO
(1000 kW-h)
Total Shore Power
(1000 kW-h)
1 1,430 953 318 0 2,701
2 1,430 953 318 0 2,701
3 1,430 953 318 0 2,701
4 1,430 953 318 0 2,701
5 1,430 953 318 0 2,701
6 1,430 953 318 0 2,701
7 1,430 953 318 0 2,701
8 5,720 0 0 0 5,720
9 1,430 953 318 0 2,701
10 1,430 953 318 0 2,701
11 915 648 0 213 1,776
12 915 648 0 213 1,776
13 915 648 0 213 1,776
14 1,430 953 318 0 2,701
15 1,430 953 318 0 2,701
Lifetime Shore
Power
(1000 kW-h)
40,760
D.3.3 Fuel consumed by embarked vehicles.
For this example, the fuel consumed by the rescue boats is considered negligible.
D.4 FBCE.
D.4.1 Fully burdened cost of fuel.
Estimated DLA Energy price:
The crude oil price used for this example is the reference case for imported low sulfur light crude oil as
projected by the AEO 2011 in FY09 dollars as shown in Figure D-1. A complete analysis would repeat the
calculations using the high oil price and low oil price to gain an understanding of the impact of the expected
variance in fuel costs. Alternately, a study could use a stochastic model that considered the AEO projected D.4.1
high and low prices.

DDS 200-2
APPENDIX D
D-10
Figure D-1. AEO 2011 Projected Average Annual World Oil Prices (2009 Dollars Per Barrel).
The Refined Product element is estimated as 30 percent of the crude oil price. The storage, transport, and
management is from Table 6-1 (FY11 dollars).
Year
Crude Oil
Price
($/bbl)
Refined
Product
($/bbl)
Adjustments
($/bbl)
Storage
Transport, &
Management
($/bbl)
Estimated
DLA Energy
Price
$/bbl
2015 $94.58 $28.37 $0.00 $14.60 $137.55
2016 $97.28 $29.19 $0.00 $14.60 $141.07
2017 $99.99 $30.00 $0.00 $14.60 $144.58
2018 $102.69 $30.81 $0.00 $14.60 $148.10
2019 $105.40 $31.62 $0.00 $14.60 $151.61
2020 $108.10 $32.43 $0.00 $14.60 $155.13
2021 $109.99 $33.00 $0.00 $14.60 $157.58
2022 $111.88 $33.56 $0.00 $14.60 $160.04
2023 $113.76 $34.13 $0.00 $14.60 $162.49
2024 $115.65 $34.70 $0.00 $14.60 $164.95
2025 $117.54 $35.26 $0.00 $14.60 $167.40
2026 $118.65 $35.60 $0.00 $14.60 $168.85
2027 $119.76 $35.93 $0.00 $14.60 $170.29
2028 $120.87 $36.26 $0.00 $14.60 $171.73
2029 $121.98 $36.59 $0.00 $14.60 $173.17
Burden estimates:
Storage and Handling: $0.05 per barrel (FY11) (see Table A-3).
Fuel Delivery Ship Acquisition/Depreciation: $11.67 (FY11) (see Table A-3).
Fuel Delivery Ship O&S: $30.34 (FY11) (see Table A-3).

DDS 200-2
APPENDIX D
D-11
Environmental: $4.20 (see Table A-3).
Year
DLA
Energy
Estimate
($/bbl)
Storage
and
Handling
($/bbl)
Depreciation
($/bbl)
Fuel
Delivery
($/bbl)
Environmental
($/bbl)
Other
($/bbl)
Fully
Burdened
Price
($/bbl)
Fully
Burdened
Price
($/kg)
2015 $137.55 $0.05 $11.67 $30.34 $4.20 $0.00 $183.81 $1.37
2016 $141.07 $0.05 $11.67 $30.34 $4.20 $0.00 $187.33 $1.40
2017 $144.58 $0.05 $11.67 $30.34 $4.20 $0.00 $190.84 $1.42
2018 $148.10 $0.05 $11.67 $30.34 $4.20 $0.00 $194.36 $1.45
2019 $151.61 $0.05 $11.67 $30.34 $4.20 $0.00 $197.87 $1.48
2020 $155.13 $0.05 $11.67 $30.34 $4.20 $0.00 $201.39 $1.50
2021 $157.58 $0.05 $11.67 $30.34 $4.20 $0.00 $203.84 $1.52
2022 $160.04 $0.05 $11.67 $30.34 $4.20 $0.00 $206.30 $1.54
2023 $162.49 $0.05 $11.67 $30.34 $4.20 $0.00 $208.75 $1.56
2024 $164.95 $0.05 $11.67 $30.34 $4.20 $0.00 $211.21 $1.58
2025 $167.40 $0.05 $11.67 $30.34 $4.20 $0.00 $213.66 $1.59
2026 $168.85 $0.05 $11.67 $30.34 $4.20 $0.00 $215.11 $1.61
2027 $170.29 $0.05 $11.67 $30.34 $4.20 $0.00 $216.55 $1.62
2028 $171.73 $0.05 $11.67 $30.34 $4.20 $0.00 $217.99 $1.63
2029 $173.17 $0.05 $11.67 $30.34 $4.20 $0.00 $219.43 $1.64
Note: Assume 134 kg/bbl.
D.4.2 Fully burdened cost of shore power.
Assume a constant price for shore power of $.089 (FY09) per kW-h as projected by the AEO. Escalated to
FY11, this equals $0.095 per kW-h.
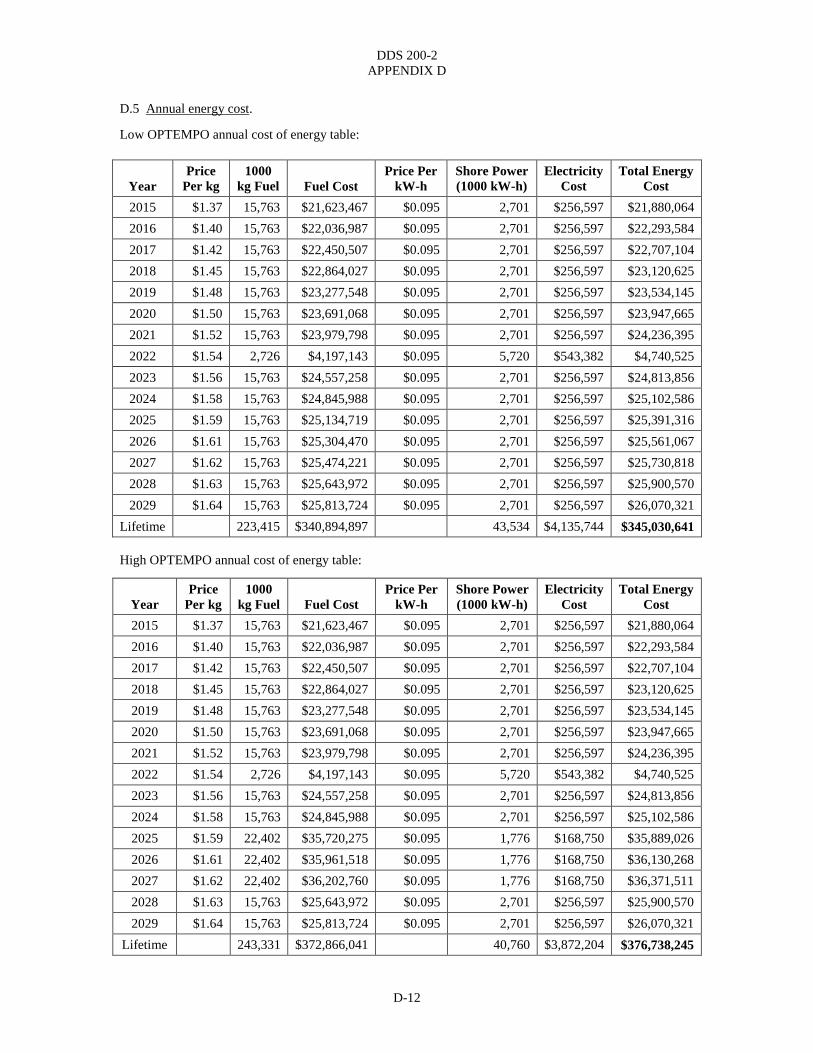
DDS 200-2
APPENDIX D
D-12
D.5 Annual energy cost.
Low OPTEMPO annual cost of energy table:
Year
Price
Per kg
1000
kg Fuel Fuel Cost
Price Per
kW-h
Shore Power
(1000 kW-h)
Electricity
Cost
Total Energy
Cost
2015 $1.37 15,763 $21,623,467 $0.095 2,701 $256,597 $21,880,064
2016 $1.40 15,763 $22,036,987 $0.095 2,701 $256,597 $22,293,584
2017 $1.42 15,763 $22,450,507 $0.095 2,701 $256,597 $22,707,104
2018 $1.45 15,763 $22,864,027 $0.095 2,701 $256,597 $23,120,625
2019 $1.48 15,763 $23,277,548 $0.095 2,701 $256,597 $23,534,145
2020 $1.50 15,763 $23,691,068 $0.095 2,701 $256,597 $23,947,665
2021 $1.52 15,763 $23,979,798 $0.095 2,701 $256,597 $24,236,395
2022 $1.54 2,726 $4,197,143 $0.095 5,720 $543,382 $4,740,525
2023 $1.56 15,763 $24,557,258 $0.095 2,701 $256,597 $24,813,856
2024 $1.58 15,763 $24,845,988 $0.095 2,701 $256,597 $25,102,586
2025 $1.59 15,763 $25,134,719 $0.095 2,701 $256,597 $25,391,316
2026 $1.61 15,763 $25,304,470 $0.095 2,701 $256,597 $25,561,067
2027 $1.62 15,763 $25,474,221 $0.095 2,701 $256,597 $25,730,818
2028 $1.63 15,763 $25,643,972 $0.095 2,701 $256,597 $25,900,570
2029 $1.64 15,763 $25,813,724 $0.095 2,701 $256,597 $26,070,321
Lifetime
223,415 $340,894,897
43,534 $4,135,744 $345,030,641
High OPTEMPO annual cost of energy table:
Year
Price
Per kg
1000
kg Fuel Fuel Cost
Price Per
kW-h
Shore Power
(1000 kW-h)
Electricity
Cost
Total Energy
Cost
2015 $1.37 15,763 $21,623,467 $0.095 2,701 $256,597 $21,880,064
2016 $1.40 15,763 $22,036,987 $0.095 2,701 $256,597 $22,293,584
2017 $1.42 15,763 $22,450,507 $0.095 2,701 $256,597 $22,707,104
2018 $1.45 15,763 $22,864,027 $0.095 2,701 $256,597 $23,120,625
2019 $1.48 15,763 $23,277,548 $0.095 2,701 $256,597 $23,534,145
2020 $1.50 15,763 $23,691,068 $0.095 2,701 $256,597 $23,947,665
2021 $1.52 15,763 $23,979,798 $0.095 2,701 $256,597 $24,236,395
2022 $1.54 2,726 $4,197,143 $0.095 5,720 $543,382 $4,740,525
2023 $1.56 15,763 $24,557,258 $0.095 2,701 $256,597 $24,813,856
2024 $1.58 15,763 $24,845,988 $0.095 2,701 $256,597 $25,102,586
2025 $1.59 22,402 $35,720,275 $0.095 1,776 $168,750 $35,889,026
2026 $1.61 22,402 $35,961,518 $0.095 1,776 $168,750 $36,130,268
2027 $1.62 22,402 $36,202,760 $0.095 1,776 $168,750 $36,371,511
2028 $1.63 15,763 $25,643,972 $0.095 2,701 $256,597 $25,900,570
2029 $1.64 15,763 $25,813,724 $0.095 2,701 $256,597 $26,070,321
Lifetime
243,331 $372,866,041
40,760 $3,872,204 $376,738,245

DDS 200-2
APPENDIX D
D-13
The lifecycle cost of energy for the Low OPTEMPO case is $345M.
The lifecycle cost of energy for the High OPTEMPO case is $377M.
The average annual energy cost for the Low OPTEMPO case is $23M.
The average annual energy cost for the High OPTEMPO case is $25M.