calculation of wen & wes and total … · individual companies total westar westar north (wen)...
TRANSCRIPT
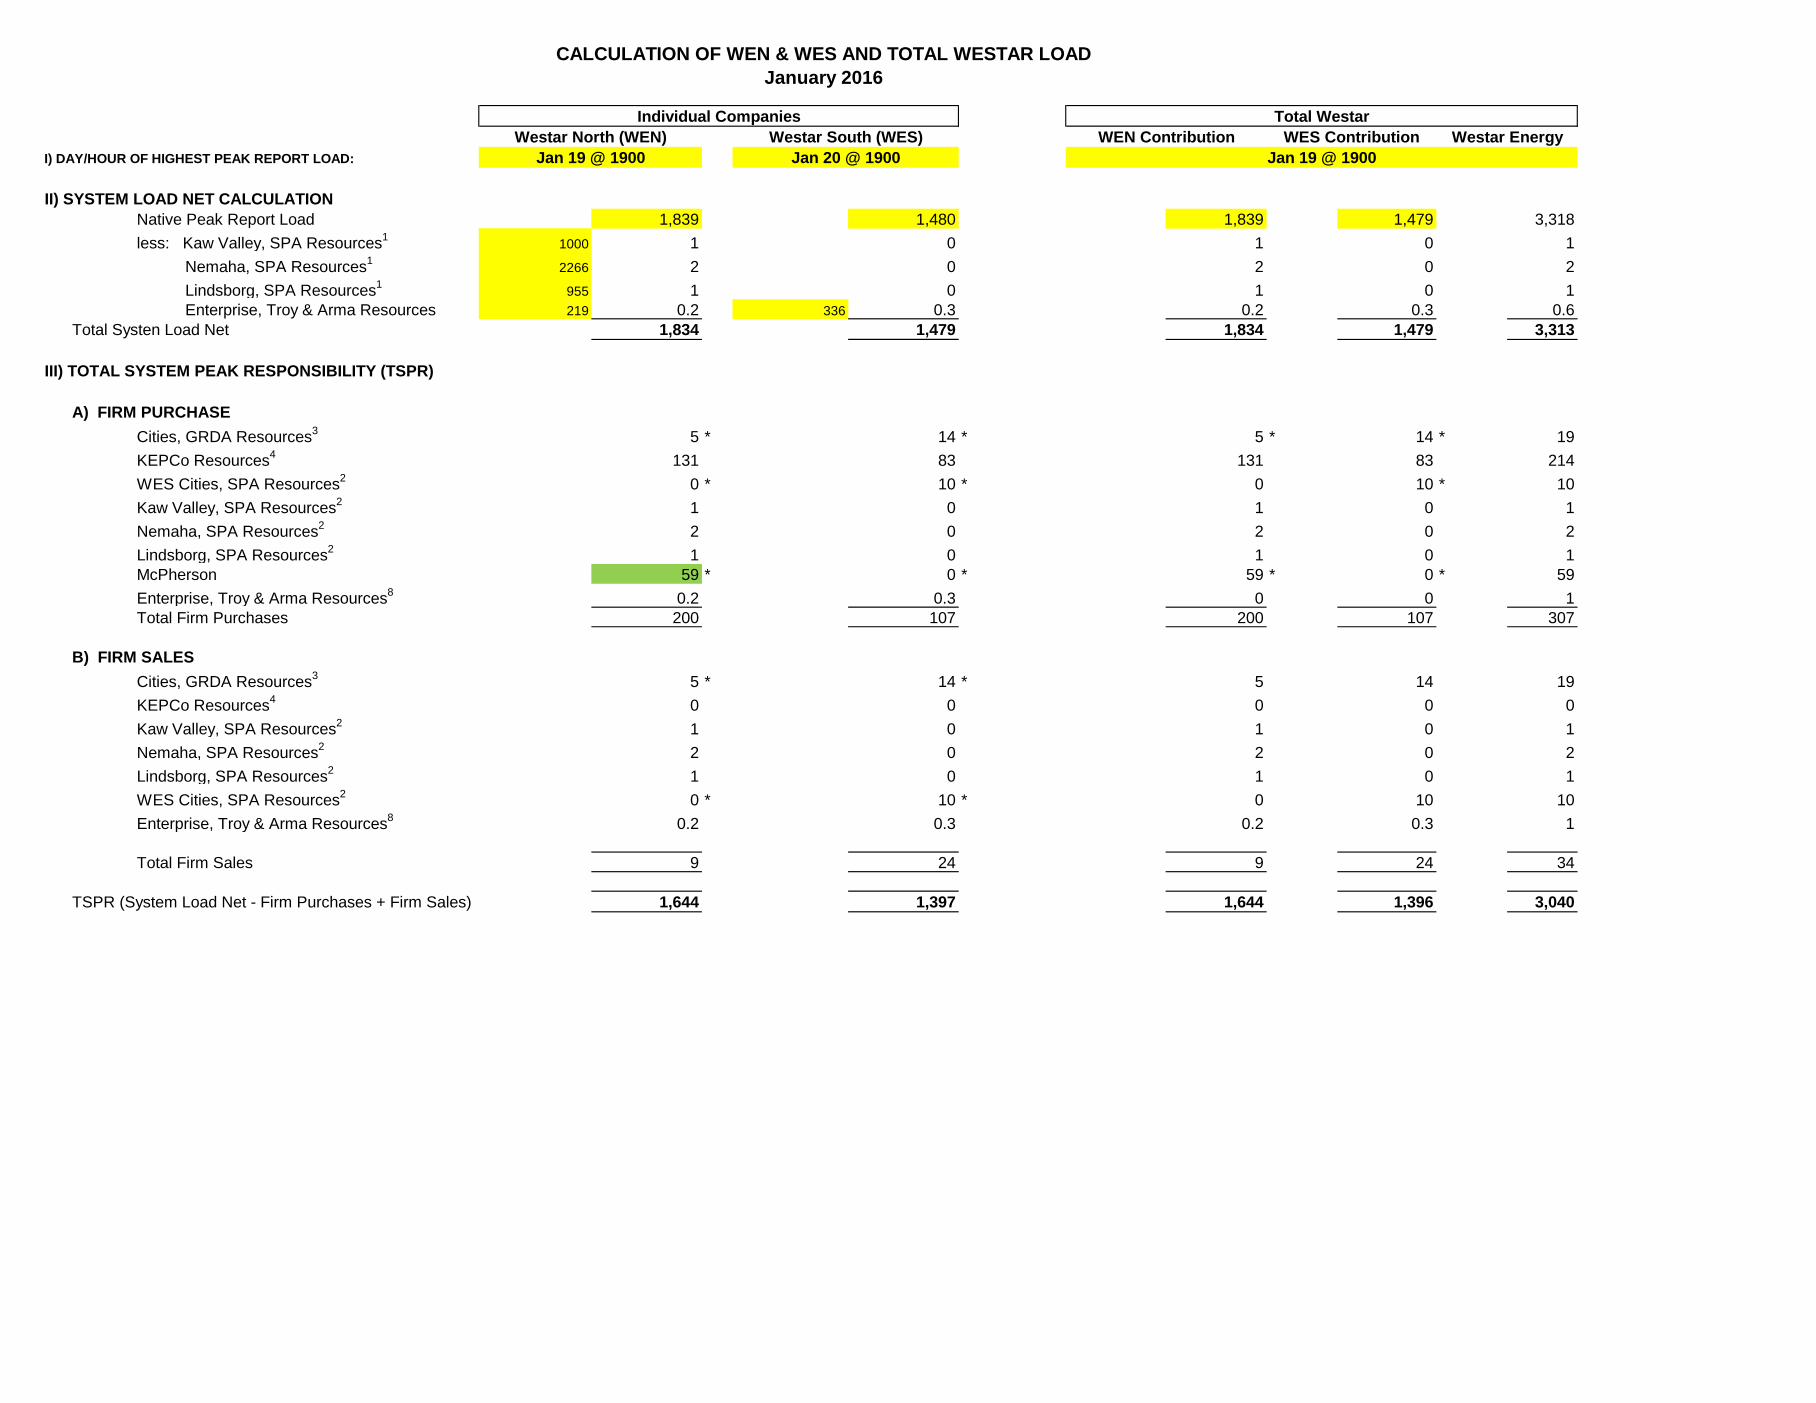
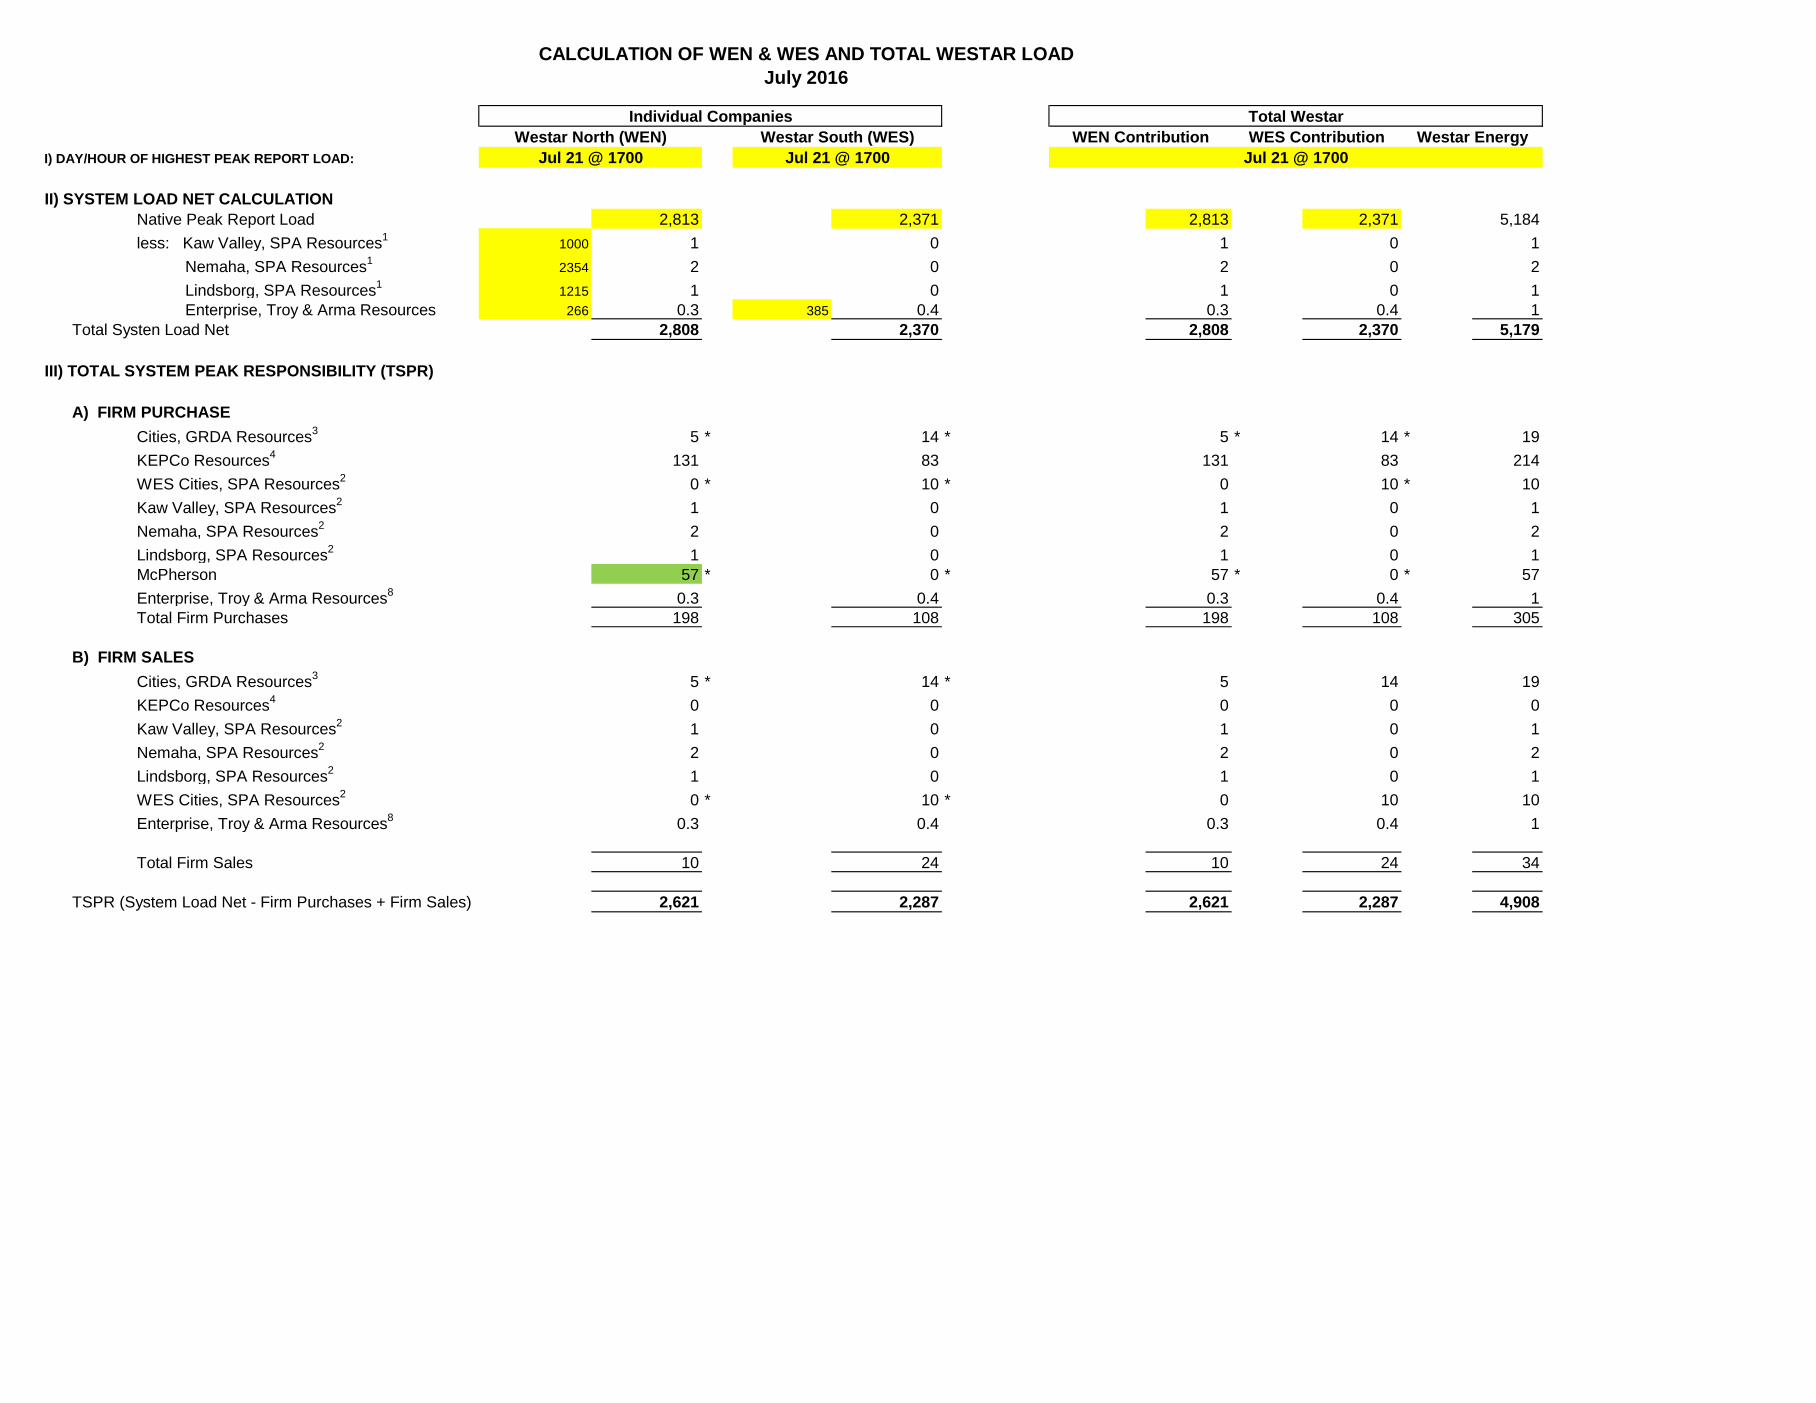
I) DAY/HOUR OF HIGHEST PEAK REPORT LOAD:
II) SYSTEM LOAD NET CALCULATIONNative Peak Report Load 1,839 1,480 1,839 1,479 3,318less: Kaw Valley, SPA Resources1 1000 1 0 1 0 1 Nemaha, SPA Resources1 2266 2 0 2 0 2 Lindsborg, SPA Resources1 955 1 0 1 0 1 Enterprise, Troy & Arma Resources 219 0.2 336 0.3 0.2 0.3 0.6
Total Systen Load Net 1,834 1,479 1,834 1,479 3,313
III) TOTAL SYSTEM PEAK RESPONSIBILITY (TSPR)
A) FIRM PURCHASECities, GRDA Resources3 5 * 14 * 5 * 14 * 19KEPCo Resources4 131 83 131 83 214WES Cities, SPA Resources2 0 * 10 * 0 10 * 10Kaw Valley, SPA Resources2 1 0 1 0 1Nemaha, SPA Resources2 2 0 2 0 2Lindsborg, SPA Resources2 1 0 1 0 1McPherson 59 * 0 * 59 * 0 * 59Enterprise, Troy & Arma Resources8 0.2 0.3 0 0 1Total Firm Purchases 200 107 200 107 307
B) FIRM SALESCities, GRDA Resources3 5 * 14 * 5 14 19KEPCo Resources4 0 0 0 0 0Kaw Valley, SPA Resources2 1 0 1 0 1Nemaha, SPA Resources2 2 0 2 0 2Lindsborg, SPA Resources2 1 0 1 0 1WES Cities, SPA Resources2 0 * 10 * 0 10 10Enterprise, Troy & Arma Resources8 0.2 0.3 0.2 0.3 1
Total Firm Sales 9 24 9 24 34
TSPR (System Load Net - Firm Purchases + Firm Sales) 1,644 1,397 1,644 1,396 3,040
Jan 19 @ 1900 Jan 20 @ 1900 Jan 19 @ 1900
CALCULATION OF WEN & WES AND TOTAL WESTAR LOADJanuary 2016
Individual Companies Total WestarWestar North (WEN) Westar South (WES) WEN Contribution WES Contribution Westar Energy
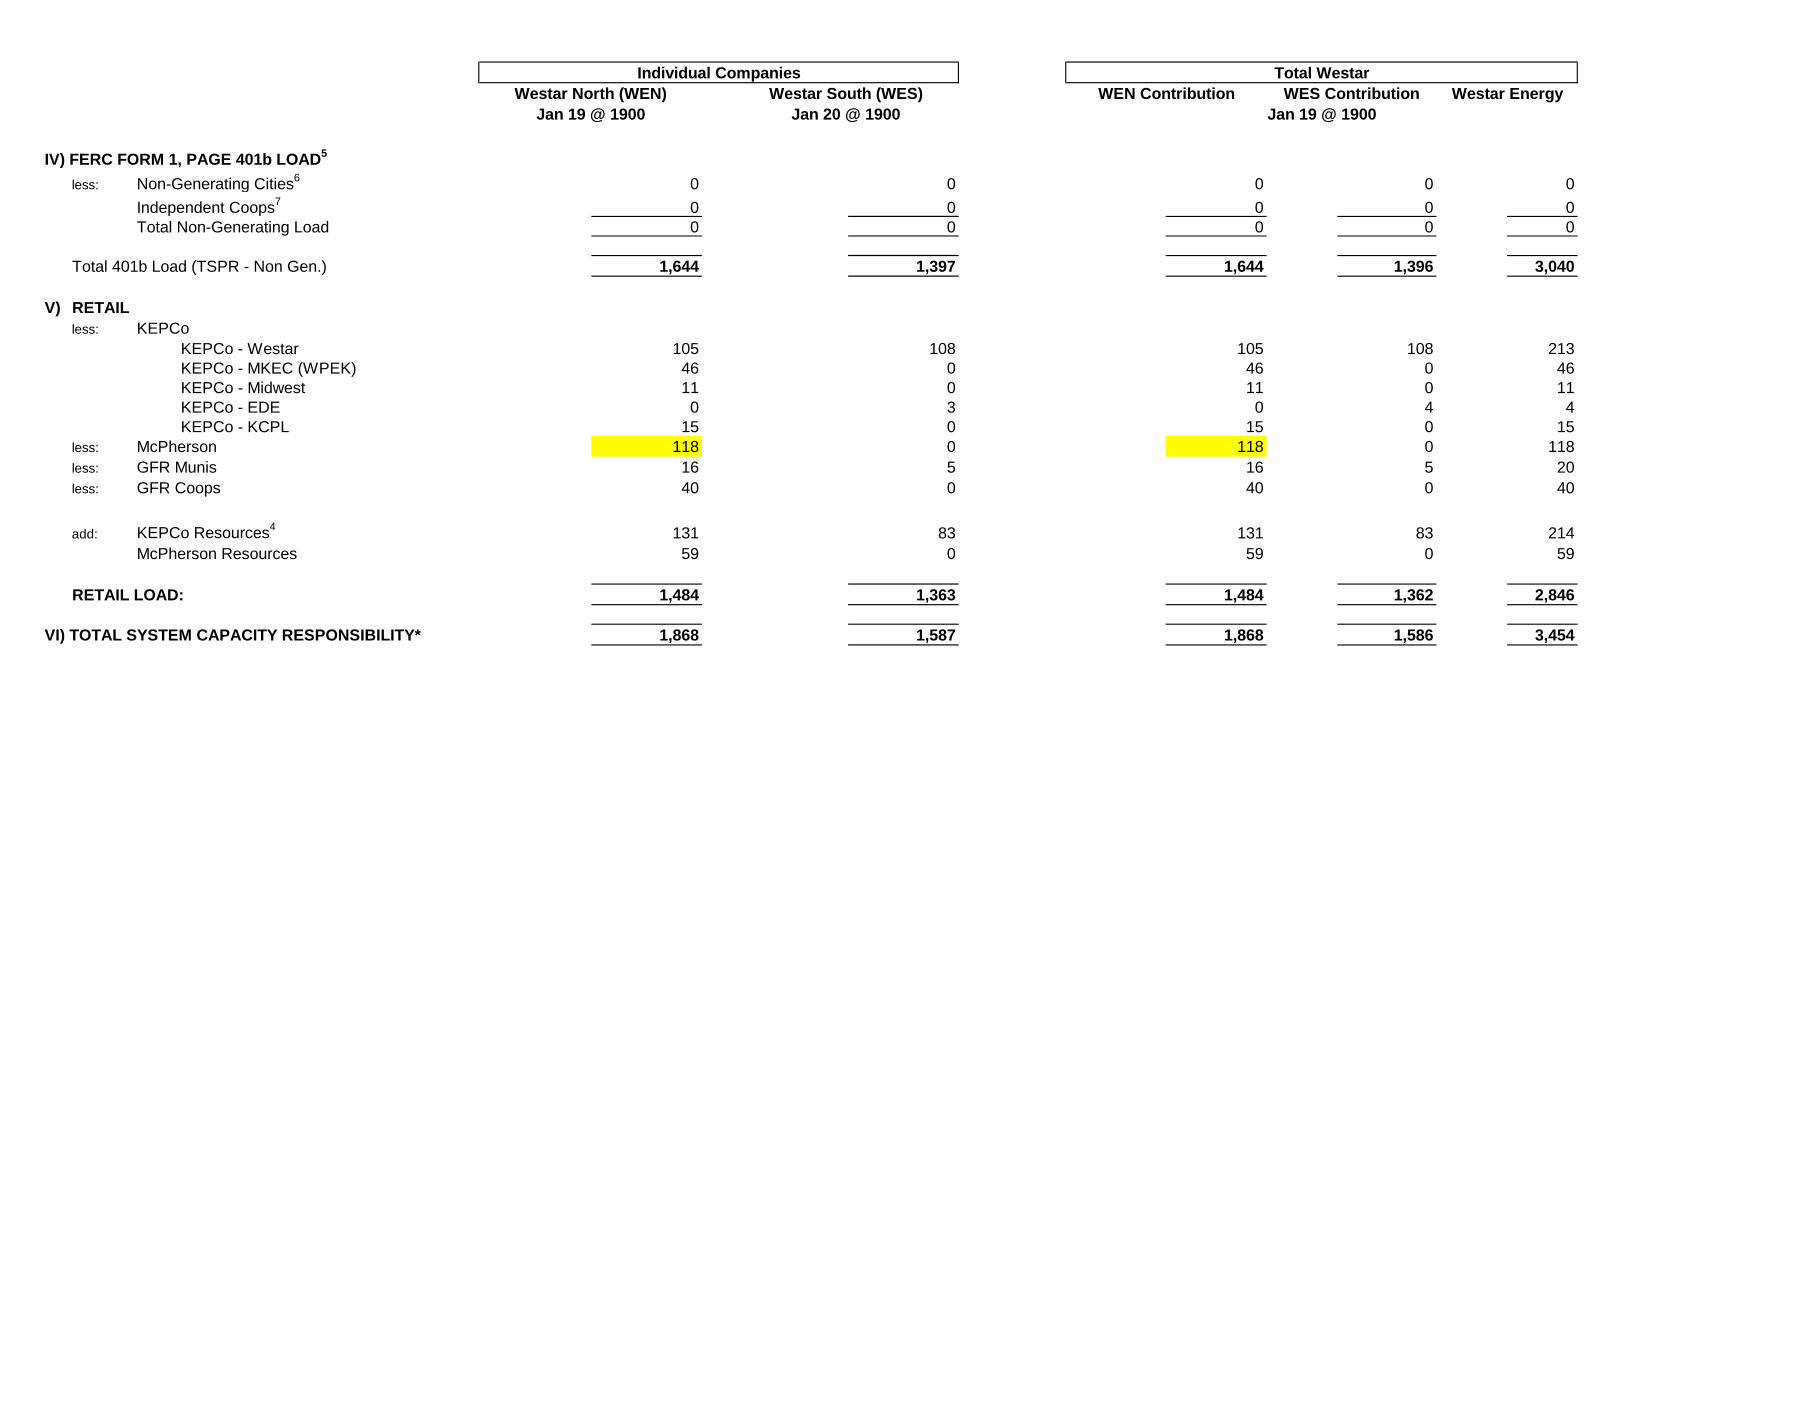
IV) FERC FORM 1, PAGE 401b LOAD5
less: Non-Generating Cities6 0 0 0 0 0Independent Coops7 0 0 0 0 0Total Non-Generating Load 0 0 0 0 0
Total 401b Load (TSPR - Non Gen.) 1,644 1,397 1,644 1,396 3,040
V) RETAILless: KEPCo
KEPCo - Westar 105 108 105 108 213 KEPCo - MKEC (WPEK) 46 0 46 0 46 KEPCo - Midwest 11 0 11 0 11 KEPCo - EDE 0 3 0 4 4 KEPCo - KCPL 15 0 15 0 15
less: McPherson 118 0 118 0 118less: GFR Munis 16 5 16 5 20less: GFR Coops 40 0 40 0 40
add: KEPCo Resources4 131 83 131 83 214McPherson Resources 59 0 59 0 59
RETAIL LOAD: 1,484 1,363 1,484 1,362 2,846
VI) TOTAL SYSTEM CAPACITY RESPONSIBILITY* 1,868 1,587 1,868 1,586 3,454
Jan 19 @ 1900 Jan 20 @ 1900 Jan 19 @ 1900
Individual Companies Total WestarWestar North (WEN) Westar South (WES) WEN Contribution WES Contribution Westar Energy

VII) NOTES:* The SPP Criteria document, Section 2.1.9, references the minimum capacity margin, which is currently 12%. SPP member companies would have to approve any change to this amount. 2 SPA resources include capacity and firm energy from the Southwestern Power Administration.contract 3 GRDA resources include capacity and firm energy from the Grand River Dam Authority.4 KEPCo resources includes WCGS (Wolf Creek Generation Services), SPA (Southwestern Power Admin), Sharpe Generation, WAPA (Western Area Power Administration). They are listed on KEPCo's monthly bill.
Allocation of KEPCo Resources Maximum Proration Proration Effective March 2014, allocation of KEPCo's resources has been changed to a) KEPCo's Resources Capacity (kW) North South allow 100% of their resources to be allocated based on the load share WCGS 70,000 shown in cells M57:M61 for WEN and O57:O61 for WES. This is due to changes SPA - Firm 100,000 resulting from the new SPP market. Sharpe generation is not included. Sharpe Generation 0 Discussed with Julie Lux, Chris O'Neill, and Bill Birnel WAPA 12,000 Iatan II 32,000 Total 214,000 131,317 82,683
North Peak South Peak WR Peak WR Peak Demand North Peak South Peak WR Peak WR PeakMetered Metered North South Loss Factors Loss Adjusted Loss Adjusted Loss AdjustedLoss AdjustedJan 19 @ 1900 Jan 20 @ 1900 Jan 19 @ 1900 Jan 19 @ 1900 (From Bills) Jan 19 @ 1900 Jan 20 @ 1900 Jan 19 @ 1900 Jan 19 @ 1900
KEPCo - MKEC (WPEK) 46 0 46 0 1.0632 49.4100 0.0000 49.4100 0.0000 KEPCo - Midwest 11 0 11 0 1.0426 11.0816 0.0000 11.0816 0.0000 KEPCo - EDE 0 3 0 4 0.0000 0.0000 3.4591 0.0000 3.5065 KEPCo - KCPL 15 0 15 0 0.0000 15.1612 0.0000 15.1612 0.0000
75.6528 3.4591 75.6528 3.5065
KEPCo - Westar -- Calculate loss Adjustments for KEPCo-Westar North and South. These values are used in the GFR Calculation on Worksheet D only. Enter only the values shown in yellow.O1 30.9563 19.4209 30.9563 19.5561 1.0307 31.9067 20.0171 31.9067 20.1565O10 -0.0786 0 -0.0786 0 1.0954 -0.0861 0.0000 -0.0861 0.0000O11 -0.6488 0 -0.6488 0 1.085 -0.7039 0.0000 -0.7039 0.0000O2 41.2129 70.3724 41.2129 70.378 1.0374 42.7543 73.0043 42.7543 73.0101O4 33.2606 15.6681 33.2606 15.4477 1.0534 35.0367 16.5048 35.0367 16.2726O5 0 2.1524 0 2.0941 1.061 0.0000 2.2837 0.0000 2.2218O6 0 0 0 0 1.0611 0.0000 0.0000 0.0000 0.0000O8 0.0101 0.4109 0.0101 0.4335 1.0803 0.0109 0.4439 0.0109 0.4683O9 -0.0222 0 -0.0222 0 1.0892 -0.0242 0.0000 -0.0242 0.0000Blank -0.001 0 -0.001 0 1 -0.0010 0.0000 -0.0010 0.0000
KEPCo - Westar 104.6893 108.0247 104.6893 107.9094 108.8933 112.2538 108.8933 112.1294
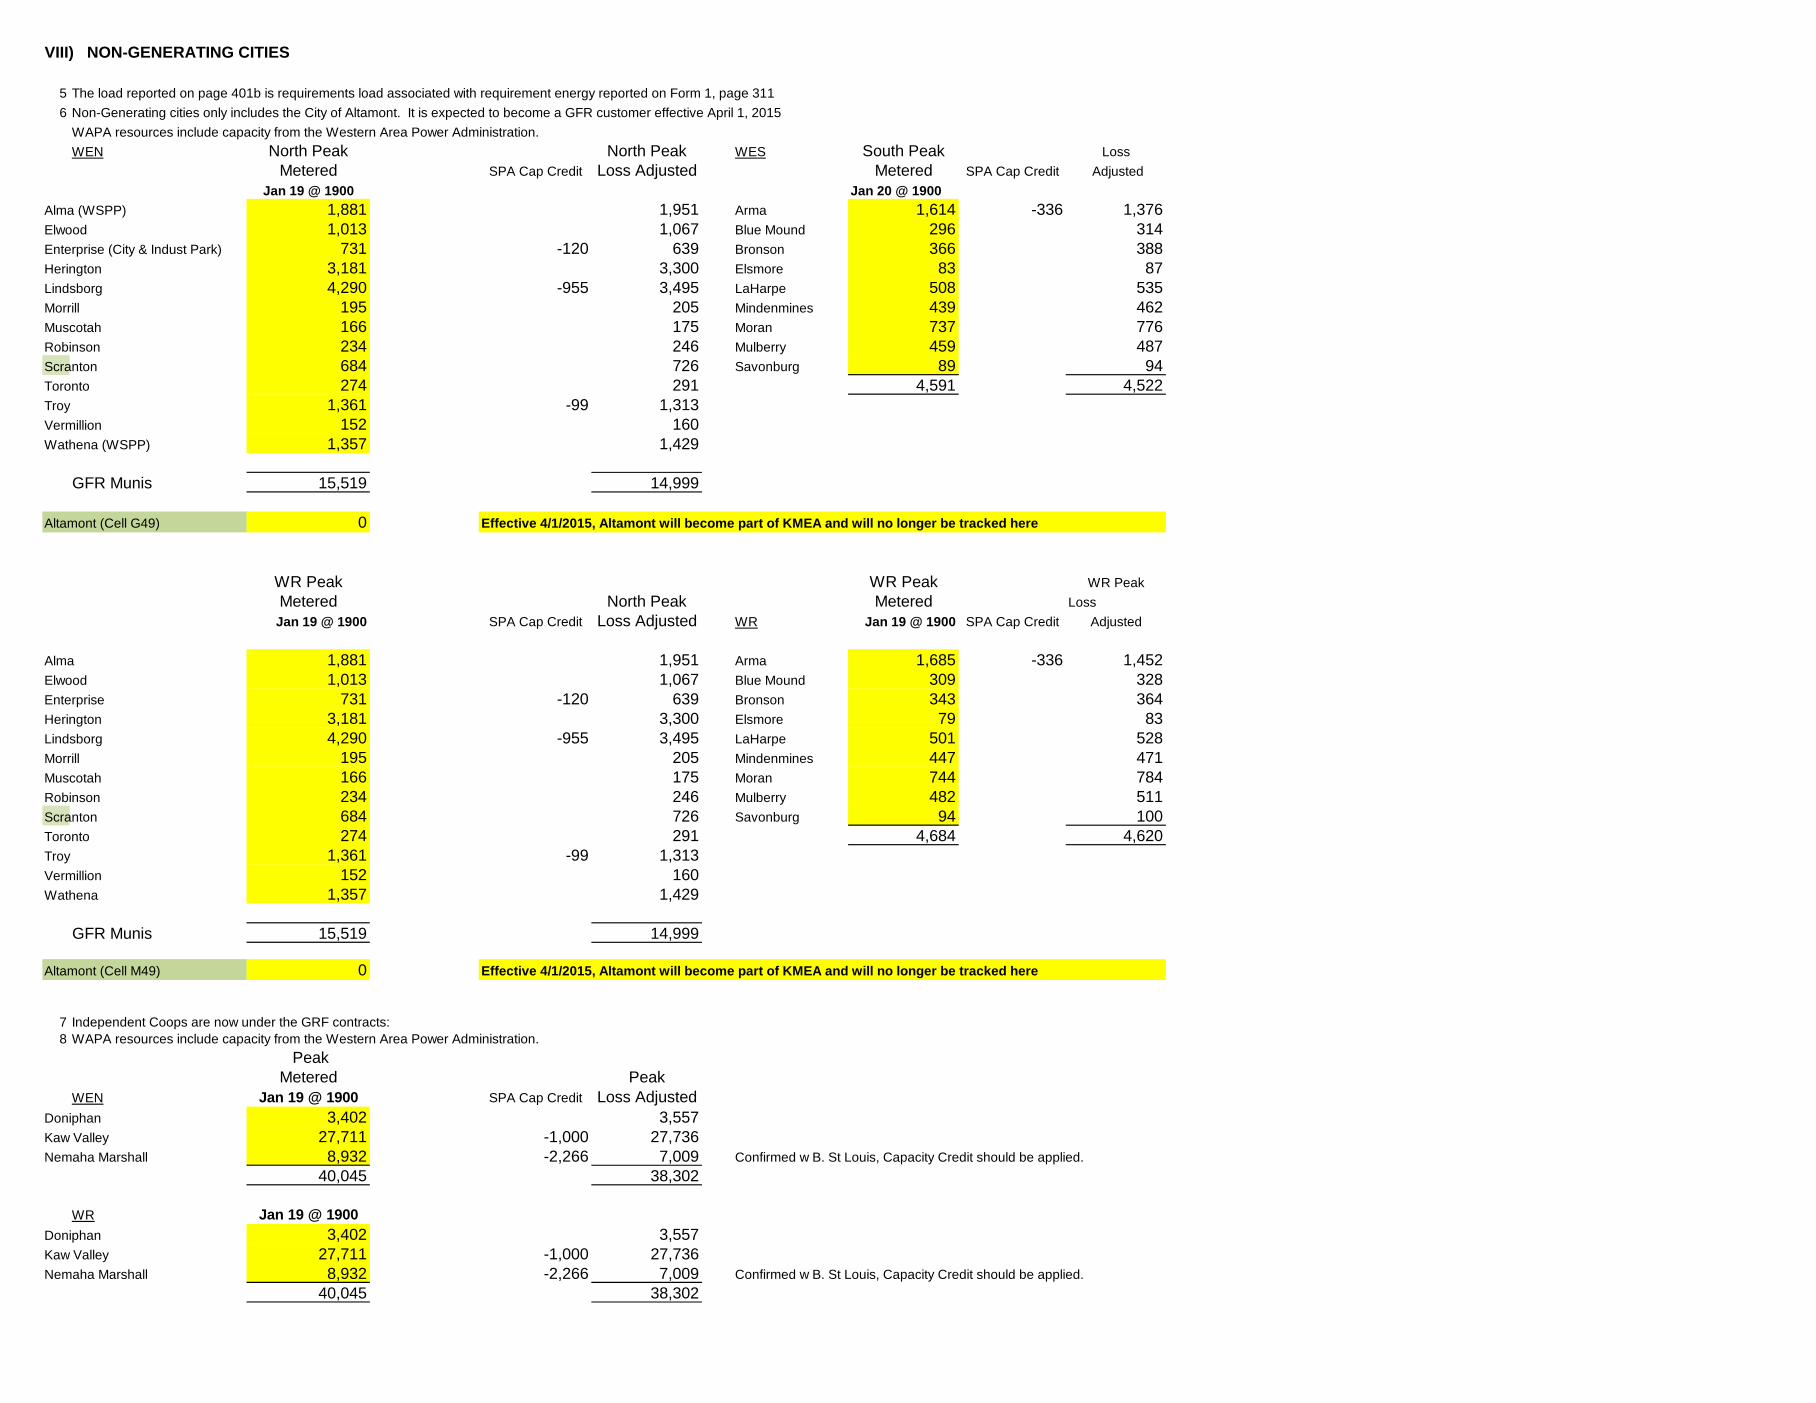
VIII) NON-GENERATING CITIES
5 The load reported on page 401b is requirements load associated with requirement energy reported on Form 1, page 311 6 Non-Generating cities only includes the City of Altamont. It is expected to become a GFR customer effective April 1, 2015
WAPA resources include capacity from the Western Area Power Administration.WEN North Peak North Peak WES South Peak Loss
Metered SPA Cap Credit Loss Adjusted Metered SPA Cap Credit AdjustedJan 19 @ 1900 Jan 20 @ 1900
Alma (WSPP) 1,881 1,951 Arma 1,614 -336 1,376Elwood 1,013 1,067 Blue Mound 296 314Enterprise (City & Indust Park) 731 -120 639 Bronson 366 388Herington 3,181 3,300 Elsmore 83 87Lindsborg 4,290 -955 3,495 LaHarpe 508 535Morrill 195 205 Mindenmines 439 462Muscotah 166 175 Moran 737 776Robinson 234 246 Mulberry 459 487Scranton 684 726 Savonburg 89 94Toronto 274 291 4,591 4,522Troy 1,361 -99 1,313Vermillion 152 160Wathena (WSPP) 1,357 1,429
GFR Munis 15,519 14,999
Altamont (Cell G49) 0 Effective 4/1/2015, Altamont will become part of KMEA and will no longer be tracked here
WR Peak WR Peak WR PeakMetered North Peak Metered Loss Jan 19 @ 1900 SPA Cap Credit Loss Adjusted WR Jan 19 @ 1900 SPA Cap Credit Adjusted
Alma 1,881 1,951 Arma 1,685 -336 1,452Elwood 1,013 1,067 Blue Mound 309 328Enterprise 731 -120 639 Bronson 343 364Herington 3,181 3,300 Elsmore 79 83Lindsborg 4,290 -955 3,495 LaHarpe 501 528Morrill 195 205 Mindenmines 447 471Muscotah 166 175 Moran 744 784Robinson 234 246 Mulberry 482 511Scranton 684 726 Savonburg 94 100Toronto 274 291 4,684 4,620Troy 1,361 -99 1,313Vermillion 152 160Wathena 1,357 1,429
GFR Munis 15,519 14,999
Altamont (Cell M49) 0 Effective 4/1/2015, Altamont will become part of KMEA and will no longer be tracked here
7 Independent Coops are now under the GRF contracts:8 WAPA resources include capacity from the Western Area Power Administration.
PeakMetered Peak
WEN Jan 19 @ 1900 SPA Cap Credit Loss AdjustedDoniphan 3,402 3,557Kaw Valley 27,711 -1,000 27,736Nemaha Marshall 8,932 -2,266 7,009 Confirmed w B. St Louis, Capacity Credit should be applied.
40,045 38,302
WR Jan 19 @ 1900Doniphan 3,402 3,557Kaw Valley 27,711 -1,000 27,736Nemaha Marshall 8,932 -2,266 7,009 Confirmed w B. St Louis, Capacity Credit should be applied.
40,045 38,302
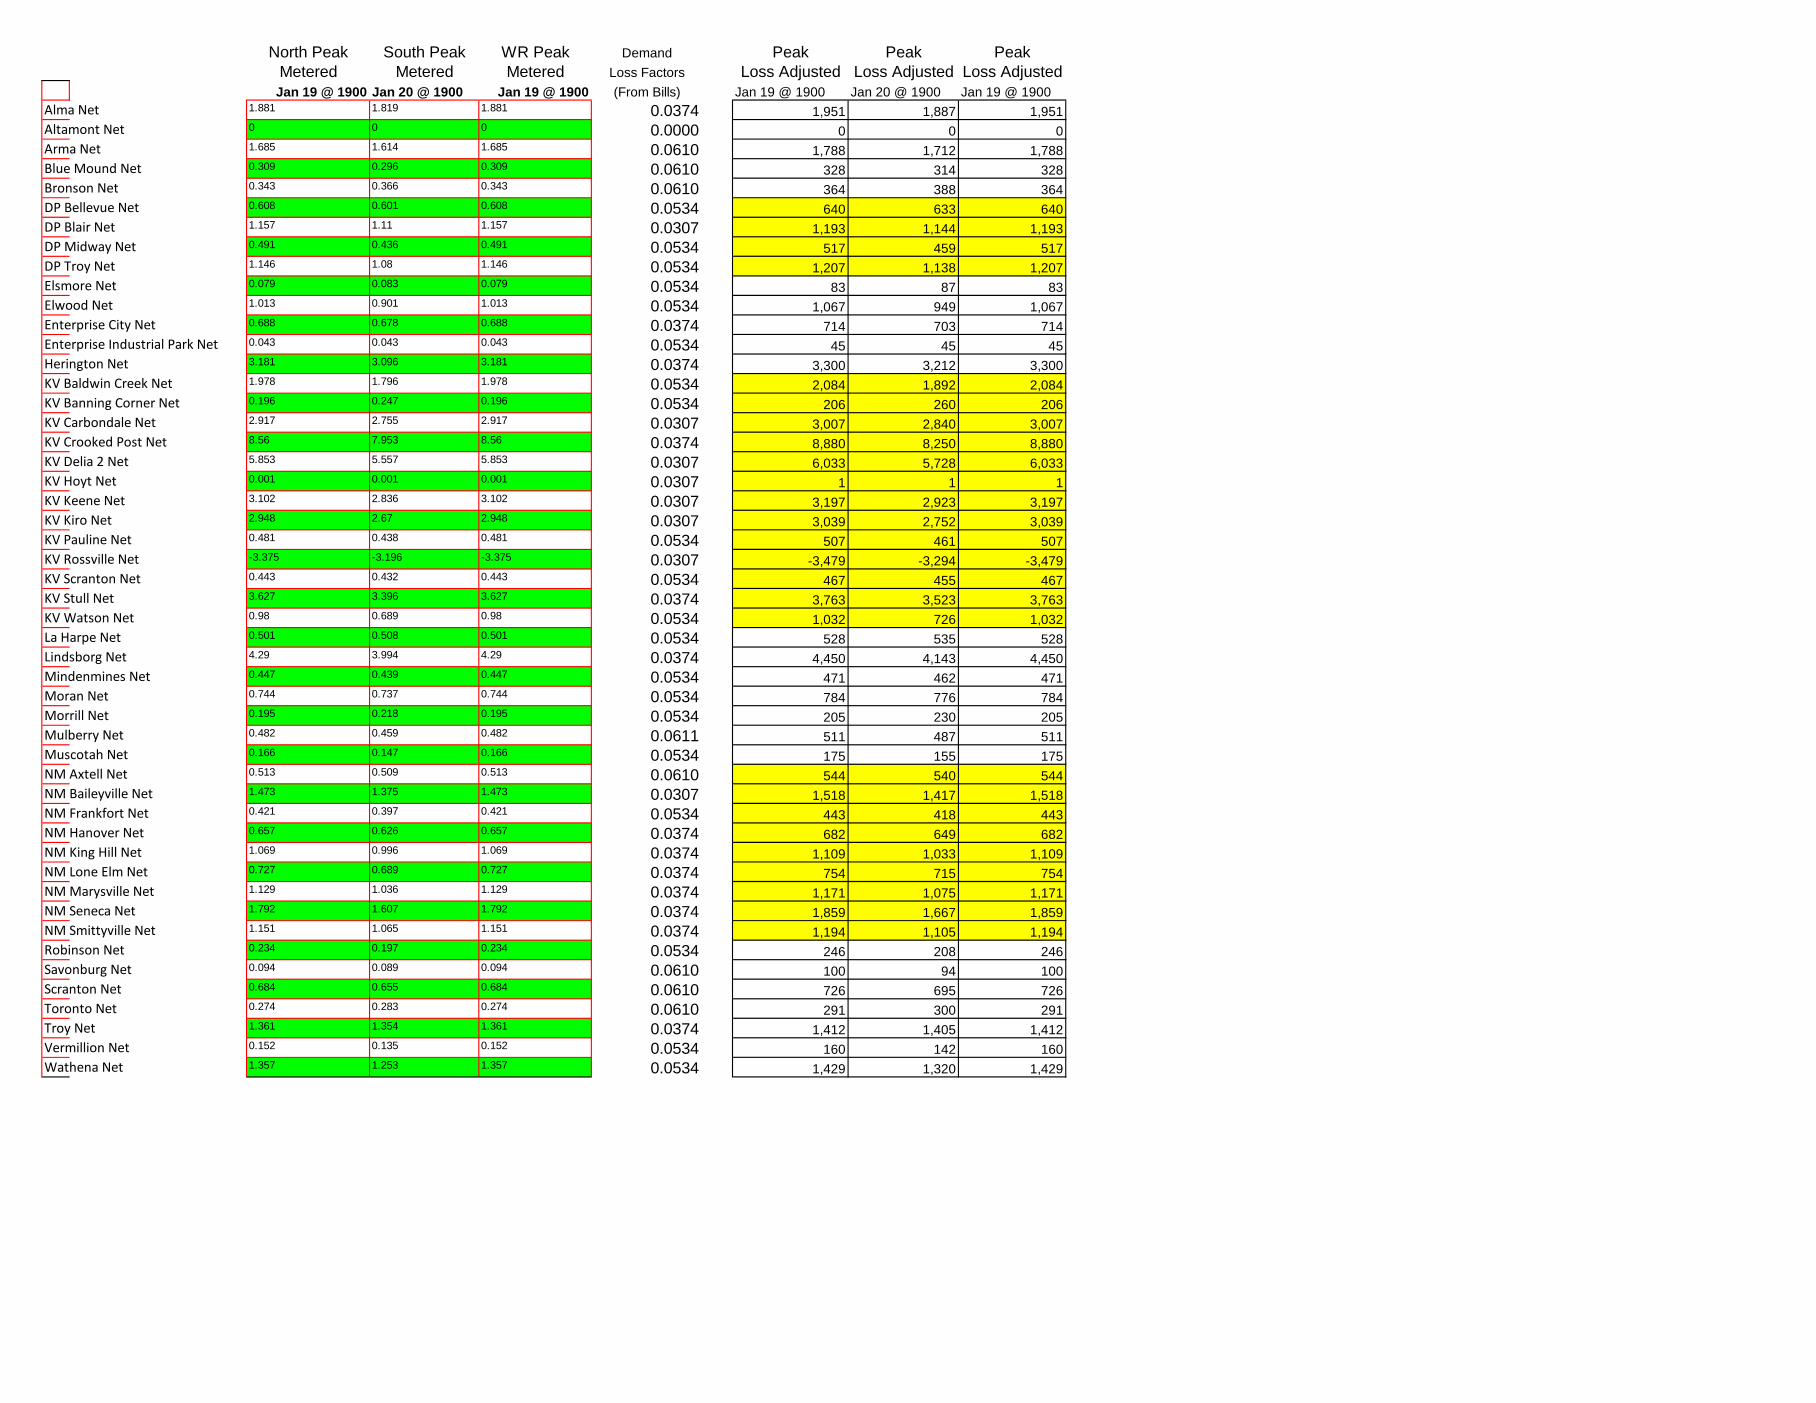
North Peak South Peak WR Peak Demand Peak Peak PeakMetered Metered Metered Loss Factors Loss Adjusted Loss Adjusted Loss AdjustedJan 19 @ 1900 Jan 20 @ 1900 Jan 19 @ 1900 (From Bills) Jan 19 @ 1900 Jan 20 @ 1900 Jan 19 @ 1900
Alma Net 1.881 1.819 1.881 0.0374 1,951 1,887 1,951Altamont Net 0 0 0 0.0000 0 0 0Arma Net 1.685 1.614 1.685 0.0610 1,788 1,712 1,788Blue Mound Net 0.309 0.296 0.309 0.0610 328 314 328Bronson Net 0.343 0.366 0.343 0.0610 364 388 364DP Bellevue Net 0.608 0.601 0.608 0.0534 640 633 640DP Blair Net 1.157 1.11 1.157 0.0307 1,193 1,144 1,193DP Midway Net 0.491 0.436 0.491 0.0534 517 459 517DP Troy Net 1.146 1.08 1.146 0.0534 1,207 1,138 1,207Elsmore Net 0.079 0.083 0.079 0.0534 83 87 83Elwood Net 1.013 0.901 1.013 0.0534 1,067 949 1,067Enterprise City Net 0.688 0.678 0.688 0.0374 714 703 714Enterprise Industrial Park Net 0.043 0.043 0.043 0.0534 45 45 45Herington Net 3.181 3.096 3.181 0.0374 3,300 3,212 3,300KV Baldwin Creek Net 1.978 1.796 1.978 0.0534 2,084 1,892 2,084KV Banning Corner Net 0.196 0.247 0.196 0.0534 206 260 206KV Carbondale Net 2.917 2.755 2.917 0.0307 3,007 2,840 3,007KV Crooked Post Net 8.56 7.953 8.56 0.0374 8,880 8,250 8,880KV Delia 2 Net 5.853 5.557 5.853 0.0307 6,033 5,728 6,033KV Hoyt Net 0.001 0.001 0.001 0.0307 1 1 1KV Keene Net 3.102 2.836 3.102 0.0307 3,197 2,923 3,197KV Kiro Net 2.948 2.67 2.948 0.0307 3,039 2,752 3,039KV Pauline Net 0.481 0.438 0.481 0.0534 507 461 507KV Rossville Net -3.375 -3.196 -3.375 0.0307 -3,479 -3,294 -3,479KV Scranton Net 0.443 0.432 0.443 0.0534 467 455 467KV Stull Net 3.627 3.396 3.627 0.0374 3,763 3,523 3,763KV Watson Net 0.98 0.689 0.98 0.0534 1,032 726 1,032La Harpe Net 0.501 0.508 0.501 0.0534 528 535 528Lindsborg Net 4.29 3.994 4.29 0.0374 4,450 4,143 4,450Mindenmines Net 0.447 0.439 0.447 0.0534 471 462 471Moran Net 0.744 0.737 0.744 0.0534 784 776 784Morrill Net 0.195 0.218 0.195 0.0534 205 230 205Mulberry Net 0.482 0.459 0.482 0.0611 511 487 511Muscotah Net 0.166 0.147 0.166 0.0534 175 155 175NM Axtell Net 0.513 0.509 0.513 0.0610 544 540 544NM Baileyville Net 1.473 1.375 1.473 0.0307 1,518 1,417 1,518NM Frankfort Net 0.421 0.397 0.421 0.0534 443 418 443NM Hanover Net 0.657 0.626 0.657 0.0374 682 649 682NM King Hill Net 1.069 0.996 1.069 0.0374 1,109 1,033 1,109NM Lone Elm Net 0.727 0.689 0.727 0.0374 754 715 754NM Marysville Net 1.129 1.036 1.129 0.0374 1,171 1,075 1,171NM Seneca Net 1.792 1.607 1.792 0.0374 1,859 1,667 1,859NM Smittyville Net 1.151 1.065 1.151 0.0374 1,194 1,105 1,194Robinson Net 0.234 0.197 0.234 0.0534 246 208 246Savonburg Net 0.094 0.089 0.094 0.0610 100 94 100Scranton Net 0.684 0.655 0.684 0.0610 726 695 726Toronto Net 0.274 0.283 0.274 0.0610 291 300 291Troy Net 1.361 1.354 1.361 0.0374 1,412 1,405 1,412Vermillion Net 0.152 0.135 0.152 0.0534 160 142 160Wathena Net 1.357 1.253 1.357 0.0534 1,429 1,320 1,429
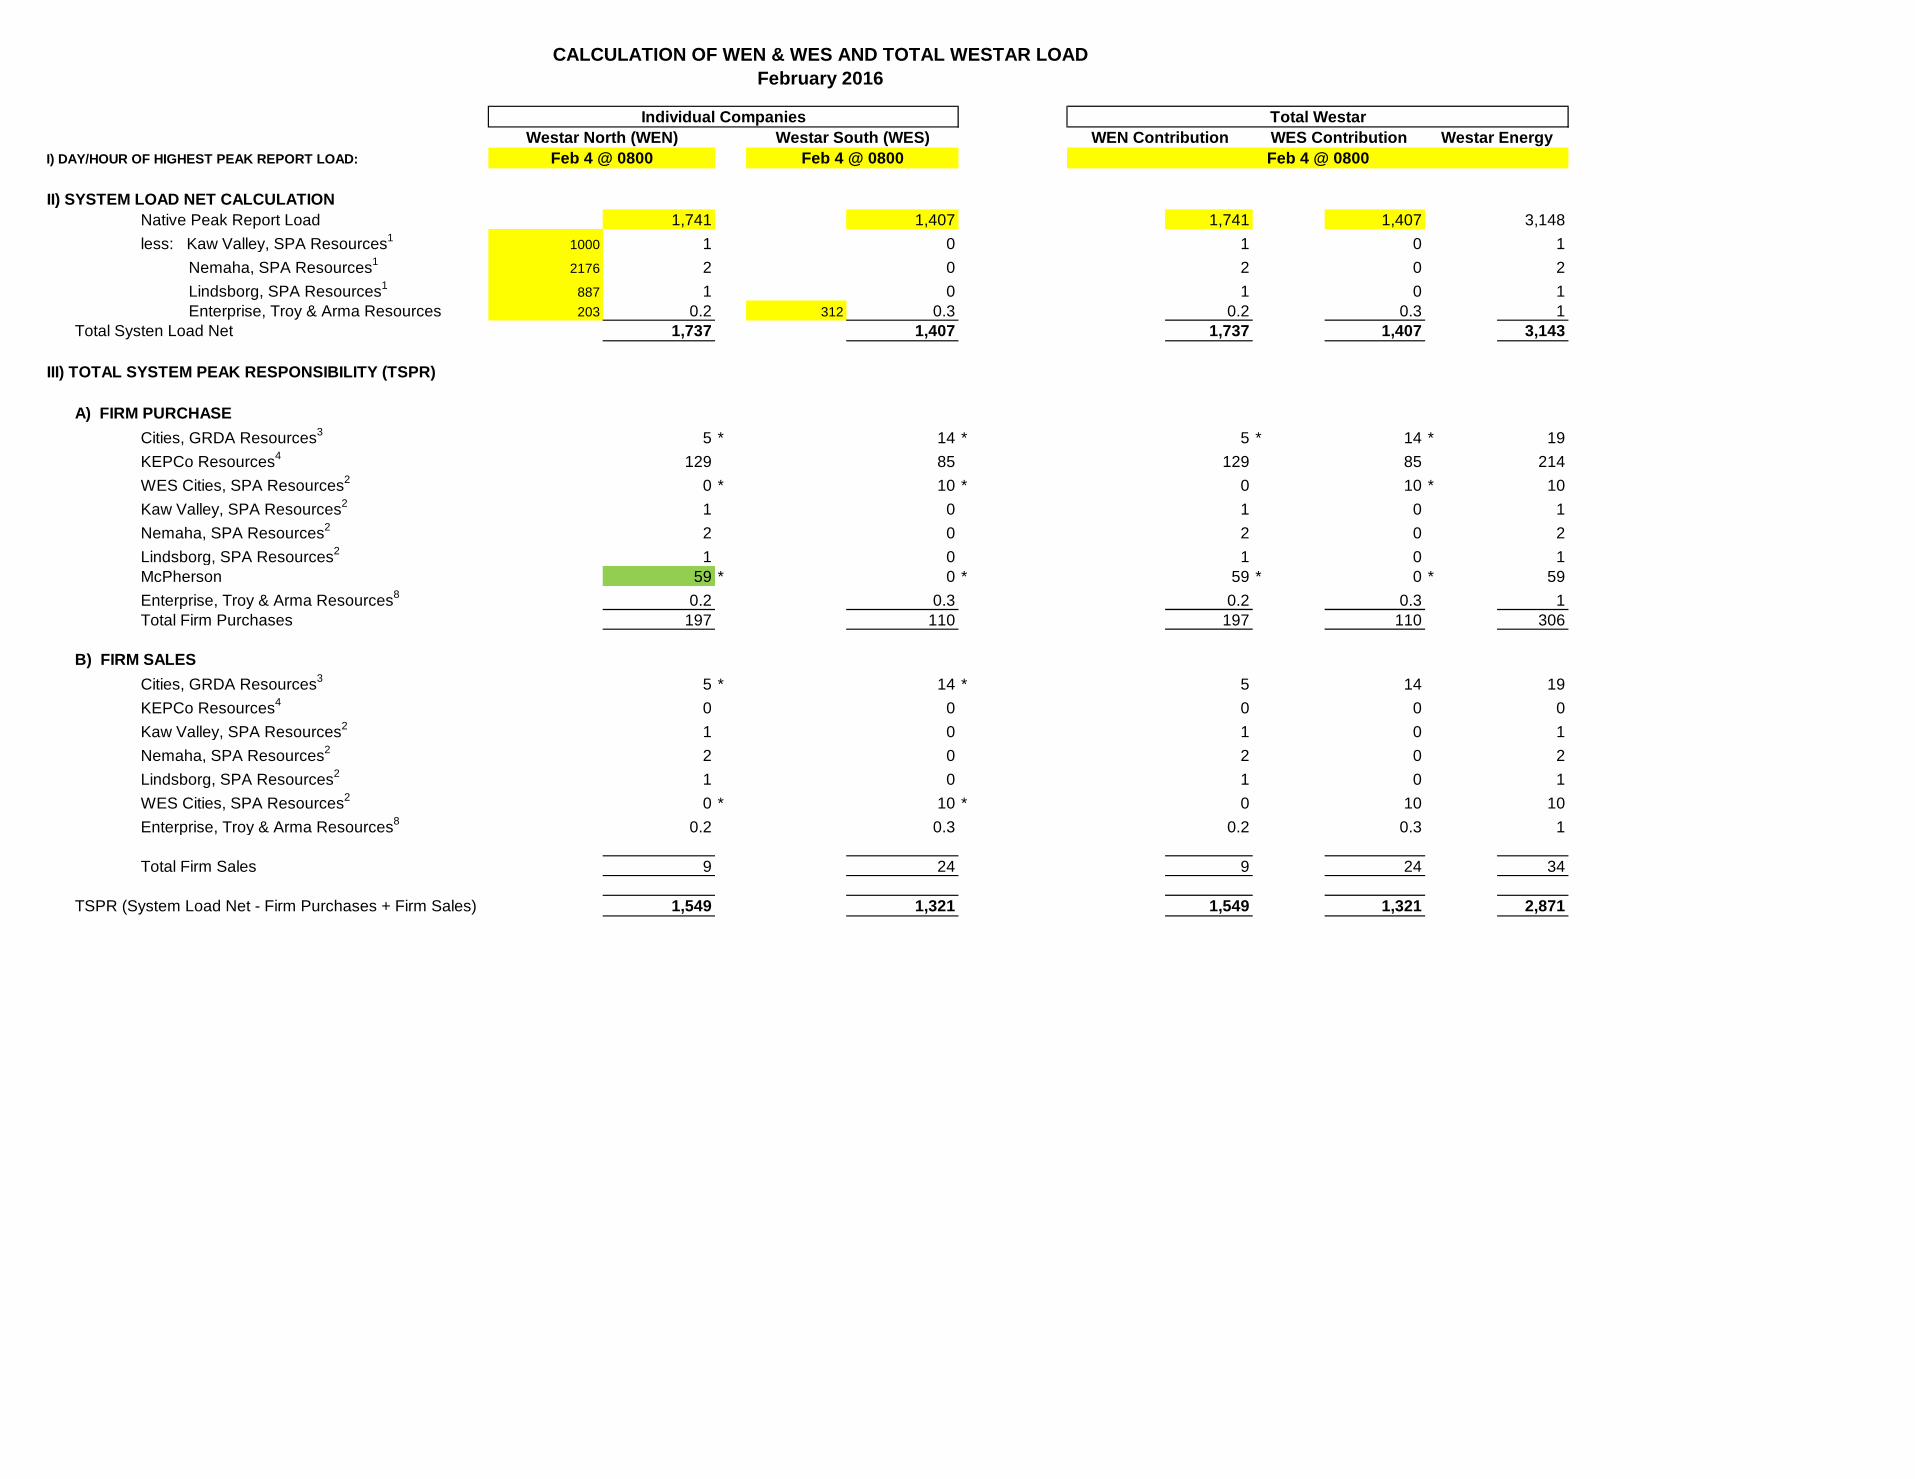
I) DAY/HOUR OF HIGHEST PEAK REPORT LOAD:
II) SYSTEM LOAD NET CALCULATIONNative Peak Report Load 1,741 1,407 1,741 1,407 3,148less: Kaw Valley, SPA Resources1 1000 1 0 1 0 1 Nemaha, SPA Resources1 2176 2 0 2 0 2 Lindsborg, SPA Resources1 887 1 0 1 0 1 Enterprise, Troy & Arma Resources 203 0.2 312 0.3 0.2 0.3 1
Total Systen Load Net 1,737 1,407 1,737 1,407 3,143
III) TOTAL SYSTEM PEAK RESPONSIBILITY (TSPR)
A) FIRM PURCHASECities, GRDA Resources3 5 * 14 * 5 * 14 * 19KEPCo Resources4 129 85 129 85 214WES Cities, SPA Resources2 0 * 10 * 0 10 * 10Kaw Valley, SPA Resources2 1 0 1 0 1Nemaha, SPA Resources2 2 0 2 0 2Lindsborg, SPA Resources2 1 0 1 0 1McPherson 59 * 0 * 59 * 0 * 59Enterprise, Troy & Arma Resources8 0.2 0.3 0.2 0.3 1Total Firm Purchases 197 110 197 110 306
B) FIRM SALESCities, GRDA Resources3 5 * 14 * 5 14 19KEPCo Resources4 0 0 0 0 0Kaw Valley, SPA Resources2 1 0 1 0 1Nemaha, SPA Resources2 2 0 2 0 2Lindsborg, SPA Resources2 1 0 1 0 1WES Cities, SPA Resources2 0 * 10 * 0 10 10Enterprise, Troy & Arma Resources8 0.2 0.3 0.2 0.3 1
Total Firm Sales 9 24 9 24 34
TSPR (System Load Net - Firm Purchases + Firm Sales) 1,549 1,321 1,549 1,321 2,871
CALCULATION OF WEN & WES AND TOTAL WESTAR LOADFebruary 2016
Individual Companies Total WestarWestar North (WEN) Westar South (WES) WEN Contribution WES Contribution Westar Energy
Feb 4 @ 0800 Feb 4 @ 0800 Feb 4 @ 0800
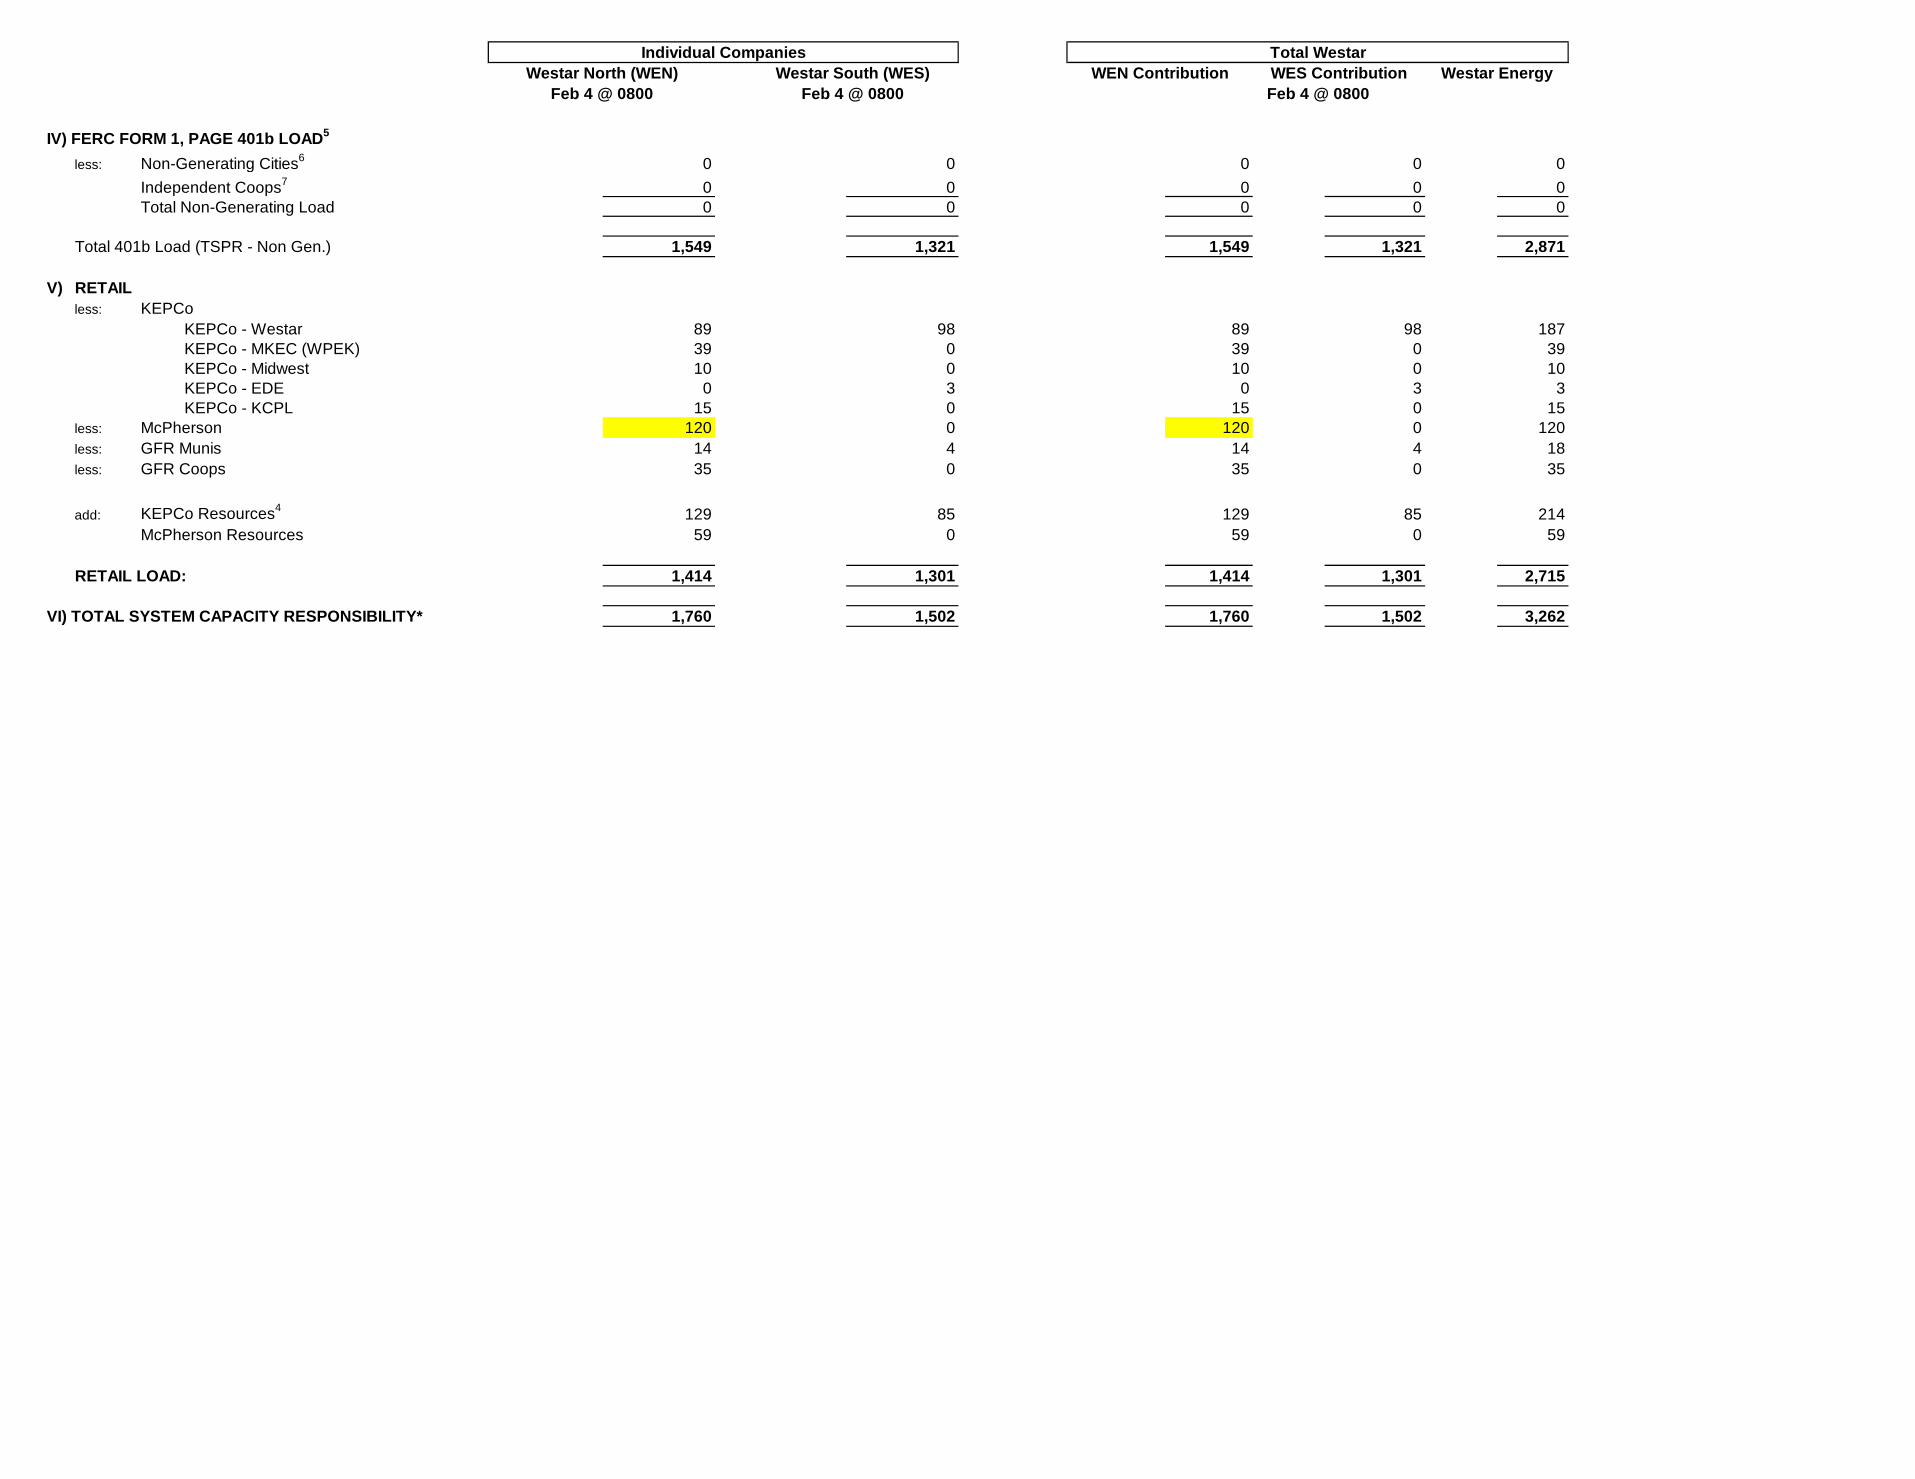
IV) FERC FORM 1, PAGE 401b LOAD5
less: Non-Generating Cities6 0 0 0 0 0Independent Coops7 0 0 0 0 0Total Non-Generating Load 0 0 0 0 0
Total 401b Load (TSPR - Non Gen.) 1,549 1,321 1,549 1,321 2,871
V) RETAILless: KEPCo
KEPCo - Westar 89 98 89 98 187 KEPCo - MKEC (WPEK) 39 0 39 0 39 KEPCo - Midwest 10 0 10 0 10 KEPCo - EDE 0 3 0 3 3 KEPCo - KCPL 15 0 15 0 15
less: McPherson 120 0 120 0 120less: GFR Munis 14 4 14 4 18less: GFR Coops 35 0 35 0 35
add: KEPCo Resources4 129 85 129 85 214McPherson Resources 59 0 59 0 59
RETAIL LOAD: 1,414 1,301 1,414 1,301 2,715
VI) TOTAL SYSTEM CAPACITY RESPONSIBILITY* 1,760 1,502 1,760 1,502 3,262
Feb 4 @ 0800 Feb 4 @ 0800 Feb 4 @ 0800
Individual Companies Total WestarWestar North (WEN) Westar South (WES) WEN Contribution WES Contribution Westar Energy
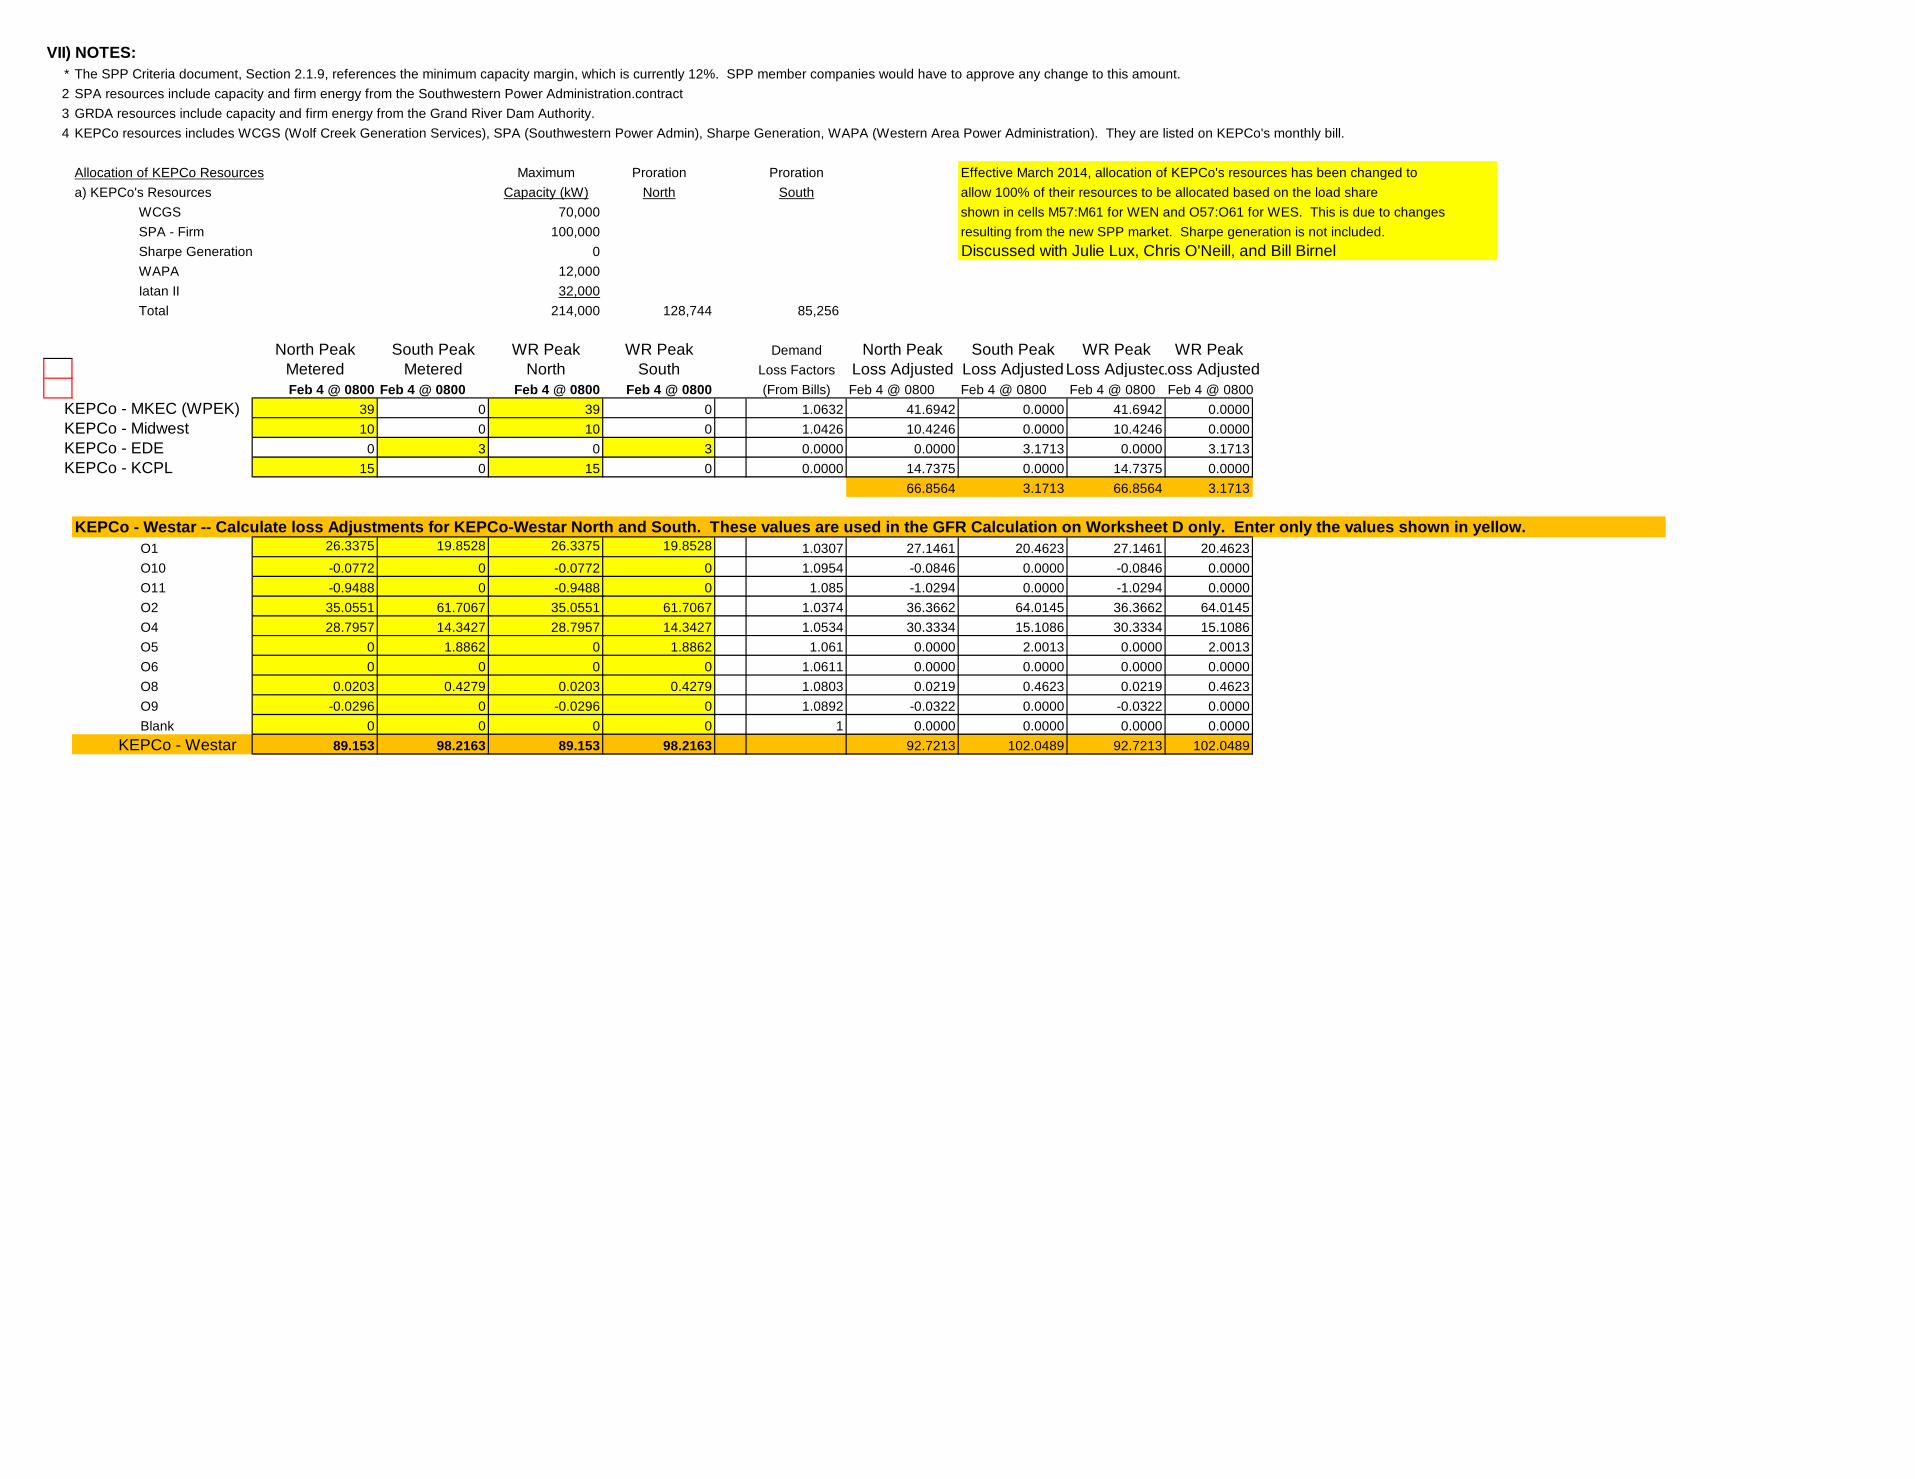
VII) NOTES:* The SPP Criteria document, Section 2.1.9, references the minimum capacity margin, which is currently 12%. SPP member companies would have to approve any change to this amount. 2 SPA resources include capacity and firm energy from the Southwestern Power Administration.contract 3 GRDA resources include capacity and firm energy from the Grand River Dam Authority.4 KEPCo resources includes WCGS (Wolf Creek Generation Services), SPA (Southwestern Power Admin), Sharpe Generation, WAPA (Western Area Power Administration). They are listed on KEPCo's monthly bill.
Allocation of KEPCo Resources Maximum Proration Proration Effective March 2014, allocation of KEPCo's resources has been changed to a) KEPCo's Resources Capacity (kW) North South allow 100% of their resources to be allocated based on the load share WCGS 70,000 shown in cells M57:M61 for WEN and O57:O61 for WES. This is due to changes SPA - Firm 100,000 resulting from the new SPP market. Sharpe generation is not included. Sharpe Generation 0 Discussed with Julie Lux, Chris O'Neill, and Bill Birnel WAPA 12,000 Iatan II 32,000 Total 214,000 128,744 85,256
North Peak South Peak WR Peak WR Peak Demand North Peak South Peak WR Peak WR PeakMetered Metered North South Loss Factors Loss Adjusted Loss AdjustedLoss AdjustedLoss AdjustedFeb 4 @ 0800 Feb 4 @ 0800 Feb 4 @ 0800 Feb 4 @ 0800 (From Bills) Feb 4 @ 0800 Feb 4 @ 0800 Feb 4 @ 0800 Feb 4 @ 0800
KEPCo - MKEC (WPEK) 39 0 39 0 1.0632 41.6942 0.0000 41.6942 0.0000 KEPCo - Midwest 10 0 10 0 1.0426 10.4246 0.0000 10.4246 0.0000 KEPCo - EDE 0 3 0 3 0.0000 0.0000 3.1713 0.0000 3.1713 KEPCo - KCPL 15 0 15 0 0.0000 14.7375 0.0000 14.7375 0.0000
66.8564 3.1713 66.8564 3.1713
KEPCo - Westar -- Calculate loss Adjustments for KEPCo-Westar North and South. These values are used in the GFR Calculation on Worksheet D only. Enter only the values shown in yellow.O1 26.3375 19.8528 26.3375 19.8528 1.0307 27.1461 20.4623 27.1461 20.4623O10 -0.0772 0 -0.0772 0 1.0954 -0.0846 0.0000 -0.0846 0.0000O11 -0.9488 0 -0.9488 0 1.085 -1.0294 0.0000 -1.0294 0.0000O2 35.0551 61.7067 35.0551 61.7067 1.0374 36.3662 64.0145 36.3662 64.0145O4 28.7957 14.3427 28.7957 14.3427 1.0534 30.3334 15.1086 30.3334 15.1086O5 0 1.8862 0 1.8862 1.061 0.0000 2.0013 0.0000 2.0013O6 0 0 0 0 1.0611 0.0000 0.0000 0.0000 0.0000O8 0.0203 0.4279 0.0203 0.4279 1.0803 0.0219 0.4623 0.0219 0.4623O9 -0.0296 0 -0.0296 0 1.0892 -0.0322 0.0000 -0.0322 0.0000Blank 0 0 0 0 1 0.0000 0.0000 0.0000 0.0000
KEPCo - Westar 89.153 98.2163 89.153 98.2163 92.7213 102.0489 92.7213 102.0489
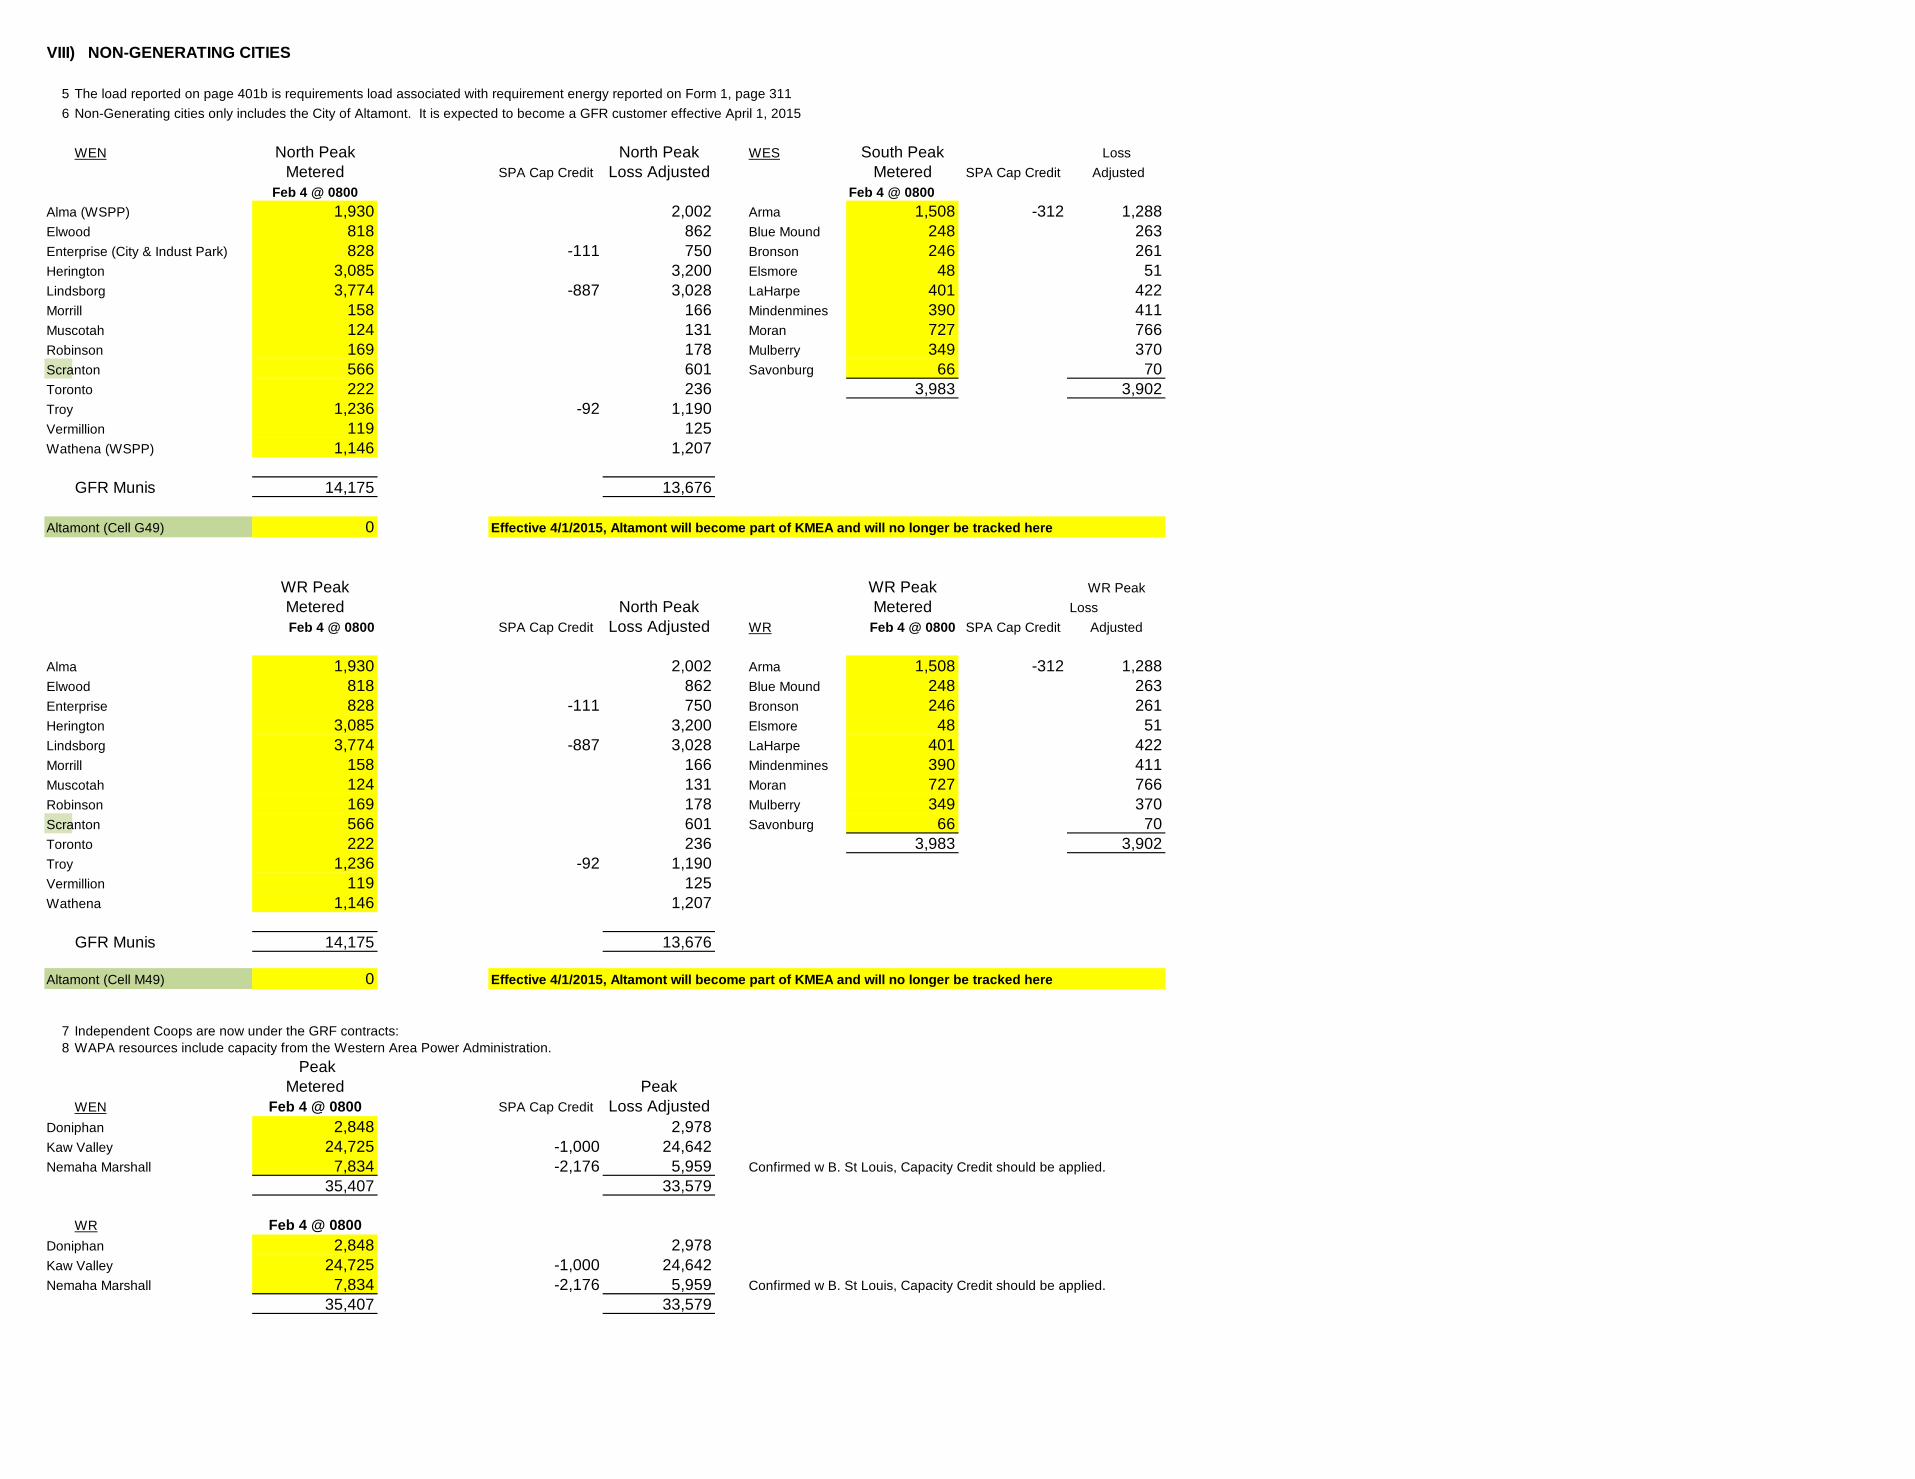
VIII) NON-GENERATING CITIES
5 The load reported on page 401b is requirements load associated with requirement energy reported on Form 1, page 311 6 Non-Generating cities only includes the City of Altamont. It is expected to become a GFR customer effective April 1, 2015
WEN North Peak North Peak WES South Peak LossMetered SPA Cap Credit Loss Adjusted Metered SPA Cap Credit Adjusted
Feb 4 @ 0800 Feb 4 @ 0800Alma (WSPP) 1,930 2,002 Arma 1,508 -312 1,288Elwood 818 862 Blue Mound 248 263Enterprise (City & Indust Park) 828 -111 750 Bronson 246 261Herington 3,085 3,200 Elsmore 48 51Lindsborg 3,774 -887 3,028 LaHarpe 401 422Morrill 158 166 Mindenmines 390 411Muscotah 124 131 Moran 727 766Robinson 169 178 Mulberry 349 370Scranton 566 601 Savonburg 66 70Toronto 222 236 3,983 3,902Troy 1,236 -92 1,190Vermillion 119 125Wathena (WSPP) 1,146 1,207
GFR Munis 14,175 13,676
Altamont (Cell G49) 0 Effective 4/1/2015, Altamont will become part of KMEA and will no longer be tracked here
WR Peak WR Peak WR PeakMetered North Peak Metered Loss Feb 4 @ 0800 SPA Cap Credit Loss Adjusted WR Feb 4 @ 0800 SPA Cap Credit Adjusted
Alma 1,930 2,002 Arma 1,508 -312 1,288Elwood 818 862 Blue Mound 248 263Enterprise 828 -111 750 Bronson 246 261Herington 3,085 3,200 Elsmore 48 51Lindsborg 3,774 -887 3,028 LaHarpe 401 422Morrill 158 166 Mindenmines 390 411Muscotah 124 131 Moran 727 766Robinson 169 178 Mulberry 349 370Scranton 566 601 Savonburg 66 70Toronto 222 236 3,983 3,902Troy 1,236 -92 1,190Vermillion 119 125Wathena 1,146 1,207
GFR Munis 14,175 13,676
Altamont (Cell M49) 0 Effective 4/1/2015, Altamont will become part of KMEA and will no longer be tracked here
7 Independent Coops are now under the GRF contracts:8 WAPA resources include capacity from the Western Area Power Administration.
PeakMetered Peak
WEN Feb 4 @ 0800 SPA Cap Credit Loss AdjustedDoniphan 2,848 2,978Kaw Valley 24,725 -1,000 24,642Nemaha Marshall 7,834 -2,176 5,959 Confirmed w B. St Louis, Capacity Credit should be applied.
35,407 33,579
WR Feb 4 @ 0800Doniphan 2,848 2,978Kaw Valley 24,725 -1,000 24,642Nemaha Marshall 7,834 -2,176 5,959 Confirmed w B. St Louis, Capacity Credit should be applied.
35,407 33,579
North Peak South Peak WR Peak Demand Peak Peak PeakMetered Metered Metered Loss Factors Loss Adjusted Loss Adjusted Loss AdjustedFeb 4 @ 0800 Feb 4 @ 0800 Feb 4 @ 0800 (From Bills) Feb 4 @ 0800 Feb 4 @ 0800 Feb 4 @ 0800
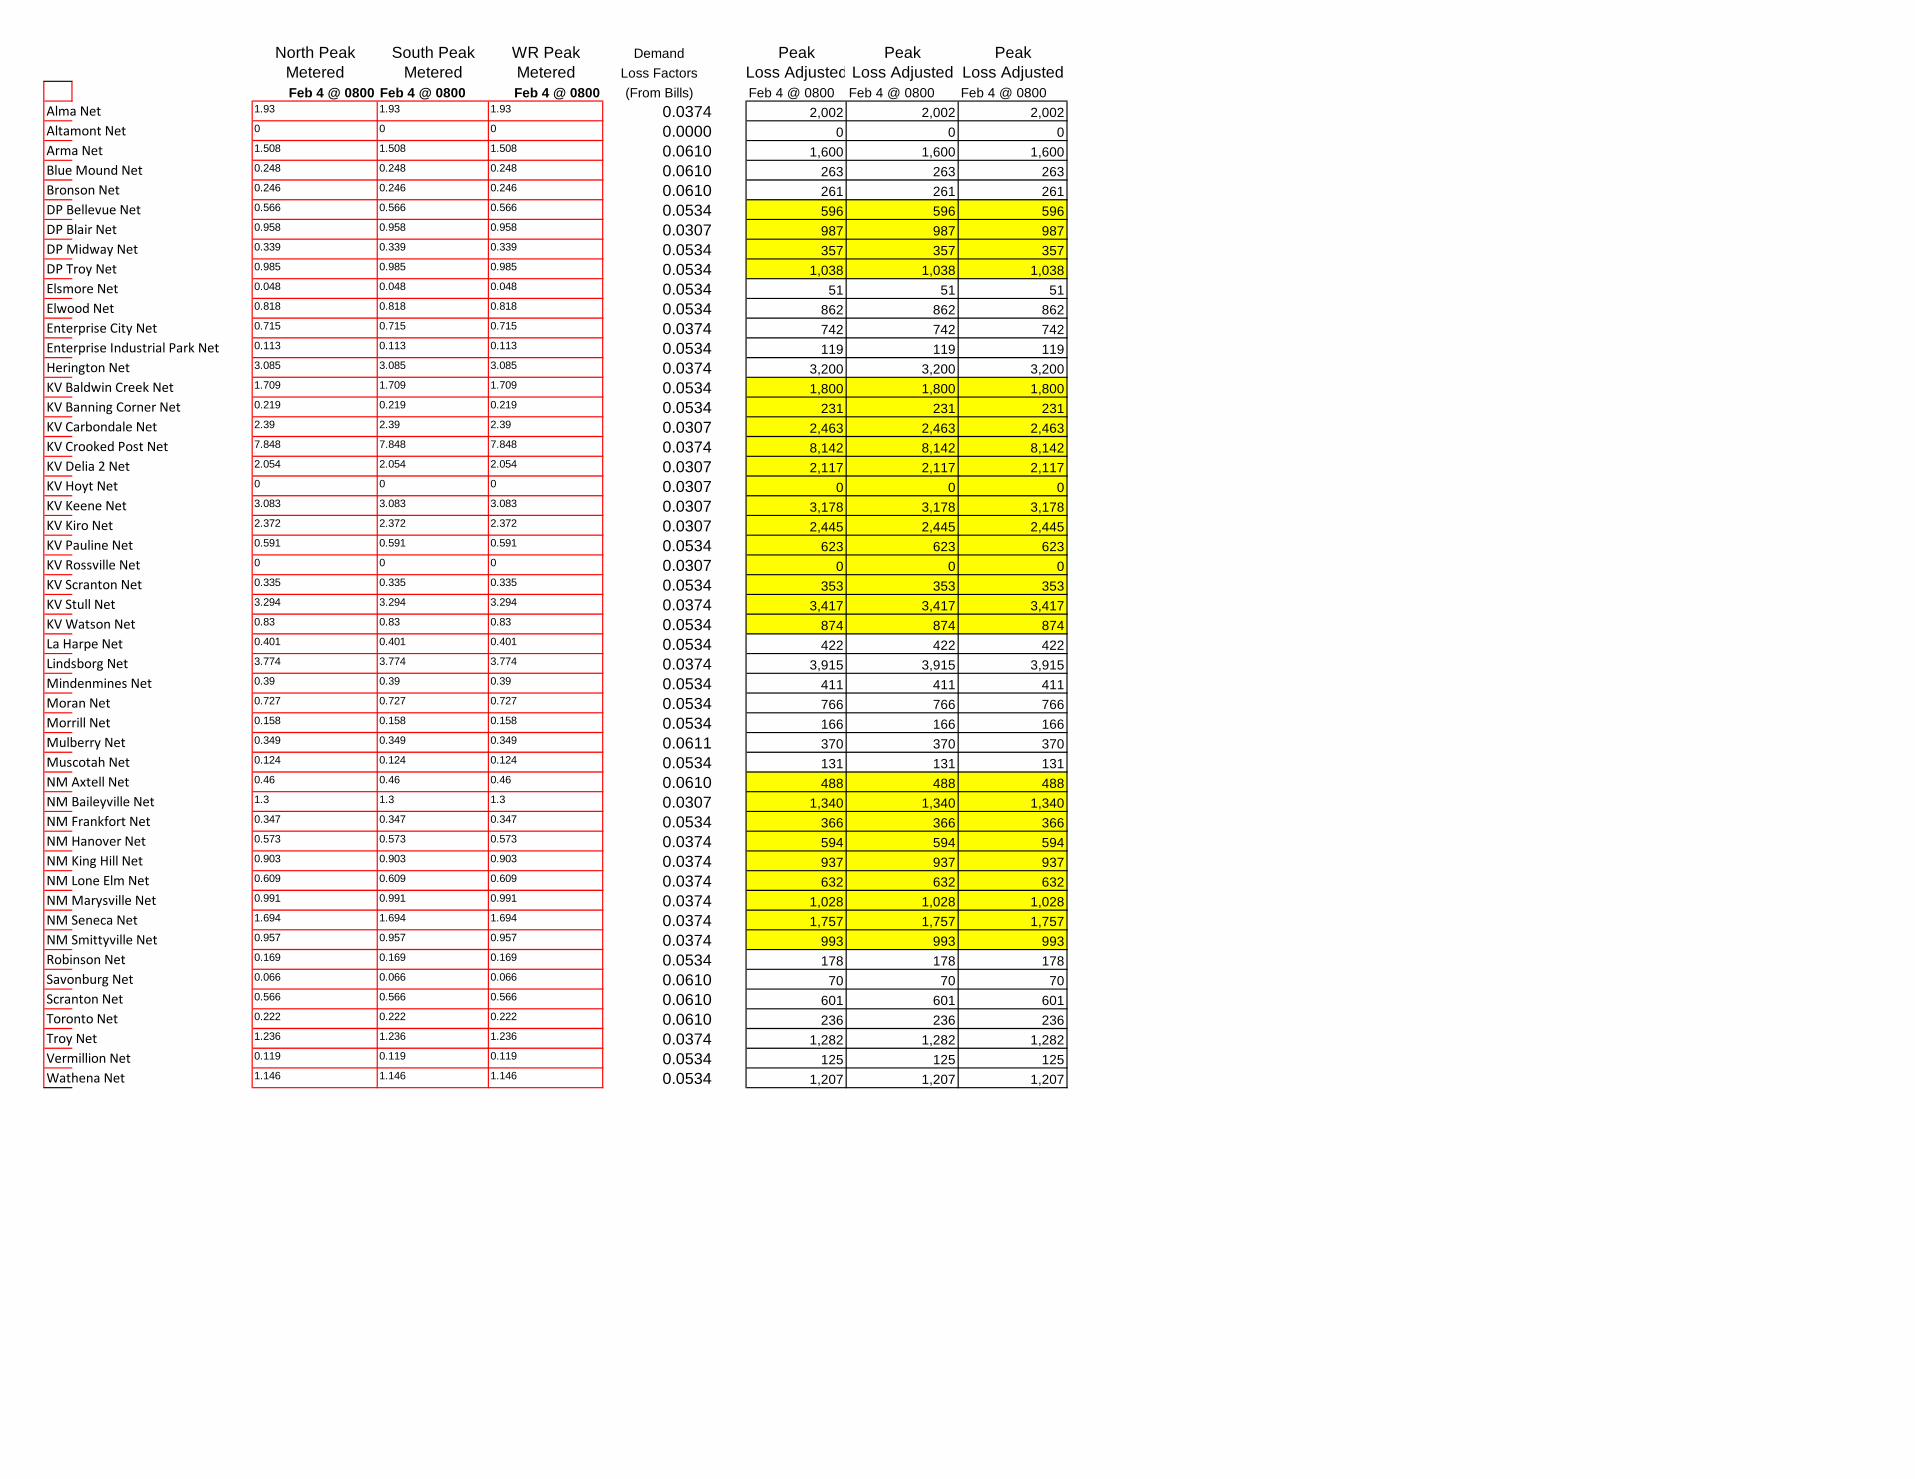
Alma Net 1.93 1.93 1.93 0.0374 2,002 2,002 2,002Altamont Net 0 0 0 0.0000 0 0 0Arma Net 1.508 1.508 1.508 0.0610 1,600 1,600 1,600Blue Mound Net 0.248 0.248 0.248 0.0610 263 263 263Bronson Net 0.246 0.246 0.246 0.0610 261 261 261DP Bellevue Net 0.566 0.566 0.566 0.0534 596 596 596DP Blair Net 0.958 0.958 0.958 0.0307 987 987 987DP Midway Net 0.339 0.339 0.339 0.0534 357 357 357DP Troy Net 0.985 0.985 0.985 0.0534 1,038 1,038 1,038Elsmore Net 0.048 0.048 0.048 0.0534 51 51 51Elwood Net 0.818 0.818 0.818 0.0534 862 862 862Enterprise City Net 0.715 0.715 0.715 0.0374 742 742 742Enterprise Industrial Park Net 0.113 0.113 0.113 0.0534 119 119 119Herington Net 3.085 3.085 3.085 0.0374 3,200 3,200 3,200KV Baldwin Creek Net 1.709 1.709 1.709 0.0534 1,800 1,800 1,800KV Banning Corner Net 0.219 0.219 0.219 0.0534 231 231 231KV Carbondale Net 2.39 2.39 2.39 0.0307 2,463 2,463 2,463KV Crooked Post Net 7.848 7.848 7.848 0.0374 8,142 8,142 8,142KV Delia 2 Net 2.054 2.054 2.054 0.0307 2,117 2,117 2,117KV Hoyt Net 0 0 0 0.0307 0 0 0KV Keene Net 3.083 3.083 3.083 0.0307 3,178 3,178 3,178KV Kiro Net 2.372 2.372 2.372 0.0307 2,445 2,445 2,445KV Pauline Net 0.591 0.591 0.591 0.0534 623 623 623KV Rossville Net 0 0 0 0.0307 0 0 0KV Scranton Net 0.335 0.335 0.335 0.0534 353 353 353KV Stull Net 3.294 3.294 3.294 0.0374 3,417 3,417 3,417KV Watson Net 0.83 0.83 0.83 0.0534 874 874 874La Harpe Net 0.401 0.401 0.401 0.0534 422 422 422Lindsborg Net 3.774 3.774 3.774 0.0374 3,915 3,915 3,915Mindenmines Net 0.39 0.39 0.39 0.0534 411 411 411Moran Net 0.727 0.727 0.727 0.0534 766 766 766Morrill Net 0.158 0.158 0.158 0.0534 166 166 166Mulberry Net 0.349 0.349 0.349 0.0611 370 370 370Muscotah Net 0.124 0.124 0.124 0.0534 131 131 131NM Axtell Net 0.46 0.46 0.46 0.0610 488 488 488NM Baileyville Net 1.3 1.3 1.3 0.0307 1,340 1,340 1,340NM Frankfort Net 0.347 0.347 0.347 0.0534 366 366 366NM Hanover Net 0.573 0.573 0.573 0.0374 594 594 594NM King Hill Net 0.903 0.903 0.903 0.0374 937 937 937NM Lone Elm Net 0.609 0.609 0.609 0.0374 632 632 632NM Marysville Net 0.991 0.991 0.991 0.0374 1,028 1,028 1,028NM Seneca Net 1.694 1.694 1.694 0.0374 1,757 1,757 1,757NM Smittyville Net 0.957 0.957 0.957 0.0374 993 993 993Robinson Net 0.169 0.169 0.169 0.0534 178 178 178Savonburg Net 0.066 0.066 0.066 0.0610 70 70 70Scranton Net 0.566 0.566 0.566 0.0610 601 601 601Toronto Net 0.222 0.222 0.222 0.0610 236 236 236Troy Net 1.236 1.236 1.236 0.0374 1,282 1,282 1,282Vermillion Net 0.119 0.119 0.119 0.0534 125 125 125Wathena Net 1.146 1.146 1.146 0.0534 1,207 1,207 1,207

I) DAY/HOUR OF HIGHEST PEAK REPORT LOAD:
II) SYSTEM LOAD NET CALCULATIONNative Peak Report Load 1,542 1,271 1,536 1,250 2,786less: Kaw Valley, SPA Resources1 1000 1 0 1 0 1 Nemaha, SPA Resources1 2067 2 0 2 0 2 Lindsborg, SPA Resources1 804 1 0 1 0 1 Enterprise, Troy & Arma Resources 185 0.2 283 0.3 0.2 0.3 0.5
Total Systen Load Net 1,538 1,271 1,532 1,249 2,782
III) TOTAL SYSTEM PEAK RESPONSIBILITY (TSPR)
A) FIRM PURCHASECities, GRDA Resources3 5 * 14 * 5 * 14 * 19KEPCo Resources4 132 82 132 82 214WES Cities, SPA Resources2 0 * 10 * 0 10 * 10Kaw Valley, SPA Resources2 1 0 1 0 1Nemaha, SPA Resources2 2 0 2 0 2Lindsborg, SPA Resources2 1 0 1 0 1McPherson 59 * 0 * 59 * 0 * 59Enterprise, Troy & Arma Resources8 0.2 0.3 0.2 0.3 0Total Firm Purchases 200 106 200 106 306
B) FIRM SALESCities, GRDA Resources3 5 * 14 * 5 14 19KEPCo Resources4 0 0 0 0 0Kaw Valley, SPA Resources2 1 0 1 0 1Nemaha, SPA Resources2 2 0 2 0 2Lindsborg, SPA Resources2 1 0 1 0 1WES Cities, SPA Resources2 0 * 10 * 0 10 10Enterprise, Troy & Arma Resources8 0.2 0.3 0.2 0.3 0
Total Firm Sales 9 24 9 24 33
TSPR (System Load Net - Firm Purchases + Firm Sales) 1,347 1,189 1,341 1,168 2,509
Mar 02 @ 0900 Mar 21 @ 0800 Mar 02 @ 0800
CALCULATION OF WEN & WES AND TOTAL WESTAR LOADMarch 2016
Individual Companies Total WestarWestar North (WEN) Westar South (WES) WEN Contribution WES Contribution Westar Energy

IV) FERC FORM 1, PAGE 401b LOAD5
less: Non-Generating Cities6 0 0 0 0 0Independent Coops7 0 0 0 0 0Total Non-Generating Load 0 0 0 0 0
Total 401b Load (TSPR - Non Gen.) 1,347 1,189 1,341 1,168 2,509
V) RETAILless: KEPCo
KEPCo - Westar 70 84 73 80 153 KEPCo - MKEC (WPEK) 39 0 39 0 39 KEPCo - Midwest 8 0 8 0 8 KEPCo - EDE 0 3 0 2 2 KEPCo - KCPL 11 0 12 0 12
less: McPherson 114 0 114 0 114less: GFR Munis 12 3 12 3 15less: GFR Coops 28 0 30 0 30
add: KEPCo Resources4 132 82 132 82 214McPherson Resources 59 0 59 0 59
RETAIL LOAD: 1,256 1,181 1,244 1,164 2,408
VI) TOTAL SYSTEM CAPACITY RESPONSIBILITY* 1,531 1,351 1,524 1,327 2,851
Mar 02 @ 0900 Mar 21 @ 0800 Mar 02 @ 0800
Individual Companies Total WestarWestar North (WEN) Westar South (WES) WEN Contribution WES Contribution Westar Energy

VII) NOTES:* The SPP Criteria document, Section 2.1.9, references the minimum capacity margin, which is currently 12%. SPP member companies would have to approve any change to this amount. 2 SPA resources include capacity and firm energy from the Southwestern Power Administration.contract 3 GRDA resources include capacity and firm energy from the Grand River Dam Authority.4 KEPCo resources includes WCGS (Wolf Creek Generation Services), SPA (Southwestern Power Admin), Sharpe Generation, WAPA (Western Area Power Administration). They are listed on KEPCo's monthly bill.
Allocation of KEPCo Resources Maximum Proration Prorationa) KEPCo's Resources Capacity (kW) North South Effective March 2014, allocation of KEPCo's resources has been changed to WCGS 70,000 allow 100% of their resources to be allocated based on the load share SPA - Firm 100,000 shown in cells M57:M61 for WEN and O57:O61 for WES. This is due to changes Sharpe Generation 0 resulting from the new SPP market. Sharpe generation is not included. WAPA 12,000 Discussed with Julie Lux, Chris O'Neill, and Bill Birnel Iatan II 32,000 Total 214,000 132,278 81,722
North Peak South Peak WR Peak WR Peak Demand North Peak South Peak WR Peak WR PeakMetered Metered North South Loss Factors Loss Adjusted Loss AdjustedLoss AdjustedLoss Adjusted
Mar 02 @ 0900 Mar 21 @ 0800 Mar 02 @ 0800 Mar 02 @ 0800 (From Bills) Mar 02 @ 0900 Mar 21 @ 0800 Mar 02 @ 0800 Mar 02 @ 0800 KEPCo - MKEC (WPEK) 39 0 39 0 1.0632 41.2969 0.0000 41.9709 0.0000 KEPCo - Midwest 8 0 8 0 1.0426 8.3613 0.0000 8.3091 0.0000 KEPCo - EDE 0 3 0 2 0.0000 0.0000 2.5766 0.0000 2.4188 KEPCo - KCPL 11 0 12 0 0.0000 11.3166 0.0000 12.1455 0.0000
60.9749 2.5766 62.4255 2.4188
KEPCo - Westar -- Calculate loss Adjustments for KEPCo-Westar North and South. These values are used in the GFR Calculation on Worksheet D only. Enter only the values shown in yellow.O1 20.3067 17.3671 21.5998 16.2489 1.0307 20.9301 17.9003 22.2629 16.7477O10 -0.0543 0 -0.0688 0 1.0954 -0.0595 0.0000 -0.0754 0.0000O11 -0.7592 0 -0.7484 0 1.085 -0.8237 0.0000 -0.8120 0.0000O2 27.725 52.1613 29.1983 50.0526 1.0374 28.7619 54.1121 30.2903 51.9246O4 22.6008 12.6437 23.4929 11.5844 1.0534 23.8077 13.3189 24.7474 12.2030O5 1.6017 0 1.5782 1.061 0.0000 1.6994 0.0000 1.6745O6 0 0 0 1.0611 0.0000 0.0000 0.0000 0.0000O8 0.0187 0.4085 0.0179 0.3204 1.0803 0.0202 0.4413 0.0193 0.3461O9 -0.0121 0 -0.0266 0 1.0892 -0.0132 0.0000 -0.0290 0.0000Blank 0 0 0 1 0.0000 0.0000 0.0000 0.0000
KEPCo - Westar 69.8256 84.1823 73.4651 79.7845 72.6235 87.4720 76.4036 82.8959
VIII) NON-GENERATING CITIES
5 The load reported on page 401b is requirements load associated with requirement energy reported on Form 1, page 311 6 Non-Generating cities only includes the City of Altamont. It is expected to become a GFR customer effective April 1, 2015
WEN North Peak North Peak WES South Peak LossMetered SPA Cap Credit Loss Adjusted Metered SPA Cap Credit Adjusted
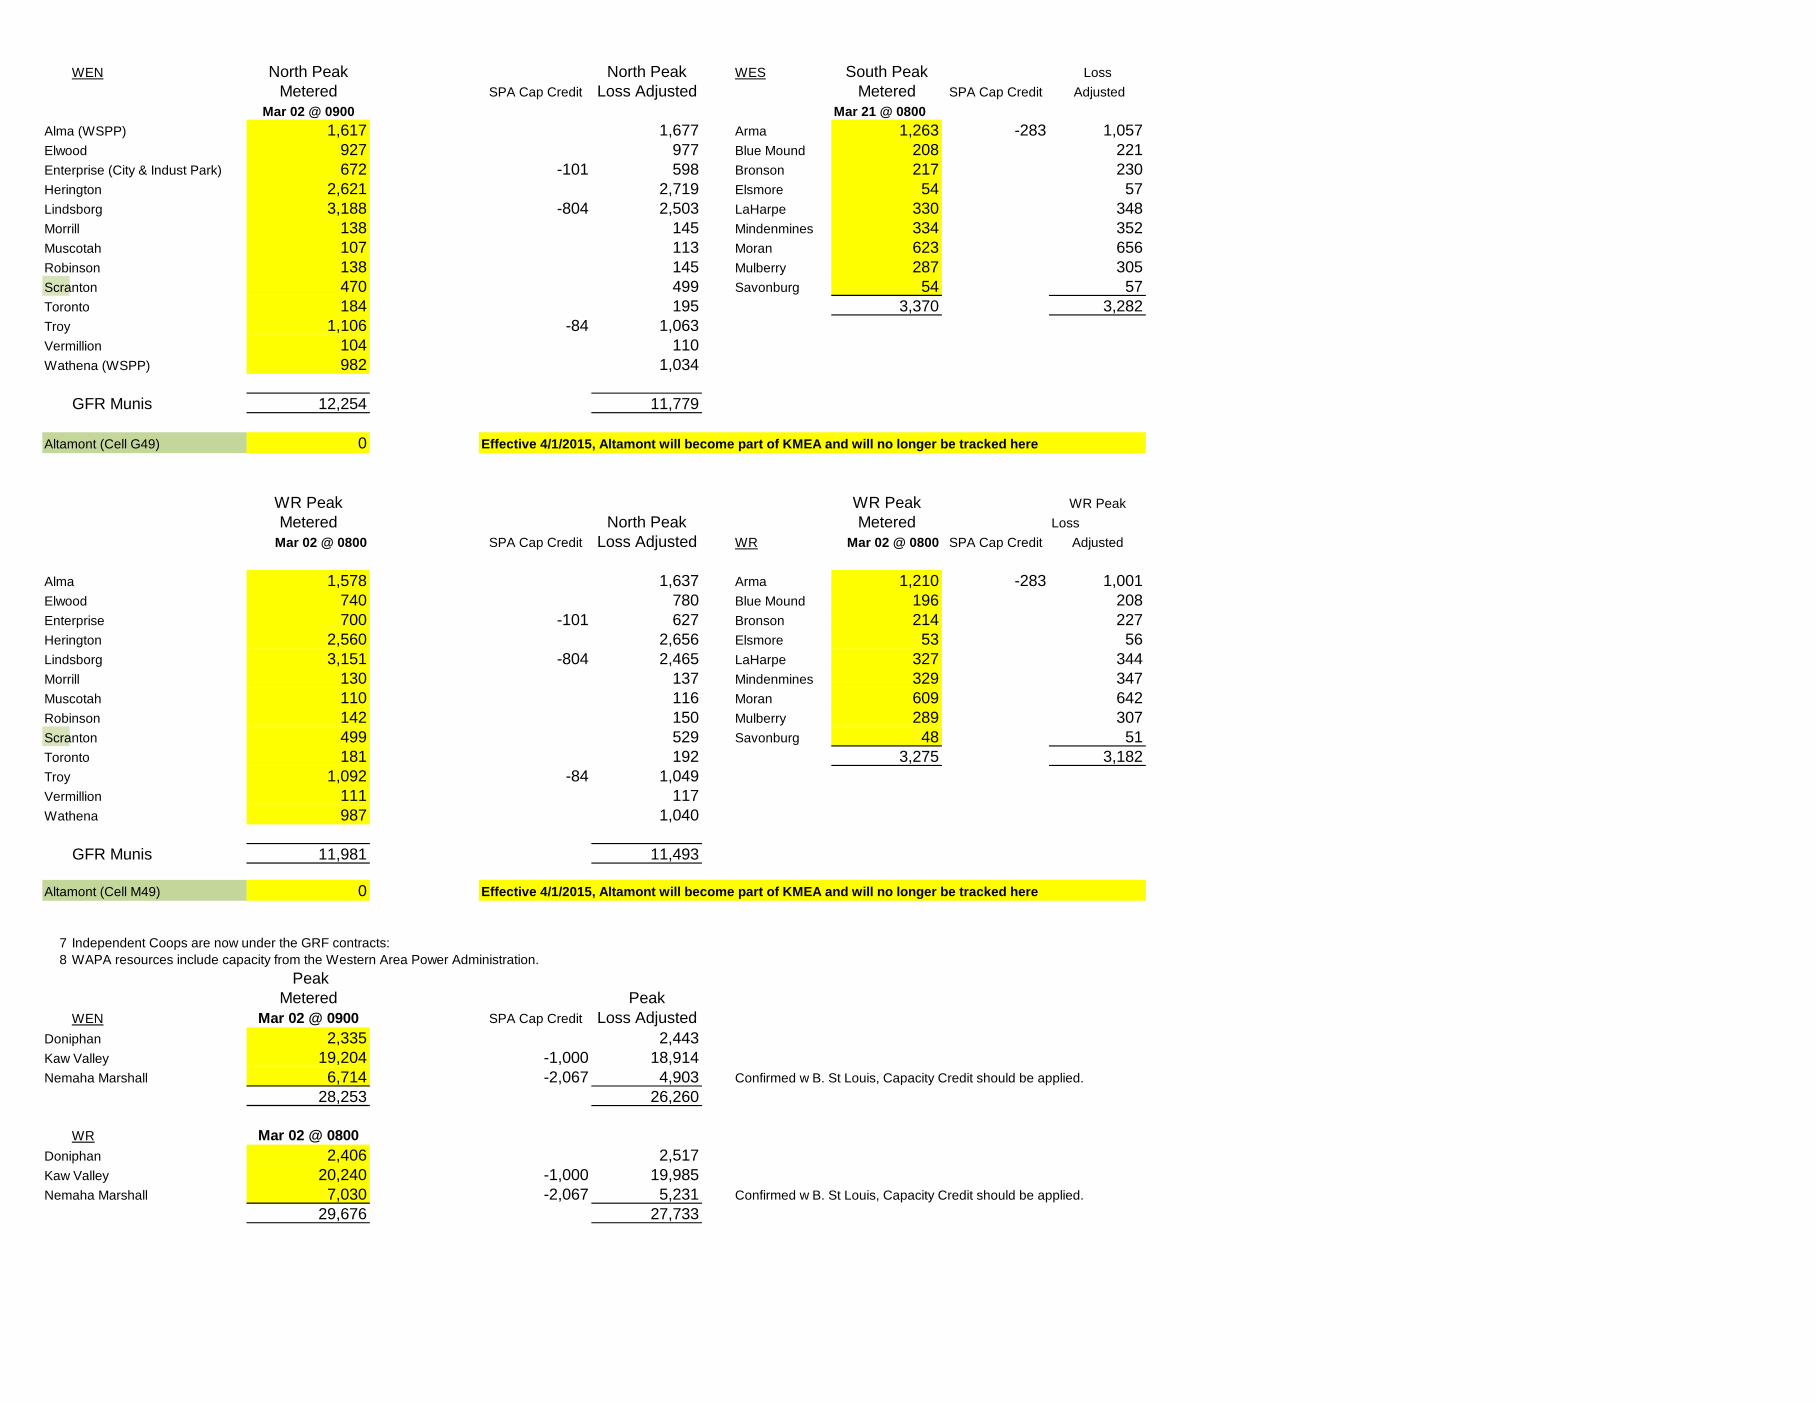
Mar 02 @ 0900 Mar 21 @ 0800Alma (WSPP) 1,617 1,677 Arma 1,263 -283 1,057Elwood 927 977 Blue Mound 208 221Enterprise (City & Indust Park) 672 -101 598 Bronson 217 230Herington 2,621 2,719 Elsmore 54 57Lindsborg 3,188 -804 2,503 LaHarpe 330 348Morrill 138 145 Mindenmines 334 352Muscotah 107 113 Moran 623 656Robinson 138 145 Mulberry 287 305Scranton 470 499 Savonburg 54 57Toronto 184 195 3,370 3,282Troy 1,106 -84 1,063Vermillion 104 110Wathena (WSPP) 982 1,034
GFR Munis 12,254 11,779
Altamont (Cell G49) 0 Effective 4/1/2015, Altamont will become part of KMEA and will no longer be tracked here
WR Peak WR Peak WR PeakMetered North Peak Metered Loss
Mar 02 @ 0800 SPA Cap Credit Loss Adjusted WR Mar 02 @ 0800 SPA Cap Credit Adjusted
Alma 1,578 1,637 Arma 1,210 -283 1,001Elwood 740 780 Blue Mound 196 208Enterprise 700 -101 627 Bronson 214 227Herington 2,560 2,656 Elsmore 53 56Lindsborg 3,151 -804 2,465 LaHarpe 327 344Morrill 130 137 Mindenmines 329 347Muscotah 110 116 Moran 609 642Robinson 142 150 Mulberry 289 307Scranton 499 529 Savonburg 48 51Toronto 181 192 3,275 3,182Troy 1,092 -84 1,049Vermillion 111 117Wathena 987 1,040
GFR Munis 11,981 11,493
Altamont (Cell M49) 0 Effective 4/1/2015, Altamont will become part of KMEA and will no longer be tracked here
7 Independent Coops are now under the GRF contracts:8 WAPA resources include capacity from the Western Area Power Administration.
PeakMetered Peak
WEN Mar 02 @ 0900 SPA Cap Credit Loss AdjustedDoniphan 2,335 2,443Kaw Valley 19,204 -1,000 18,914Nemaha Marshall 6,714 -2,067 4,903 Confirmed w B. St Louis, Capacity Credit should be applied.
28,253 26,260
WR Mar 02 @ 0800Doniphan 2,406 2,517Kaw Valley 20,240 -1,000 19,985Nemaha Marshall 7,030 -2,067 5,231 Confirmed w B. St Louis, Capacity Credit should be applied.
29,676 27,733
North Peak South Peak WR Peak Demand Peak Peak PeakMetered Metered Metered Loss Factors Loss Adjusted Loss Adjusted Loss Adjusted
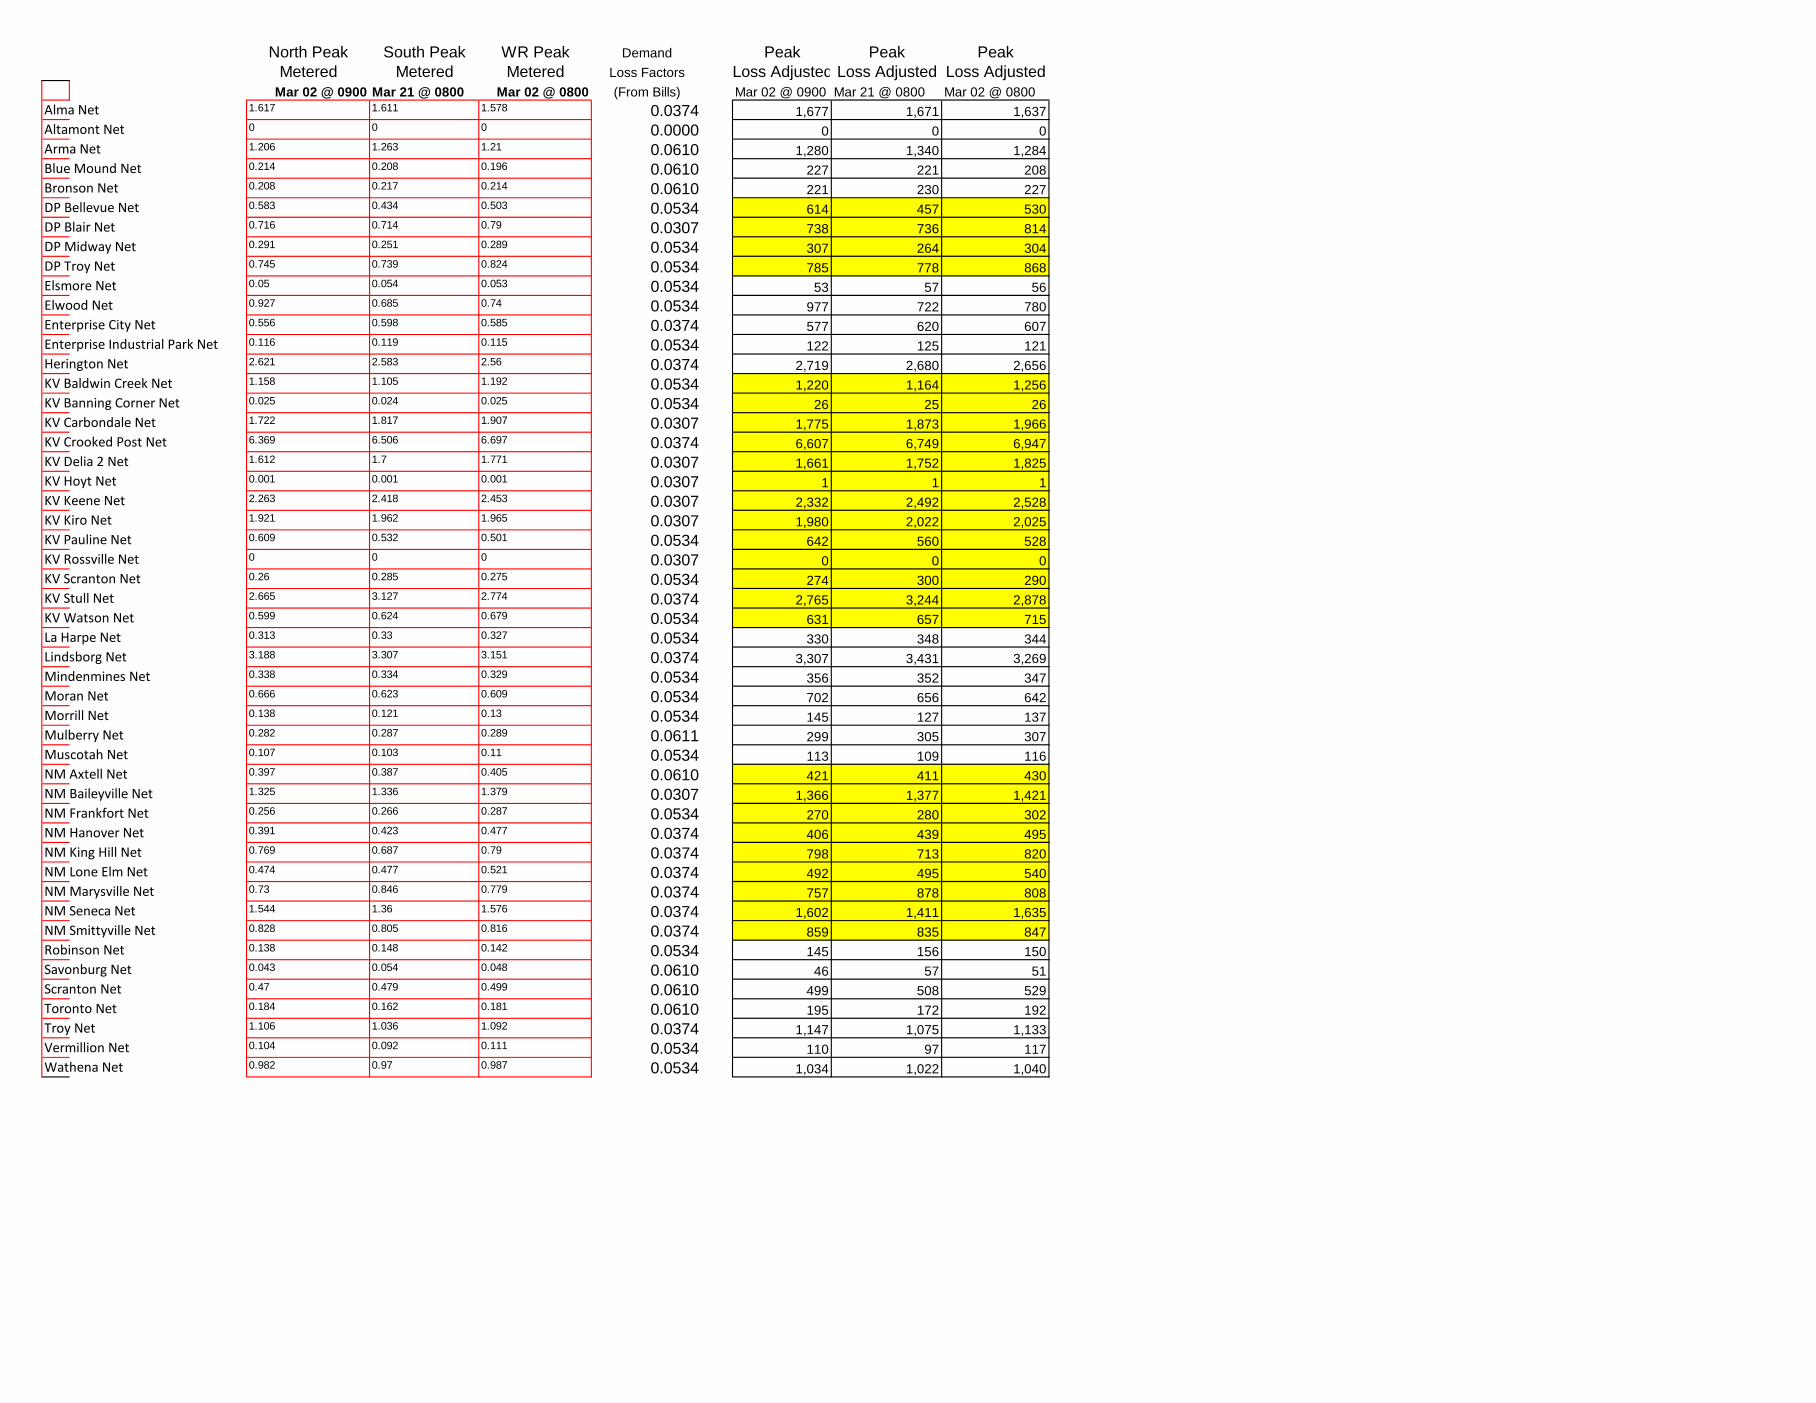
Mar 02 @ 0900 Mar 21 @ 0800 Mar 02 @ 0800 (From Bills) Mar 02 @ 0900 Mar 21 @ 0800 Mar 02 @ 0800Alma Net 1.617 1.611 1.578 0.0374 1,677 1,671 1,637Altamont Net 0 0 0 0.0000 0 0 0Arma Net 1.206 1.263 1.21 0.0610 1,280 1,340 1,284Blue Mound Net 0.214 0.208 0.196 0.0610 227 221 208Bronson Net 0.208 0.217 0.214 0.0610 221 230 227DP Bellevue Net 0.583 0.434 0.503 0.0534 614 457 530DP Blair Net 0.716 0.714 0.79 0.0307 738 736 814DP Midway Net 0.291 0.251 0.289 0.0534 307 264 304DP Troy Net 0.745 0.739 0.824 0.0534 785 778 868Elsmore Net 0.05 0.054 0.053 0.0534 53 57 56Elwood Net 0.927 0.685 0.74 0.0534 977 722 780Enterprise City Net 0.556 0.598 0.585 0.0374 577 620 607Enterprise Industrial Park Net 0.116 0.119 0.115 0.0534 122 125 121Herington Net 2.621 2.583 2.56 0.0374 2,719 2,680 2,656KV Baldwin Creek Net 1.158 1.105 1.192 0.0534 1,220 1,164 1,256KV Banning Corner Net 0.025 0.024 0.025 0.0534 26 25 26KV Carbondale Net 1.722 1.817 1.907 0.0307 1,775 1,873 1,966KV Crooked Post Net 6.369 6.506 6.697 0.0374 6,607 6,749 6,947KV Delia 2 Net 1.612 1.7 1.771 0.0307 1,661 1,752 1,825KV Hoyt Net 0.001 0.001 0.001 0.0307 1 1 1KV Keene Net 2.263 2.418 2.453 0.0307 2,332 2,492 2,528KV Kiro Net 1.921 1.962 1.965 0.0307 1,980 2,022 2,025KV Pauline Net 0.609 0.532 0.501 0.0534 642 560 528KV Rossville Net 0 0 0 0.0307 0 0 0KV Scranton Net 0.26 0.285 0.275 0.0534 274 300 290KV Stull Net 2.665 3.127 2.774 0.0374 2,765 3,244 2,878KV Watson Net 0.599 0.624 0.679 0.0534 631 657 715La Harpe Net 0.313 0.33 0.327 0.0534 330 348 344Lindsborg Net 3.188 3.307 3.151 0.0374 3,307 3,431 3,269Mindenmines Net 0.338 0.334 0.329 0.0534 356 352 347Moran Net 0.666 0.623 0.609 0.0534 702 656 642Morrill Net 0.138 0.121 0.13 0.0534 145 127 137Mulberry Net 0.282 0.287 0.289 0.0611 299 305 307Muscotah Net 0.107 0.103 0.11 0.0534 113 109 116NM Axtell Net 0.397 0.387 0.405 0.0610 421 411 430NM Baileyville Net 1.325 1.336 1.379 0.0307 1,366 1,377 1,421NM Frankfort Net 0.256 0.266 0.287 0.0534 270 280 302NM Hanover Net 0.391 0.423 0.477 0.0374 406 439 495NM King Hill Net 0.769 0.687 0.79 0.0374 798 713 820NM Lone Elm Net 0.474 0.477 0.521 0.0374 492 495 540NM Marysville Net 0.73 0.846 0.779 0.0374 757 878 808NM Seneca Net 1.544 1.36 1.576 0.0374 1,602 1,411 1,635NM Smittyville Net 0.828 0.805 0.816 0.0374 859 835 847Robinson Net 0.138 0.148 0.142 0.0534 145 156 150Savonburg Net 0.043 0.054 0.048 0.0610 46 57 51Scranton Net 0.47 0.479 0.499 0.0610 499 508 529Toronto Net 0.184 0.162 0.181 0.0610 195 172 192Troy Net 1.106 1.036 1.092 0.0374 1,147 1,075 1,133Vermillion Net 0.104 0.092 0.111 0.0534 110 97 117Wathena Net 0.982 0.97 0.987 0.0534 1,034 1,022 1,040

I) DAY/HOUR OF HIGHEST PEAK REPORT LOAD:
II) SYSTEM LOAD NET CALCULATIONNative Peak Report Load 1,586 1,520 1,584 1,520 3,104less: Kaw Valley, SPA Resources1 1000 1 0 1 0 1 Nemaha, SPA Resources1 2118 2 0 2 0 2 Lindsborg, SPA Resources1 1004 1 0 1 0 1 Enterprise, Troy & Arma Resources 219 0.2 318 0.3 0.2 0.3 1
Total Systen Load Net 1,581 1,520 1,579 1,520 3,099
III) TOTAL SYSTEM PEAK RESPONSIBILITY (TSPR)
A) FIRM PURCHASECities, GRDA Resources3 5 * 14 * 5 * 14 * 19KEPCo Resources4 129 85 129 85 214WES Cities, SPA Resources2 0 * 10 * 0 10 * 10Kaw Valley, SPA Resources2 1 0 1 0 1Nemaha, SPA Resources2 2 0 2 0 2Lindsborg, SPA Resources2 1 0 1 0 1McPherson 59 * 0 * 59 * 0 * 59Enterprise, Troy & Arma Resources8 0.2 0.3 0.2 0.3 1Total Firm Purchases 198 109 198 109 307
B) FIRM SALESCities, GRDA Resources3 5 * 14 * 5 14 19KEPCo Resources4 0 0 0 0 0Kaw Valley, SPA Resources2 1 0 1 0 1Nemaha, SPA Resources2 2 0 2 0 2Lindsborg, SPA Resources2 1 0 1 0 1WES Cities, SPA Resources2 0 * 10 * 0 10 10Enterprise, Troy & Arma Resources8 0.2 0.3 0.2 0.3 1
Total Firm Sales 9 24 9 24 34
TSPR (System Load Net - Firm Purchases + Firm Sales) 1,393 1,435 1,391 1,435 2,826
CALCULATION OF WEN & WES AND TOTAL WESTAR LOADApril 2016
Individual Companies Total WestarWestar North (WEN) Westar South (WES) WEN Contribution WES Contribution Westar Energy
Apr 26 @ 1600 Apr 26 @ 1500 Apr 26 @ 1500

IV) FERC FORM 1, PAGE 401b LOAD5
less: Non-Generating Cities6 0 0 0 0 0Independent Coops7 0 0 0 0 0Total Non-Generating Load 0 0 0 0 0
Total 401b Load (TSPR - Non Gen.) 1,393 1,435 1,391 1,435 2,826
V) RETAILless: KEPCo
KEPCo - Westar 57 70 56 70 125 KEPCo - MKEC (WPEK) 38 0 38 0 38 KEPCo - Midwest 8 0 8 0 8 KEPCo - EDE 0 1 0 1 1 KEPCo - KCPL 7 0 7 0 7
less: McPherson 119 0 121 0 121less: GFR Munis 13 3 13 3 16less: GFR Coops 21 0 22 0 22
add: KEPCo Resources4 129 85 129 85 214McPherson Resources 59 0 59 0 59
RETAIL LOAD: 1,317 1,446 1,314 1,446 2,760
VI) TOTAL SYSTEM CAPACITY RESPONSIBILITY* 1,583 1,631 1,581 1,631 3,212
Apr 26 @ 1600 Apr 26 @ 1500 Apr 26 @ 1500
Individual Companies Total WestarWestar North (WEN) Westar South (WES) WEN Contribution WES Contribution Westar Energy

VII) NOTES:* The SPP Criteria document, Section 2.1.9, references the minimum capacity margin, which is currently 12%. SPP member companies would have to approve any change to this amount. 2 SPA resources include capacity and firm energy from the Southwestern Power Administration.contract 3 GRDA resources include capacity and firm energy from the Grand River Dam Authority.4 KEPCo resources includes WCGS (Wolf Creek Generation Services), SPA (Southwestern Power Admin), Sharpe Generation, WAPA (Western Area Power Administration). They are listed on KEPCo's monthly bill.
Allocation of KEPCo Resources Maximum Proration Prorationa) KEPCo's Resources Capacity (kW) North South Effective March 2014, allocation of KEPCo's resources has been changed to WCGS 70,000 allow 100% of their resources to be allocated based on the load share SPA - Firm 100,000 shown in cells M57:M61 for WEN and O57:O61 for WES. This is due to changes Sharpe Generation 0 resulting from the new SPP market. Sharpe generation is not included. WAPA 12,000 Discussed with Julie Lux, Chris O'Neill, and Bill Birnel Iatan II 32,000 Total 214,000 129,418 84,582
North Peak South Peak WR Peak WR Peak Demand North Peak South Peak WR Peak WR PeakMetered Metered North South Loss Factors Loss Adjusted Loss AdjustedLoss AdjustedLoss AdjustedApr 26 @ 1600 Apr 26 @ 1500 Apr 26 @ 1500 Apr 26 @ 1500 (From Bills) Apr 26 @ 1600 Apr 26 @ 1500 Apr 26 @ 1500 Apr 26 @ 1500
KEPCo - MKEC (WPEK) 38 0 38 0 1.0632 40.1985 0.0000 40.7535 0.0000 KEPCo - Midwest 8 0 8 0 1.0426 8.2816 0.0000 8.3185 0.0000 KEPCo - EDE 0 1 0 1 0.0000 0.0000 1.4538 0.0000 1.4538 KEPCo - KCPL 7 0 7 0 0.0000 7.2023 0.0000 7.1519 0.0000
55.6824 1.4538 56.2239 1.4538
KEPCo - Westar -- Calculate loss Adjustments for KEPCo-Westar North and South. These values are used in the GFR Calculation on Worksheet D only. Enter only the values shown in yellow.O1 14.9995 14.6861 14.5977 14.6861 1.0307 15.4600 15.1370 15.0458 15.1370O10 -0.033 0 -0.0282 0 1.0954 -0.0361 0.0000 -0.0309 0.0000O11 -0.6796 0 -0.6853 0 1.085 -0.7374 0.0000 -0.7436 0.0000O2 23.9416 42.9504 23.3295 42.9504 1.0374 24.8370 44.5567 24.2020 44.5567O4 18.8302 10.5733 18.3028 10.5733 1.0534 19.8357 11.1379 19.2802 11.1379O5 0 1.2118 0 1.2118 1.061 0.0000 1.2857 0.0000 1.2857O6 0 0 0 0 1.0611 0.0000 0.0000 0.0000 0.0000O8 0.023 0.3557 0.0226 0.3557 1.0803 0.0248 0.3843 0.0244 0.3843O9 -0.014 0 -0.0103 0 1.0892 -0.0152 0.0000 -0.0112 0.0000Blank 0 0 0 1 0.0000 0.0000 0.0000 0.0000
KEPCo - Westar 57.0677 69.7773 55.5288 69.7773 59.3688 72.5016 57.7668 72.5016
VIII) NON-GENERATING CITIES
5 The load reported on page 401b is requirements load associated with requirement energy reported on Form 1, page 311 6 Non-Generating cities only includes the City of Altamont. It is expected to become a GFR customer effective April 1, 2015
WEN North Peak North Peak WES South Peak LossMetered SPA Cap Credit Loss Adjusted Metered SPA Cap Credit Adjusted
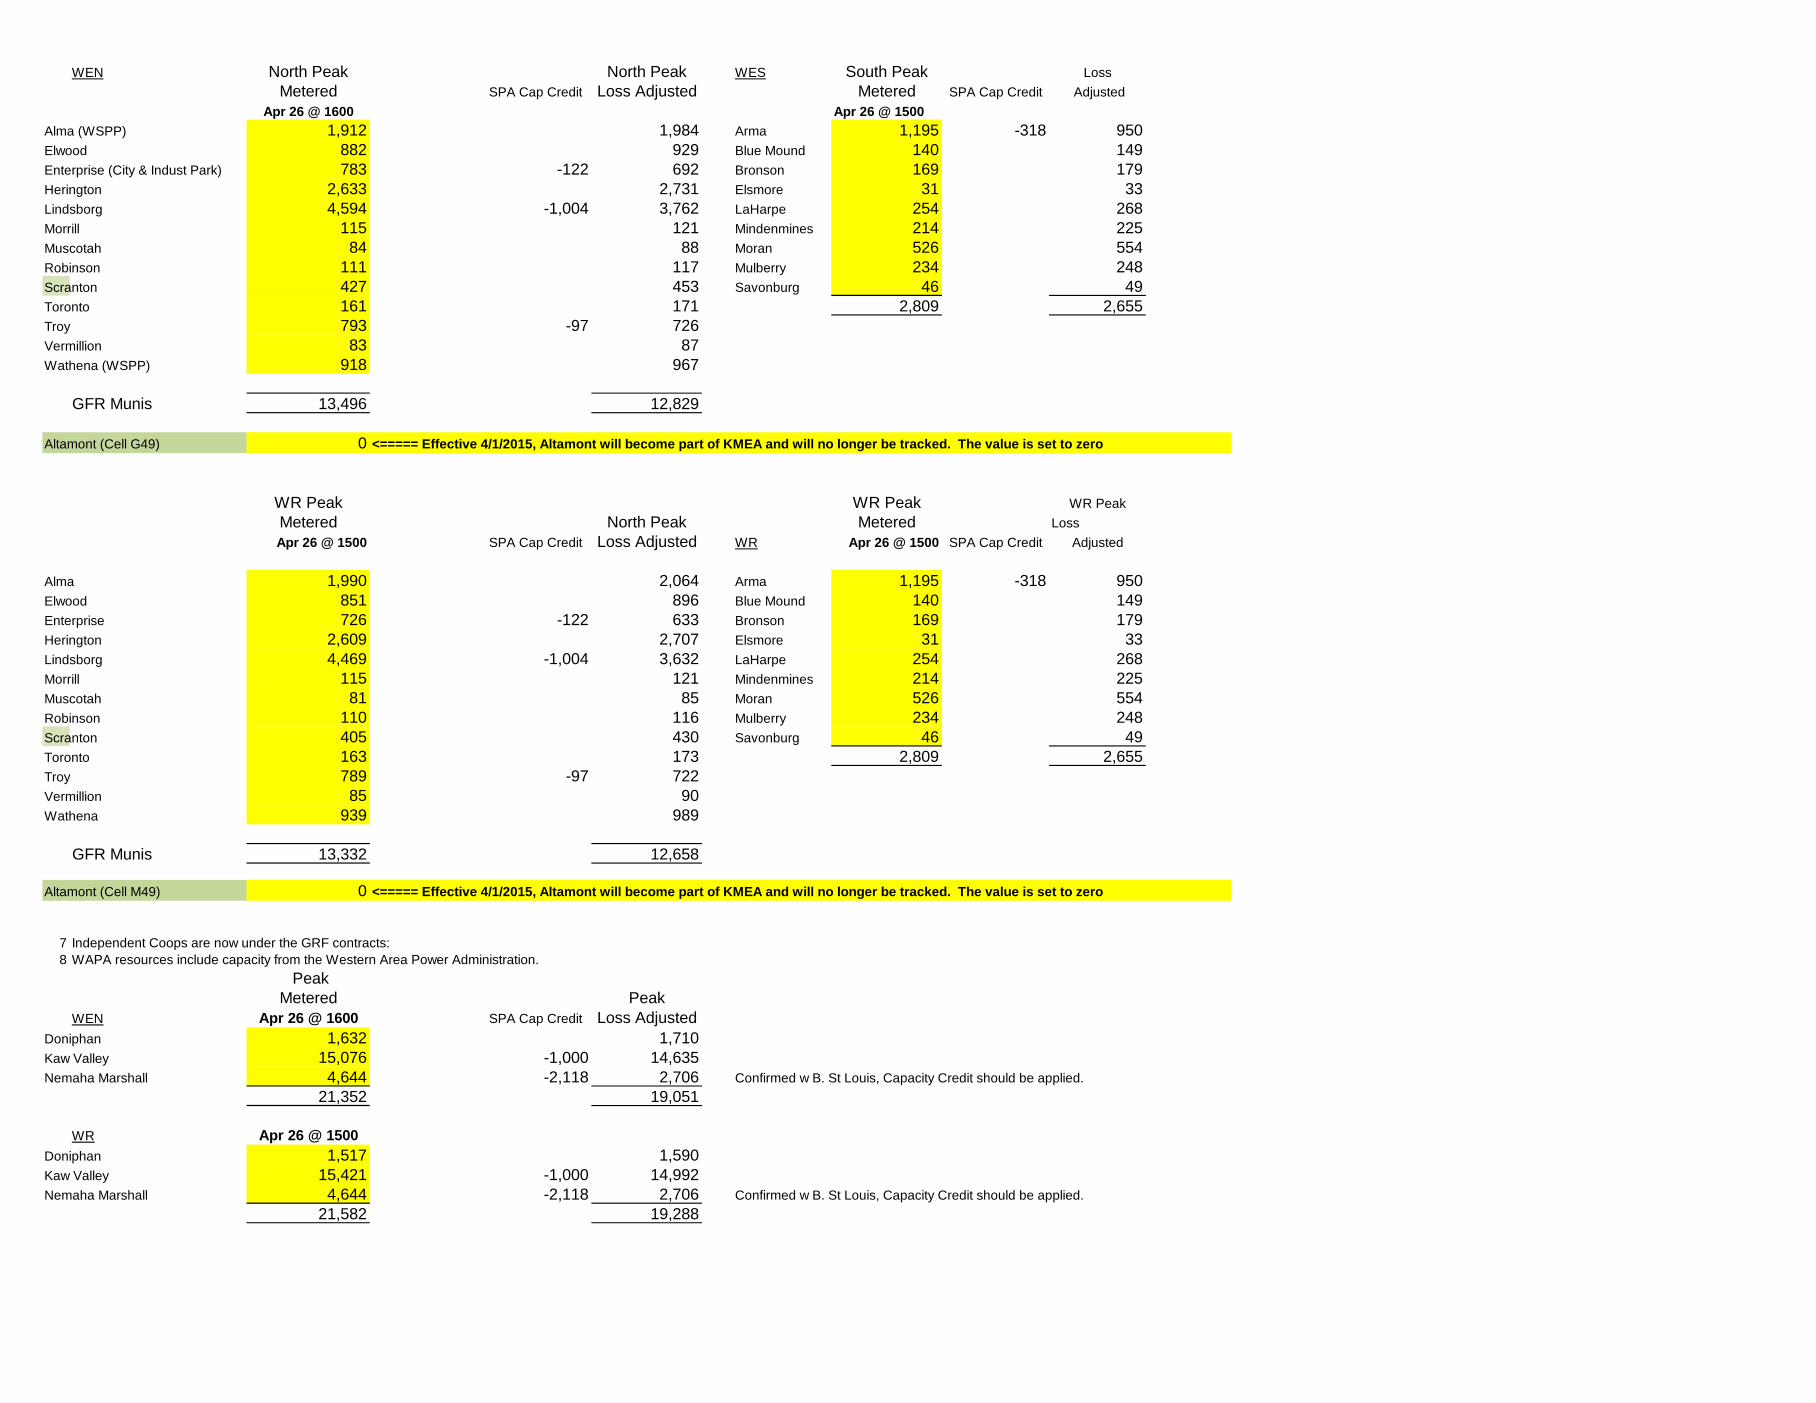
Apr 26 @ 1600 Apr 26 @ 1500Alma (WSPP) 1,912 1,984 Arma 1,195 -318 950Elwood 882 929 Blue Mound 140 149Enterprise (City & Indust Park) 783 -122 692 Bronson 169 179Herington 2,633 2,731 Elsmore 31 33Lindsborg 4,594 -1,004 3,762 LaHarpe 254 268Morrill 115 121 Mindenmines 214 225Muscotah 84 88 Moran 526 554Robinson 111 117 Mulberry 234 248Scranton 427 453 Savonburg 46 49Toronto 161 171 2,809 2,655Troy 793 -97 726Vermillion 83 87Wathena (WSPP) 918 967
GFR Munis 13,496 12,829
Altamont (Cell G49) 0 <===== Effective 4/1/2015, Altamont will become part of KMEA and will no longer be tracked. The value is set to zero
WR Peak WR Peak WR PeakMetered North Peak Metered Loss Apr 26 @ 1500 SPA Cap Credit Loss Adjusted WR Apr 26 @ 1500 SPA Cap Credit Adjusted
Alma 1,990 2,064 Arma 1,195 -318 950Elwood 851 896 Blue Mound 140 149Enterprise 726 -122 633 Bronson 169 179Herington 2,609 2,707 Elsmore 31 33Lindsborg 4,469 -1,004 3,632 LaHarpe 254 268Morrill 115 121 Mindenmines 214 225Muscotah 81 85 Moran 526 554Robinson 110 116 Mulberry 234 248Scranton 405 430 Savonburg 46 49Toronto 163 173 2,809 2,655Troy 789 -97 722Vermillion 85 90Wathena 939 989
GFR Munis 13,332 12,658
Altamont (Cell M49) 0 <===== Effective 4/1/2015, Altamont will become part of KMEA and will no longer be tracked. The value is set to zero
7 Independent Coops are now under the GRF contracts:8 WAPA resources include capacity from the Western Area Power Administration.
PeakMetered Peak
WEN Apr 26 @ 1600 SPA Cap Credit Loss AdjustedDoniphan 1,632 1,710Kaw Valley 15,076 -1,000 14,635Nemaha Marshall 4,644 -2,118 2,706 Confirmed w B. St Louis, Capacity Credit should be applied.
21,352 19,051
WR Apr 26 @ 1500Doniphan 1,517 1,590Kaw Valley 15,421 -1,000 14,992Nemaha Marshall 4,644 -2,118 2,706 Confirmed w B. St Louis, Capacity Credit should be applied.
21,582 19,288

North Peak South Peak WR Peak Demand Peak Peak PeakMetered Metered Metered Loss Factors Loss Adjusted Loss Adjusted Loss AdjustedApr 26 @ 1600 Apr 26 @ 1500 Apr 26 @ 1500 (From Bills) Apr 26 @ 1600 Apr 26 @ 1500 Apr 26 @ 1500
Alma Net 1.912 1.99 1.99 0.0374 1,984 2,064 2,064Arma Net 1.128 1.195 1.195 0.0610 1,197 1,268 1,268Blue Mound Net 0.147 0.14 0.14 0.0610 156 149 149Bronson Net 0.149 0.169 0.169 0.0610 158 179 179DP Bellevue Net 0.401 0.385 0.385 0.0534 422 406 406DP Blair Net 0.405 0.368 0.368 0.0307 417 379 379DP Midway Net 0.201 0.181 0.181 0.0534 212 191 191DP Troy Net 0.625 0.583 0.583 0.0534 658 614 614Elsmore Net 0.03 0.031 0.031 0.0534 32 33 33Elwood Net 0.882 0.851 0.851 0.0534 929 896 896Enterprise City Net 0.665 0.606 0.606 0.0374 690 629 629Enterprise Industrial Park Net 0.118 0.12 0.12 0.0534 124 126 126Herington Net 2.633 2.609 2.609 0.0374 2,731 2,707 2,707KV Baldwin Creek Net 1.022 1.007 1.007 0.0534 1,077 1,061 1,061KV Banning Corner Net 0.003 0.003 0.003 0.0534 3 3 3KV Carbondale Net 1.168 1.099 1.099 0.0307 1,204 1,133 1,133KV Crooked Post Net 5.315 5.725 5.725 0.0374 5,514 5,939 5,939KV Delia 2 Net 1.245 1.228 1.228 0.0307 1,283 1,266 1,266KV Hoyt Net 0.001 0.001 0.001 0.0307 1 1 1KV Keene Net 1.458 1.466 1.466 0.0307 1,503 1,511 1,511KV Kiro Net 1.638 1.616 1.616 0.0307 1,688 1,666 1,666KV Pauline Net 0.396 0.38 0.38 0.0534 417 400 400KV Rossville Net 0 0 0 0.0307 0 0 0KV Scranton Net 0.185 0.183 0.183 0.0534 195 193 193KV Stull Net 2.254 2.352 2.352 0.0374 2,338 2,440 2,440KV Watson Net 0.391 0.361 0.361 0.0534 412 380 380La Harpe Net 0.274 0.254 0.254 0.0534 289 268 268Lindsborg Net 4.594 4.469 4.469 0.0374 4,766 4,636 4,636Mindenmines Net 0.237 0.214 0.214 0.0534 250 225 225Moran Net 0.52 0.526 0.526 0.0534 548 554 554Morrill Net 0.115 0.115 0.115 0.0534 121 121 121Mulberry Net 0.229 0.234 0.234 0.0611 243 248 248Muscotah Net 0.084 0.081 0.081 0.0534 88 85 85NM Axtell Net 0.351 0.367 0.367 0.0610 372 389 389NM Baileyville Net 0.733 0.73 0.73 0.0307 756 752 752NM Frankfort Net 0.178 0.158 0.158 0.0534 188 166 166NM Hanover Net 0.282 0.279 0.279 0.0374 293 289 289NM King Hill Net 0.634 0.646 0.646 0.0374 658 670 670NM Lone Elm Net 0.316 0.315 0.315 0.0374 328 327 327NM Marysville Net 0.518 0.522 0.522 0.0374 537 542 542NM Seneca Net 1.119 1.129 1.129 0.0374 1,161 1,171 1,171NM Smittyville Net 0.513 0.498 0.498 0.0374 532 517 517Robinson Net 0.111 0.11 0.11 0.0534 117 116 116Savonburg Net 0.046 0.046 0.046 0.0610 49 49 49Scranton Net 0.427 0.405 0.405 0.0610 453 430 430Toronto Net 0.161 0.163 0.163 0.0610 171 173 173Troy Net 0.793 0.789 0.789 0.0374 823 819 819Vermillion Net 0.083 0.085 0.085 0.0534 87 90 90Wathena Net 0.918 0.939 0.939 0.0534 967 989 989

I) DAY/HOUR OF HIGHEST PEAK REPORT LOAD:
II) SYSTEM LOAD NET CALCULATIONNative Peak Report Load 1,845 1,706 1,845 1,706 3,551less: Kaw Valley, SPA Resources1 1000 1 0 1 0 1 Nemaha, SPA Resources1 2049 2 0 2 0 2 Lindsborg, SPA Resources1 942 1 0 1 0 1 Enterprise, Troy & Arma Resources 206 0.2 298 0.3 0.2 0.3 1
Total Systen Load Net 1,841 1,705 1,841 1,705 3,546
III) TOTAL SYSTEM PEAK RESPONSIBILITY (TSPR)
A) FIRM PURCHASECities, GRDA Resources3 5 * 14 * 5 * 14 * 19KEPCo Resources4 122 92 122 92 214WES Cities, SPA Resources2 0 * 10 * 0 10 * 10Kaw Valley, SPA Resources2 1 0 1 0 1Nemaha, SPA Resources2 2 0 2 0 2Lindsborg, SPA Resources2 1 0 1 0 1McPherson 59 * 0 * 59 * 0 * 59Enterprise, Troy & Arma Resources8 0.2 0.3 0.2 0.3 1Total Firm Purchases 190 116 190 116 306
B) FIRM SALESCities, GRDA Resources3 5 * 14 * 5 14 19KEPCo Resources4 0 0 0 0 0Kaw Valley, SPA Resources2 1 0 1 0 1Nemaha, SPA Resources2 2 0 2 0 2Lindsborg, SPA Resources2 1 0 1 0 1WES Cities, SPA Resources2 0 * 10 * 0 10 10Enterprise, Troy & Arma Resources8 0.2 0.3 0.2 0.3 1
Total Firm Sales 9 24 9 24 33
TSPR (System Load Net - Firm Purchases + Firm Sales) 1,660 1,613 1,660 1,613 3,273
May 25 @ 1800 May 25 @ 1800 May 25 @ 1800
CALCULATION OF WEN & WES AND TOTAL WESTAR LOADMay 2016
Individual Companies Total WestarWestar North (WEN) Westar South (WES) WEN Contribution WES Contribution Westar Energy

IV) FERC FORM 1, PAGE 401b LOAD5
less: Non-Generating Cities6 0 0 0 0 0Independent Coops7 0 0 0 0 0Total Non-Generating Load 0 0 0 0 0
Total 401b Load (TSPR - Non Gen.) 1,660 1,613 1,660 1,613 3,273
V) RETAILless: KEPCo
KEPCo - Westar 74 94 74 94 168 KEPCo - MKEC (WPEK) 35 0 35 0 35 KEPCo - Midwest 8 0 8 0 8 KEPCo - EDE 0 2 0 2 2 KEPCo - KCPL 9 0 9 0 9
less: McPherson 125 0 125 0 125less: GFR Munis 15 4 15 4 19less: GFR Coops 28 0 28 0 28
add: KEPCo Resources4 122 92 122 92 214McPherson Resources 59 0 59 0 59
RETAIL LOAD: 1,546 1,606 1,546 1,606 3,152
VI) TOTAL SYSTEM CAPACITY RESPONSIBILITY* 1,887 1,833 1,887 1,833 3,720
May 25 @ 1800 May 25 @ 1800 May 25 @ 1800
Individual Companies Total WestarWestar North (WEN) Westar South (WES) WEN Contribution WES Contribution Westar Energy

VII) NOTES:* The SPP Criteria document, Section 2.1.9, references the minimum capacity margin, which is currently 12%. SPP member companies would have to approve any change to this amount. 2 SPA resources include capacity and firm energy from the Southwestern Power Administration.contract 3 GRDA resources include capacity and firm energy from the Grand River Dam Authority.4 KEPCo resources includes WCGS (Wolf Creek Generation Services), SPA (Southwestern Power Admin), Sharpe Generation, WAPA (Western Area Power Administration). They are listed on KEPCo's monthly bill.
Allocation of KEPCo Resources Maximum Proration Prorationa) KEPCo's Resources Capacity (kW) North South Effective March 2014, allocation of KEPCo's resources has been changed to WCGS 70,000 allow 100% of their resources to be allocated based on the load share SPA - Firm 100,000 shown in cells M57:M61 for WEN and O57:O61 for WES. This is due to changes Sharpe Generation 0 resulting from the new SPP market. Sharpe generation is not included. WAPA 12,000 Discussed with Julie Lux, Chris O'Neill, and Bill Birnel Iatan II 32,000 Total 214,000 121,810 92,190
North Peak South Peak WR Peak WR Peak Demand North Peak South Peak WR Peak WR PeakMetered Metered North South Loss Factors Loss Adjusted Loss AdjustedLoss AdjustedLoss Adjusted
May 25 @ 1800 May 25 @ 1800 May 25 @ 1800 May 25 @ 1800 (From Bills) May 25 @ 1800 May 25 @ 1800 May 25 @ 1800 May 25 @ 1800 KEPCo - MKEC (WPEK) 35 0 35 0 1.0632 37.5635 0.0000 37.5635 0.0000 KEPCo - Midwest 8 0 8 0 1.0426 8.6534 0.0000 8.6534 0.0000 KEPCo - EDE 0 2 0 2 0.0000 0.0000 2.1680 0.0000 2.1680 KEPCo - KCPL 9 0 9 0 0.0000 8.9497 0.0000 8.9497 0.0000
55.1666 2.1680 55.1666 2.1680
KEPCo - Westar -- Calculate loss Adjustments for KEPCo-Westar North and South. These values are used in the GFR Calculation on Worksheet D only. Enter only the values shown in yellow.O1 21.5987 17.4302 21.5987 17.4302 1.0307 22.2618 17.9653 22.2618 17.9653O10 -0.0286 0 -0.0286 0 1.0954 -0.0313 0.0000 -0.0313 0.0000O11 -0.4571 0 -0.4571 0 1.085 -0.4960 0.0000 -0.4960 0.0000O2 29.524 60.5476 29.524 60.5476 1.0374 30.6282 62.8121 30.6282 62.8121O4 23.395 13.8113 23.395 13.8113 1.0534 24.6443 14.5488 24.6443 14.5488O5 0 1.4999 0 1.4999 1.061 0.0000 1.5914 0.0000 1.5914O6 0 0 0 0 1.0611 0.0000 0.0000 0.0000 0.0000O8 0.0164 0.362 0.0164 0.362 1.0803 0.0177 0.3911 0.0177 0.3911O9 -0.0242 0 -0.0242 0 1.0892 -0.0264 0.0000 -0.0264 0.0000Blank 0 0 0 0 1 0.0000 0.0000 0.0000 0.0000
KEPCo - Westar 74.0242 93.651 74.0242 93.651 76.9983 97.3087 76.9983 97.3087
VIII) NON-GENERATING CITIES
5 The load reported on page 401b is requirements load associated with requirement energy reported on Form 1, page 311 6 Non-Generating cities only includes the City of Altamont. It is expected to become a GFR customer effective April 1, 2015
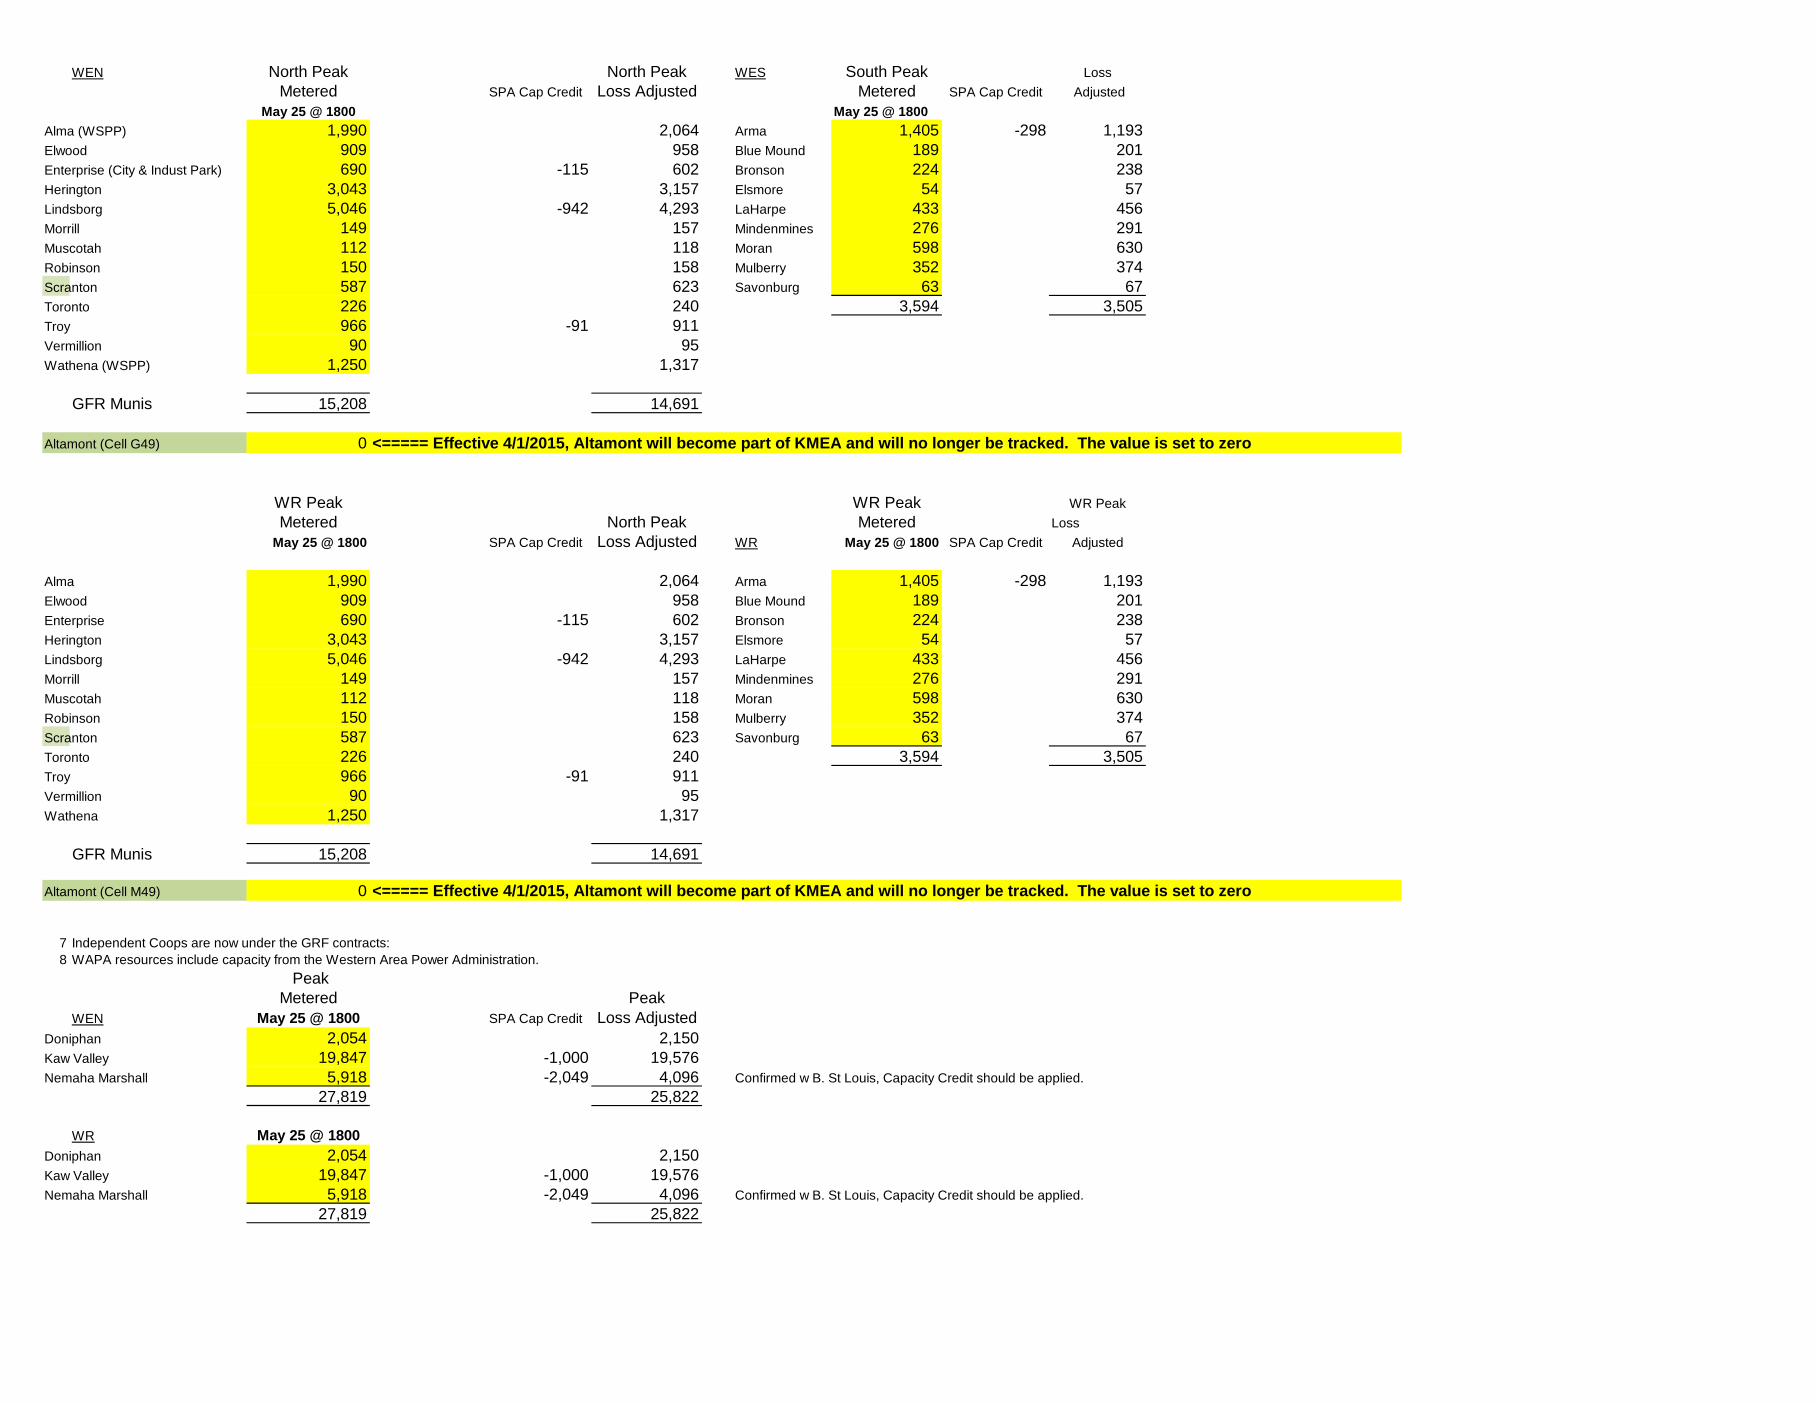
WEN North Peak North Peak WES South Peak LossMetered SPA Cap Credit Loss Adjusted Metered SPA Cap Credit Adjusted
May 25 @ 1800 May 25 @ 1800Alma (WSPP) 1,990 2,064 Arma 1,405 -298 1,193Elwood 909 958 Blue Mound 189 201Enterprise (City & Indust Park) 690 -115 602 Bronson 224 238Herington 3,043 3,157 Elsmore 54 57Lindsborg 5,046 -942 4,293 LaHarpe 433 456Morrill 149 157 Mindenmines 276 291Muscotah 112 118 Moran 598 630Robinson 150 158 Mulberry 352 374Scranton 587 623 Savonburg 63 67Toronto 226 240 3,594 3,505Troy 966 -91 911Vermillion 90 95Wathena (WSPP) 1,250 1,317
GFR Munis 15,208 14,691
Altamont (Cell G49) 0 <===== Effective 4/1/2015, Altamont will become part of KMEA and will no longer be tracked. The value is set to zero
WR Peak WR Peak WR PeakMetered North Peak Metered Loss
May 25 @ 1800 SPA Cap Credit Loss Adjusted WR May 25 @ 1800 SPA Cap Credit Adjusted
Alma 1,990 2,064 Arma 1,405 -298 1,193Elwood 909 958 Blue Mound 189 201Enterprise 690 -115 602 Bronson 224 238Herington 3,043 3,157 Elsmore 54 57Lindsborg 5,046 -942 4,293 LaHarpe 433 456Morrill 149 157 Mindenmines 276 291Muscotah 112 118 Moran 598 630Robinson 150 158 Mulberry 352 374Scranton 587 623 Savonburg 63 67Toronto 226 240 3,594 3,505Troy 966 -91 911Vermillion 90 95Wathena 1,250 1,317
GFR Munis 15,208 14,691
Altamont (Cell M49) 0 <===== Effective 4/1/2015, Altamont will become part of KMEA and will no longer be tracked. The value is set to zero
7 Independent Coops are now under the GRF contracts:8 WAPA resources include capacity from the Western Area Power Administration.
PeakMetered Peak
WEN May 25 @ 1800 SPA Cap Credit Loss AdjustedDoniphan 2,054 2,150Kaw Valley 19,847 -1,000 19,576Nemaha Marshall 5,918 -2,049 4,096 Confirmed w B. St Louis, Capacity Credit should be applied.
27,819 25,822
WR May 25 @ 1800Doniphan 2,054 2,150Kaw Valley 19,847 -1,000 19,576Nemaha Marshall 5,918 -2,049 4,096 Confirmed w B. St Louis, Capacity Credit should be applied.
27,819 25,822

North Peak South Peak WR Peak Demand Peak Peak PeakMetered Metered Metered Loss Factors Loss Adjusted Loss Adjusted Loss Adjusted
May 25 @ 1800 May 25 @ 1800 May 25 @ 1800 (From Bills) May 25 @ 1800 May 25 @ 1800 May 25 @ 1800Alma Net 1.99 1.99 1.99 0.0374 2,064 2,064 2,064Arma Net 1.405 1.405 1.405 0.0610 1,491 1,491 1,491Blue Mound Net 0.189 0.189 0.189 0.0610 201 201 201Bronson Net 0.224 0.224 0.224 0.0610 238 238 238DP Bellevue Net 0.354 0.354 0.354 0.0534 373 373 373DP Blair Net 0.585 0.585 0.585 0.0307 603 603 603DP Midway Net 0.231 0.231 0.231 0.0534 243 243 243DP Troy Net 0.884 0.884 0.884 0.0534 931 931 931Elsmore Net 0.054 0.054 0.054 0.0534 57 57 57Elwood Net 0.909 0.909 0.909 0.0534 958 958 958Enterprise City Net 0.643 0.643 0.643 0.0374 667 667 667Enterprise Industrial Park Net 0.047 0.047 0.047 0.0534 50 50 50Herington Net 3.043 3.043 3.043 0.0374 3,157 3,157 3,157KV Baldwin Creek Net 1.103 1.103 1.103 0.0534 1,162 1,162 1,162KV Banning Corner Net 0.003 0.003 0.003 0.0534 3 3 3KV Carbondale Net 1.855 1.855 1.855 0.0307 1,912 1,912 1,912KV Crooked Post Net 7.216 7.216 7.216 0.0374 7,486 7,486 7,486KV Delia 2 Net 1.758 1.758 1.758 0.0307 1,812 1,812 1,812KV Hoyt Net 0.001 0.001 0.001 0.0307 1 1 1KV Keene Net 1.978 1.978 1.978 0.0307 2,039 2,039 2,039KV Kiro Net 2.187 2.187 2.187 0.0307 2,254 2,254 2,254KV Pauline Net 0.375 0.375 0.375 0.0534 395 395 395KV Rossville Net 0 0 0 0.0307 0 0 0KV Scranton Net 0.276 0.276 0.276 0.0534 291 291 291KV Stull Net 2.438 2.438 2.438 0.0374 2,529 2,529 2,529KV Watson Net 0.657 0.657 0.657 0.0534 692 692 692La Harpe Net 0.433 0.433 0.433 0.0534 456 456 456Lindsborg Net 5.046 5.046 5.046 0.0374 5,235 5,235 5,235Mindenmines Net 0.276 0.276 0.276 0.0534 291 291 291Moran Net 0.598 0.598 0.598 0.0534 630 630 630Morrill Net 0.149 0.149 0.149 0.0534 157 157 157Mulberry Net 0.352 0.352 0.352 0.0611 374 374 374Muscotah Net 0.112 0.112 0.112 0.0534 118 118 118NM Axtell Net 0.391 0.391 0.391 0.0610 415 415 415NM Baileyville Net 1.085 1.085 1.085 0.0307 1,118 1,118 1,118NM Frankfort Net 0.209 0.209 0.209 0.0534 220 220 220NM Hanover Net 0.375 0.375 0.375 0.0374 389 389 389NM King Hill Net 0.735 0.735 0.735 0.0374 762 762 762NM Lone Elm Net 0.429 0.429 0.429 0.0374 445 445 445NM Marysville Net 0.73 0.73 0.73 0.0374 757 757 757NM Seneca Net 1.231 1.231 1.231 0.0374 1,277 1,277 1,277NM Smittyville Net 0.733 0.733 0.733 0.0374 760 760 760Robinson Net 0.15 0.15 0.15 0.0534 158 158 158Savonburg Net 0.063 0.063 0.063 0.0610 67 67 67Scranton Net 0.587 0.587 0.587 0.0610 623 623 623Toronto Net 0.226 0.226 0.226 0.0610 240 240 240Troy Net 0.966 0.966 0.966 0.0374 1,002 1,002 1,002Vermillion Net 0.09 0.09 0.09 0.0534 95 95 95Wathena Net 1.25 1.25 1.25 0.0534 1,317 1,317 1,317

I) DAY/HOUR OF HIGHEST PEAK REPORT LOAD:
II) SYSTEM LOAD NET CALCULATIONNative Peak Report Load 2,782 2,321 2,782 2,318 5,101less: Kaw Valley, SPA Resources1 1000 1 0 1 0 1 Nemaha, SPA Resources1 2259 2 0 2 0 2 Lindsborg, SPA Resources1 1130 1 0 1 0 1 Enterprise, Troy & Arma Resources 248 0.2 358 0.4 0.2 0.4 1
Total Systen Load Net 2,778 2,320 2,778 2,318 5,096
III) TOTAL SYSTEM PEAK RESPONSIBILITY (TSPR)
A) FIRM PURCHASECities, GRDA Resources3 5 * 14 * 5 * 14 * 19KEPCo Resources4 130 84 130 84 214WES Cities, SPA Resources2 0 * 10 * 0 10 * 10Kaw Valley, SPA Resources2 1 0 1 0 1Nemaha, SPA Resources2 2 0 2 0 2Lindsborg, SPA Resources2 1 0 1 0 1McPherson 57 * 0 * 57 * 0 * 57Enterprise, Troy & Arma Resources8 0.2 0.4 0.2 0.4 1Total Firm Purchases 197 109 197 109 305
B) FIRM SALESCities, GRDA Resources3 5 * 14 * 5 14 19KEPCo Resources4 0 0 0 0 0Kaw Valley, SPA Resources2 1 0 1 0 1Nemaha, SPA Resources2 2 0 2 0 2Lindsborg, SPA Resources2 1 0 1 0 1WES Cities, SPA Resources2 0 * 10 * 0 10 10Enterprise, Troy & Arma Resources8 0.2 0.4 0.2 0.4 1
Total Firm Sales 10 24 10 24 34
TSPR (System Load Net - Firm Purchases + Firm Sales) 2,591 2,236 2,591 2,234 4,824
CALCULATION OF WEN & WES AND TOTAL WESTAR LOADJune 2016
Individual Companies Total WestarWestar North (WEN) Westar South (WES) WEN Contribution WES Contribution Westar Energy
Jun 22 @ 1700 Jun 15 @ 1600 Jun 22 @ 1700
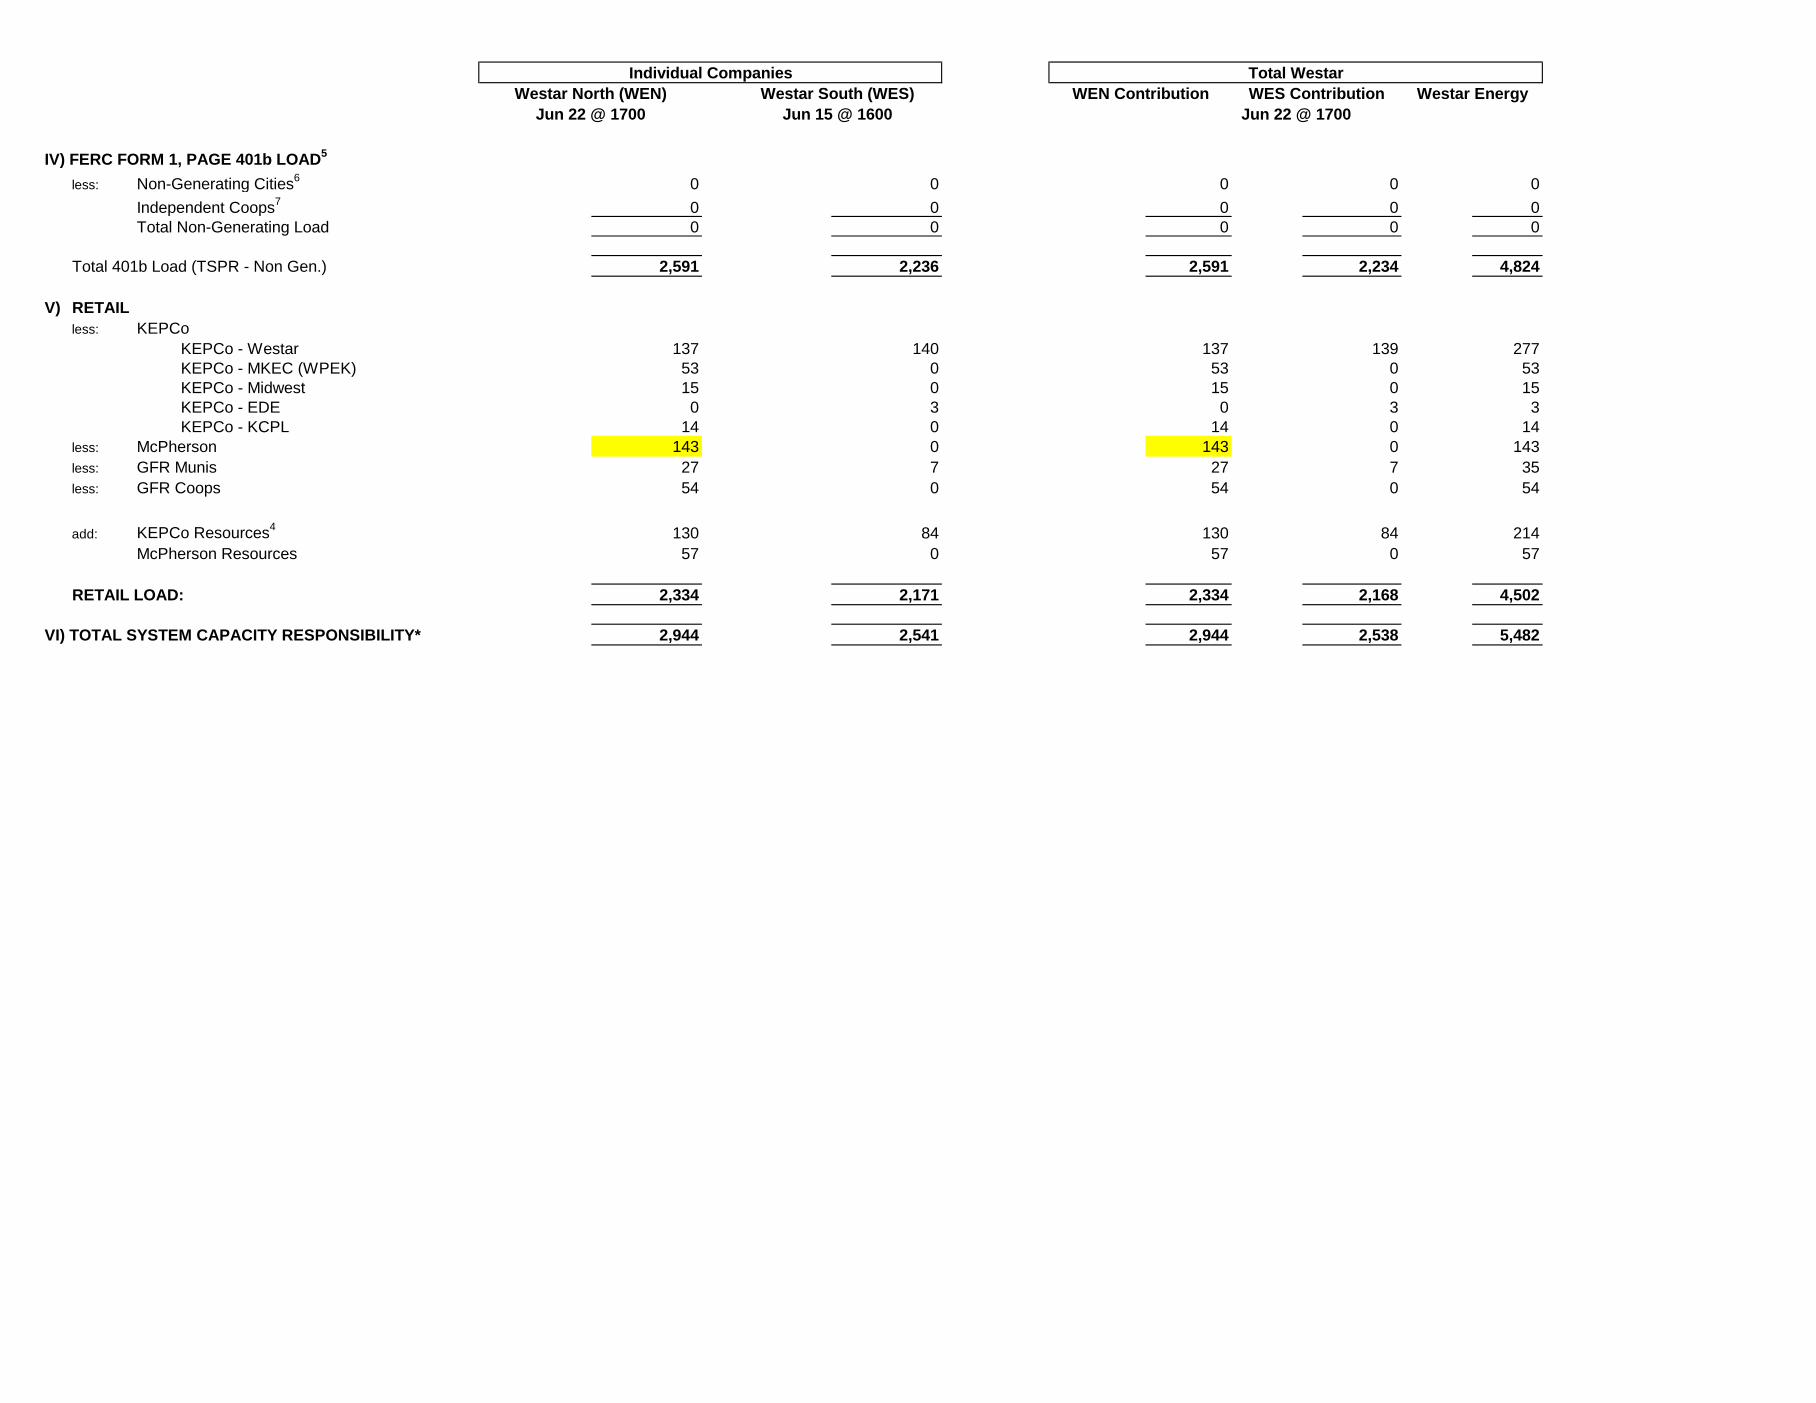
IV) FERC FORM 1, PAGE 401b LOAD5
less: Non-Generating Cities6 0 0 0 0 0Independent Coops7 0 0 0 0 0Total Non-Generating Load 0 0 0 0 0
Total 401b Load (TSPR - Non Gen.) 2,591 2,236 2,591 2,234 4,824
V) RETAILless: KEPCo
KEPCo - Westar 137 140 137 139 277 KEPCo - MKEC (WPEK) 53 0 53 0 53 KEPCo - Midwest 15 0 15 0 15 KEPCo - EDE 0 3 0 3 3 KEPCo - KCPL 14 0 14 0 14
less: McPherson 143 0 143 0 143less: GFR Munis 27 7 27 7 35less: GFR Coops 54 0 54 0 54
add: KEPCo Resources4 130 84 130 84 214McPherson Resources 57 0 57 0 57
RETAIL LOAD: 2,334 2,171 2,334 2,168 4,502
VI) TOTAL SYSTEM CAPACITY RESPONSIBILITY* 2,944 2,541 2,944 2,538 5,482
Jun 22 @ 1700 Jun 15 @ 1600 Jun 22 @ 1700
Individual Companies Total WestarWestar North (WEN) Westar South (WES) WEN Contribution WES Contribution Westar Energy
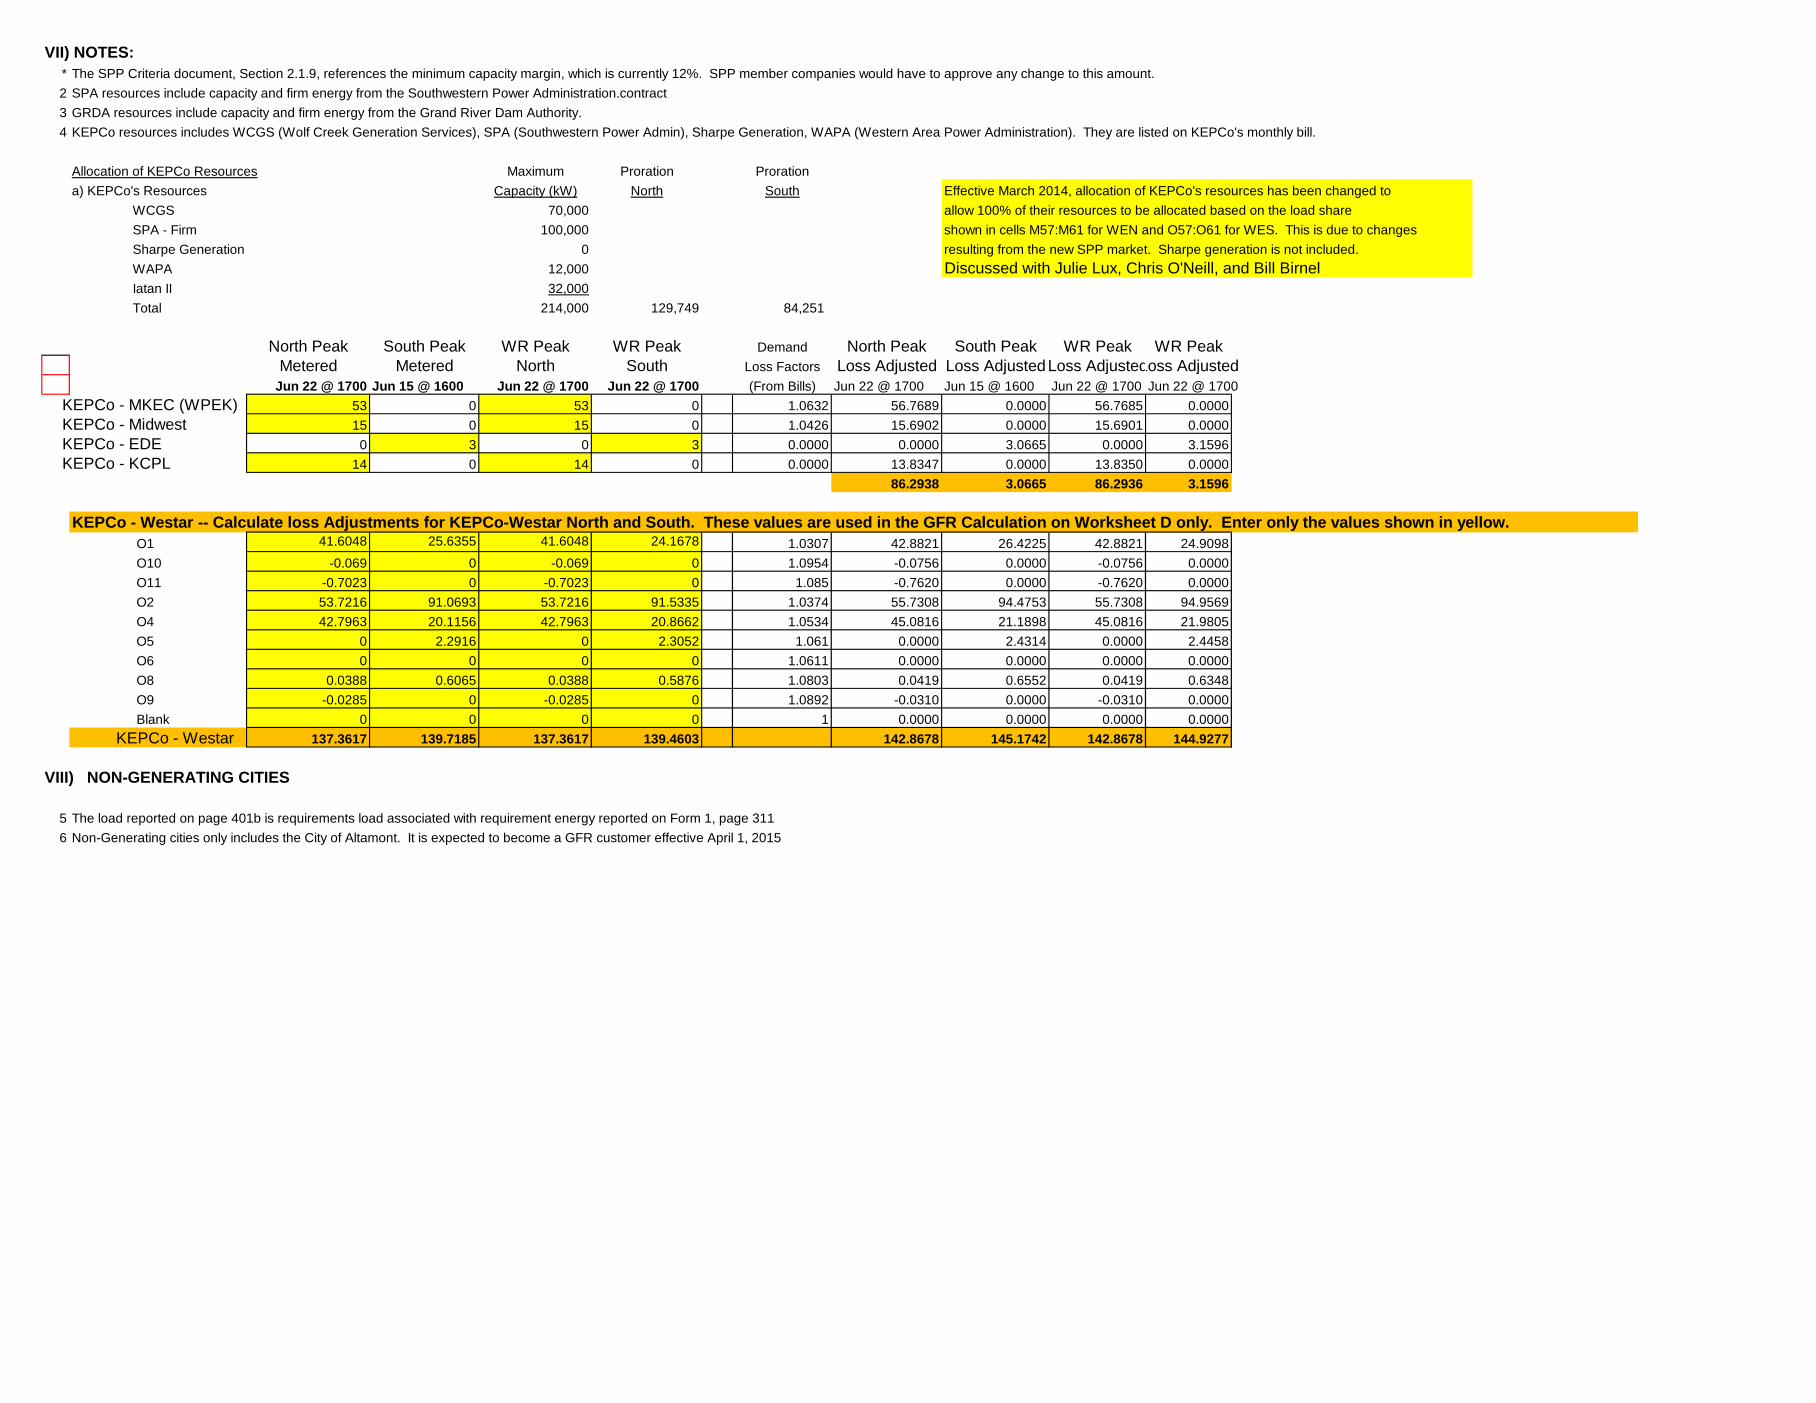
VII) NOTES:* The SPP Criteria document, Section 2.1.9, references the minimum capacity margin, which is currently 12%. SPP member companies would have to approve any change to this amount. 2 SPA resources include capacity and firm energy from the Southwestern Power Administration.contract 3 GRDA resources include capacity and firm energy from the Grand River Dam Authority.4 KEPCo resources includes WCGS (Wolf Creek Generation Services), SPA (Southwestern Power Admin), Sharpe Generation, WAPA (Western Area Power Administration). They are listed on KEPCo's monthly bill.
Allocation of KEPCo Resources Maximum Proration Prorationa) KEPCo's Resources Capacity (kW) North South Effective March 2014, allocation of KEPCo's resources has been changed to WCGS 70,000 allow 100% of their resources to be allocated based on the load share SPA - Firm 100,000 shown in cells M57:M61 for WEN and O57:O61 for WES. This is due to changes Sharpe Generation 0 resulting from the new SPP market. Sharpe generation is not included. WAPA 12,000 Discussed with Julie Lux, Chris O'Neill, and Bill Birnel Iatan II 32,000 Total 214,000 129,749 84,251
North Peak South Peak WR Peak WR Peak Demand North Peak South Peak WR Peak WR PeakMetered Metered North South Loss Factors Loss Adjusted Loss AdjustedLoss AdjustedLoss Adjusted
Jun 22 @ 1700 Jun 15 @ 1600 Jun 22 @ 1700 Jun 22 @ 1700 (From Bills) Jun 22 @ 1700 Jun 15 @ 1600 Jun 22 @ 1700 Jun 22 @ 1700 KEPCo - MKEC (WPEK) 53 0 53 0 1.0632 56.7689 0.0000 56.7685 0.0000 KEPCo - Midwest 15 0 15 0 1.0426 15.6902 0.0000 15.6901 0.0000 KEPCo - EDE 0 3 0 3 0.0000 0.0000 3.0665 0.0000 3.1596 KEPCo - KCPL 14 0 14 0 0.0000 13.8347 0.0000 13.8350 0.0000
86.2938 3.0665 86.2936 3.1596
KEPCo - Westar -- Calculate loss Adjustments for KEPCo-Westar North and South. These values are used in the GFR Calculation on Worksheet D only. Enter only the values shown in yellow.O1 41.6048 25.6355 41.6048 24.1678 1.0307 42.8821 26.4225 42.8821 24.9098O10 -0.069 0 -0.069 0 1.0954 -0.0756 0.0000 -0.0756 0.0000O11 -0.7023 0 -0.7023 0 1.085 -0.7620 0.0000 -0.7620 0.0000O2 53.7216 91.0693 53.7216 91.5335 1.0374 55.7308 94.4753 55.7308 94.9569O4 42.7963 20.1156 42.7963 20.8662 1.0534 45.0816 21.1898 45.0816 21.9805O5 0 2.2916 0 2.3052 1.061 0.0000 2.4314 0.0000 2.4458O6 0 0 0 0 1.0611 0.0000 0.0000 0.0000 0.0000O8 0.0388 0.6065 0.0388 0.5876 1.0803 0.0419 0.6552 0.0419 0.6348O9 -0.0285 0 -0.0285 0 1.0892 -0.0310 0.0000 -0.0310 0.0000Blank 0 0 0 0 1 0.0000 0.0000 0.0000 0.0000
KEPCo - Westar 137.3617 139.7185 137.3617 139.4603 142.8678 145.1742 142.8678 144.9277
VIII) NON-GENERATING CITIES
5 The load reported on page 401b is requirements load associated with requirement energy reported on Form 1, page 311 6 Non-Generating cities only includes the City of Altamont. It is expected to become a GFR customer effective April 1, 2015
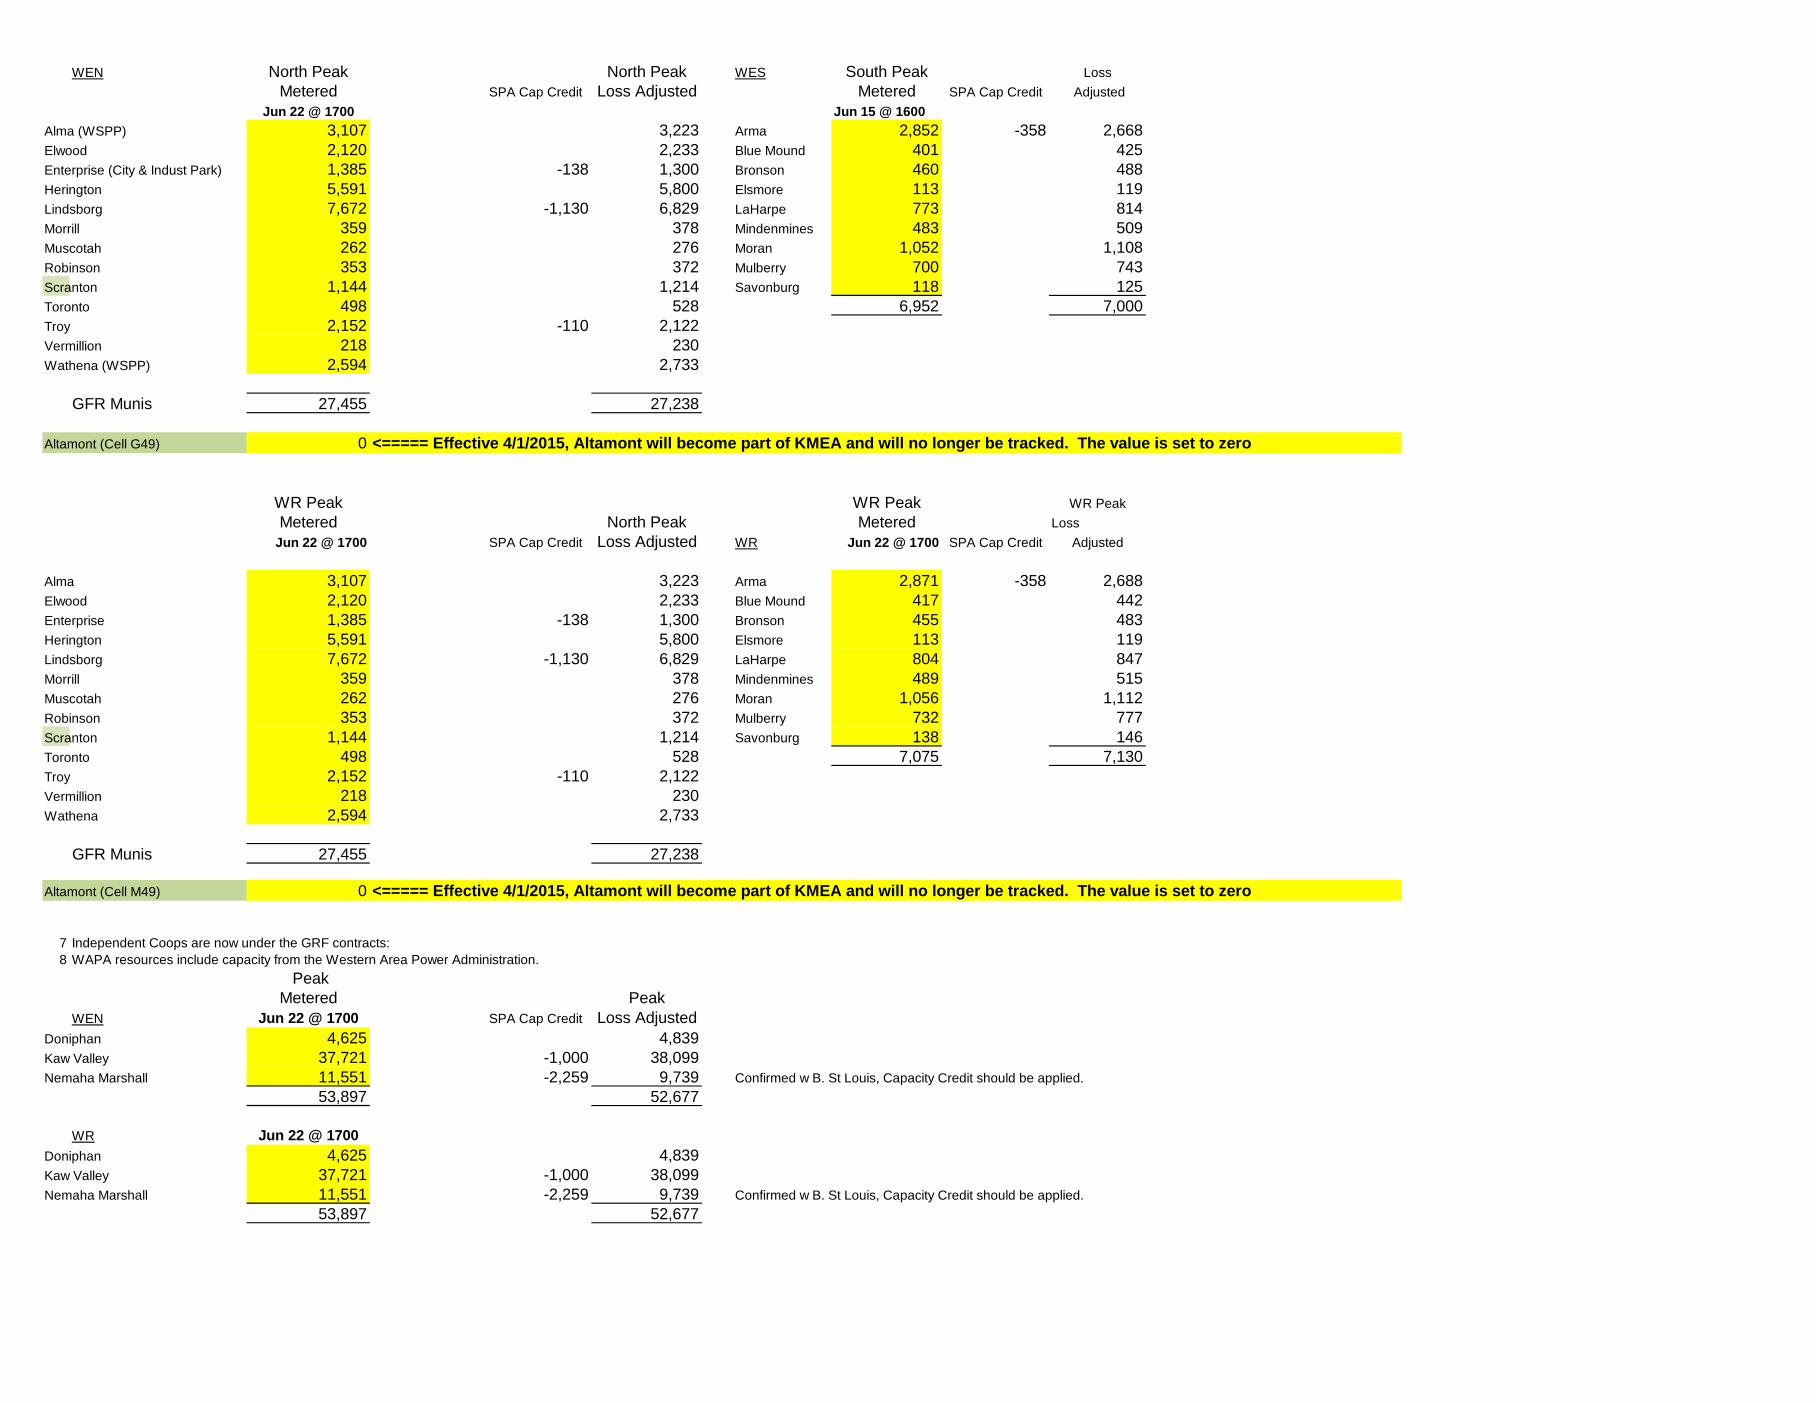
WEN North Peak North Peak WES South Peak LossMetered SPA Cap Credit Loss Adjusted Metered SPA Cap Credit Adjusted
Jun 22 @ 1700 Jun 15 @ 1600Alma (WSPP) 3,107 3,223 Arma 2,852 -358 2,668Elwood 2,120 2,233 Blue Mound 401 425Enterprise (City & Indust Park) 1,385 -138 1,300 Bronson 460 488Herington 5,591 5,800 Elsmore 113 119Lindsborg 7,672 -1,130 6,829 LaHarpe 773 814Morrill 359 378 Mindenmines 483 509Muscotah 262 276 Moran 1,052 1,108Robinson 353 372 Mulberry 700 743Scranton 1,144 1,214 Savonburg 118 125Toronto 498 528 6,952 7,000Troy 2,152 -110 2,122Vermillion 218 230Wathena (WSPP) 2,594 2,733
GFR Munis 27,455 27,238
Altamont (Cell G49) 0 <===== Effective 4/1/2015, Altamont will become part of KMEA and will no longer be tracked. The value is set to zero
WR Peak WR Peak WR PeakMetered North Peak Metered Loss
Jun 22 @ 1700 SPA Cap Credit Loss Adjusted WR Jun 22 @ 1700 SPA Cap Credit Adjusted
Alma 3,107 3,223 Arma 2,871 -358 2,688Elwood 2,120 2,233 Blue Mound 417 442Enterprise 1,385 -138 1,300 Bronson 455 483Herington 5,591 5,800 Elsmore 113 119Lindsborg 7,672 -1,130 6,829 LaHarpe 804 847Morrill 359 378 Mindenmines 489 515Muscotah 262 276 Moran 1,056 1,112Robinson 353 372 Mulberry 732 777Scranton 1,144 1,214 Savonburg 138 146Toronto 498 528 7,075 7,130Troy 2,152 -110 2,122Vermillion 218 230Wathena 2,594 2,733
GFR Munis 27,455 27,238
Altamont (Cell M49) 0 <===== Effective 4/1/2015, Altamont will become part of KMEA and will no longer be tracked. The value is set to zero
7 Independent Coops are now under the GRF contracts:8 WAPA resources include capacity from the Western Area Power Administration.
PeakMetered Peak
WEN Jun 22 @ 1700 SPA Cap Credit Loss AdjustedDoniphan 4,625 4,839Kaw Valley 37,721 -1,000 38,099Nemaha Marshall 11,551 -2,259 9,739 Confirmed w B. St Louis, Capacity Credit should be applied.
53,897 52,677
WR Jun 22 @ 1700Doniphan 4,625 4,839Kaw Valley 37,721 -1,000 38,099Nemaha Marshall 11,551 -2,259 9,739 Confirmed w B. St Louis, Capacity Credit should be applied.
53,897 52,677

North Peak South Peak WR Peak Demand Peak Peak PeakMetered Metered Metered Loss Factors Loss Adjusted Loss Adjusted Loss Adjusted
Jun 22 @ 1700 Jun 15 @ 1600 Jun 22 @ 1700 (From Bills) Jun 22 @ 1700 Jun 15 @ 1600 Jun 22 @ 1700Alma Net 3.107 2.861 3.107 0.0374 3,223 2,968 3,223Arma Net 2.871 2.852 2.871 0.0610 3,046 3,026 3,046Blue Mound Net 0.417 0.401 0.417 0.0610 442 425 442Bronson Net 0.455 0.46 0.455 0.0610 483 488 483DP Bellevue Net 0.641 0.587 0.641 0.0534 675 618 675DP Blair Net 1.451 1.292 1.451 0.0307 1,496 1,332 1,496DP Midway Net 0.633 0.555 0.633 0.0534 667 585 667DP Troy Net 1.9 1.748 1.9 0.0534 2,001 1,841 2,001Elsmore Net 0.113 0.113 0.113 0.0534 119 119 119Elwood Net 2.12 2.089 2.12 0.0534 2,233 2,201 2,233Enterprise City Net 1.297 1.442 1.297 0.0374 1,346 1,496 1,346Enterprise Industrial Park Net 0.088 0.115 0.088 0.0534 93 121 93Herington Net 5.591 4.971 5.591 0.0374 5,800 5,157 5,800KV Baldwin Creek Net 1.959 1.875 1.959 0.0534 2,064 1,975 2,064KV Banning Corner Net 0.003 0.003 0.003 0.0534 3 3 3KV Carbondale Net 3.719 3.391 3.719 0.0307 3,833 3,495 3,833KV Crooked Post Net 13.123 12.412 13.123 0.0374 13,614 12,876 13,614KV Delia 2 Net 3.663 3.002 3.663 0.0307 3,775 3,094 3,775KV Hoyt Net 0 0 0 0.0307 0 0 0KV Keene Net 3.863 3.54 3.863 0.0307 3,982 3,649 3,982KV Kiro Net 4.296 3.665 4.296 0.0307 4,428 3,778 4,428KV Pauline Net 0.679 0.648 0.679 0.0534 715 683 715KV Rossville Net 0 0 0 0.0307 0 0 0KV Scranton Net 0.572 0.499 0.572 0.0534 603 526 603KV Stull Net 4.576 4.327 4.576 0.0374 4,747 4,489 4,747KV Watson Net 1.268 1.153 1.268 0.0534 1,336 1,215 1,336La Harpe Net 0.804 0.773 0.804 0.0534 847 814 847Lindsborg Net 7.672 7.891 7.672 0.0374 7,959 8,186 7,959Mindenmines Net 0.489 0.483 0.489 0.0534 515 509 515Moran Net 1.056 1.052 1.056 0.0534 1,112 1,108 1,112Morrill Net 0.359 0.34 0.359 0.0534 378 358 378Mulberry Net 0.732 0.7 0.732 0.0611 777 743 777Muscotah Net 0.262 0.235 0.262 0.0534 276 248 276NM Axtell Net 0.842 0.762 0.842 0.0610 893 808 893NM Baileyville Net 1.961 1.734 1.961 0.0307 2,021 1,787 2,021NM Frankfort Net 0.5 0.446 0.5 0.0534 527 470 527NM Hanover Net 0.84 0.813 0.84 0.0374 871 843 871NM King Hill Net 1.377 1.261 1.377 0.0374 1,428 1,308 1,428NM Lone Elm Net 0.858 0.826 0.858 0.0374 890 857 890NM Marysville Net 1.479 1.258 1.479 0.0374 1,534 1,305 1,534NM Seneca Net 2.371 2.204 2.371 0.0374 2,460 2,286 2,460NM Smittyville Net 1.323 1.199 1.323 0.0374 1,372 1,244 1,372Robinson Net 0.353 0.32 0.353 0.0534 372 337 372Savonburg Net 0.138 0.118 0.138 0.0610 146 125 146Scranton Net 1.144 0.982 1.144 0.0610 1,214 1,042 1,214Toronto Net 0.498 0.488 0.498 0.0610 528 518 528Troy Net 2.152 1.967 2.152 0.0374 2,232 2,041 2,232Vermillion Net 0.218 0.189 0.218 0.0534 230 199 230Wathena Net 2.594 2.414 2.594 0.0534 2,733 2,543 2,733
I) DAY/HOUR OF HIGHEST PEAK REPORT LOAD:
II) SYSTEM LOAD NET CALCULATIONNative Peak Report Load 2,813 2,371 2,813 2,371 5,184less: Kaw Valley, SPA Resources1 1000 1 0 1 0 1 Nemaha, SPA Resources1 2354 2 0 2 0 2 Lindsborg, SPA Resources1 1215 1 0 1 0 1 Enterprise, Troy & Arma Resources 266 0.3 385 0.4 0.3 0.4 1
Total Systen Load Net 2,808 2,370 2,808 2,370 5,179
III) TOTAL SYSTEM PEAK RESPONSIBILITY (TSPR)
A) FIRM PURCHASECities, GRDA Resources3 5 * 14 * 5 * 14 * 19KEPCo Resources4 131 83 131 83 214WES Cities, SPA Resources2 0 * 10 * 0 10 * 10Kaw Valley, SPA Resources2 1 0 1 0 1Nemaha, SPA Resources2 2 0 2 0 2Lindsborg, SPA Resources2 1 0 1 0 1McPherson 57 * 0 * 57 * 0 * 57Enterprise, Troy & Arma Resources8 0.3 0.4 0.3 0.4 1Total Firm Purchases 198 108 198 108 305
B) FIRM SALESCities, GRDA Resources3 5 * 14 * 5 14 19KEPCo Resources4 0 0 0 0 0Kaw Valley, SPA Resources2 1 0 1 0 1Nemaha, SPA Resources2 2 0 2 0 2Lindsborg, SPA Resources2 1 0 1 0 1WES Cities, SPA Resources2 0 * 10 * 0 10 10Enterprise, Troy & Arma Resources8 0.3 0.4 0.3 0.4 1
Total Firm Sales 10 24 10 24 34
TSPR (System Load Net - Firm Purchases + Firm Sales) 2,621 2,287 2,621 2,287 4,908
Jul 21 @ 1700 Jul 21 @ 1700 Jul 21 @ 1700
CALCULATION OF WEN & WES AND TOTAL WESTAR LOADJuly 2016
Individual Companies Total WestarWestar North (WEN) Westar South (WES) WEN Contribution WES Contribution Westar Energy

IV) FERC FORM 1, PAGE 401b LOAD5
less: Non-Generating Cities6 0 0 0 0 0Independent Coops7 0 0 0 0 0Total Non-Generating Load 0 0 0 0 0
Total 401b Load (TSPR - Non Gen.) 2,621 2,287 2,621 2,287 4,908
V) RETAILless: KEPCo
KEPCo - Westar 137 141 137 141 278 KEPCo - MKEC (WPEK) 58 0 58 0 58 KEPCo - Midwest 16 0 16 0 16 KEPCo - EDE 0 3 0 3 3 KEPCo - KCPL 14 0 14 0 14
less: McPherson 148 0 148 0 148less: GFR Munis 28 7 28 7 36less: GFR Coops 54 0 54 0 54
add: KEPCo Resources4 131 83 131 83 214McPherson Resources 57 0 57 0 57
RETAIL LOAD: 2,353 2,219 2,353 2,219 4,572
VI) TOTAL SYSTEM CAPACITY RESPONSIBILITY* 2,978 2,599 2,978 2,599 5,577
Jul 21 @ 1700 Jul 21 @ 1700 Jul 21 @ 1700
Individual Companies Total WestarWestar North (WEN) Westar South (WES) WEN Contribution WES Contribution Westar Energy

VII) NOTES:* The SPP Criteria document, Section 2.1.9, references the minimum capacity margin, which is currently 12%. SPP member companies would have to approve any change to this amount. 2 SPA resources include capacity and firm energy from the Southwestern Power Administration.contract 3 GRDA resources include capacity and firm energy from the Grand River Dam Authority.4 KEPCo resources includes WCGS (Wolf Creek Generation Services), SPA (Southwestern Power Admin), Sharpe Generation, WAPA (Western Area Power Administration). They are listed on KEPCo's monthly bill.
Allocation of KEPCo Resources Maximum Proration Prorationa) KEPCo's Resources Capacity (kW) North South Effective March 2014, allocation of KEPCo's resources has been changed to WCGS 70,000 allow 100% of their resources to be allocated based on the load share SPA - Firm 100,000 shown in cells M57:M61 for WEN and O57:O61 for WES. This is due to changes Sharpe Generation 0 resulting from the new SPP market. Sharpe generation is not included. WAPA 12,000 Discussed with Julie Lux, Chris O'Neill, and Bill Birnel Iatan II 32,000 Total 214,000 130,531 83,469
North Peak South Peak WR Peak WR Peak Demand North Peak South Peak WR Peak WR PeakMetered Metered North South Loss Factors Loss Adjusted Loss AdjustedLoss AdjustedLoss AdjustedJul 21 @ 1700 Jul 21 @ 1700 Jul 21 @ 1700 Jul 21 @ 1700 (From Bills) Jul 21 @ 1700 Jul 21 @ 1700 Jul 21 @ 1700 Jul 21 @ 1700
KEPCo - MKEC (WPEK) 58 0 58 0 1.0632 61.5116 0.0000 61.5116 0.0000 KEPCo - Midwest 16 0 16 0 1.0426 16.7609 0.0000 16.7609 0.0000 KEPCo - EDE 0 3 0 3 0.0000 0.0000 3.1700 0.0000 3.1700 KEPCo - KCPL 14 0 14 0 0.0000 14.2142 0.0000 14.2142 0.0000
92.4868 3.1700 92.4868 3.1700
KEPCo - Westar -- Calculate loss Adjustments for KEPCo-Westar North and South. These values are used in the GFR Calculation on Worksheet D only. Enter only the values shown in yellow.O1 40.7162 23.3095 40.7162 23.3095 1.0307 41.9662 24.0251 41.9662 24.0251O10 -0.1 0 -0.1 0 1.0954 -0.1095 0.0000 -0.1095 0.0000O11 -0.7403 0 -0.7403 0 1.085 -0.8032 0.0000 -0.8032 0.0000O2 54.5472 94.8064 54.5472 94.8064 1.0374 56.5873 98.3522 56.5873 98.3522O4 42.6342 20.0025 42.6342 20.0025 1.0534 44.9109 21.0706 44.9109 21.0706O5 0 2.3149 0 2.3149 1.061 0.0000 2.4561 0.0000 2.4561O6 0 0 0 0 1.0611 0.0000 0.0000 0.0000 0.0000O8 0.0243 0.3949 0.0243 0.3949 1.0803 0.0263 0.4266 0.0263 0.4266O9 -0.0397 0 -0.0397 0 1.0892 -0.0432 0.0000 -0.0432 0.0000Blank 0 0 0 0 1 0.0000 0.0000 0.0000 0.0000
KEPCo - Westar 137.0419 140.8282 137.0419 140.8282 142.5346 146.3306 142.5346 146.3306
VIII) NON-GENERATING CITIES
5 The load reported on page 401b is requirements load associated with requirement energy reported on Form 1, page 311 6 Non-Generating cities only includes the City of Altamont. It is expected to become a GFR customer effective April 1, 2015
WEN North Peak North Peak WES South Peak LossMetered SPA Cap Credit Loss Adjusted Metered SPA Cap Credit Adjusted
Jul 21 @ 1700 Jul 21 @ 1700Alma (WSPP) 3,103 3,219 Arma 2,968 -385 2,764Elwood 2,218 2,336 Blue Mound 445 472Enterprise (City & Indust Park) 1,527 -148 1,437 Bronson 469 498Herington 5,808 6,025 Elsmore 119 125Lindsborg 7,968 -1,215 7,051 LaHarpe 833 877Morrill 387 408 Mindenmines 528 556Muscotah 263 277 Moran 1,078 1,136Robinson 355 374 Mulberry 748 794Scranton 1,056 1,120 Savonburg 131 139Toronto 513 544 7,319 7,361Troy 2,207 -118 2,172Vermillion 228 240Wathena (WSPP) 2,557 2,694
GFR Munis 28,190 27,898
Altamont (Cell G49) 0 <===== Effective 4/1/2015, Altamont will become part of KMEA and will no longer be tracked. The value is set to zero
WR Peak WR Peak WR PeakMetered North Peak Metered Loss Jul 21 @ 1700 SPA Cap Credit Loss Adjusted WR Jul 21 @ 1700 SPA Cap Credit Adjusted
Alma 3,103 3,219 Arma 2,968 -385 2,764Elwood 2,218 2,336 Blue Mound 445 472Enterprise 1,527 -148 1,437 Bronson 469 498Herington 5,808 6,025 Elsmore 119 125Lindsborg 7,968 -1,215 7,051 LaHarpe 833 877Morrill 387 408 Mindenmines 528 556Muscotah 263 277 Moran 1,078 1,136Robinson 355 374 Mulberry 748 794Scranton 1,056 1,120 Savonburg 131 139Toronto 513 544 7,319 7,361Troy 2,207 -118 2,172Vermillion 228 240Wathena 2,557 2,694
GFR Munis 28,190 27,898
Altamont (Cell M49) 0 <===== Effective 4/1/2015, Altamont will become part of KMEA and will no longer be tracked. The value is set to zero
7 Independent Coops are now under the GRF contracts:8 WAPA resources include capacity from the Western Area Power Administration.
PeakMetered Peak
WEN Jul 21 @ 1700 SPA Cap Credit Loss AdjustedDoniphan 4,425 4,630Kaw Valley 37,619 -1,000 37,993Nemaha Marshall 11,852 -2,354 9,957 Confirmed w B. St Louis, Capacity Credit should be applied.
53,896 52,580
WR Jul 21 @ 1700Doniphan 4,425 4,630Kaw Valley 37,619 -1,000 37,993Nemaha Marshall 11,852 -2,354 9,957 Confirmed w B. St Louis, Capacity Credit should be applied.
53,896 52,580

North Peak South Peak WR Peak Demand Peak Peak PeakMetered Metered Metered Loss Factors Loss Adjusted Loss Adjusted Loss AdjustedJul 21 @ 1700 Jul 21 @ 1700 Jul 21 @ 1700 (From Bills) Jul 21 @ 1700 Jul 21 @ 1700 Jul 21 @ 1700
Alma Net 3.103 3.103 3.103 0.0374 3,219 3,219 3,219Arma Net 2.968 2.968 2.968 0.0610 3,149 3,149 3,149Blue Mound Net 0.445 0.445 0.445 0.0610 472 472 472Bronson Net 0.469 0.469 0.469 0.0610 498 498 498DP Bellevue Net 0.67 0.67 0.67 0.0534 706 706 706DP Blair Net 1.395 1.395 1.395 0.0307 1,438 1,438 1,438DP Midway Net 0.589 0.589 0.589 0.0534 620 620 620DP Troy Net 1.771 1.771 1.771 0.0534 1,866 1,866 1,866Elsmore Net 0.119 0.119 0.119 0.0534 125 125 125Elwood Net 2.218 2.218 2.218 0.0534 2,336 2,336 2,336Enterprise City Net 1.462 1.462 1.462 0.0374 1,517 1,517 1,517Enterprise Industrial Park Net 0.065 0.065 0.065 0.0534 68 68 68Herington Net 5.808 5.808 5.808 0.0374 6,025 6,025 6,025KV Baldwin Creek Net 1.931 1.931 1.931 0.0534 2,034 2,034 2,034KV Banning Corner Net 0.003 0.003 0.003 0.0534 3 3 3KV Carbondale Net 3.816 3.816 3.816 0.0307 3,933 3,933 3,933KV Crooked Post Net 12.933 12.933 12.933 0.0374 13,417 13,417 13,417KV Delia 2 Net 3.674 3.674 3.674 0.0307 3,787 3,787 3,787KV Hoyt Net 0 0 0 0.0307 0 0 0KV Keene Net 3.807 3.807 3.807 0.0307 3,924 3,924 3,924KV Kiro Net 4.215 4.215 4.215 0.0307 4,344 4,344 4,344KV Pauline Net 0.699 0.699 0.699 0.0534 736 736 736KV Rossville Net 0 0 0 0.0307 0 0 0KV Scranton Net 0.569 0.569 0.569 0.0534 599 599 599KV Stull Net 4.731 4.731 4.731 0.0374 4,908 4,908 4,908KV Watson Net 1.241 1.241 1.241 0.0534 1,307 1,307 1,307La Harpe Net 0.833 0.833 0.833 0.0534 877 877 877Lindsborg Net 7.968 7.968 7.968 0.0374 8,266 8,266 8,266Mindenmines Net 0.528 0.528 0.528 0.0534 556 556 556Moran Net 1.078 1.078 1.078 0.0534 1,136 1,136 1,136Morrill Net 0.387 0.387 0.387 0.0534 408 408 408Mulberry Net 0.748 0.748 0.748 0.0611 794 794 794Muscotah Net 0.263 0.263 0.263 0.0534 277 277 277NM Axtell Net 0.872 0.872 0.872 0.0610 925 925 925NM Baileyville Net 1.935 1.935 1.935 0.0307 1,994 1,994 1,994NM Frankfort Net 0.495 0.495 0.495 0.0534 521 521 521NM Hanover Net 0.873 0.873 0.873 0.0374 906 906 906NM King Hill Net 1.421 1.421 1.421 0.0374 1,474 1,474 1,474NM Lone Elm Net 0.981 0.981 0.981 0.0374 1,018 1,018 1,018NM Marysville Net 1.469 1.469 1.469 0.0374 1,524 1,524 1,524NM Seneca Net 2.456 2.456 2.456 0.0374 2,548 2,548 2,548NM Smittyville Net 1.35 1.35 1.35 0.0374 1,400 1,400 1,400Robinson Net 0.355 0.355 0.355 0.0534 374 374 374Savonburg Net 0.131 0.131 0.131 0.0610 139 139 139Scranton Net 1.056 1.056 1.056 0.0610 1,120 1,120 1,120Toronto Net 0.513 0.513 0.513 0.0610 544 544 544Troy Net 2.207 2.207 2.207 0.0374 2,290 2,290 2,290Vermillion Net 0.228 0.228 0.228 0.0534 240 240 240Wathena Net 2.557 2.557 2.557 0.0534 2,694 2,694 2,694

I) DAY/HOUR OF HIGHEST PEAK REPORT LOAD:
II) SYSTEM LOAD NET CALCULATIONNative Peak Report Load 2,800 2,313 2,799 2,311 5,110less: Kaw Valley, SPA Resources1 1000 1 0 1 0 1 Nemaha, SPA Resources1 2190 2 0 2 0 2 Lindsborg, SPA Resources1 1068 1 0 1 0 1 Enterprise, Troy & Arma Resources 234 0.2 338 0.3 0.2 0.3 1
Total Systen Load Net 2,796 2,313 2,794 2,311 5,105
III) TOTAL SYSTEM PEAK RESPONSIBILITY (TSPR)
A) FIRM PURCHASECities, GRDA Resources3 5 * 14 * 5 * 14 * 19KEPCo Resources4 128 86 128 86 214WES Cities, SPA Resources2 0 * 10 * 0 10 * 10Kaw Valley, SPA Resources2 1 0 1 0 1Nemaha, SPA Resources2 2 0 2 0 2Lindsborg, SPA Resources2 1 0 1 0 1McPherson 57 * 0 * 57 * 0 * 57Enterprise, Troy & Arma Resources8 0.2 0.3 0.2 0.3 1Total Firm Purchases 195 110 195 110 305
B) FIRM SALESCities, GRDA Resources3 5 * 14 * 5 14 19KEPCo Resources4 0 0 0 0 0Kaw Valley, SPA Resources2 1 0 1 0 1Nemaha, SPA Resources2 2 0 2 0 2Lindsborg, SPA Resources2 1 0 1 0 1WES Cities, SPA Resources2 0 * 10 * 0 10 10Enterprise, Troy & Arma Resources8 0.2 0.3 0.2 0.3 1
Total Firm Sales 9 24 9 24 34
TSPR (System Load Net - Firm Purchases + Firm Sales) 2,611 2,227 2,609 2,225 4,834
CALCULATION OF WEN & WES AND TOTAL WESTAR LOADAugust 2016
Individual Companies Total WestarWestar North (WEN) Westar South (WES) WEN Contribution WES Contribution Westar Energy
Aug 11 @ 1600 Aug 1 @ 1700 Aug 11 @ 1700

IV) FERC FORM 1, PAGE 401b LOAD5
less: Non-Generating Cities6 0 0 0 0 0Independent Coops7 0 0 0 0 0Total Non-Generating Load 0 0 0 0 0
Total 401b Load (TSPR - Non Gen.) 2,611 2,227 2,609 2,225 4,834
V) RETAILless: KEPCo
KEPCo - Westar 128 138 133 136 269 KEPCo - MKEC (WPEK) 48 0 48 0 48 KEPCo - Midwest 13 0 13 0 13 KEPCo - EDE 0 3 0 3 3 KEPCo - KCPL 14 0 14 0 14
less: McPherson 144 0 140 0 140less: GFR Munis 27 7 28 7 35less: GFR Coops 53 0 53 0 53
add: KEPCo Resources4 128 86 128 86 214McPherson Resources 57 0 57 0 57
RETAIL LOAD: 2,369 2,165 2,366 2,164 4,530
VI) TOTAL SYSTEM CAPACITY RESPONSIBILITY* 2,967 2,531 2,965 2,528 5,493
Aug 11 @ 1600 Aug 1 @ 1700 Aug 11 @ 1700
Individual Companies Total WestarWestar North (WEN) Westar South (WES) WEN Contribution WES Contribution Westar Energy

VII) NOTES:* The SPP Criteria document, Section 2.1.9, references the minimum capacity margin, which is currently 12%. SPP member companies would have to approve any change to this amount. 2 SPA resources include capacity and firm energy from the Southwestern Power Administration.contract 3 GRDA resources include capacity and firm energy from the Grand River Dam Authority.4 KEPCo resources includes WCGS (Wolf Creek Generation Services), SPA (Southwestern Power Admin), Sharpe Generation, WAPA (Western Area Power Administration). They are listed on KEPCo's monthly bill.
Allocation of KEPCo Resources Maximum Proration Prorationa) KEPCo's Resources Capacity (kW) North South Effective March 2014, allocation of KEPCo's resources has been changed to WCGS 70,000 allow 100% of their resources to be allocated based on the load share SPA - Firm 100,000 shown in cells M57:M61 for WEN and O57:O61 for WES. This is due to changes Sharpe Generation 0 resulting from the new SPP market. Sharpe generation is not included. WAPA 12,000 Discussed with Julie Lux, Chris O'Neill, and Bill Birnel Iatan II 32,000 Total 214,000 128,076 85,924
North Peak South Peak WR Peak WR Peak Demand North Peak South Peak WR Peak WR PeakMetered Metered North South Loss Factors Loss Adjusted Loss AdjustedLoss AdjustedLoss Adjusted
Aug 11 @ 1600 Aug 1 @ 1700 Aug 11 @ 1700 Aug 11 @ 1700 (From Bills) Aug 11 @ 1600 Aug 1 @ 1700 Aug 11 @ 1700 Aug 11 @ 1700 KEPCo - MKEC (WPEK) 48 0 48 0 1.0632 50.8512 0.0000 50.5537 0.0000 KEPCo - Midwest 13 0 13 0 1.0426 13.5977 0.0000 13.7721 0.0000 KEPCo - EDE 0 3 0 3 0.0000 0.0000 3.3056 0.0000 3.4295 KEPCo - KCPL 14 0 14 0 0.0000 13.8021 0.0000 14.2330 0.0000
78.2509 3.3056 78.5588 3.4295
KEPCo - Westar -- Calculate loss Adjustments for KEPCo-Westar North and South. These values are used in the GFR Calculation on Worksheet D only. Enter only the values shown in yellow.O1 37.753 24.7734 40.6066 23.7063 1.0307 38.9120 25.5339 41.8532 24.4341O10 -0.0751 0 -0.0825 0 1.0954 -0.0823 0.0000 -0.0904 0.0000O11 -0.8902 0 -0.7822 0 1.085 -0.9659 0.0000 -0.8487 0.0000O2 51.4967 90.8948 52.0169 90.3515 1.0374 53.4227 94.2943 53.9623 93.7306O4 39.8373 19.4775 41.1692 19.4259 1.0534 41.9646 20.5176 43.3676 20.4632O5 0 2.2053 0 2.2329 1.061 0.0000 2.3398 0.0000 2.3691O6 0 0 0 0 1.0611 0.0000 0.0000 0.0000 0.0000O8 0.0324 0.355 0.0265 0.3323 1.0803 0.0350 0.3835 0.0286 0.3590O9 -0.0408 0 -0.0424 0 1.0892 -0.0444 0.0000 -0.0462 0.0000Blank 0 0 0 0 1 0.0000 0.0000 0.0000 0.0000
KEPCo - Westar 128.1133 137.706 132.9121 136.0489 133.2417 143.0691 138.2266 141.3561
VIII) NON-GENERATING CITIES
5 The load reported on page 401b is requirements load associated with requirement energy reported on Form 1, page 311 6 Non-Generating cities only includes the City of Altamont. It is expected to become a GFR customer effective April 1, 2015
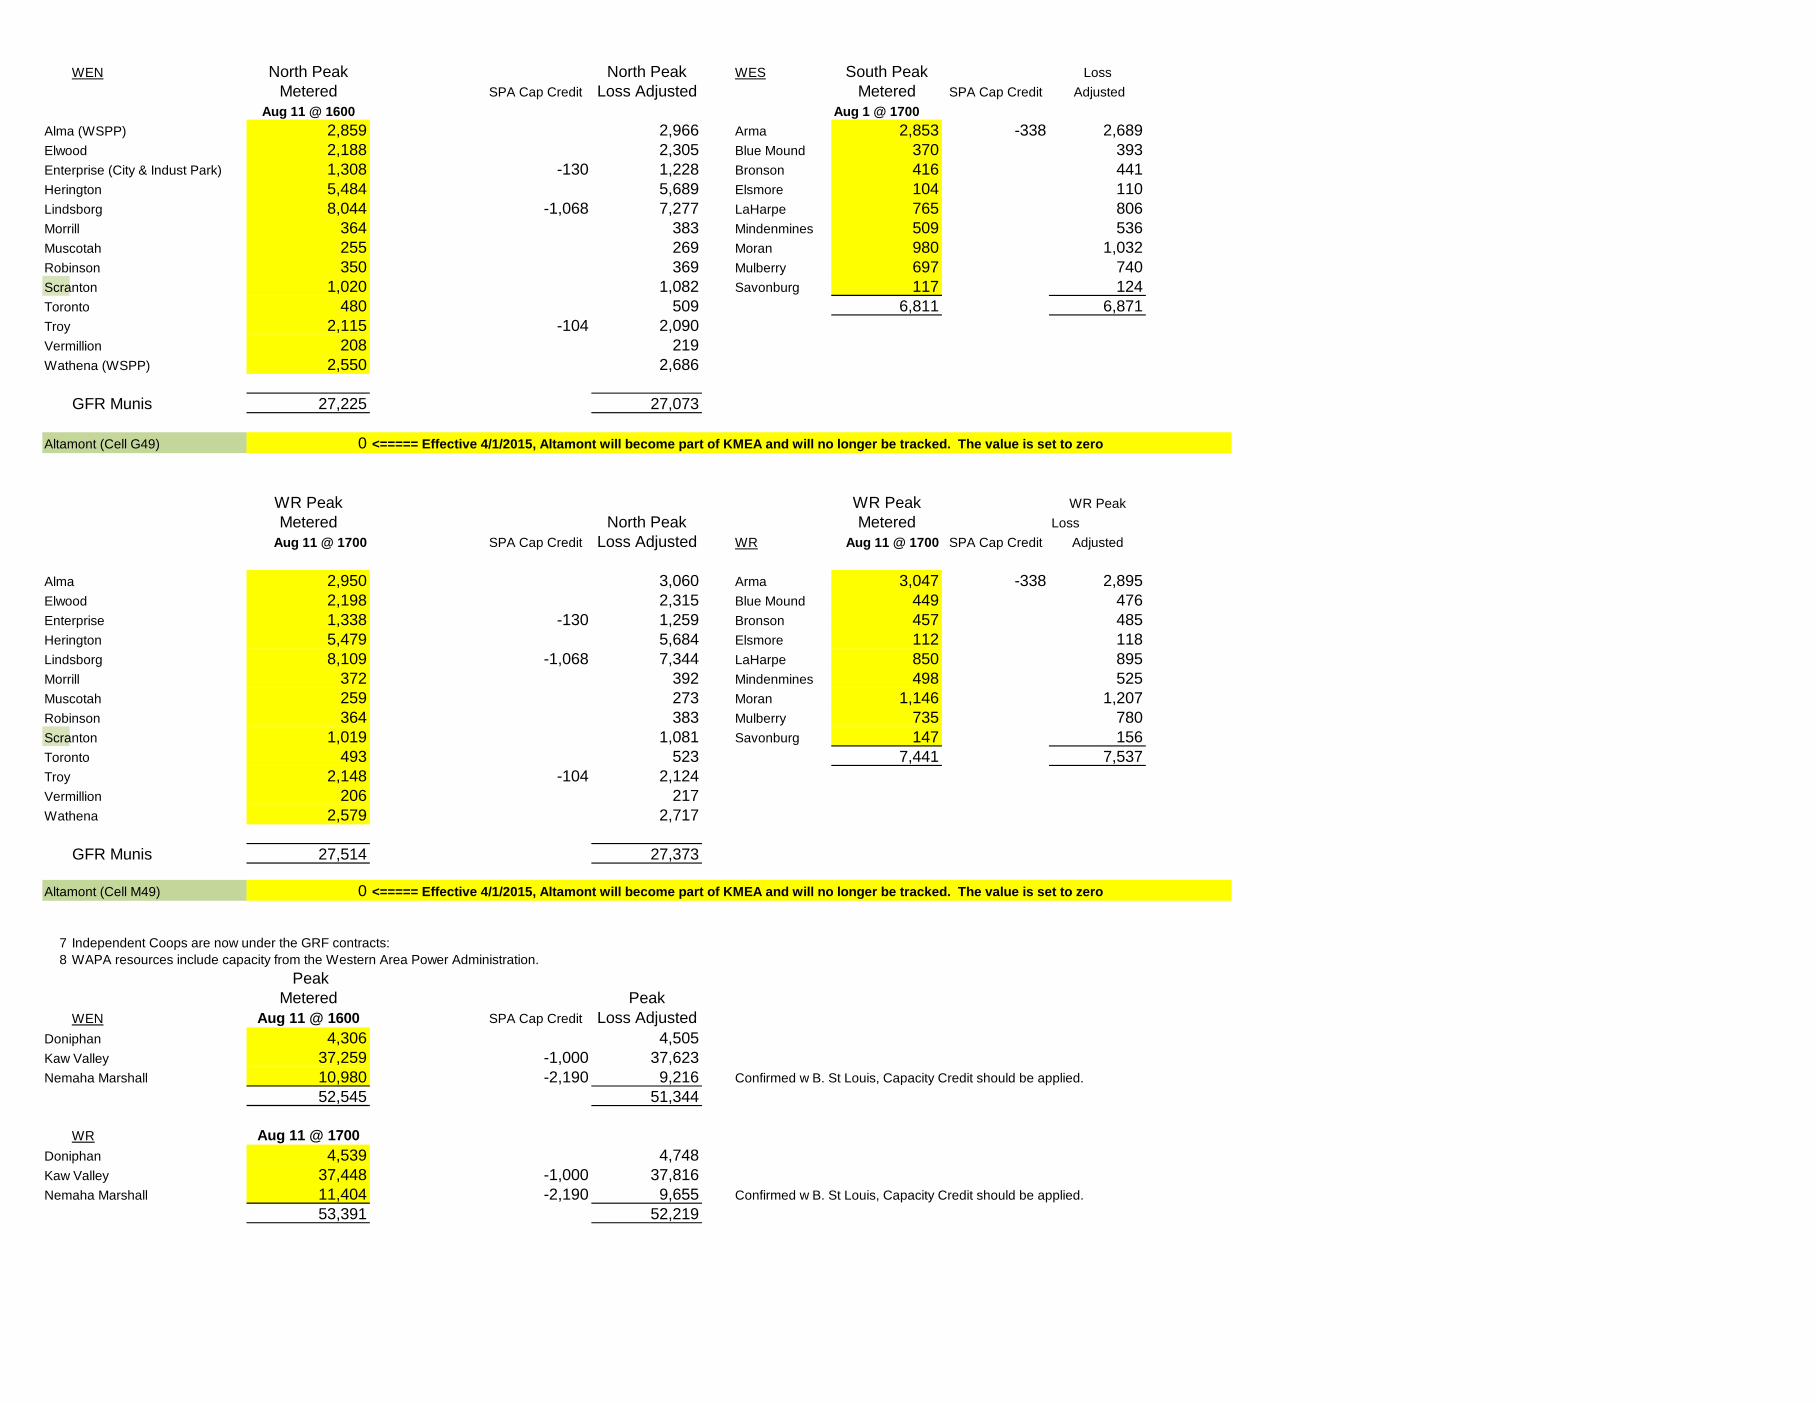
WEN North Peak North Peak WES South Peak LossMetered SPA Cap Credit Loss Adjusted Metered SPA Cap Credit Adjusted
Aug 11 @ 1600 Aug 1 @ 1700Alma (WSPP) 2,859 2,966 Arma 2,853 -338 2,689Elwood 2,188 2,305 Blue Mound 370 393Enterprise (City & Indust Park) 1,308 -130 1,228 Bronson 416 441Herington 5,484 5,689 Elsmore 104 110Lindsborg 8,044 -1,068 7,277 LaHarpe 765 806Morrill 364 383 Mindenmines 509 536Muscotah 255 269 Moran 980 1,032Robinson 350 369 Mulberry 697 740Scranton 1,020 1,082 Savonburg 117 124Toronto 480 509 6,811 6,871Troy 2,115 -104 2,090Vermillion 208 219Wathena (WSPP) 2,550 2,686
GFR Munis 27,225 27,073
Altamont (Cell G49) 0 <===== Effective 4/1/2015, Altamont will become part of KMEA and will no longer be tracked. The value is set to zero
WR Peak WR Peak WR PeakMetered North Peak Metered Loss
Aug 11 @ 1700 SPA Cap Credit Loss Adjusted WR Aug 11 @ 1700 SPA Cap Credit Adjusted
Alma 2,950 3,060 Arma 3,047 -338 2,895Elwood 2,198 2,315 Blue Mound 449 476Enterprise 1,338 -130 1,259 Bronson 457 485Herington 5,479 5,684 Elsmore 112 118Lindsborg 8,109 -1,068 7,344 LaHarpe 850 895Morrill 372 392 Mindenmines 498 525Muscotah 259 273 Moran 1,146 1,207Robinson 364 383 Mulberry 735 780Scranton 1,019 1,081 Savonburg 147 156Toronto 493 523 7,441 7,537Troy 2,148 -104 2,124Vermillion 206 217Wathena 2,579 2,717
GFR Munis 27,514 27,373
Altamont (Cell M49) 0 <===== Effective 4/1/2015, Altamont will become part of KMEA and will no longer be tracked. The value is set to zero
7 Independent Coops are now under the GRF contracts:8 WAPA resources include capacity from the Western Area Power Administration.
PeakMetered Peak
WEN Aug 11 @ 1600 SPA Cap Credit Loss AdjustedDoniphan 4,306 4,505Kaw Valley 37,259 -1,000 37,623Nemaha Marshall 10,980 -2,190 9,216 Confirmed w B. St Louis, Capacity Credit should be applied.
52,545 51,344
WR Aug 11 @ 1700Doniphan 4,539 4,748Kaw Valley 37,448 -1,000 37,816Nemaha Marshall 11,404 -2,190 9,655 Confirmed w B. St Louis, Capacity Credit should be applied.
53,391 52,219
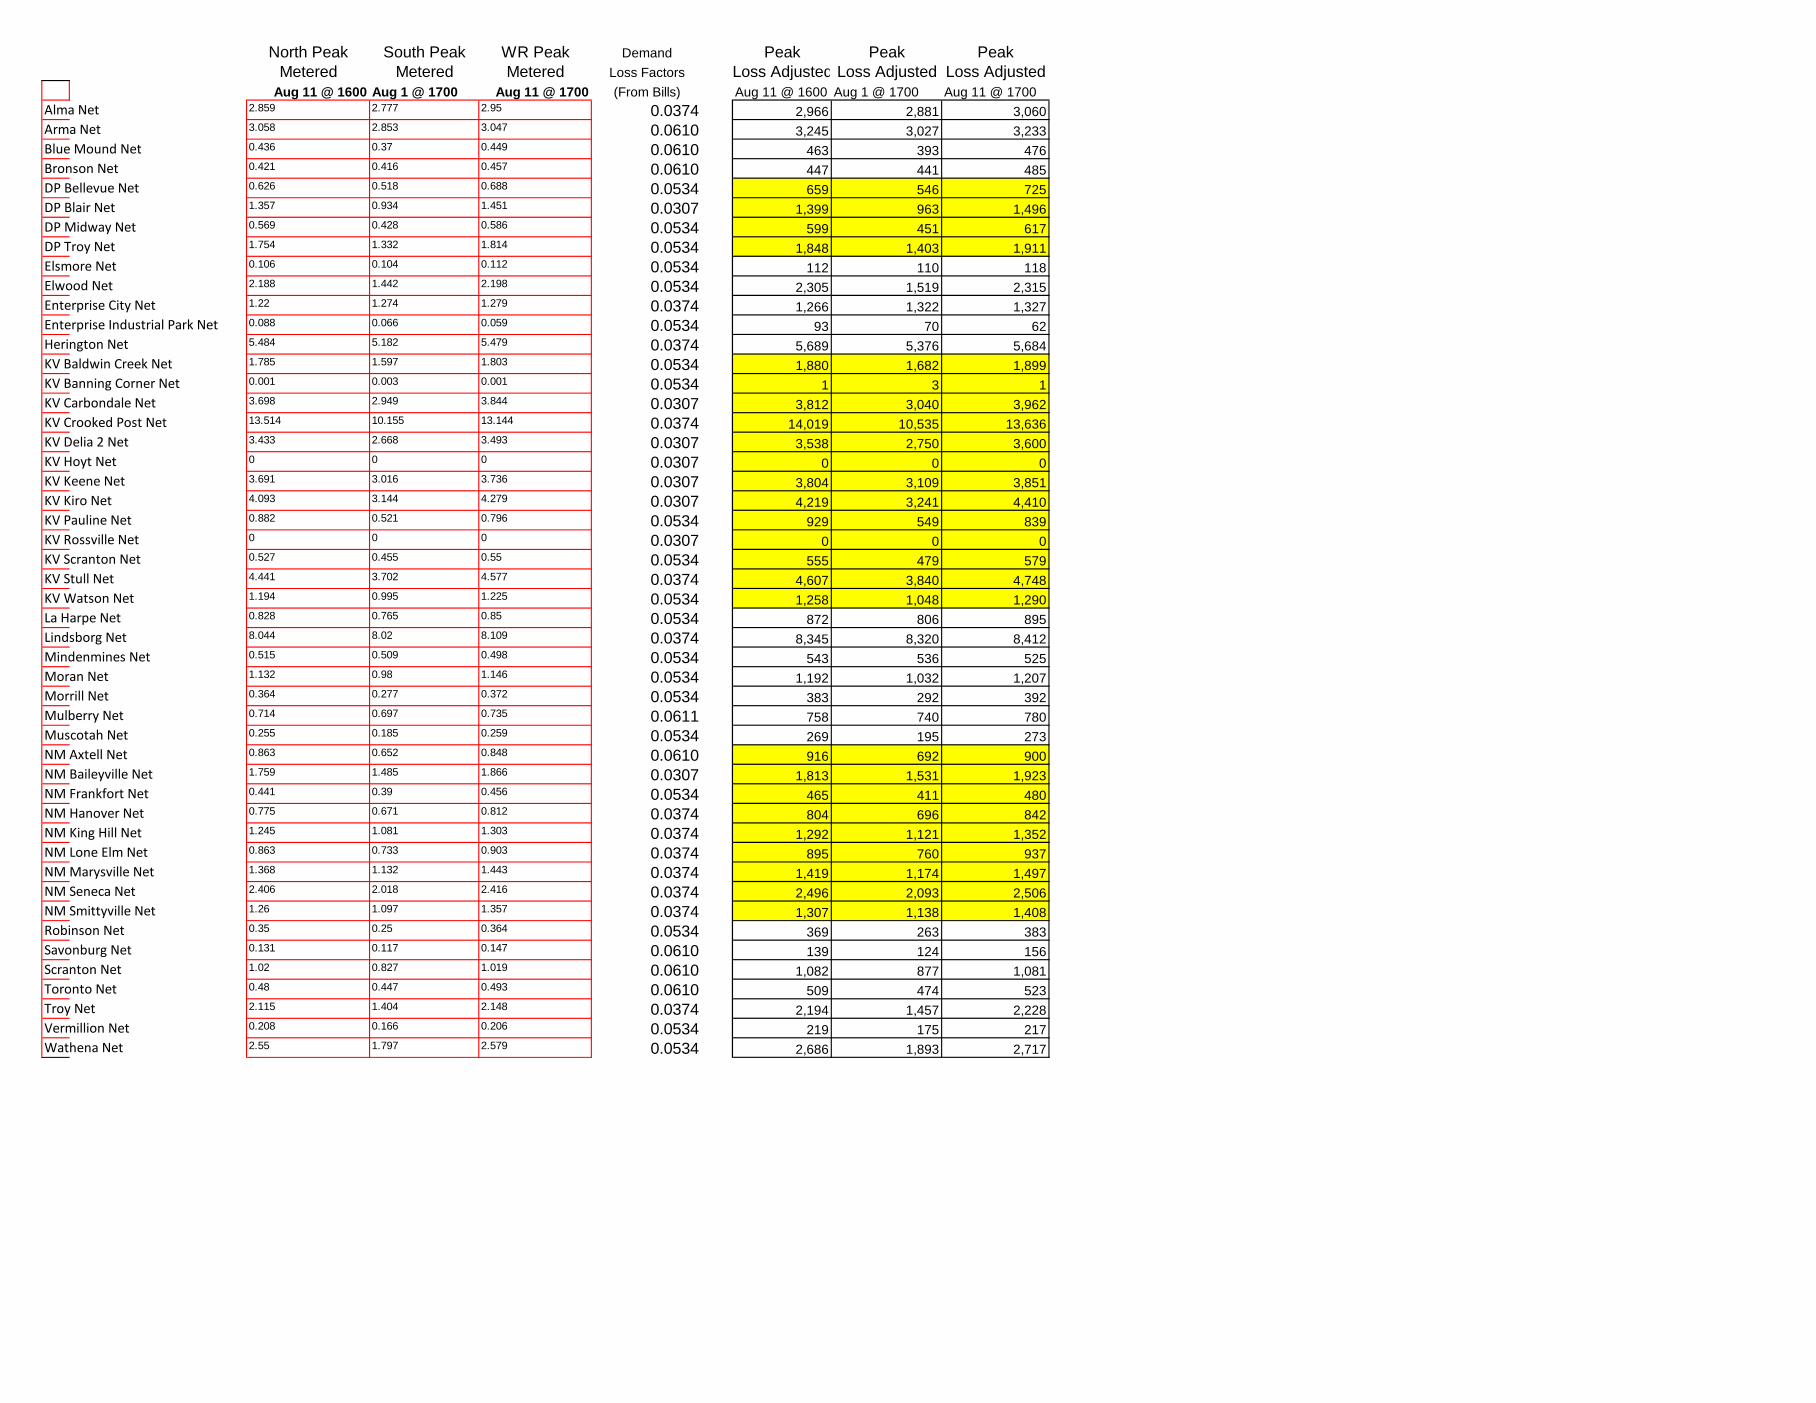
North Peak South Peak WR Peak Demand Peak Peak PeakMetered Metered Metered Loss Factors Loss Adjusted Loss Adjusted Loss Adjusted
Aug 11 @ 1600 Aug 1 @ 1700 Aug 11 @ 1700 (From Bills) Aug 11 @ 1600 Aug 1 @ 1700 Aug 11 @ 1700Alma Net 2.859 2.777 2.95 0.0374 2,966 2,881 3,060Arma Net 3.058 2.853 3.047 0.0610 3,245 3,027 3,233Blue Mound Net 0.436 0.37 0.449 0.0610 463 393 476Bronson Net 0.421 0.416 0.457 0.0610 447 441 485DP Bellevue Net 0.626 0.518 0.688 0.0534 659 546 725DP Blair Net 1.357 0.934 1.451 0.0307 1,399 963 1,496DP Midway Net 0.569 0.428 0.586 0.0534 599 451 617DP Troy Net 1.754 1.332 1.814 0.0534 1,848 1,403 1,911Elsmore Net 0.106 0.104 0.112 0.0534 112 110 118Elwood Net 2.188 1.442 2.198 0.0534 2,305 1,519 2,315Enterprise City Net 1.22 1.274 1.279 0.0374 1,266 1,322 1,327Enterprise Industrial Park Net 0.088 0.066 0.059 0.0534 93 70 62Herington Net 5.484 5.182 5.479 0.0374 5,689 5,376 5,684KV Baldwin Creek Net 1.785 1.597 1.803 0.0534 1,880 1,682 1,899KV Banning Corner Net 0.001 0.003 0.001 0.0534 1 3 1KV Carbondale Net 3.698 2.949 3.844 0.0307 3,812 3,040 3,962KV Crooked Post Net 13.514 10.155 13.144 0.0374 14,019 10,535 13,636KV Delia 2 Net 3.433 2.668 3.493 0.0307 3,538 2,750 3,600KV Hoyt Net 0 0 0 0.0307 0 0 0KV Keene Net 3.691 3.016 3.736 0.0307 3,804 3,109 3,851KV Kiro Net 4.093 3.144 4.279 0.0307 4,219 3,241 4,410KV Pauline Net 0.882 0.521 0.796 0.0534 929 549 839KV Rossville Net 0 0 0 0.0307 0 0 0KV Scranton Net 0.527 0.455 0.55 0.0534 555 479 579KV Stull Net 4.441 3.702 4.577 0.0374 4,607 3,840 4,748KV Watson Net 1.194 0.995 1.225 0.0534 1,258 1,048 1,290La Harpe Net 0.828 0.765 0.85 0.0534 872 806 895Lindsborg Net 8.044 8.02 8.109 0.0374 8,345 8,320 8,412Mindenmines Net 0.515 0.509 0.498 0.0534 543 536 525Moran Net 1.132 0.98 1.146 0.0534 1,192 1,032 1,207Morrill Net 0.364 0.277 0.372 0.0534 383 292 392Mulberry Net 0.714 0.697 0.735 0.0611 758 740 780Muscotah Net 0.255 0.185 0.259 0.0534 269 195 273NM Axtell Net 0.863 0.652 0.848 0.0610 916 692 900NM Baileyville Net 1.759 1.485 1.866 0.0307 1,813 1,531 1,923NM Frankfort Net 0.441 0.39 0.456 0.0534 465 411 480NM Hanover Net 0.775 0.671 0.812 0.0374 804 696 842NM King Hill Net 1.245 1.081 1.303 0.0374 1,292 1,121 1,352NM Lone Elm Net 0.863 0.733 0.903 0.0374 895 760 937NM Marysville Net 1.368 1.132 1.443 0.0374 1,419 1,174 1,497NM Seneca Net 2.406 2.018 2.416 0.0374 2,496 2,093 2,506NM Smittyville Net 1.26 1.097 1.357 0.0374 1,307 1,138 1,408Robinson Net 0.35 0.25 0.364 0.0534 369 263 383Savonburg Net 0.131 0.117 0.147 0.0610 139 124 156Scranton Net 1.02 0.827 1.019 0.0610 1,082 877 1,081Toronto Net 0.48 0.447 0.493 0.0610 509 474 523Troy Net 2.115 1.404 2.148 0.0374 2,194 1,457 2,228Vermillion Net 0.208 0.166 0.206 0.0534 219 175 217Wathena Net 2.55 1.797 2.579 0.0534 2,686 1,893 2,717
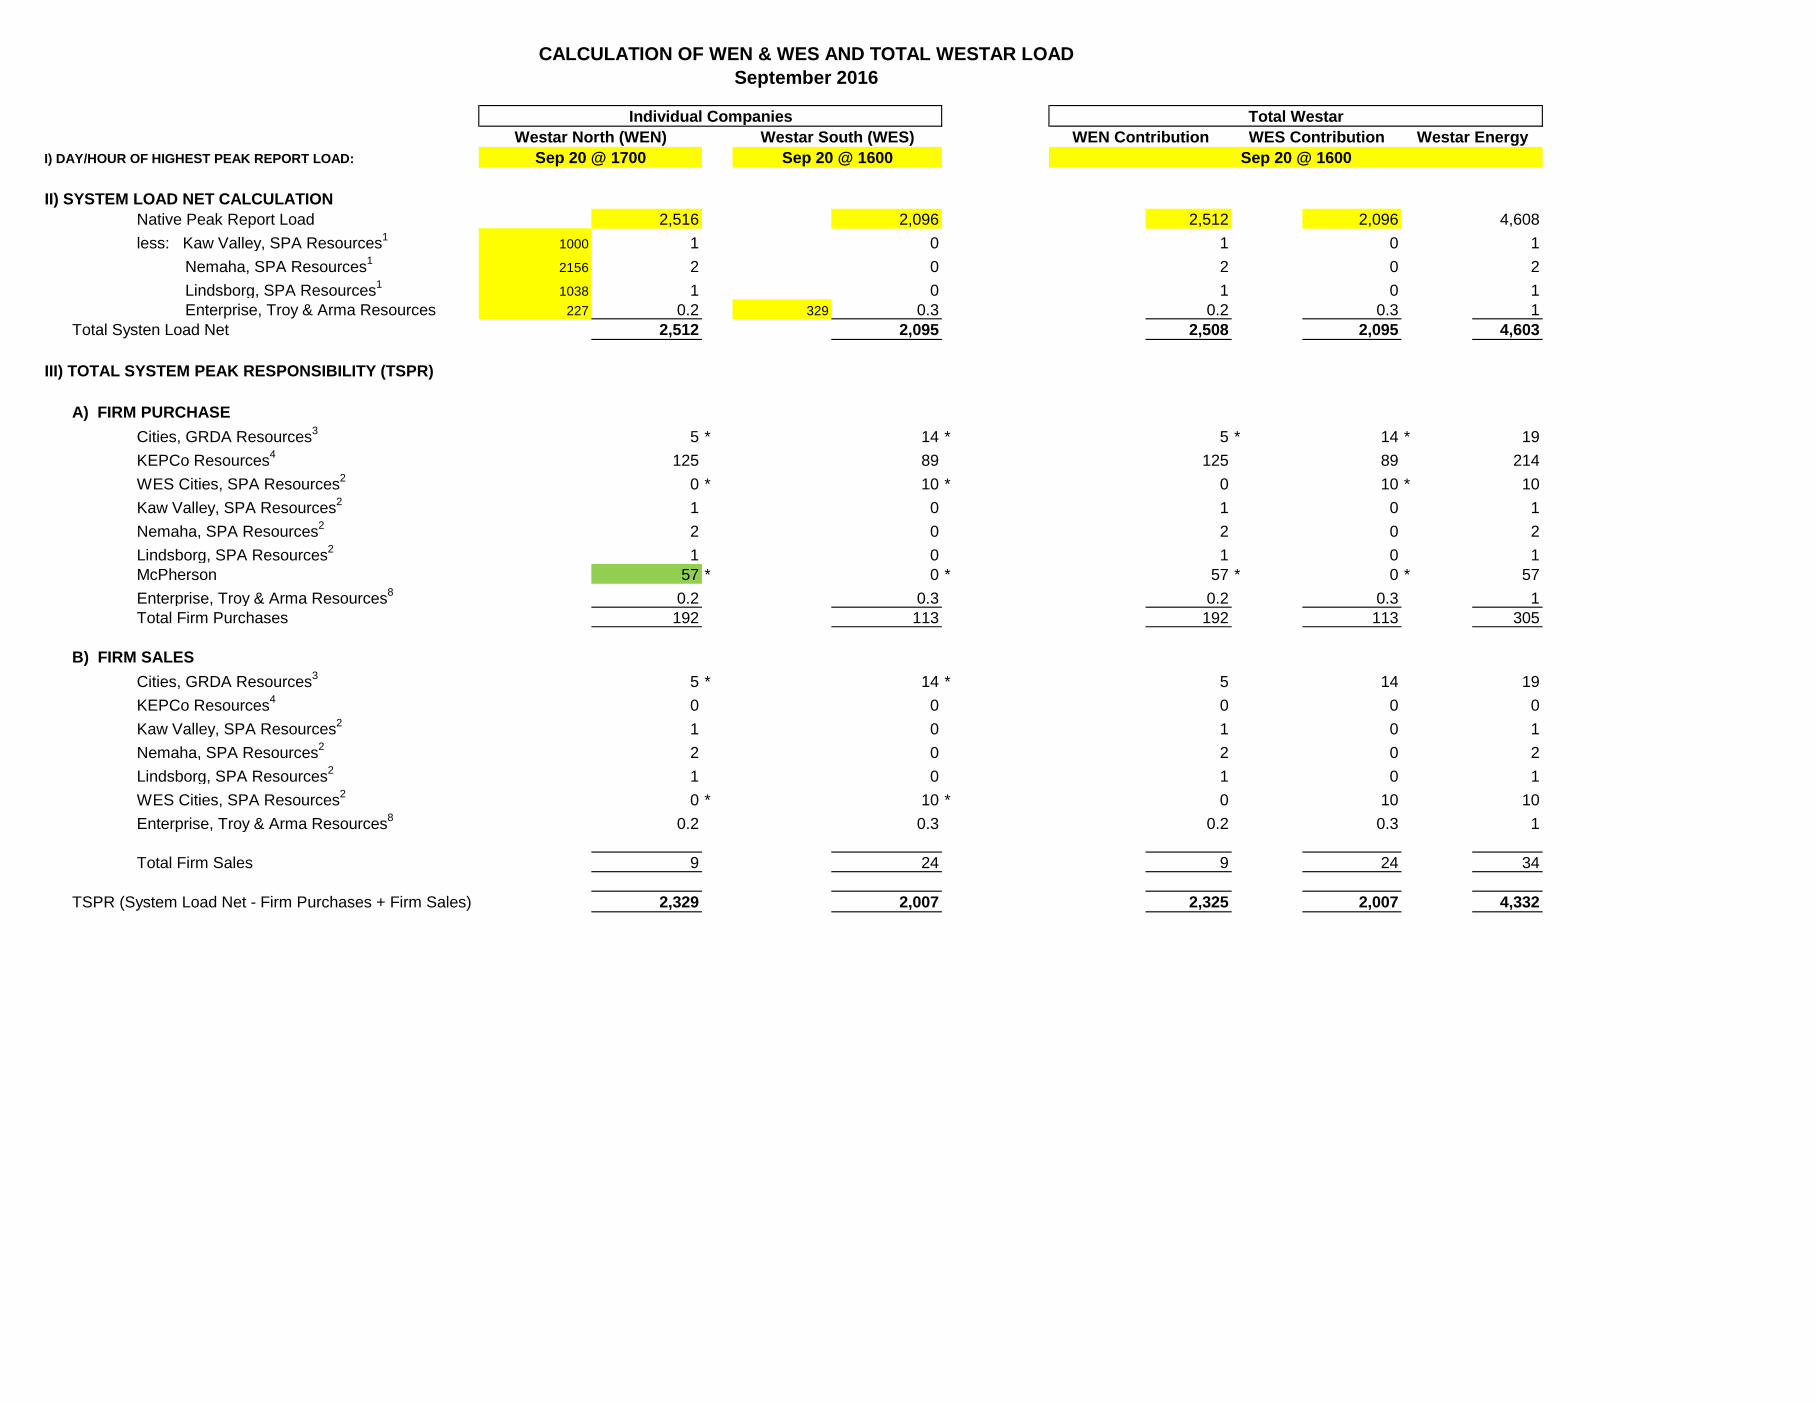
I) DAY/HOUR OF HIGHEST PEAK REPORT LOAD:
II) SYSTEM LOAD NET CALCULATIONNative Peak Report Load 2,516 2,096 2,512 2,096 4,608less: Kaw Valley, SPA Resources1 1000 1 0 1 0 1 Nemaha, SPA Resources1 2156 2 0 2 0 2 Lindsborg, SPA Resources1 1038 1 0 1 0 1 Enterprise, Troy & Arma Resources 227 0.2 329 0.3 0.2 0.3 1
Total Systen Load Net 2,512 2,095 2,508 2,095 4,603
III) TOTAL SYSTEM PEAK RESPONSIBILITY (TSPR)
A) FIRM PURCHASECities, GRDA Resources3 5 * 14 * 5 * 14 * 19KEPCo Resources4 125 89 125 89 214WES Cities, SPA Resources2 0 * 10 * 0 10 * 10Kaw Valley, SPA Resources2 1 0 1 0 1Nemaha, SPA Resources2 2 0 2 0 2Lindsborg, SPA Resources2 1 0 1 0 1McPherson 57 * 0 * 57 * 0 * 57Enterprise, Troy & Arma Resources8 0.2 0.3 0.2 0.3 1Total Firm Purchases 192 113 192 113 305
B) FIRM SALESCities, GRDA Resources3 5 * 14 * 5 14 19KEPCo Resources4 0 0 0 0 0Kaw Valley, SPA Resources2 1 0 1 0 1Nemaha, SPA Resources2 2 0 2 0 2Lindsborg, SPA Resources2 1 0 1 0 1WES Cities, SPA Resources2 0 * 10 * 0 10 10Enterprise, Troy & Arma Resources8 0.2 0.3 0.2 0.3 1
Total Firm Sales 9 24 9 24 34
TSPR (System Load Net - Firm Purchases + Firm Sales) 2,329 2,007 2,325 2,007 4,332
Sep 20 @ 1700 Sep 20 @ 1600 Sep 20 @ 1600
CALCULATION OF WEN & WES AND TOTAL WESTAR LOADSeptember 2016
Individual Companies Total WestarWestar North (WEN) Westar South (WES) WEN Contribution WES Contribution Westar Energy

IV) FERC FORM 1, PAGE 401b LOAD5
less: Non-Generating Cities6 0 0 0 0 0Independent Coops7 0 0 0 0 0Total Non-Generating Load 0 0 0 0 0
Total 401b Load (TSPR - Non Gen.) 2,329 2,007 2,325 2,007 4,332
V) RETAILless: KEPCo
KEPCo - Westar 112 121 108 121 230 KEPCo - MKEC (WPEK) 42 0 41 0 41 KEPCo - Midwest 12 0 12 0 12 KEPCo - EDE 0 3 0 3 3 KEPCo - KCPL 15 0 14 0 14
less: McPherson 139 0 142 0 142less: GFR Munis 24 7 24 7 31less: GFR Coops 44 0 44 0 44
add: KEPCo Resources4 125 89 125 89 214McPherson Resources 57 0 57 0 57
RETAIL LOAD: 2,124 1,965 2,121 1,965 4,086
VI) TOTAL SYSTEM CAPACITY RESPONSIBILITY* 2,647 2,280 2,642 2,280 4,922
Sep 20 @ 1700 Sep 20 @ 1600 Sep 20 @ 1600
Individual Companies Total WestarWestar North (WEN) Westar South (WES) WEN Contribution WES Contribution Westar Energy

VII) NOTES:* The SPP Criteria document, Section 2.1.9, references the minimum capacity margin, which is currently 12%. SPP member companies would have to approve any change to this amount. 2 SPA resources include capacity and firm energy from the Southwestern Power Administration.contract 3 GRDA resources include capacity and firm energy from the Grand River Dam Authority.4 KEPCo resources includes WCGS (Wolf Creek Generation Services), SPA (Southwestern Power Admin), Sharpe Generation, WAPA (Western Area Power Administration). They are listed on KEPCo's monthly bill.
Allocation of KEPCo Resources Maximum Proration Prorationa) KEPCo's Resources Capacity (kW) North South Effective March 2014, allocation of KEPCo's resources has been changed to WCGS 70,000 allow 100% of their resources to be allocated based on the load share SPA - Firm 100,000 shown in cells M57:M61 for WEN and O57:O61 for WES. This is due to changes Sharpe Generation 0 resulting from the new SPP market. Sharpe generation is not included. WAPA 12,000 Discussed with Julie Lux, Chris O'Neill, and Bill Birnel Iatan II 32,000 Total 214,000 125,426 88,574
North Peak South Peak WR Peak WR Peak Demand North Peak South Peak WR Peak WR PeakMetered Metered North South Loss Factors Loss Adjusted Loss AdjustedLoss AdjustedLoss Adjusted
Sep 20 @ 1700 Sep 20 @ 1600 Sep 20 @ 1600 Sep 20 @ 1600 (From Bills) Sep 20 @ 1700 Sep 20 @ 1600 Sep 20 @ 1600 Sep 20 @ 1600 KEPCo - MKEC (WPEK) 42 0 41 0 1.0632 44.2786 0.0000 43.9995 0.0000 KEPCo - Midwest 12 0 12 0 1.0426 12.1277 0.0000 12.0969 0.0000 KEPCo - EDE 0 3 0 3 0.0000 0.0000 2.6290 0.0000 2.6290 KEPCo - KCPL 15 0 14 0 0.0000 14.5838 0.0000 14.3395 0.0000
70.9901 2.6290 70.4358 2.6290
KEPCo - Westar -- Calculate loss Adjustments for KEPCo-Westar North and South. These values are used in the GFR Calculation on Worksheet D only. Enter only the values shown in yellow.O1 32.8448 22.5721 31.6294 22.5721 1.0307 33.8531 23.2651 32.6004 23.2651O10 -0.0605 0 -0.0605 0 1.0954 -0.0663 0.0000 -0.0663 0.0000O11 -0.763 0 -0.8983 0 1.085 -0.8279 0.0000 -0.9747 0.0000O2 44.6572 78.7119 43.7337 78.7119 1.0374 46.3274 81.6557 45.3693 81.6557O4 35.1368 17.962 33.974 17.962 1.0534 37.0131 18.9212 35.7882 18.9212O5 0 1.8455 0 1.8455 1.061 0.0000 1.9581 0.0000 1.9581O6 0 0 0 0 1.0611 0.0000 0.0000 0.0000 0.0000O8 0.0204 0.3673 0.0377 0.3673 1.0803 0.0220 0.3968 0.0407 0.3968O9 -0.0217 0 -0.0265 0 1.0892 -0.0236 0.0000 -0.0289 0.0000Blank 0 0 0 0 1 0.0000 0.0000 0.0000 0.0000
KEPCo - Westar 111.814 121.4588 108.3895 121.4588 116.2979 126.1968 112.7289 126.1968
VIII) NON-GENERATING CITIES
5 The load reported on page 401b is requirements load associated with requirement energy reported on Form 1, page 311 6 Non-Generating cities only includes the City of Altamont. It is expected to become a GFR customer effective April 1, 2015
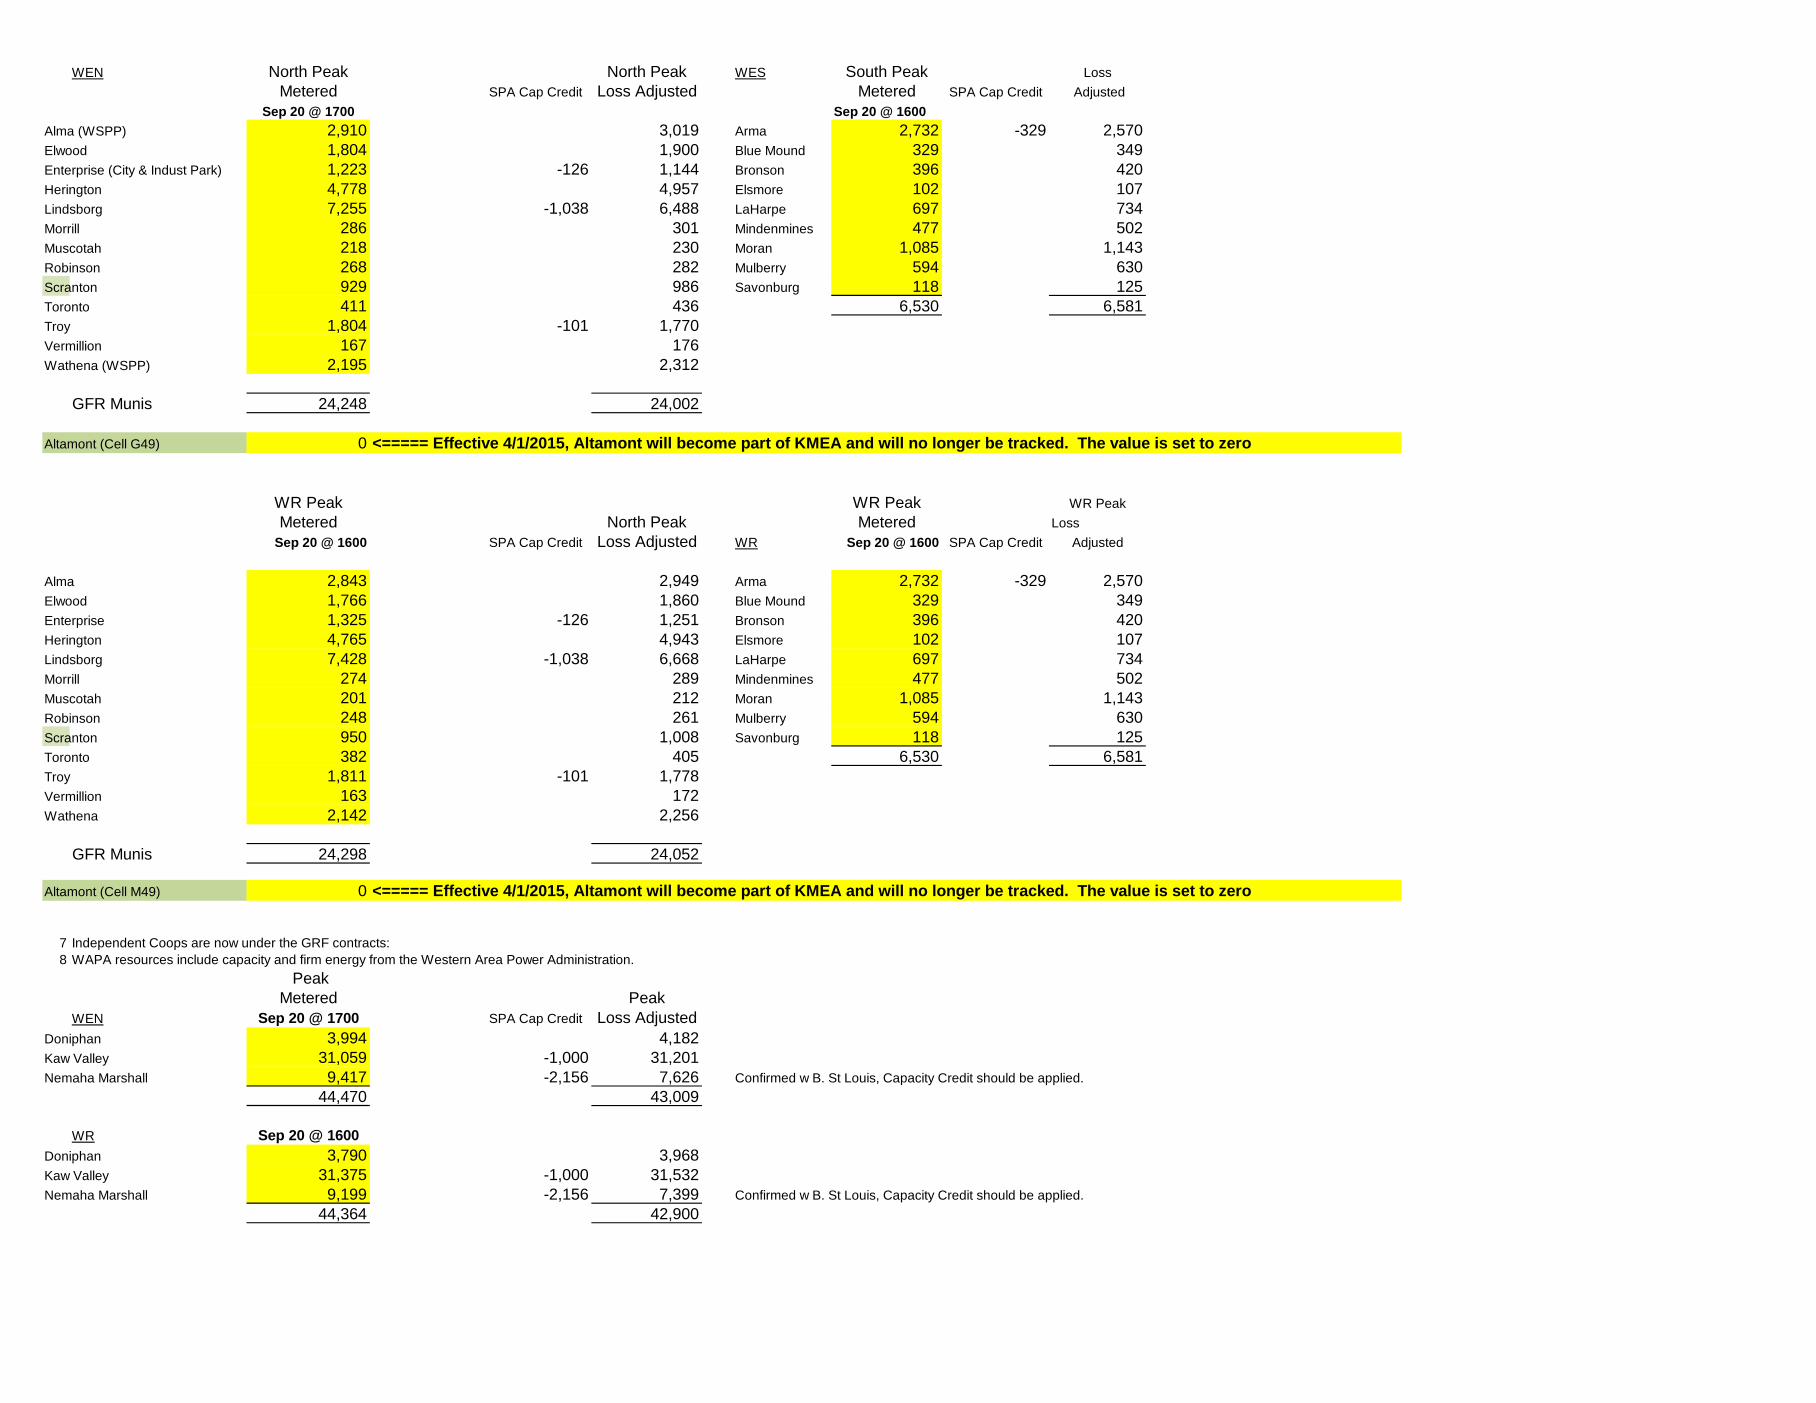
WEN North Peak North Peak WES South Peak LossMetered SPA Cap Credit Loss Adjusted Metered SPA Cap Credit Adjusted
Sep 20 @ 1700 Sep 20 @ 1600Alma (WSPP) 2,910 3,019 Arma 2,732 -329 2,570Elwood 1,804 1,900 Blue Mound 329 349Enterprise (City & Indust Park) 1,223 -126 1,144 Bronson 396 420Herington 4,778 4,957 Elsmore 102 107Lindsborg 7,255 -1,038 6,488 LaHarpe 697 734Morrill 286 301 Mindenmines 477 502Muscotah 218 230 Moran 1,085 1,143Robinson 268 282 Mulberry 594 630Scranton 929 986 Savonburg 118 125Toronto 411 436 6,530 6,581Troy 1,804 -101 1,770Vermillion 167 176Wathena (WSPP) 2,195 2,312
GFR Munis 24,248 24,002
Altamont (Cell G49) 0 <===== Effective 4/1/2015, Altamont will become part of KMEA and will no longer be tracked. The value is set to zero
WR Peak WR Peak WR PeakMetered North Peak Metered Loss
Sep 20 @ 1600 SPA Cap Credit Loss Adjusted WR Sep 20 @ 1600 SPA Cap Credit Adjusted
Alma 2,843 2,949 Arma 2,732 -329 2,570Elwood 1,766 1,860 Blue Mound 329 349Enterprise 1,325 -126 1,251 Bronson 396 420Herington 4,765 4,943 Elsmore 102 107Lindsborg 7,428 -1,038 6,668 LaHarpe 697 734Morrill 274 289 Mindenmines 477 502Muscotah 201 212 Moran 1,085 1,143Robinson 248 261 Mulberry 594 630Scranton 950 1,008 Savonburg 118 125Toronto 382 405 6,530 6,581Troy 1,811 -101 1,778Vermillion 163 172Wathena 2,142 2,256
GFR Munis 24,298 24,052
Altamont (Cell M49) 0 <===== Effective 4/1/2015, Altamont will become part of KMEA and will no longer be tracked. The value is set to zero
7 Independent Coops are now under the GRF contracts:8 WAPA resources include capacity and firm energy from the Western Area Power Administration.
PeakMetered Peak
WEN Sep 20 @ 1700 SPA Cap Credit Loss AdjustedDoniphan 3,994 4,182Kaw Valley 31,059 -1,000 31,201Nemaha Marshall 9,417 -2,156 7,626 Confirmed w B. St Louis, Capacity Credit should be applied.
44,470 43,009
WR Sep 20 @ 1600Doniphan 3,790 3,968Kaw Valley 31,375 -1,000 31,532Nemaha Marshall 9,199 -2,156 7,399 Confirmed w B. St Louis, Capacity Credit should be applied.
44,364 42,900

North Peak South Peak WR Peak Demand Peak Peak PeakMetered Metered Metered Loss Factors Loss Adjusted Loss Adjusted Loss Adjusted
Sep 20 @ 1700 Sep 20 @ 1600 Sep 20 @ 1600 (From Bills) Sep 20 @ 1700 Sep 20 @ 1600 Sep 20 @ 1600Alma Net 2.91 2.843 2.843 0.0374 3,019 2,949 2,949Arma Net 2.687 2.732 2.732 0.0610 2,851 2,899 2,899Blue Mound Net 0.331 0.329 0.329 0.0610 351 349 349Bronson Net 0.414 0.396 0.396 0.0610 439 420 420DP Bellevue Net 0.85 0.85 0.85 0.0534 895 895 895DP Blair Net 1.109 1.057 1.057 0.0307 1,143 1,089 1,089DP Midway Net 0.556 0.486 0.486 0.0534 586 512 512DP Troy Net 1.479 1.397 1.397 0.0534 1,558 1,472 1,472Elsmore Net 0.1 0.102 0.102 0.0534 105 107 107Elwood Net 1.804 1.766 1.766 0.0534 1,900 1,860 1,860Enterprise City Net 1.131 1.186 1.186 0.0374 1,173 1,230 1,230Enterprise Industrial Park Net 0.092 0.139 0.139 0.0534 97 146 146Herington Net 4.778 4.765 4.765 0.0374 4,957 4,943 4,943KV Baldwin Creek Net 1.583 1.564 1.564 0.0534 1,668 1,648 1,648KV Banning Corner Net 0.161 0.159 0.159 0.0534 170 167 167KV Carbondale Net 3.005 2.938 2.938 0.0307 3,097 3,028 3,028KV Crooked Post Net 11.099 11.714 11.714 0.0374 11,514 12,152 12,152KV Delia 2 Net 2.765 2.706 2.706 0.0307 2,850 2,789 2,789KV Hoyt Net 0 0 0 0.0307 0 0 0KV Keene Net 3.18 3.115 3.115 0.0307 3,278 3,211 3,211KV Kiro Net 3.294 3.154 3.154 0.0307 3,395 3,251 3,251KV Pauline Net 0.663 0.825 0.825 0.0534 698 869 869KV Rossville Net 0 0 0 0.0307 0 0 0KV Scranton Net 0.445 0.429 0.429 0.0534 469 452 452KV Stull Net 3.838 3.76 3.76 0.0374 3,982 3,901 3,901KV Watson Net 1.026 1.011 1.011 0.0534 1,081 1,065 1,065La Harpe Net 0.711 0.697 0.697 0.0534 749 734 734Lindsborg Net 7.255 7.428 7.428 0.0374 7,526 7,706 7,706Mindenmines Net 0.485 0.477 0.477 0.0534 511 502 502Moran Net 1.092 1.085 1.085 0.0534 1,150 1,143 1,143Morrill Net 0.286 0.274 0.274 0.0534 301 289 289Mulberry Net 0.618 0.594 0.594 0.0611 656 630 630Muscotah Net 0.218 0.201 0.201 0.0534 230 212 212NM Axtell Net 0.709 0.724 0.724 0.0610 752 768 768NM Baileyville Net 1.484 1.617 1.617 0.0307 1,530 1,667 1,667NM Frankfort Net 0.398 0.371 0.371 0.0534 419 391 391NM Hanover Net 0.666 0.636 0.636 0.0374 691 660 660NM King Hill Net 1.036 0.981 0.981 0.0374 1,075 1,018 1,018NM Lone Elm Net 0.764 0.729 0.729 0.0374 793 756 756NM Marysville Net 1.139 1.125 1.125 0.0374 1,182 1,167 1,167NM Seneca Net 2.072 1.946 1.946 0.0374 2,149 2,019 2,019NM Smittyville Net 1.149 1.07 1.07 0.0374 1,192 1,110 1,110Robinson Net 0.268 0.248 0.248 0.0534 282 261 261Savonburg Net 0.119 0.118 0.118 0.0610 126 125 125Scranton Net 0.929 0.95 0.95 0.0610 986 1,008 1,008Toronto Net 0.411 0.382 0.382 0.0610 436 405 405Troy Net 1.804 1.811 1.811 0.0374 1,871 1,879 1,879Vermillion Net 0.167 0.163 0.163 0.0534 176 172 172Wathena Net 2.195 2.142 2.142 0.0534 2,312 2,256 2,256

I) DAY/HOUR OF HIGHEST PEAK REPORT LOAD:
II) SYSTEM LOAD NET CALCULATIONNative Peak Report Load 2,028 1,657 2,028 1,657 3,684less: Kaw Valley, SPA Resources1 1000 1 0 1 0 1 Nemaha, SPA Resources1 2205 2 0 2 0 2 Lindsborg, SPA Resources1 908 1 0 1 0 1 Enterprise, Troy & Arma Resources 208 0.2 319 0.3 0.2 0.3 1
Total Systen Load Net 2,024 1,656 2,023 1,656 3,680
III) TOTAL SYSTEM PEAK RESPONSIBILITY (TSPR)
A) FIRM PURCHASECities, GRDA Resources3 5 * 14 * 5 * 14 * 19KEPCo Resources4 126 88 126 88 214WES Cities, SPA Resources2 0 * 10 * 0 10 * 10Kaw Valley, SPA Resources2 1 0 1 0 1Nemaha, SPA Resources2 2 0 2 0 2Lindsborg, SPA Resources2 1 0 1 0 1McPherson 57 * 0 * 57 * 0 * 57Enterprise, Troy & Arma Resources8 0.2 0.3 0.2 0.3 1Total Firm Purchases 192 113 192 113 305
B) FIRM SALESCities, GRDA Resources3 5 * 14 * 5 14 19KEPCo Resources4 0 0 0 0 0Kaw Valley, SPA Resources2 1 0 1 0 1Nemaha, SPA Resources2 2 0 2 0 2Lindsborg, SPA Resources2 1 0 1 0 1WES Cities, SPA Resources2 0 * 10 * 0 10 10Enterprise, Troy & Arma Resources8 0.2 0.3 0.2 0.3 1
Total Firm Sales 9 24 9 24 34
TSPR (System Load Net - Firm Purchases + Firm Sales) 1,841 1,568 1,840 1,568 3,409
CALCULATION OF WEN & WES AND TOTAL WESTAR LOADOctober 2016
Individual Companies Total WestarWestar North (WEN) Westar South (WES) WEN Contribution WES Contribution Westar Energy
Oct 17 @ 1600 Oct 17 @ 1700 Oct 17 @ 1700

IV) FERC FORM 1, PAGE 401b LOAD5
less: Non-Generating Cities6 0 0 0 0 0Independent Coops7 0 0 0 0 0Total Non-Generating Load 0 0 0 0 0
Total 401b Load (TSPR - Non Gen.) 1,841 1,568 1,840 1,568 3,409
V) RETAILless: KEPCo
KEPCo - Westar 79 94 82 94 176 KEPCo - MKEC (WPEK) 35 0 36 0 36 KEPCo - Midwest 9 0 9 0 9 KEPCo - EDE 0 3 0 2 2 KEPCo - KCPL 11 0 10 0 10
less: McPherson 129 0 127 0 127less: GFR Munis 17 4 17 4 21less: GFR Coops 33 0 33 0 33
add: KEPCo Resources4 126 88 126 88 214McPherson Resources 57 0 57 0 57
RETAIL LOAD: 1,711 1,556 1,708 1,556 3,264
VI) TOTAL SYSTEM CAPACITY RESPONSIBILITY* 2,092 1,782 2,091 1,782 3,873
Oct 17 @ 1600 Oct 17 @ 1700 Oct 17 @ 1700
Individual Companies Total WestarWestar North (WEN) Westar South (WES) WEN Contribution WES Contribution Westar Energy

VII) NOTES:* The SPP Criteria document, Section 2.1.9, references the minimum capacity margin, which is currently 12%. SPP member companies would have to approve any change to this amount. 2 SPA resources include capacity and firm energy from the Southwestern Power Administration.contract 3 GRDA resources include capacity and firm energy from the Grand River Dam Authority.4 KEPCo resources includes WCGS (Wolf Creek Generation Services), SPA (Southwestern Power Admin), Sharpe Generation, WAPA (Western Area Power Administration). They are listed on KEPCo's monthly bill.8 WAPA resources include capacity and firm energy from the Western Area Power Administration.
Allocation of KEPCo Resources Maximum Proration Prorationa) KEPCo's Resources Capacity (kW) North South Effective March 2014, allocation of KEPCo's resources has been changed to WCGS 70,000 allow 100% of their resources to be allocated based on the load share SPA - Firm 100,000 shown in cells M57:M61 for WEN and O57:O61 for WES. This is due to changes Sharpe Generation 0 resulting from the new SPP market. Sharpe generation is not included. WAPA 12,000 Discussed with Julie Lux, Chris O'Neill, and Bill Birnel Iatan II 32,000 Total 214,000 125,786 88,214
North Peak South Peak WR Peak WR Peak Demand North Peak South Peak WR Peak WR PeakMetered Metered North South Loss Factors Loss Adjusted Loss AdjustedLoss AdjustedLoss AdjustedOct 17 @ 1600 Oct 17 @ 1700 Oct 17 @ 1700 Oct 17 @ 1700 (From Bills) Oct 17 @ 1600 Oct 17 @ 1700 Oct 17 @ 1700 Oct 17 @ 1700
KEPCo - MKEC (WPEK) 35 0 36 0 1.0632 37.3957 0.0000 37.7872 0.0000 KEPCo - Midwest 9 0 9 0 1.0426 9.2848 0.0000 9.5004 0.0000 KEPCo - EDE 0 3 0 2 0.0000 0.0000 2.6006 0.0000 2.4435 KEPCo - KCPL 11 0 10 0 0.0000 10.5149 0.0000 10.4082 0.0000
57.1954 2.6006 57.6958 2.4435
KEPCo - Westar -- Calculate loss Adjustments for KEPCo-Westar North and South. These values are used in the GFR Calculation on Worksheet D only. Enter only the values shown in yellow.O1 23.4202 18.6475 24.6344 18.6475 1.0307 24.1392 19.2200 25.3907 19.2200O10 -0.0455 0 -0.0496 0 1.0954 -0.0498 0.0000 -0.0543 0.0000O11 -0.766 0 -0.6199 0 1.085 -0.8311 0.0000 -0.6726 0.0000O2 30.3771 59.315 31.0411 59.315 1.0374 31.5132 61.5334 32.2020 61.5334O4 26.4298 14.0752 27.4229 14.0752 1.0534 27.8412 14.8268 28.8873 14.8268O5 0 1.6082 0 1.6082 1.061 0.0000 1.7063 0.0000 1.7063O6 0 0 0 0 1.0611 0.0000 0.0000 0.0000 0.0000O8 0.0389 0.3498 0.0343 0.3498 1.0803 0.0420 0.3779 0.0371 0.3779O9 -0.0111 0 -0.0099 0 1.0892 -0.0121 0.0000 -0.0108 0.0000Blank 0 0 0 0 1 0.0000 0.0000 0.0000 0.0000
KEPCo - Westar 79.4434 93.9957 82.4533 93.9957 82.6425 97.6644 85.7793 97.6644
VIII) NON-GENERATING CITIES
5 The load reported on page 401b is requirements load associated with requirement energy reported on Form 1, page 311 6 Non-Generating cities only includes the City of Altamont. It is expected to become a GFR customer effective April 1, 2015

WEN North Peak North Peak WES South Peak LossMetered SPA Cap Credit Loss Adjusted Metered SPA Cap Credit Adjusted
Oct 17 @ 1600 Oct 17 @ 1700Alma (WSPP) 2,272 2,357 Arma 1,713 -319 1,498Elwood 1,344 1,416 Blue Mound 258 274Enterprise (City & Indust Park) 843 -114 762 Bronson 273 290Herington 3,293 3,416 Elsmore 47 50Lindsborg 5,199 -908 4,485 LaHarpe 461 486Morrill 161 170 Mindenmines 336 354Muscotah 115 121 Moran 666 702Robinson 162 171 Mulberry 394 418Scranton 626 664 Savonburg 61 65Toronto 248 263 4,209 4,135Troy 1,196 -94 1,147Vermillion 106 112Wathena (WSPP) 1,579 1,663
GFR Munis 17,144 16,747
Altamont (Cell G49) 0 <===== Effective 4/1/2015, Altamont will become part of KMEA and will no longer be tracked. The value is set to zero
WR Peak WR Peak WR PeakMetered North Peak Metered Loss Oct 17 @ 1700 SPA Cap Credit Loss Adjusted WR Oct 17 @ 1700 SPA Cap Credit Adjusted
Alma 2,106 2,185 Arma 1,713 -319 1,498Elwood 1,294 1,363 Blue Mound 258 274Enterprise 752 -114 667 Bronson 273 290Herington 3,222 3,343 Elsmore 47 50Lindsborg 5,262 -908 4,551 LaHarpe 461 486Morrill 177 186 Mindenmines 336 354Muscotah 133 140 Moran 666 702Robinson 170 179 Mulberry 394 418Scranton 685 727 Savonburg 61 65Toronto 262 278 4,209 4,135Troy 1,193 -94 1,144Vermillion 100 105Wathena 1,587 1,672
GFR Munis 16,943 16,540
Altamont (Cell M49) 0 <===== Effective 4/1/2015, Altamont will become part of KMEA and will no longer be tracked. The value is set to zero
7 Independent Coops are now under the GRF contracts:8 WAPA resources include capacity and firm energy from the Western Area Power Administration.
PeakMetered Peak
WEN Oct 17 @ 1600 SPA Cap Credit Loss AdjustedDoniphan 2,811 2,944Kaw Valley 23,378 -1,000 23,243Nemaha Marshall 6,723 -2,205 4,776 Confirmed w B. St Louis, Capacity Credit should be applied.
32,912 30,963
WR Oct 17 @ 1700Doniphan 2,972 3,113Kaw Valley 23,460 -1,000 23,325Nemaha Marshall 7,025 -2,205 5,089 Confirmed w B. St Louis, Capacity Credit should be applied.
33,457 31,527
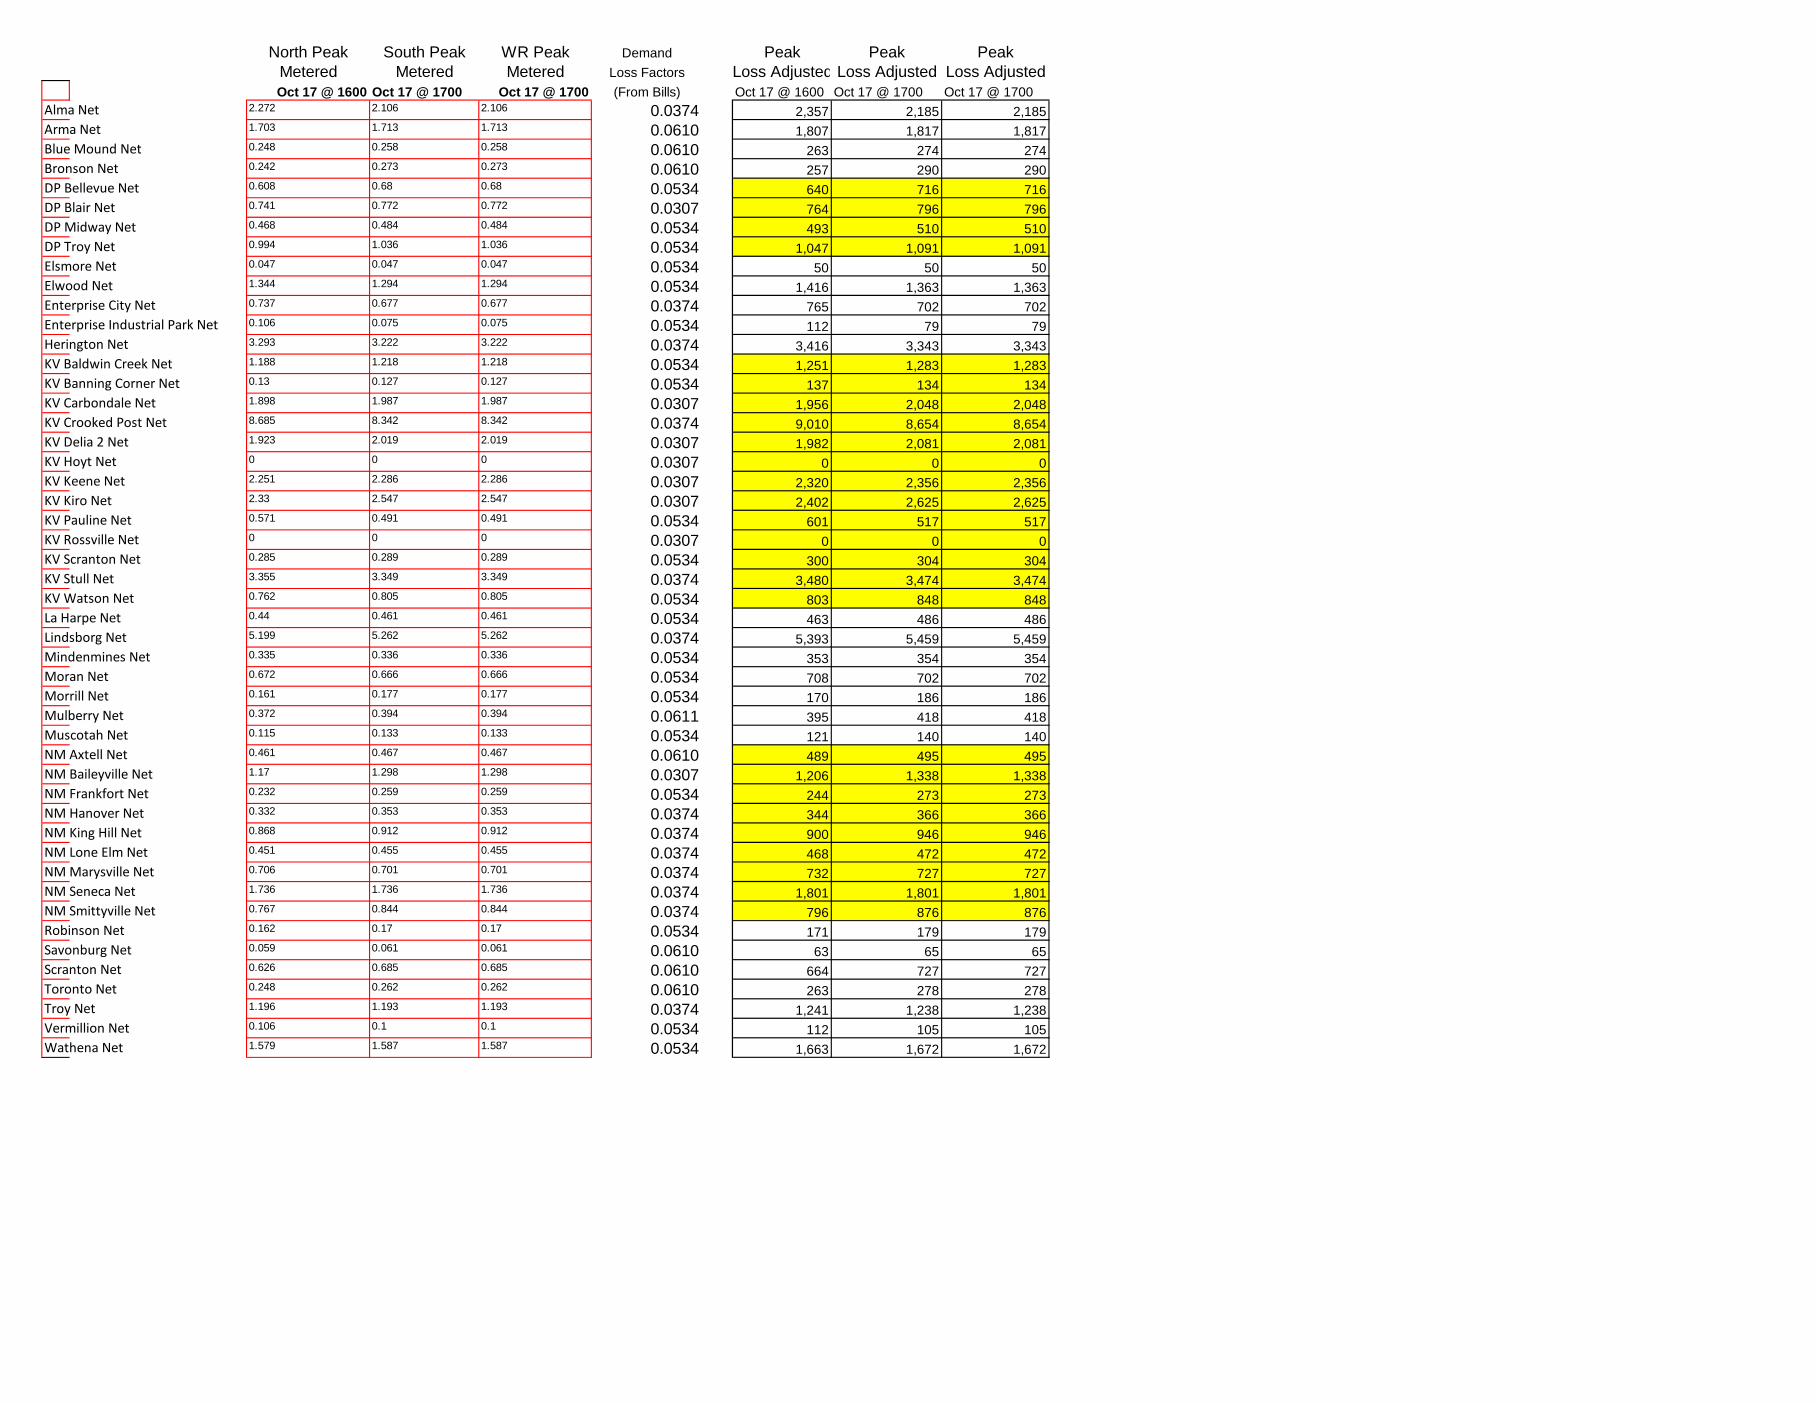
North Peak South Peak WR Peak Demand Peak Peak PeakMetered Metered Metered Loss Factors Loss Adjusted Loss Adjusted Loss AdjustedOct 17 @ 1600 Oct 17 @ 1700 Oct 17 @ 1700 (From Bills) Oct 17 @ 1600 Oct 17 @ 1700 Oct 17 @ 1700
Alma Net 2.272 2.106 2.106 0.0374 2,357 2,185 2,185Arma Net 1.703 1.713 1.713 0.0610 1,807 1,817 1,817Blue Mound Net 0.248 0.258 0.258 0.0610 263 274 274Bronson Net 0.242 0.273 0.273 0.0610 257 290 290DP Bellevue Net 0.608 0.68 0.68 0.0534 640 716 716DP Blair Net 0.741 0.772 0.772 0.0307 764 796 796DP Midway Net 0.468 0.484 0.484 0.0534 493 510 510DP Troy Net 0.994 1.036 1.036 0.0534 1,047 1,091 1,091Elsmore Net 0.047 0.047 0.047 0.0534 50 50 50Elwood Net 1.344 1.294 1.294 0.0534 1,416 1,363 1,363Enterprise City Net 0.737 0.677 0.677 0.0374 765 702 702Enterprise Industrial Park Net 0.106 0.075 0.075 0.0534 112 79 79Herington Net 3.293 3.222 3.222 0.0374 3,416 3,343 3,343KV Baldwin Creek Net 1.188 1.218 1.218 0.0534 1,251 1,283 1,283KV Banning Corner Net 0.13 0.127 0.127 0.0534 137 134 134KV Carbondale Net 1.898 1.987 1.987 0.0307 1,956 2,048 2,048KV Crooked Post Net 8.685 8.342 8.342 0.0374 9,010 8,654 8,654KV Delia 2 Net 1.923 2.019 2.019 0.0307 1,982 2,081 2,081KV Hoyt Net 0 0 0 0.0307 0 0 0KV Keene Net 2.251 2.286 2.286 0.0307 2,320 2,356 2,356KV Kiro Net 2.33 2.547 2.547 0.0307 2,402 2,625 2,625KV Pauline Net 0.571 0.491 0.491 0.0534 601 517 517KV Rossville Net 0 0 0 0.0307 0 0 0KV Scranton Net 0.285 0.289 0.289 0.0534 300 304 304KV Stull Net 3.355 3.349 3.349 0.0374 3,480 3,474 3,474KV Watson Net 0.762 0.805 0.805 0.0534 803 848 848La Harpe Net 0.44 0.461 0.461 0.0534 463 486 486Lindsborg Net 5.199 5.262 5.262 0.0374 5,393 5,459 5,459Mindenmines Net 0.335 0.336 0.336 0.0534 353 354 354Moran Net 0.672 0.666 0.666 0.0534 708 702 702Morrill Net 0.161 0.177 0.177 0.0534 170 186 186Mulberry Net 0.372 0.394 0.394 0.0611 395 418 418Muscotah Net 0.115 0.133 0.133 0.0534 121 140 140NM Axtell Net 0.461 0.467 0.467 0.0610 489 495 495NM Baileyville Net 1.17 1.298 1.298 0.0307 1,206 1,338 1,338NM Frankfort Net 0.232 0.259 0.259 0.0534 244 273 273NM Hanover Net 0.332 0.353 0.353 0.0374 344 366 366NM King Hill Net 0.868 0.912 0.912 0.0374 900 946 946NM Lone Elm Net 0.451 0.455 0.455 0.0374 468 472 472NM Marysville Net 0.706 0.701 0.701 0.0374 732 727 727NM Seneca Net 1.736 1.736 1.736 0.0374 1,801 1,801 1,801NM Smittyville Net 0.767 0.844 0.844 0.0374 796 876 876Robinson Net 0.162 0.17 0.17 0.0534 171 179 179Savonburg Net 0.059 0.061 0.061 0.0610 63 65 65Scranton Net 0.626 0.685 0.685 0.0610 664 727 727Toronto Net 0.248 0.262 0.262 0.0610 263 278 278Troy Net 1.196 1.193 1.193 0.0374 1,241 1,238 1,238Vermillion Net 0.106 0.1 0.1 0.0534 112 105 105Wathena Net 1.579 1.587 1.587 0.0534 1,663 1,672 1,672

I) DAY/HOUR OF HIGHEST PEAK REPORT LOAD:
II) SYSTEM LOAD NET CALCULATIONNative Peak Report Load 1,655 1,446 1,640 1,446 3,086less: Kaw Valley, SPA Resources1 1000 1 0 1 0 1 Nemaha, SPA Resources1 2187 2 0 2 0 2 Lindsborg, SPA Resources1 895 1 0 1 0 1 Enterprise, Troy & Arma Resources 205 0.2 315 0.3 0.2 0.3 1
Total Systen Load Net 1,650 1,446 1,636 1,446 3,082
III) TOTAL SYSTEM PEAK RESPONSIBILITY (TSPR)
A) FIRM PURCHASECities, GRDA Resources3 5 * 14 * 5 * 14 * 19KEPCo Resources4 128 86 128 86 214WES Cities, SPA Resources2 0 * 10 * 0 10 * 10Kaw Valley, SPA Resources2 1 0 1 0 1Nemaha, SPA Resources2 2 0 2 0 2Lindsborg, SPA Resources2 1 0 1 0 1McPherson 57 * 0 * 57 * 0 * 57Enterprise, Troy & Arma Resources8 0.2 0.3 0.2 0.3 1Total Firm Purchases 194 111 194 111 305
B) FIRM SALESCities, GRDA Resources3 5 * 14 * 5 14 19KEPCo Resources4 0 0 0 0 0Kaw Valley, SPA Resources2 1 0 1 0 1Nemaha, SPA Resources2 2 0 2 0 2Lindsborg, SPA Resources2 1 0 1 0 1WES Cities, SPA Resources2 0 * 10 * 0 10 10Enterprise, Troy & Arma Resources8 0.2 0.3 0.2 0.3 1
Total Firm Sales 9 24 9 24 34
TSPR (System Load Net - Firm Purchases + Firm Sales) 1,466 1,359 1,451 1,359 2,810
CALCULATION OF WEN & WES AND TOTAL WESTAR LOADNovember 2016
Individual Companies Total WestarWestar North (WEN) Westar South (WES) WEN Contribution WES Contribution Westar Energy
Nov 1 @ 2000 Nov 1 @ 1600 Nov 1 @ 1600

IV) FERC FORM 1, PAGE 401b LOAD5
less: Non-Generating Cities6 0 0 0 0 0Independent Coops7 0 0 0 0 0Total Non-Generating Load 0 0 0 0 0
Total 401b Load (TSPR - Non Gen.) 1,466 1,359 1,451 1,359 2,810
V) RETAILless: KEPCo
KEPCo - Westar 71 70 56 70 126 KEPCo - MKEC (WPEK) 36 0 33 0 33 KEPCo - Midwest 8 0 8 0 8 KEPCo - EDE 0 2 0 2 2 KEPCo - KCPL 10 0 9 0 9
less: McPherson 120 0 124 0 124less: GFR Munis 12 3 12 3 15less: GFR Coops 27 0 22 0 22
add: KEPCo Resources4 128 86 128 86 214McPherson Resources 57 0 57 0 57
RETAIL LOAD: 1,366 1,371 1,371 1,371 2,742
VI) TOTAL SYSTEM CAPACITY RESPONSIBILITY* 1,665 1,545 1,649 1,545 3,194
Nov 1 @ 2000 Nov 1 @ 1600 Nov 1 @ 1600
Individual Companies Total WestarWestar North (WEN) Westar South (WES) WEN Contribution WES Contribution Westar Energy
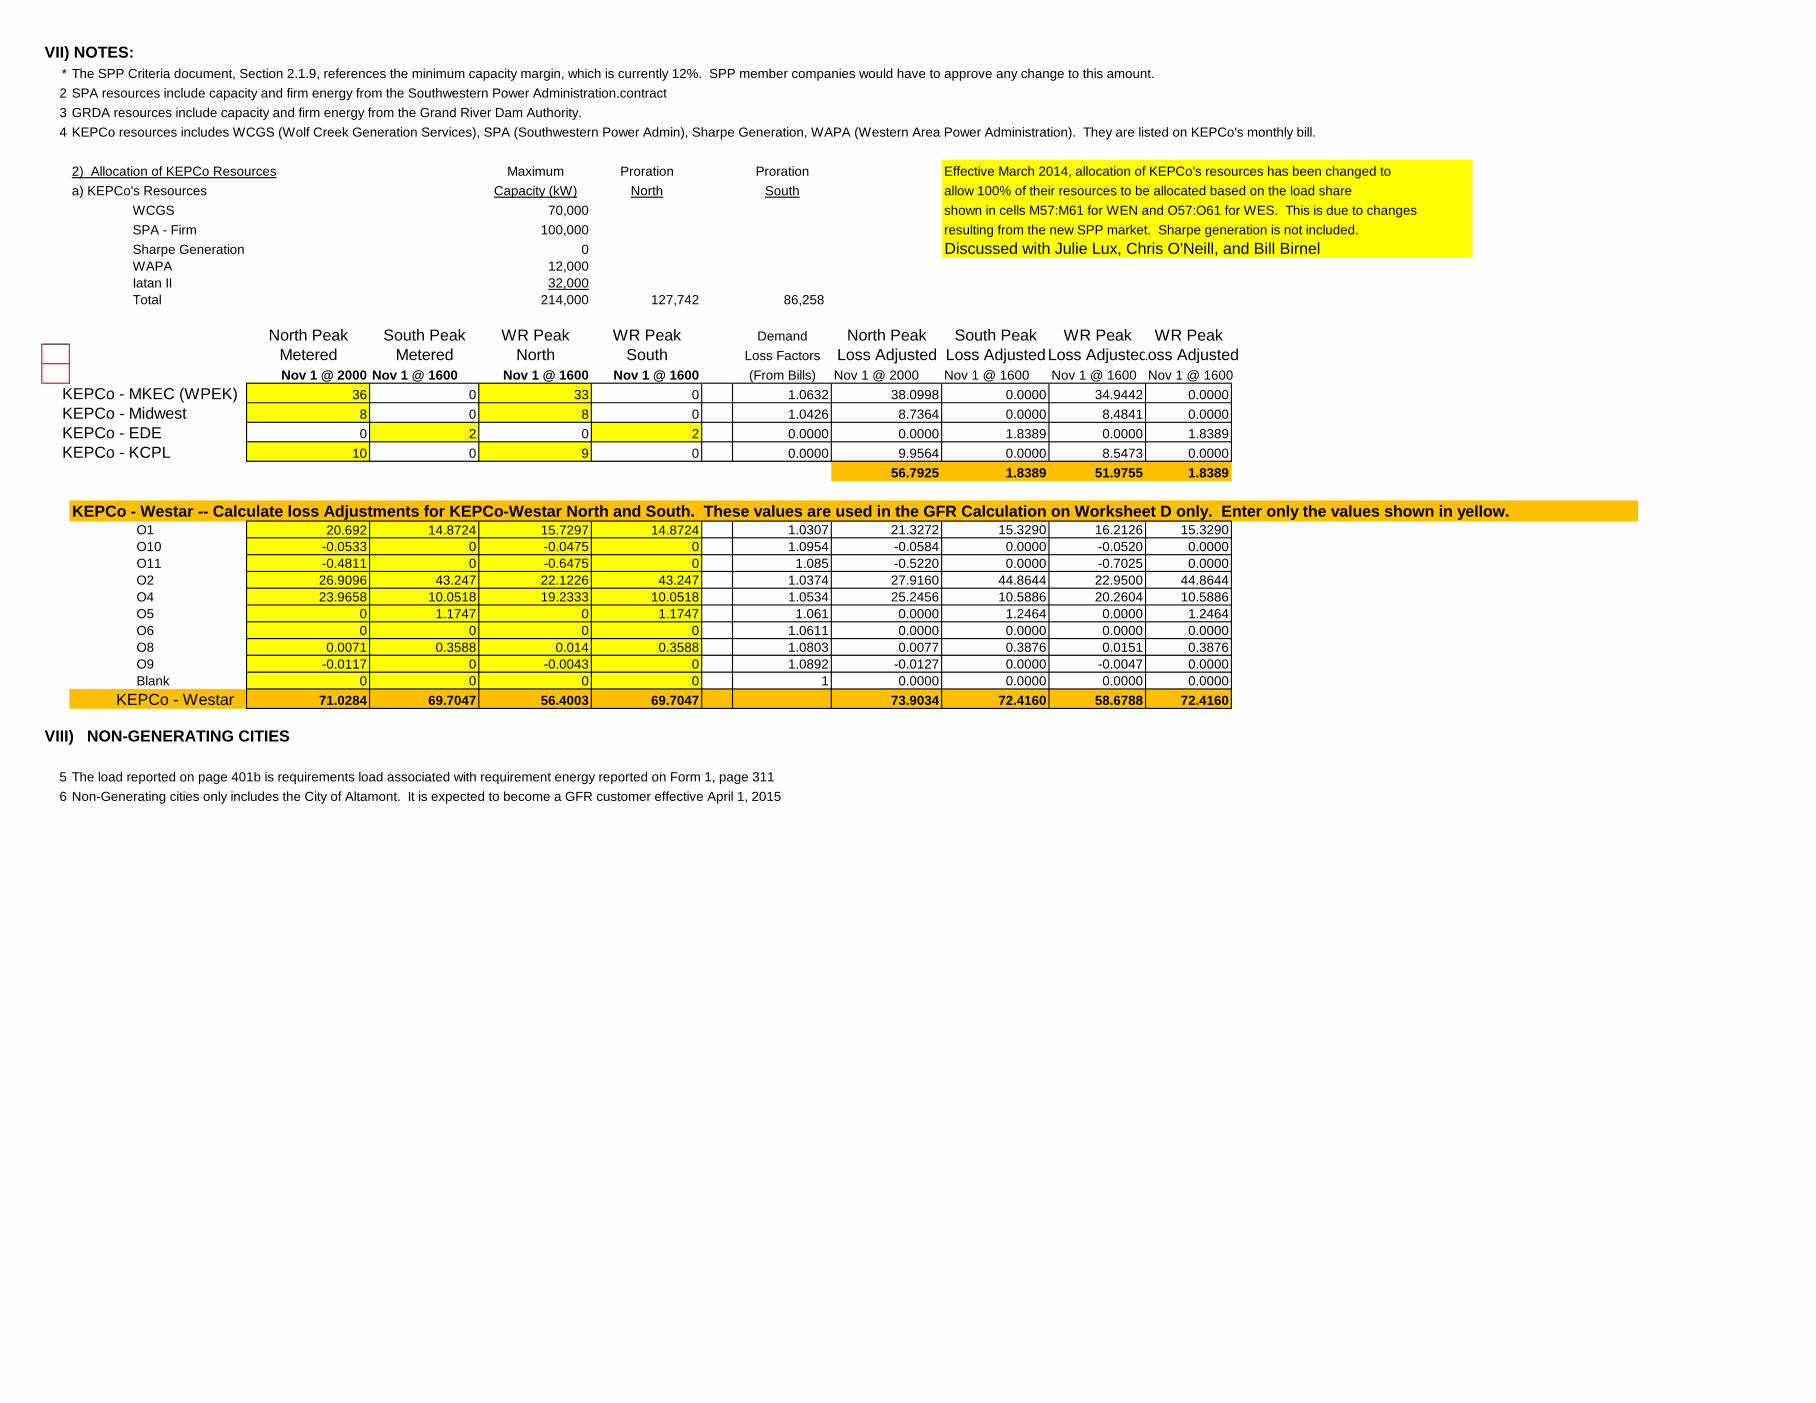
VII) NOTES:* The SPP Criteria document, Section 2.1.9, references the minimum capacity margin, which is currently 12%. SPP member companies would have to approve any change to this amount. 2 SPA resources include capacity and firm energy from the Southwestern Power Administration.contract 3 GRDA resources include capacity and firm energy from the Grand River Dam Authority.4 KEPCo resources includes WCGS (Wolf Creek Generation Services), SPA (Southwestern Power Admin), Sharpe Generation, WAPA (Western Area Power Administration). They are listed on KEPCo's monthly bill.
2) Allocation of KEPCo Resources Maximum Proration Proration Effective March 2014, allocation of KEPCo's resources has been changed to a) KEPCo's Resources Capacity (kW) North South allow 100% of their resources to be allocated based on the load share WCGS 70,000 shown in cells M57:M61 for WEN and O57:O61 for WES. This is due to changes SPA - Firm 100,000 resulting from the new SPP market. Sharpe generation is not included. Sharpe Generation 0 Discussed with Julie Lux, Chris O'Neill, and Bill Birnel WAPA 12,000 Iatan II 32,000 Total 214,000 127,742 86,258
North Peak South Peak WR Peak WR Peak Demand North Peak South Peak WR Peak WR PeakMetered Metered North South Loss Factors Loss Adjusted Loss AdjustedLoss AdjustedLoss AdjustedNov 1 @ 2000 Nov 1 @ 1600 Nov 1 @ 1600 Nov 1 @ 1600 (From Bills) Nov 1 @ 2000 Nov 1 @ 1600 Nov 1 @ 1600 Nov 1 @ 1600
KEPCo - MKEC (WPEK) 36 0 33 0 1.0632 38.0998 0.0000 34.9442 0.0000 KEPCo - Midwest 8 0 8 0 1.0426 8.7364 0.0000 8.4841 0.0000 KEPCo - EDE 0 2 0 2 0.0000 0.0000 1.8389 0.0000 1.8389 KEPCo - KCPL 10 0 9 0 0.0000 9.9564 0.0000 8.5473 0.0000
56.7925 1.8389 51.9755 1.8389
KEPCo - Westar -- Calculate loss Adjustments for KEPCo-Westar North and South. These values are used in the GFR Calculation on Worksheet D only. Enter only the values shown in yellow.O1 20.692 14.8724 15.7297 14.8724 1.0307 21.3272 15.3290 16.2126 15.3290O10 -0.0533 0 -0.0475 0 1.0954 -0.0584 0.0000 -0.0520 0.0000O11 -0.4811 0 -0.6475 0 1.085 -0.5220 0.0000 -0.7025 0.0000O2 26.9096 43.247 22.1226 43.247 1.0374 27.9160 44.8644 22.9500 44.8644O4 23.9658 10.0518 19.2333 10.0518 1.0534 25.2456 10.5886 20.2604 10.5886O5 0 1.1747 0 1.1747 1.061 0.0000 1.2464 0.0000 1.2464O6 0 0 0 0 1.0611 0.0000 0.0000 0.0000 0.0000O8 0.0071 0.3588 0.014 0.3588 1.0803 0.0077 0.3876 0.0151 0.3876O9 -0.0117 0 -0.0043 0 1.0892 -0.0127 0.0000 -0.0047 0.0000Blank 0 0 0 0 1 0.0000 0.0000 0.0000 0.0000
KEPCo - Westar 71.0284 69.7047 56.4003 69.7047 73.9034 72.4160 58.6788 72.4160
VIII) NON-GENERATING CITIES
5 The load reported on page 401b is requirements load associated with requirement energy reported on Form 1, page 311 6 Non-Generating cities only includes the City of Altamont. It is expected to become a GFR customer effective April 1, 2015
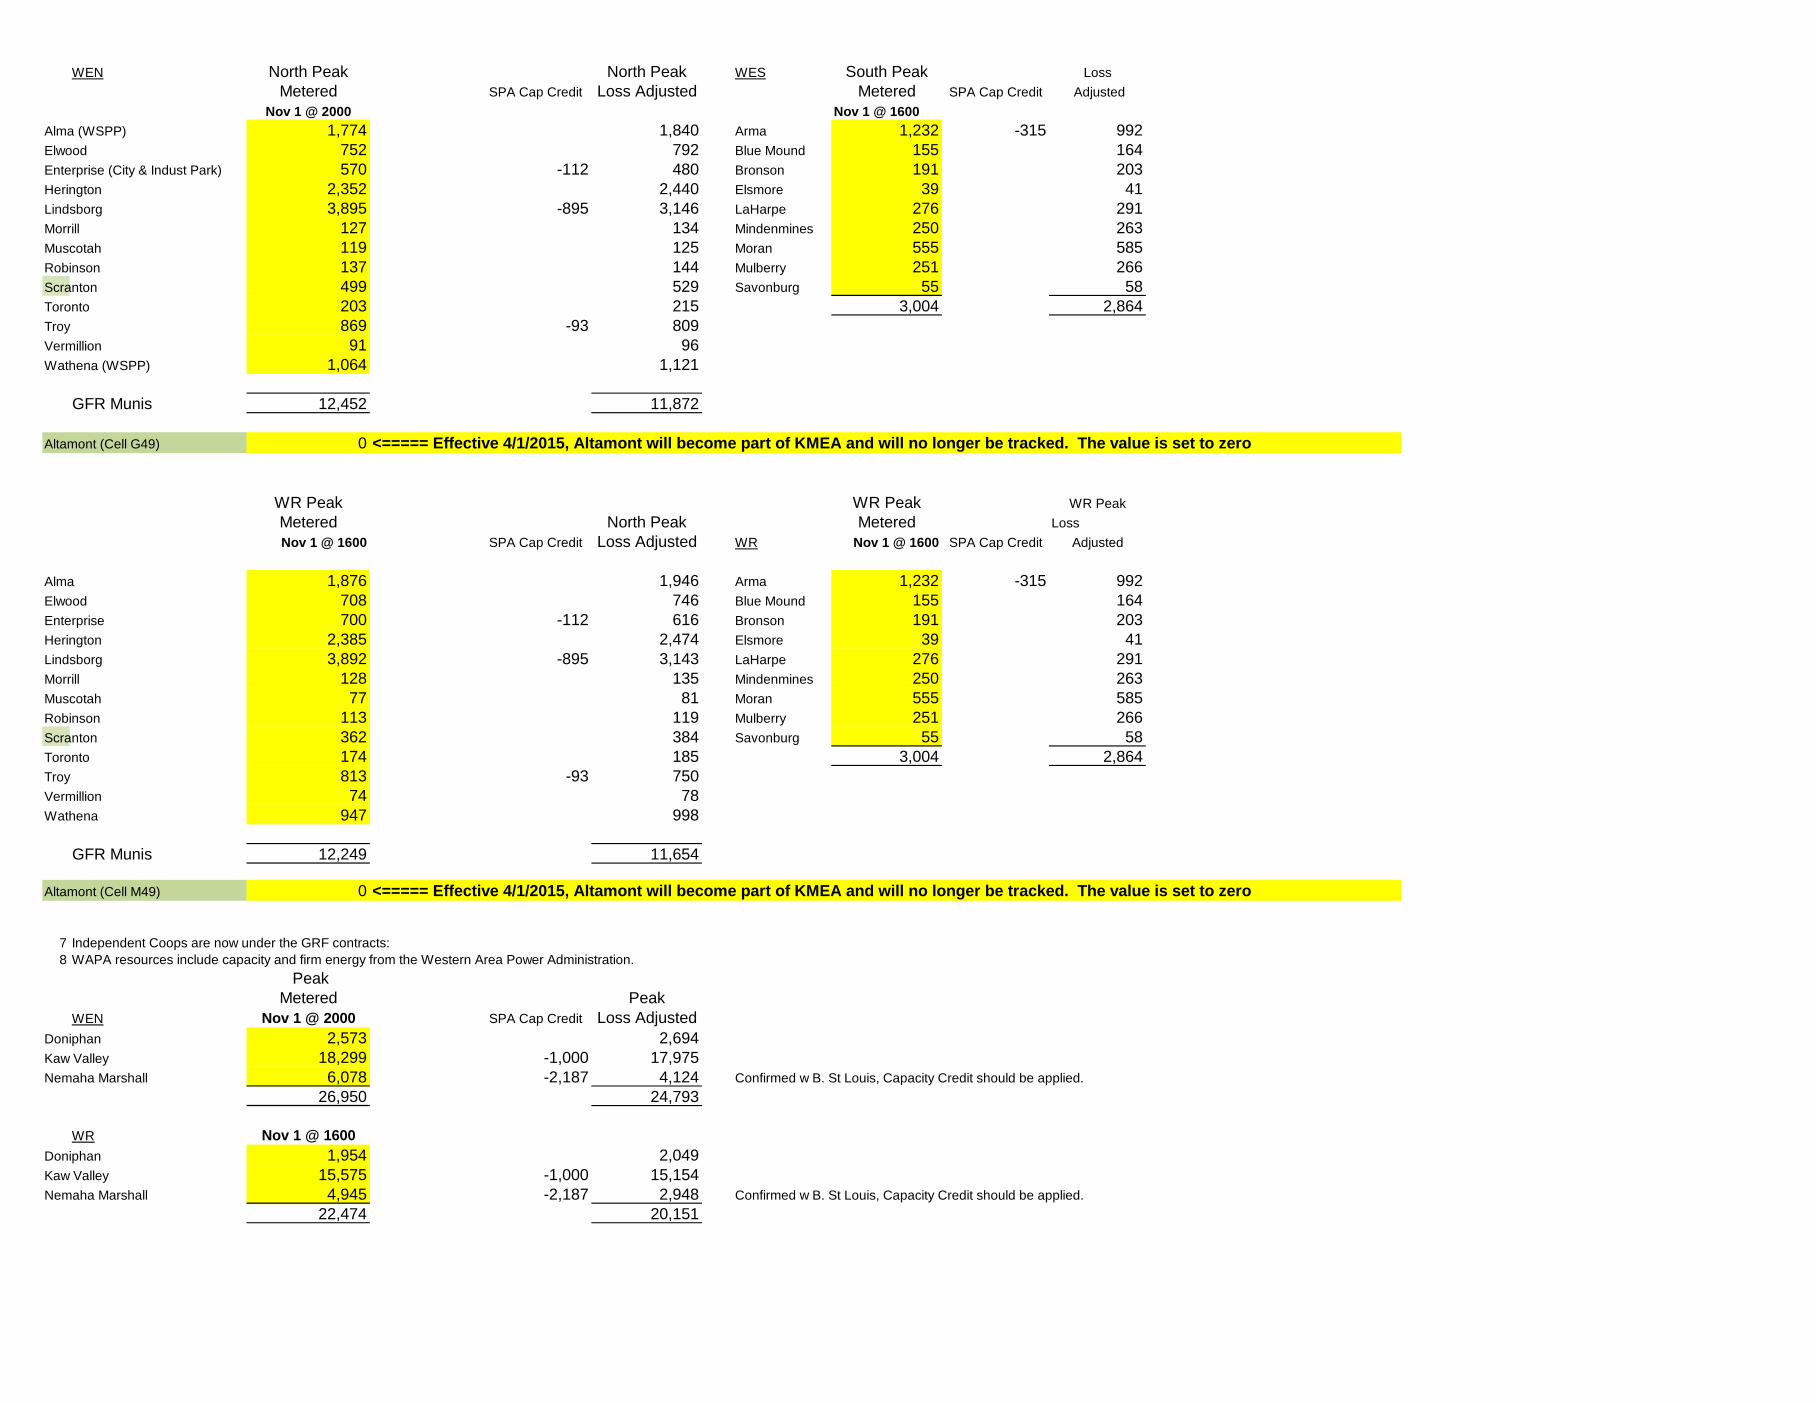
WEN North Peak North Peak WES South Peak LossMetered SPA Cap Credit Loss Adjusted Metered SPA Cap Credit Adjusted
Nov 1 @ 2000 Nov 1 @ 1600Alma (WSPP) 1,774 1,840 Arma 1,232 -315 992Elwood 752 792 Blue Mound 155 164Enterprise (City & Indust Park) 570 -112 480 Bronson 191 203Herington 2,352 2,440 Elsmore 39 41Lindsborg 3,895 -895 3,146 LaHarpe 276 291Morrill 127 134 Mindenmines 250 263Muscotah 119 125 Moran 555 585Robinson 137 144 Mulberry 251 266Scranton 499 529 Savonburg 55 58Toronto 203 215 3,004 2,864Troy 869 -93 809Vermillion 91 96Wathena (WSPP) 1,064 1,121
GFR Munis 12,452 11,872
Altamont (Cell G49) 0 <===== Effective 4/1/2015, Altamont will become part of KMEA and will no longer be tracked. The value is set to zero
WR Peak WR Peak WR PeakMetered North Peak Metered Loss Nov 1 @ 1600 SPA Cap Credit Loss Adjusted WR Nov 1 @ 1600 SPA Cap Credit Adjusted
Alma 1,876 1,946 Arma 1,232 -315 992Elwood 708 746 Blue Mound 155 164Enterprise 700 -112 616 Bronson 191 203Herington 2,385 2,474 Elsmore 39 41Lindsborg 3,892 -895 3,143 LaHarpe 276 291Morrill 128 135 Mindenmines 250 263Muscotah 77 81 Moran 555 585Robinson 113 119 Mulberry 251 266Scranton 362 384 Savonburg 55 58Toronto 174 185 3,004 2,864Troy 813 -93 750Vermillion 74 78Wathena 947 998
GFR Munis 12,249 11,654
Altamont (Cell M49) 0 <===== Effective 4/1/2015, Altamont will become part of KMEA and will no longer be tracked. The value is set to zero
7 Independent Coops are now under the GRF contracts:8 WAPA resources include capacity and firm energy from the Western Area Power Administration.
PeakMetered Peak
WEN Nov 1 @ 2000 SPA Cap Credit Loss AdjustedDoniphan 2,573 2,694Kaw Valley 18,299 -1,000 17,975Nemaha Marshall 6,078 -2,187 4,124 Confirmed w B. St Louis, Capacity Credit should be applied.
26,950 24,793
WR Nov 1 @ 1600Doniphan 1,954 2,049Kaw Valley 15,575 -1,000 15,154Nemaha Marshall 4,945 -2,187 2,948 Confirmed w B. St Louis, Capacity Credit should be applied.
22,474 20,151

North Peak South Peak WR Peak Demand Peak Peak PeakMetered Metered Metered Loss Factors Loss Adjusted Loss Adjusted Loss AdjustedNov 1 @ 2000 Nov 1 @ 1600 Nov 1 @ 1600 (From Bills) Nov 1 @ 2000 Nov 1 @ 1600 Nov 1 @ 1600
Alma Net 1.774 1.876 1.876 0.0374 1,840 1,946 1,946Arma Net 1.283 1.232 1.232 0.0610 1,361 1,307 1,307Blue Mound Net 0.189 0.155 0.155 0.0610 201 164 164Bronson Net 0.208 0.191 0.191 0.0610 221 203 203DP Bellevue Net 0.48 0.582 0.582 0.0534 506 613 613DP Blair Net 0.71 0.412 0.412 0.0307 732 425 425DP Midway Net 0.312 0.213 0.213 0.0534 329 224 224DP Troy Net 1.071 0.747 0.747 0.0534 1,128 787 787Elsmore Net 0.05 0.039 0.039 0.0534 53 41 41Elwood Net 0.752 0.708 0.708 0.0534 792 746 746Enterprise City Net 0.525 0.58 0.58 0.0374 545 602 602Enterprise Industrial Park Net 0.045 0.12 0.12 0.0534 47 126 126Herington Net 2.352 2.385 2.385 0.0374 2,440 2,474 2,474KV Baldwin Creek Net 1.103 0.947 0.947 0.0534 1,162 998 998KV Banning Corner Net 0.123 0.114 0.114 0.0534 130 120 120KV Carbondale Net 1.783 1.127 1.127 0.0307 1,838 1,162 1,162KV Crooked Post Net 6.551 5.875 5.875 0.0374 6,796 6,095 6,095KV Delia 2 Net 1.76 1.291 1.291 0.0307 1,814 1,331 1,331KV Hoyt Net 0.001 0.001 0.001 0.0307 1 1 1KV Keene Net 1.806 1.538 1.538 0.0307 1,861 1,585 1,585KV Kiro Net 1.843 1.563 1.563 0.0307 1,900 1,611 1,611KV Pauline Net 0.332 0.441 0.441 0.0534 350 465 465KV Rossville Net 0 0 0 0.0307 0 0 0KV Scranton Net 0.303 0.204 0.204 0.0534 319 215 215KV Stull Net 2.09 2.071 2.071 0.0374 2,168 2,148 2,148KV Watson Net 0.604 0.403 0.403 0.0534 636 425 425La Harpe Net 0.36 0.276 0.276 0.0534 379 291 291Lindsborg Net 3.895 3.892 3.892 0.0374 4,041 4,038 4,038Mindenmines Net 0.266 0.25 0.25 0.0534 280 263 263Moran Net 0.563 0.555 0.555 0.0534 593 585 585Morrill Net 0.127 0.128 0.128 0.0534 134 135 135Mulberry Net 0.348 0.251 0.251 0.0611 369 266 266Muscotah Net 0.119 0.077 0.077 0.0534 125 81 81NM Axtell Net 0.388 0.345 0.345 0.0610 412 366 366NM Baileyville Net 1.099 0.819 0.819 0.0307 1,133 844 844NM Frankfort Net 0.25 0.146 0.146 0.0534 263 154 154NM Hanover Net 0.4 0.271 0.271 0.0374 415 281 281NM King Hill Net 0.762 0.635 0.635 0.0374 790 659 659NM Lone Elm Net 0.422 0.303 0.303 0.0374 438 314 314NM Marysville Net 0.68 0.494 0.494 0.0374 705 512 512NM Seneca Net 1.292 1.324 1.324 0.0374 1,340 1,374 1,374NM Smittyville Net 0.785 0.608 0.608 0.0374 814 631 631Robinson Net 0.137 0.113 0.113 0.0534 144 119 119Savonburg Net 0.065 0.055 0.055 0.0610 69 58 58Scranton Net 0.499 0.362 0.362 0.0610 529 384 384Toronto Net 0.203 0.174 0.174 0.0610 215 185 185Troy Net 0.869 0.813 0.813 0.0374 902 843 843Vermillion Net 0.091 0.074 0.074 0.0534 96 78 78Wathena Net 1.064 0.947 0.947 0.0534 1,121 998 998

I) DAY/HOUR OF HIGHEST PEAK REPORT LOAD:
II) SYSTEM LOAD NET CALCULATIONNative Peak Report Load 1,958 1,607 1,958 1,607 3,566less: Kaw Valley, SPA Resources1 1000 1 0 1 0 1 Nemaha, SPA Resources1 2301 2 0 2 0 2 Lindsborg, SPA Resources1 981 1 0 1 0 1 Enterprise, Troy & Arma Resources 225 0.2 345 0.3 0.2 0.3 1
Total Systen Load Net 1,954 1,607 1,954 1,607 3,561
III) TOTAL SYSTEM PEAK RESPONSIBILITY (TSPR)
A) FIRM PURCHASECities, GRDA Resources3 5 * 14 * 5 * 14 * 19KEPCo Resources4 127 87 127 87 214WES Cities, SPA Resources2 0 * 10 * 0 10 * 10Kaw Valley, SPA Resources2 1 0 1 0 1Nemaha, SPA Resources2 2 0 2 0 2Lindsborg, SPA Resources2 1 0 1 0 1McPherson 57 * 0 * 57 * 0 * 57Enterprise, Troy & Arma Resources8 0.2 0.3 0.2 0.3 1Total Firm Purchases 194 111 194 111 305
B) FIRM SALESCities, GRDA Resources3 5 * 14 * 5 14 19KEPCo Resources4 0 0 0 0 0Kaw Valley, SPA Resources2 1 0 1 0 1Nemaha, SPA Resources2 2 0 2 0 2Lindsborg, SPA Resources2 1 0 1 0 1WES Cities, SPA Resources2 0 * 10 * 0 10 10Enterprise, Troy & Arma Resources8 0.2 0.3 0.2 0.3 1
Total Firm Sales 10 24 10 24 34
TSPR (System Load Net - Firm Purchases + Firm Sales) 1,769 1,521 1,769 1,521 3,290
Dec 19 @ 0800 Dec 19 @ 0800 Dec 19 @ 0800
CALCULATION OF WEN & WES AND TOTAL WESTAR LOADDecember 2016
Individual Companies Total WestarWestar North (WEN) Westar South (WES) WEN Contribution WES Contribution Westar Energy

IV) FERC FORM 1, PAGE 401b LOAD5
less: Non-Generating Cities6 0 0 0 0 0Independent Coops7 0 0 0 0 0Total Non-Generating Load 0 0 0 0 0
Total 401b Load (TSPR - Non Gen.) 1,769 1,521 1,769 1,521 3,290
V) RETAILless: KEPCo
KEPCo - Westar 111 122 111 122 233 KEPCo - MKEC (WPEK) 45 0 45 0 45 KEPCo - Midwest 10 0 10 0 10 KEPCo - EDE 0 4 0 4 4 KEPCo - KCPL 19 0 19 0 19
less: McPherson 132 0 132 0 132less: GFR Munis 16 5 16 5 21less: GFR Coops 44 0 44 0 44
add: KEPCo Resources4 127 87 127 87 214McPherson Resources 57 0 57 0 57
RETAIL LOAD: 1,576 1,476 1,576 1,476 3,052
VI) TOTAL SYSTEM CAPACITY RESPONSIBILITY* 2,011 1,728 2,011 1,728 3,738
Dec 19 @ 0800 Dec 19 @ 0800 Dec 19 @ 0800
Individual Companies Total WestarWestar North (WEN) Westar South (WES) WEN Contribution WES Contribution Westar Energy
VII) NOTES:* The SPP Criteria document, Section 2.1.9, references the minimum capacity margin, which is currently 12%. SPP member companies would have to approve any change to this amount. 2 SPA resources include capacity and firm energy from the Southwestern Power Administration.contract 3 GRDA resources include capacity and firm energy from the Grand River Dam Authority.4 KEPCo resources includes WCGS (Wolf Creek Generation Services), SPA (Southwestern Power Admin), Sharpe Generation, WAPA (Western Area Power Administration). They are listed on KEPCo's monthly bill.
2) Allocation of KEPCo Resources Maximum Proration Prorationa) KEPCo's Resources Capacity (kW) North South Effective March 2014, allocation of KEPCo's resources has been changed to WCGS 70,000 allow 100% of their resources to be allocated based on the load share SPA - Firm 100,000 shown in cells M57:M61 for WEN and O57:O61 for WES. This is due to changes Sharpe Generation 0 resulting from the new SPP market. Sharpe generation is not included. WAPA 12,000 Discussed with Julie Lux, Chris O'Neill, and Bill Birnel Iatan II 32,000 Total 214,000 127,437 86,563
North Peak South Peak WR Peak WR Peak Demand North Peak South Peak WR Peak WR PeakMetered Metered North South Loss Factors Loss Adjusted Loss AdjustedLoss AdjustedLoss Adjusted
Dec 19 @ 0800 Dec 19 @ 0800 Dec 19 @ 0800 Dec 19 @ 0800 (From Bills) Dec 19 @ 0800 Dec 19 @ 0800 Dec 19 @ 0800 Dec 19 @ 0800 KEPCo - MKEC (WPEK) 45 0 45 0 1.0632 48.3603 0.0000 48.3603 0.0000 KEPCo - Midwest 10 0 10 0 1.0426 10.5480 0.0000 10.5480 0.0000 KEPCo - EDE 0 4 0 4 0.0000 0.0000 4.1930 0.0000 4.1930 KEPCo - KCPL 19 0 19 0 0.0000 19.1210 0.0000 19.1210 0.0000
78.0293 4.1930 78.0293 4.1930
KEPCo - Westar -- Calculate loss Adjustments for KEPCo-Westar North and South. These values are used in the GFR Calculation on Worksheet D only. Enter only the values shown in yellow.O1 33.4243 21.3426 33.4243 21.3426 1.0307 34.4504 21.9978 34.4504 21.9978O10 -0.1117 0 -0.1117 0 1.0954 -0.1224 0.0000 -0.1224 0.0000O11 -0.9102 0 -0.9102 0 1.085 -0.9876 0.0000 -0.9876 0.0000O2 43.8993 80.322 43.8993 80.322 1.0374 45.5411 83.3260 45.5411 83.3260O4 34.7214 17.6831 34.7214 17.6831 1.0534 36.5755 18.6274 36.5755 18.6274O5 0 2.4602 0 2.4602 1.061 0.0000 2.6103 0.0000 2.6103O6 0 0 0 0 1.0611 0.0000 0.0000 0.0000 0.0000O8 0.0221 0.1631 0.0221 0.1631 1.0803 0.0239 0.1762 0.0239 0.1762O9 -0.0334 0 -0.0334 0 1.0892 -0.0364 0.0000 -0.0364 0.0000Blank 0 0 0 0 1 0.0000 0.0000 0.0000 0.0000
KEPCo - Westar 111.0118 121.971 111.0118 121.971 115.4447 126.7377 115.4447 126.7377
VIII) NON-GENERATING CITIES
5 The load reported on page 401b is requirements load associated with requirement energy reported on Form 1, page 311 6 Non-Generating cities only includes the City of Altamont. It is expected to become a GFR customer effective April 1, 2015
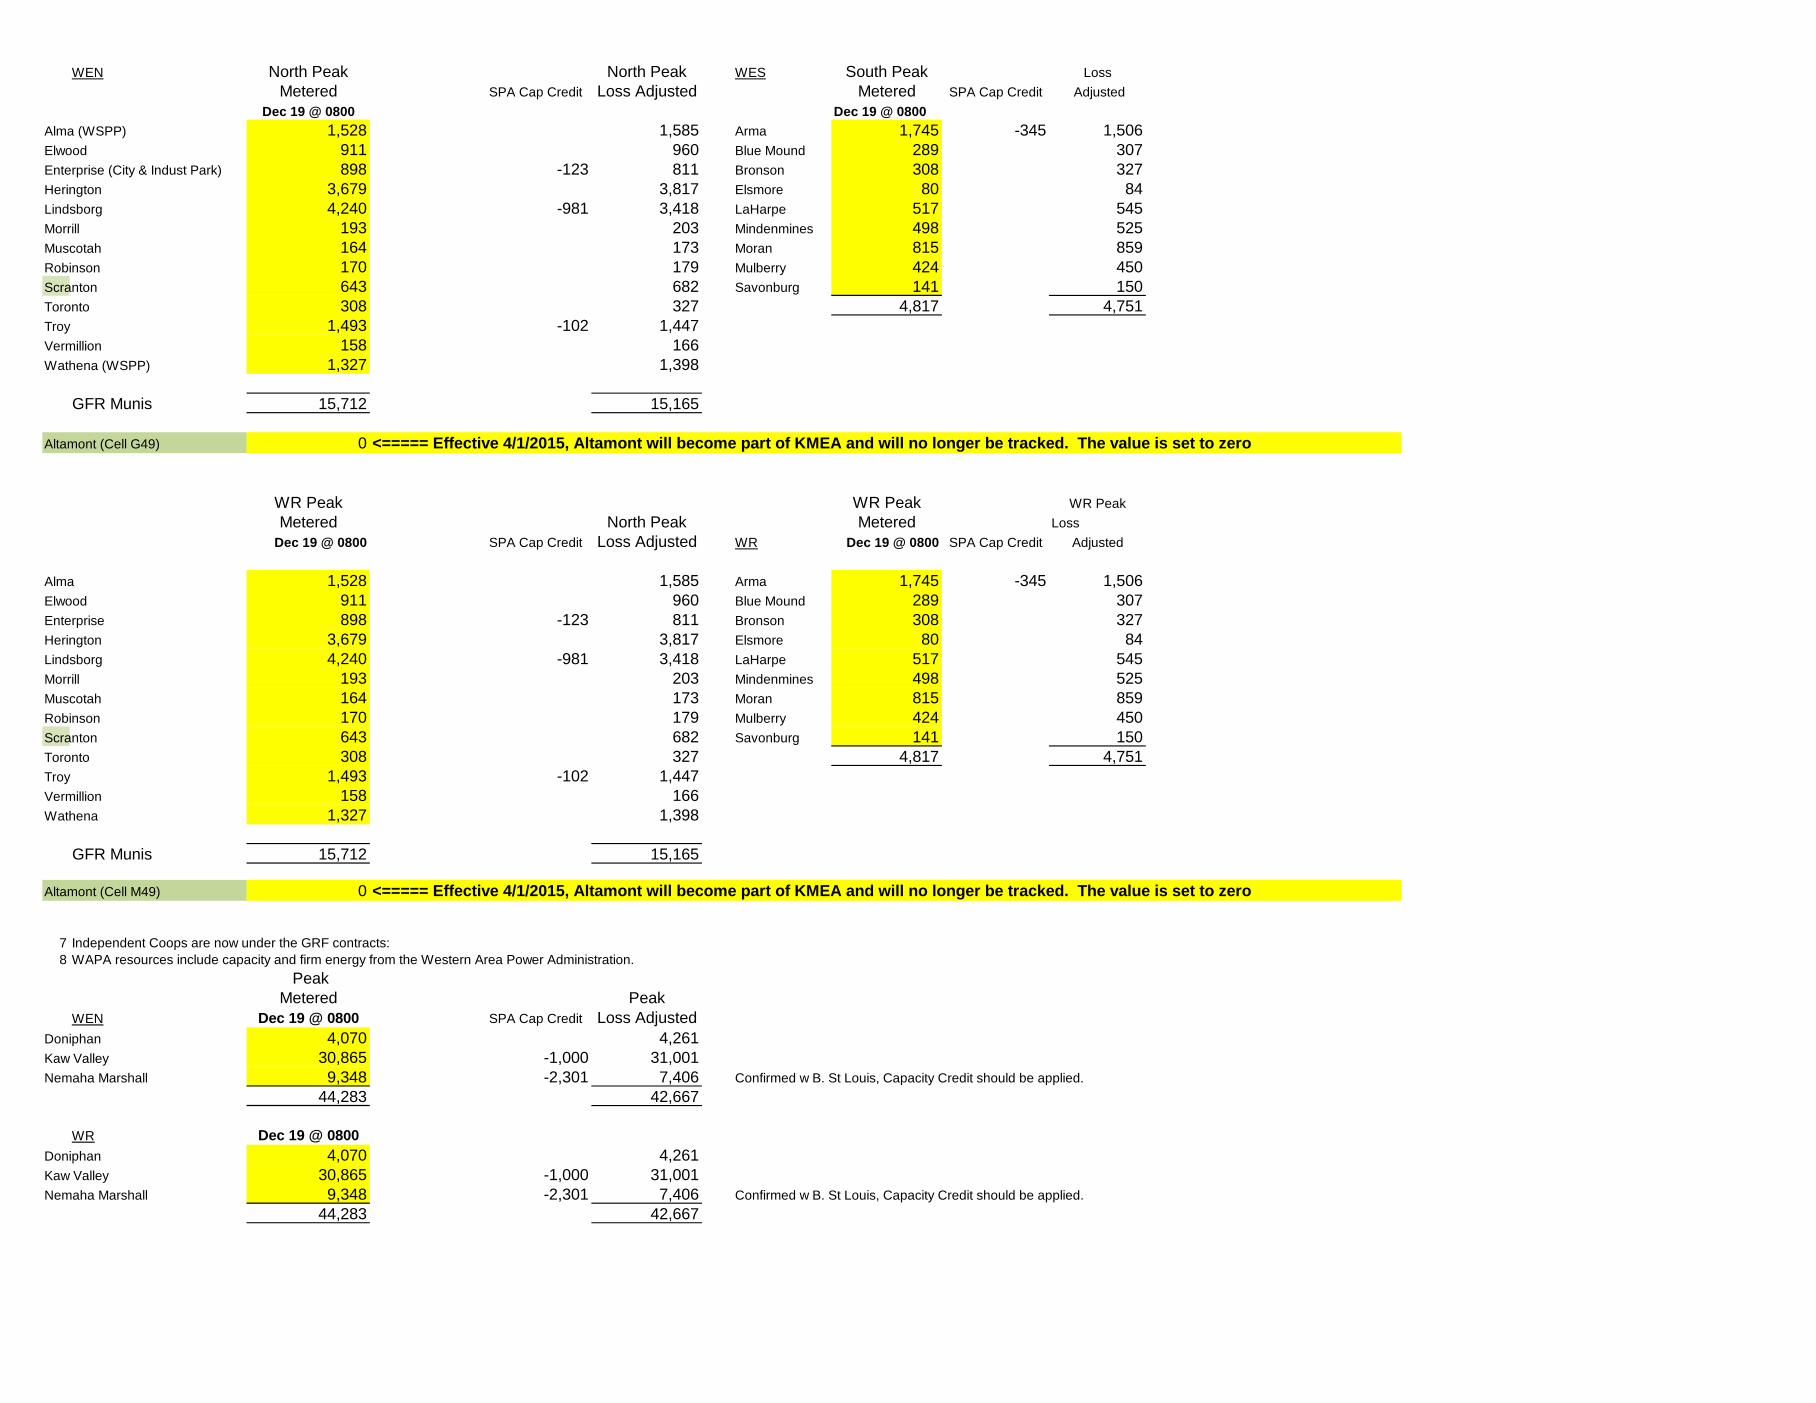
WEN North Peak North Peak WES South Peak LossMetered SPA Cap Credit Loss Adjusted Metered SPA Cap Credit Adjusted
Dec 19 @ 0800 Dec 19 @ 0800Alma (WSPP) 1,528 1,585 Arma 1,745 -345 1,506Elwood 911 960 Blue Mound 289 307Enterprise (City & Indust Park) 898 -123 811 Bronson 308 327Herington 3,679 3,817 Elsmore 80 84Lindsborg 4,240 -981 3,418 LaHarpe 517 545Morrill 193 203 Mindenmines 498 525Muscotah 164 173 Moran 815 859Robinson 170 179 Mulberry 424 450Scranton 643 682 Savonburg 141 150Toronto 308 327 4,817 4,751Troy 1,493 -102 1,447Vermillion 158 166Wathena (WSPP) 1,327 1,398
GFR Munis 15,712 15,165
Altamont (Cell G49) 0 <===== Effective 4/1/2015, Altamont will become part of KMEA and will no longer be tracked. The value is set to zero
WR Peak WR Peak WR PeakMetered North Peak Metered Loss
Dec 19 @ 0800 SPA Cap Credit Loss Adjusted WR Dec 19 @ 0800 SPA Cap Credit Adjusted
Alma 1,528 1,585 Arma 1,745 -345 1,506Elwood 911 960 Blue Mound 289 307Enterprise 898 -123 811 Bronson 308 327Herington 3,679 3,817 Elsmore 80 84Lindsborg 4,240 -981 3,418 LaHarpe 517 545Morrill 193 203 Mindenmines 498 525Muscotah 164 173 Moran 815 859Robinson 170 179 Mulberry 424 450Scranton 643 682 Savonburg 141 150Toronto 308 327 4,817 4,751Troy 1,493 -102 1,447Vermillion 158 166Wathena 1,327 1,398
GFR Munis 15,712 15,165
Altamont (Cell M49) 0 <===== Effective 4/1/2015, Altamont will become part of KMEA and will no longer be tracked. The value is set to zero
7 Independent Coops are now under the GRF contracts:8 WAPA resources include capacity and firm energy from the Western Area Power Administration.
PeakMetered Peak
WEN Dec 19 @ 0800 SPA Cap Credit Loss AdjustedDoniphan 4,070 4,261Kaw Valley 30,865 -1,000 31,001Nemaha Marshall 9,348 -2,301 7,406 Confirmed w B. St Louis, Capacity Credit should be applied.
44,283 42,667
WR Dec 19 @ 0800Doniphan 4,070 4,261Kaw Valley 30,865 -1,000 31,001Nemaha Marshall 9,348 -2,301 7,406 Confirmed w B. St Louis, Capacity Credit should be applied.
44,283 42,667

North Peak South Peak WR Peak Demand Peak Peak PeakMetered Metered Metered Loss Factors Loss Adjusted Loss Adjusted Loss Adjusted
Dec 19 @ 0800 Dec 19 @ 0800 Dec 19 @ 0800 (From Bills) Dec 19 @ 0800 Dec 19 @ 0800 Dec 19 @ 0800Alma Net 1.528 1.528 1.528 0.0374 1,585 1,585 1,585Arma Net 1.745 1.745 1.745 0.0610 1,851 1,851 1,851Blue Mound Net 0.289 0.289 0.289 0.0610 307 307 307Bronson Net 0.308 0.308 0.308 0.0610 327 327 327DP Bellevue Net 0.825 0.825 0.825 0.0534 869 869 869DP Blair Net 1.179 1.179 1.179 0.0307 1,215 1,215 1,215DP Midway Net 0.473 0.473 0.473 0.0534 498 498 498DP Troy Net 1.593 1.593 1.593 0.0534 1,678 1,678 1,678Elsmore Net 0.08 0.08 0.08 0.0534 84 84 84Elwood Net 0.911 0.911 0.911 0.0534 960 960 960Enterprise City Net 0.768 0.768 0.768 0.0374 797 797 797Enterprise Industrial Park Net 0.13 0.13 0.13 0.0534 137 137 137Herington Net 3.679 3.679 3.679 0.0374 3,817 3,817 3,817KV Baldwin Creek Net 1.609 1.609 1.609 0.0534 1,695 1,695 1,695KV Banning Corner Net 0.138 0.138 0.138 0.0534 145 145 145KV Carbondale Net 3.172 3.172 3.172 0.0307 3,269 3,269 3,269KV Crooked Post Net 9.806 9.806 9.806 0.0374 10,173 10,173 10,173KV Delia 2 Net 2.583 2.583 2.583 0.0307 2,662 2,662 2,662KV Hoyt Net 0.001 0.001 0.001 0.0307 1 1 1KV Keene Net 3.756 3.756 3.756 0.0307 3,871 3,871 3,871KV Kiro Net 2.959 2.959 2.959 0.0307 3,050 3,050 3,050KV Pauline Net 0.751 0.751 0.751 0.0534 791 791 791KV Rossville Net 0 0 0 0.0307 0 0 0KV Scranton Net 0.439 0.439 0.439 0.0534 462 462 462KV Stull Net 4.54 4.54 4.54 0.0374 4,710 4,710 4,710KV Watson Net 1.111 1.111 1.111 0.0534 1,170 1,170 1,170La Harpe Net 0.517 0.517 0.517 0.0534 545 545 545Lindsborg Net 4.24 4.24 4.24 0.0374 4,399 4,399 4,399Mindenmines Net 0.498 0.498 0.498 0.0534 525 525 525Moran Net 0.815 0.815 0.815 0.0534 859 859 859Morrill Net 0.193 0.193 0.193 0.0534 203 203 203Mulberry Net 0.424 0.424 0.424 0.0611 450 450 450Muscotah Net 0.164 0.164 0.164 0.0534 173 173 173NM Axtell Net 0.533 0.533 0.533 0.0610 566 566 566NM Baileyville Net 1.6 1.6 1.6 0.0307 1,649 1,649 1,649NM Frankfort Net 0.444 0.444 0.444 0.0534 468 468 468NM Hanover Net 0.7 0.7 0.7 0.0374 726 726 726NM King Hill Net 1.076 1.076 1.076 0.0374 1,116 1,116 1,116NM Lone Elm Net 0.685 0.685 0.685 0.0374 711 711 711NM Marysville Net 1.189 1.189 1.189 0.0374 1,233 1,233 1,233NM Seneca Net 2.036 2.036 2.036 0.0374 2,112 2,112 2,112NM Smittyville Net 1.085 1.085 1.085 0.0374 1,126 1,126 1,126Robinson Net 0.17 0.17 0.17 0.0534 179 179 179Savonburg Net 0.141 0.141 0.141 0.0610 150 150 150Scranton Net 0.643 0.643 0.643 0.0610 682 682 682Toronto Net 0.308 0.308 0.308 0.0610 327 327 327Troy Net 1.493 1.493 1.493 0.0374 1,549 1,549 1,549Vermillion Net 0.158 0.158 0.158 0.0534 166 166 166Wathena Net 1.327 1.327 1.327 0.0534 1,398 1,398 1,398
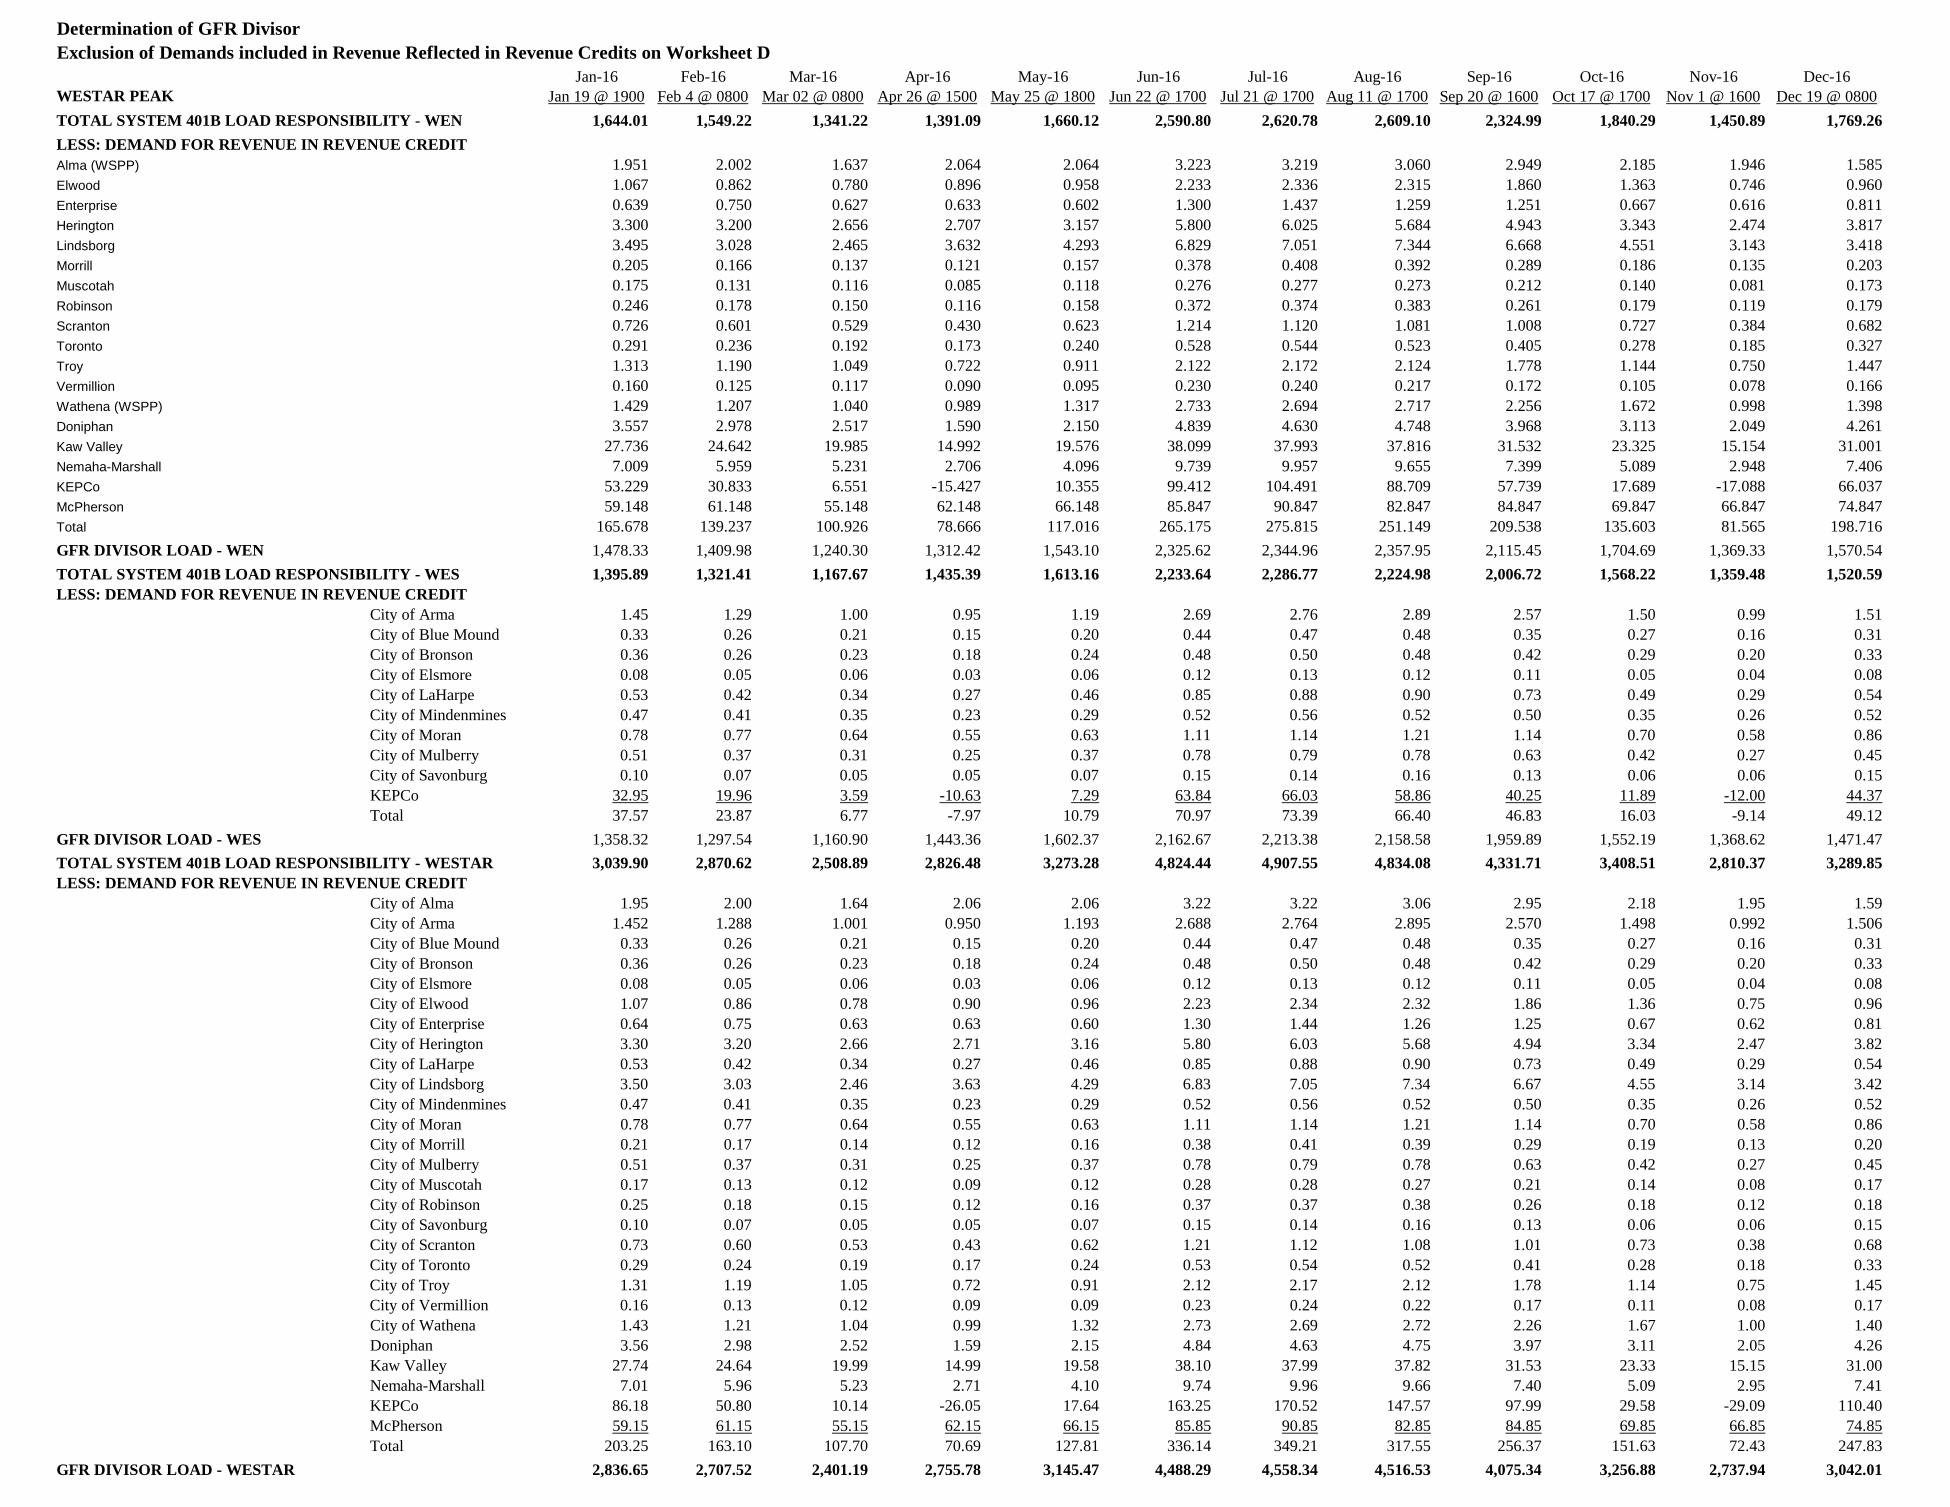
Determination of GFR DivisorExclusion of Demands included in Revenue Reflected in Revenue Credits on Worksheet D
Jan-16 Feb-16 Mar-16 Apr-16 May-16 Jun-16 Jul-16 Aug-16 Sep-16 Oct-16 Nov-16 Dec-16WESTAR PEAK Jan 19 @ 1900 Feb 4 @ 0800 Mar 02 @ 0800 Apr 26 @ 1500 May 25 @ 1800 Jun 22 @ 1700 Jul 21 @ 1700 Aug 11 @ 1700 Sep 20 @ 1600 Oct 17 @ 1700 Nov 1 @ 1600 Dec 19 @ 0800TOTAL SYSTEM 401B LOAD RESPONSIBILITY - WEN 1,644.01 1,549.22 1,341.22 1,391.09 1,660.12 2,590.80 2,620.78 2,609.10 2,324.99 1,840.29 1,450.89 1,769.26LESS: DEMAND FOR REVENUE IN REVENUE CREDITAlma (WSPP) 1.951 2.002 1.637 2.064 2.064 3.223 3.219 3.060 2.949 2.185 1.946 1.585Elwood 1.067 0.862 0.780 0.896 0.958 2.233 2.336 2.315 1.860 1.363 0.746 0.960Enterprise 0.639 0.750 0.627 0.633 0.602 1.300 1.437 1.259 1.251 0.667 0.616 0.811Herington 3.300 3.200 2.656 2.707 3.157 5.800 6.025 5.684 4.943 3.343 2.474 3.817Lindsborg 3.495 3.028 2.465 3.632 4.293 6.829 7.051 7.344 6.668 4.551 3.143 3.418Morrill 0.205 0.166 0.137 0.121 0.157 0.378 0.408 0.392 0.289 0.186 0.135 0.203Muscotah 0.175 0.131 0.116 0.085 0.118 0.276 0.277 0.273 0.212 0.140 0.081 0.173Robinson 0.246 0.178 0.150 0.116 0.158 0.372 0.374 0.383 0.261 0.179 0.119 0.179Scranton 0.726 0.601 0.529 0.430 0.623 1.214 1.120 1.081 1.008 0.727 0.384 0.682Toronto 0.291 0.236 0.192 0.173 0.240 0.528 0.544 0.523 0.405 0.278 0.185 0.327Troy 1.313 1.190 1.049 0.722 0.911 2.122 2.172 2.124 1.778 1.144 0.750 1.447Vermillion 0.160 0.125 0.117 0.090 0.095 0.230 0.240 0.217 0.172 0.105 0.078 0.166Wathena (WSPP) 1.429 1.207 1.040 0.989 1.317 2.733 2.694 2.717 2.256 1.672 0.998 1.398Doniphan 3.557 2.978 2.517 1.590 2.150 4.839 4.630 4.748 3.968 3.113 2.049 4.261Kaw Valley 27.736 24.642 19.985 14.992 19.576 38.099 37.993 37.816 31.532 23.325 15.154 31.001Nemaha-Marshall 7.009 5.959 5.231 2.706 4.096 9.739 9.957 9.655 7.399 5.089 2.948 7.406KEPCo 53.229 30.833 6.551 -15.427 10.355 99.412 104.491 88.709 57.739 17.689 -17.088 66.037McPherson 59.148 61.148 55.148 62.148 66.148 85.847 90.847 82.847 84.847 69.847 66.847 74.847Total 165.678 139.237 100.926 78.666 117.016 265.175 275.815 251.149 209.538 135.603 81.565 198.716GFR DIVISOR LOAD - WEN 1,478.33 1,409.98 1,240.30 1,312.42 1,543.10 2,325.62 2,344.96 2,357.95 2,115.45 1,704.69 1,369.33 1,570.54TOTAL SYSTEM 401B LOAD RESPONSIBILITY - WES 1,395.89 1,321.41 1,167.67 1,435.39 1,613.16 2,233.64 2,286.77 2,224.98 2,006.72 1,568.22 1,359.48 1,520.59LESS: DEMAND FOR REVENUE IN REVENUE CREDIT
City of Arma 1.45 1.29 1.00 0.95 1.19 2.69 2.76 2.89 2.57 1.50 0.99 1.51City of Blue Mound 0.33 0.26 0.21 0.15 0.20 0.44 0.47 0.48 0.35 0.27 0.16 0.31City of Bronson 0.36 0.26 0.23 0.18 0.24 0.48 0.50 0.48 0.42 0.29 0.20 0.33City of Elsmore 0.08 0.05 0.06 0.03 0.06 0.12 0.13 0.12 0.11 0.05 0.04 0.08City of LaHarpe 0.53 0.42 0.34 0.27 0.46 0.85 0.88 0.90 0.73 0.49 0.29 0.54City of Mindenmines 0.47 0.41 0.35 0.23 0.29 0.52 0.56 0.52 0.50 0.35 0.26 0.52City of Moran 0.78 0.77 0.64 0.55 0.63 1.11 1.14 1.21 1.14 0.70 0.58 0.86City of Mulberry 0.51 0.37 0.31 0.25 0.37 0.78 0.79 0.78 0.63 0.42 0.27 0.45City of Savonburg 0.10 0.07 0.05 0.05 0.07 0.15 0.14 0.16 0.13 0.06 0.06 0.15KEPCo 32.95 19.96 3.59 -10.63 7.29 63.84 66.03 58.86 40.25 11.89 -12.00 44.37Total 37.57 23.87 6.77 -7.97 10.79 70.97 73.39 66.40 46.83 16.03 -9.14 49.12
GFR DIVISOR LOAD - WES 1,358.32 1,297.54 1,160.90 1,443.36 1,602.37 2,162.67 2,213.38 2,158.58 1,959.89 1,552.19 1,368.62 1,471.47TOTAL SYSTEM 401B LOAD RESPONSIBILITY - WESTAR 3,039.90 2,870.62 2,508.89 2,826.48 3,273.28 4,824.44 4,907.55 4,834.08 4,331.71 3,408.51 2,810.37 3,289.85LESS: DEMAND FOR REVENUE IN REVENUE CREDIT
City of Alma 1.95 2.00 1.64 2.06 2.06 3.22 3.22 3.06 2.95 2.18 1.95 1.59City of Arma 1.452 1.288 1.001 0.950 1.193 2.688 2.764 2.895 2.570 1.498 0.992 1.506City of Blue Mound 0.33 0.26 0.21 0.15 0.20 0.44 0.47 0.48 0.35 0.27 0.16 0.31City of Bronson 0.36 0.26 0.23 0.18 0.24 0.48 0.50 0.48 0.42 0.29 0.20 0.33City of Elsmore 0.08 0.05 0.06 0.03 0.06 0.12 0.13 0.12 0.11 0.05 0.04 0.08City of Elwood 1.07 0.86 0.78 0.90 0.96 2.23 2.34 2.32 1.86 1.36 0.75 0.96City of Enterprise 0.64 0.75 0.63 0.63 0.60 1.30 1.44 1.26 1.25 0.67 0.62 0.81City of Herington 3.30 3.20 2.66 2.71 3.16 5.80 6.03 5.68 4.94 3.34 2.47 3.82City of LaHarpe 0.53 0.42 0.34 0.27 0.46 0.85 0.88 0.90 0.73 0.49 0.29 0.54City of Lindsborg 3.50 3.03 2.46 3.63 4.29 6.83 7.05 7.34 6.67 4.55 3.14 3.42City of Mindenmines 0.47 0.41 0.35 0.23 0.29 0.52 0.56 0.52 0.50 0.35 0.26 0.52City of Moran 0.78 0.77 0.64 0.55 0.63 1.11 1.14 1.21 1.14 0.70 0.58 0.86City of Morrill 0.21 0.17 0.14 0.12 0.16 0.38 0.41 0.39 0.29 0.19 0.13 0.20City of Mulberry 0.51 0.37 0.31 0.25 0.37 0.78 0.79 0.78 0.63 0.42 0.27 0.45City of Muscotah 0.17 0.13 0.12 0.09 0.12 0.28 0.28 0.27 0.21 0.14 0.08 0.17City of Robinson 0.25 0.18 0.15 0.12 0.16 0.37 0.37 0.38 0.26 0.18 0.12 0.18City of Savonburg 0.10 0.07 0.05 0.05 0.07 0.15 0.14 0.16 0.13 0.06 0.06 0.15City of Scranton 0.73 0.60 0.53 0.43 0.62 1.21 1.12 1.08 1.01 0.73 0.38 0.68City of Toronto 0.29 0.24 0.19 0.17 0.24 0.53 0.54 0.52 0.41 0.28 0.18 0.33City of Troy 1.31 1.19 1.05 0.72 0.91 2.12 2.17 2.12 1.78 1.14 0.75 1.45City of Vermillion 0.16 0.13 0.12 0.09 0.09 0.23 0.24 0.22 0.17 0.11 0.08 0.17City of Wathena 1.43 1.21 1.04 0.99 1.32 2.73 2.69 2.72 2.26 1.67 1.00 1.40Doniphan 3.56 2.98 2.52 1.59 2.15 4.84 4.63 4.75 3.97 3.11 2.05 4.26Kaw Valley 27.74 24.64 19.99 14.99 19.58 38.10 37.99 37.82 31.53 23.33 15.15 31.00Nemaha-Marshall 7.01 5.96 5.23 2.71 4.10 9.74 9.96 9.66 7.40 5.09 2.95 7.41KEPCo 86.18 50.80 10.14 -26.05 17.64 163.25 170.52 147.57 97.99 29.58 -29.09 110.40McPherson 59.15 61.15 55.15 62.15 66.15 85.85 90.85 82.85 84.85 69.85 66.85 74.85Total 203.25 163.10 107.70 70.69 127.81 336.14 349.21 317.55 256.37 151.63 72.43 247.83
GFR DIVISOR LOAD - WESTAR 2,836.65 2,707.52 2,401.19 2,755.78 3,145.47 4,488.29 4,558.34 4,516.53 4,075.34 3,256.88 2,737.94 3,042.01
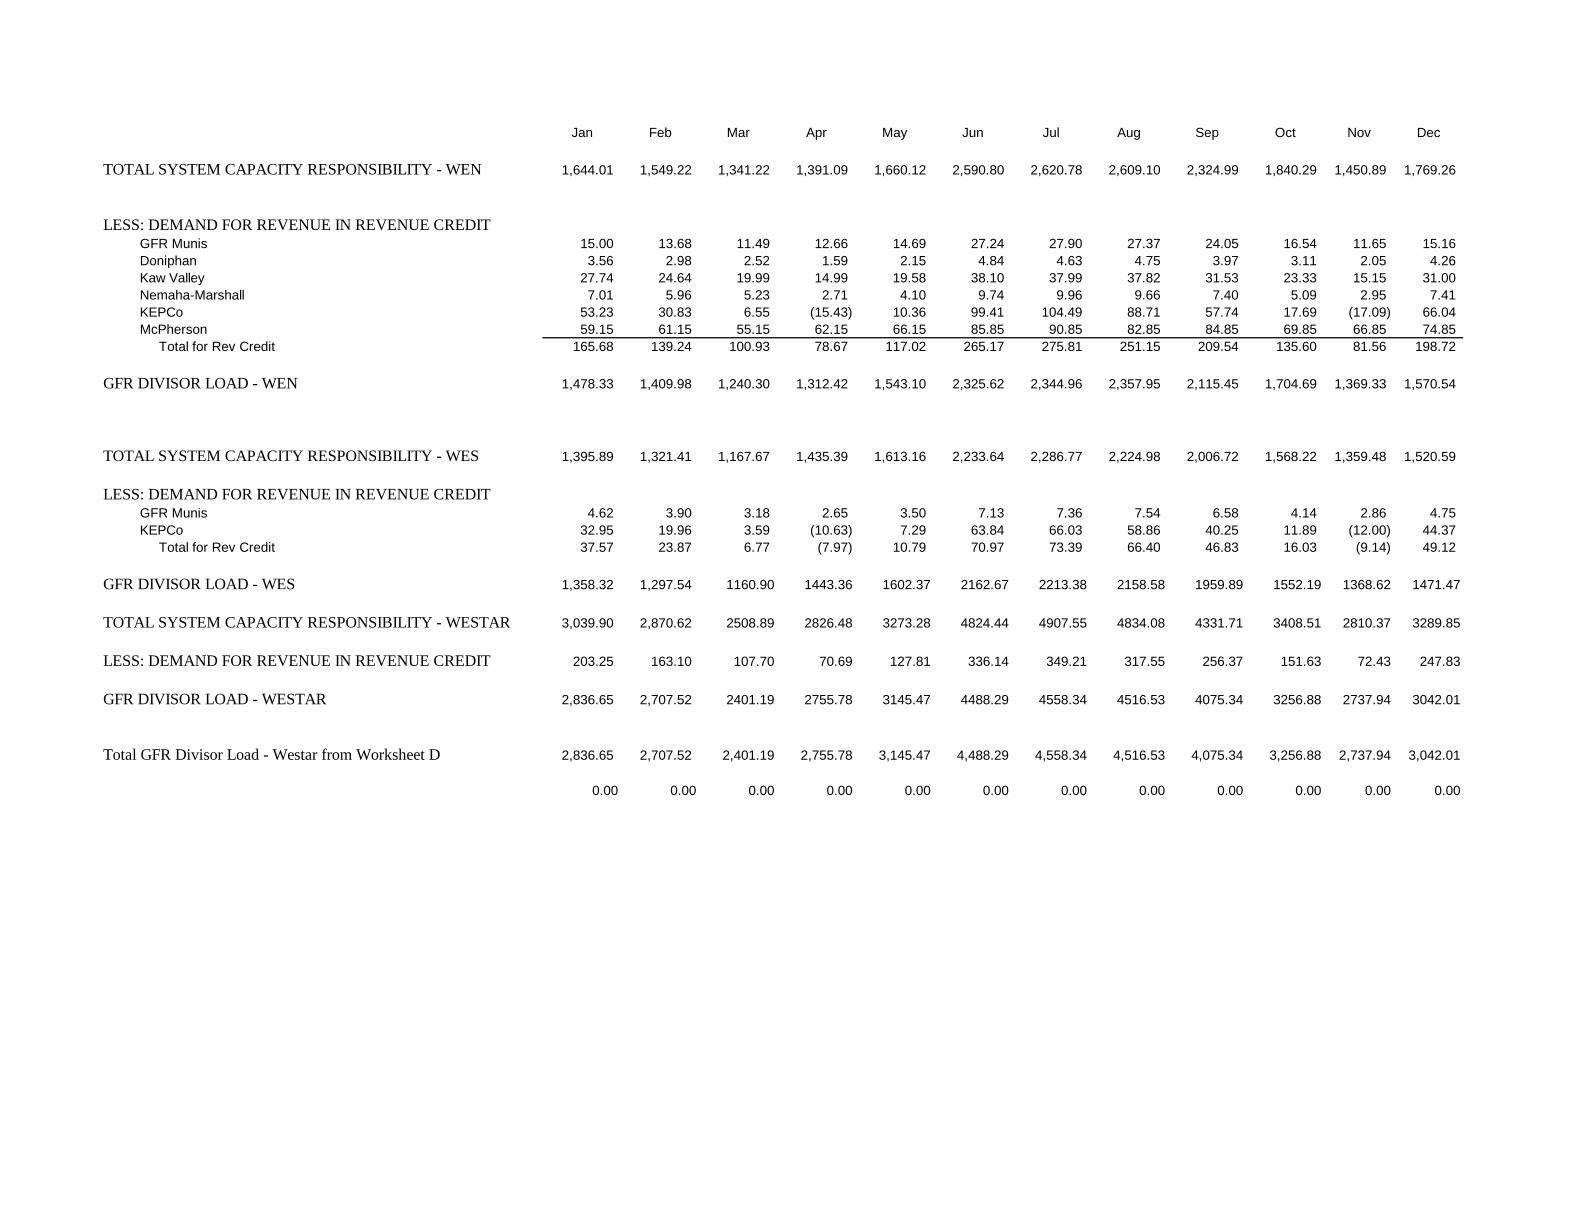
Jan Feb Mar Apr May Jun Jul Aug Sep Oct Nov Dec
TOTAL SYSTEM CAPACITY RESPONSIBILITY - WEN 1,644.01 1,549.22 1,341.22 1,391.09 1,660.12 2,590.80 2,620.78 2,609.10 2,324.99 1,840.29 1,450.89 1,769.26
LESS: DEMAND FOR REVENUE IN REVENUE CREDITGFR Munis 15.00 13.68 11.49 12.66 14.69 27.24 27.90 27.37 24.05 16.54 11.65 15.16 Doniphan 3.56 2.98 2.52 1.59 2.15 4.84 4.63 4.75 3.97 3.11 2.05 4.26 Kaw Valley 27.74 24.64 19.99 14.99 19.58 38.10 37.99 37.82 31.53 23.33 15.15 31.00 Nemaha-Marshall 7.01 5.96 5.23 2.71 4.10 9.74 9.96 9.66 7.40 5.09 2.95 7.41 KEPCo 53.23 30.83 6.55 (15.43) 10.36 99.41 104.49 88.71 57.74 17.69 (17.09) 66.04 McPherson 59.15 61.15 55.15 62.15 66.15 85.85 90.85 82.85 84.85 69.85 66.85 74.85 Total for Rev Credit 165.68 139.24 100.93 78.67 117.02 265.17 275.81 251.15 209.54 135.60 81.56 198.72
GFR DIVISOR LOAD - WEN 1,478.33 1,409.98 1,240.30 1,312.42 1,543.10 2,325.62 2,344.96 2,357.95 2,115.45 1,704.69 1,369.33 1,570.54
TOTAL SYSTEM CAPACITY RESPONSIBILITY - WES 1,395.89 1,321.41 1,167.67 1,435.39 1,613.16 2,233.64 2,286.77 2,224.98 2,006.72 1,568.22 1,359.48 1,520.59
LESS: DEMAND FOR REVENUE IN REVENUE CREDITGFR Munis 4.62 3.90 3.18 2.65 3.50 7.13 7.36 7.54 6.58 4.14 2.86 4.75 KEPCo 32.95 19.96 3.59 (10.63) 7.29 63.84 66.03 58.86 40.25 11.89 (12.00) 44.37 Total for Rev Credit 37.57 23.87 6.77 (7.97) 10.79 70.97 73.39 66.40 46.83 16.03 (9.14) 49.12
GFR DIVISOR LOAD - WES 1,358.32 1,297.54 1160.90 1443.36 1602.37 2162.67 2213.38 2158.58 1959.89 1552.19 1368.62 1471.47
TOTAL SYSTEM CAPACITY RESPONSIBILITY - WESTAR 3,039.90 2,870.62 2508.89 2826.48 3273.28 4824.44 4907.55 4834.08 4331.71 3408.51 2810.37 3289.85
LESS: DEMAND FOR REVENUE IN REVENUE CREDIT 203.25 163.10 107.70 70.69 127.81 336.14 349.21 317.55 256.37 151.63 72.43 247.83
GFR DIVISOR LOAD - WESTAR 2,836.65 2,707.52 2401.19 2755.78 3145.47 4488.29 4558.34 4516.53 4075.34 3256.88 2737.94 3042.01
Total GFR Divisor Load - Westar from Worksheet D 2,836.65 2,707.52 2,401.19 2,755.78 3,145.47 4,488.29 4,558.34 4,516.53 4,075.34 3,256.88 2,737.94 3,042.01
0.00 0.00 0.00 0.00 0.00 0.00 0.00 0.00 0.00 0.00 0.00 0.00