caledonia mining corporation plc march 22, 2021 …
TRANSCRIPT

1
CALEDONIA MINING CORPORATION PLC March 22, 2021
Management’s Discussion and Analysis
This management’s discussion and analysis (“MD&A”) of the consolidated operating results and financial position of Caledonia Mining Corporation Plc (“Caledonia” or the “Company”) is for the quarter ended December 31, 2020 (“Q4 2020” or the “Quarter” and the year ended December 31, 2020 (the “Year”) and the period ended March 22, 2021). It should be read in conjunction with the Audited Consolidated Financial Statements of Caledonia for the Year (the “Consolidated Financial Statements”) which are available from the System for Electronic Data Analysis and Retrieval at www.sedar.com or from Caledonia’s website at www.caledoniamining.com. The Consolidated Financial Statements and related notes have been prepared in accordance with International Financial Reporting Standards (“IFRS”) as issued by the International Accounting Standards Board. In this MD&A, the terms “Caledonia”, the “Company”, the “Group”, “we”, “our” and “us” refer to the consolidated operations of Caledonia Mining Corporation Plc and its subsidiaries unless otherwise specifically noted or the context requires otherwise.
Note that all currency references in this document are to US Dollars, unless otherwise stated.

2
TABLE OF CONTENTS
1. Overview 2. Highlights 3. Summary Financial Results 4. Operations at the Blanket Gold Mine, Zimbabwe
4.1 Safety, Health and Environment 4.2 Social Investment and Contribution to the Zimbabwean Economy 4.3 Gold Production 4.4 Underground 4.5 Metallurgical Plant 4.6 Production Costs 4.7 Capital Projects 4.8 Indigenisation 4.9 Zimbabwe Commercial Environment 4.10 Opportunities and Outlook 4.11 Sale of Eersteling 4.12 COVID-19 4.13 Solar project
5. Exploration 6. Investing 7. Financing 8. Liquidity and Capital Resources 9. Off-Balance Sheet Arrangements, Contractual Commitments and Contingencies 10. Non-IFRS Measures 11. Party Transactions 12. Critical Accounting Estimates 13. Financial Instruments 14. Dividend Policy 15. Management and Board 16. Securities Outstanding 17. Risk Analysis 18. Forward-Looking Statements 19. Controls 20. Qualified Person

3
1. OVERVIEW
Caledonia is an exploration, development and mining corporation focused on Zimbabwe. Caledonia’s primary asset is a 64% ownership in Blanket Mine (“Blanket”), a gold mine in Zimbabwe. Caledonia consolidates Blanket into the Consolidated Financial Statements; accordingly, operational and financial information set out in this MD&A is on a 100% basis, unless otherwise specified. Caledonia’s shares are listed on the NYSE American LLC ("NYSE American") (symbol - “CMCL”) and depositary interests in Caledonia’s shares are admitted to trading on AIM of the London Stock Exchange plc (symbol - “CMCL”).
2. HIGHLIGHTS
3 months ended
December 31 12 months ended
December 31 Comment 2019 2020 2019 2020
Gold produced (oz) 16,876 15,012 55,182 57,899
Gold produced in the Quarter was 11% lower than Q4 2019 (“the comparable quarter”) due to lower grade and recovery. Production includes 1,585 ounces of gold which was sold after the end of the Quarter.
On-mine cost per ounce ($/oz)1
603 770 651 744
On-mine costs increased due to COVID-19 costs, higher share-based payment expense, increased diesel usage and increased maintenance costs on trackless equipment
All-in sustaining cost ($/oz) (“AISC”)1
812 1,083 820 946
AISC increased due to higher on-mine costs, higher administrative expenses due to the increased cost of insurance and higher wages and salaries
Average realised gold price ($/oz)1
1,458 1,845 1,382 1,749
The average realised gold price reflects international spot prices and excludes revenues from the export credit incentive and predecessor schemes
Gross profit2 11,336 14,375 31,138 46,656 Gross profit is higher due to the higher gold price and (for the Year) higher production offset by increased production costs
Net profit attributable to shareholders
2,390 2,973 42,018 20,780
Net profit the Year was lower than 2019 which benefitted from foreign exchange gains, profit on the sale of a subsidiary and income from government grants. Increased profit for the Quarter is commensurate with increased gross profit
Basic IFRS earnings per share (“EPS”) (cents)
21.5 24.0 382.0 173.4 IFRS EPS reflects the movement in IFRS profit attributable to shareholders after adjustment for increased shares in issue
Adjusted EPS1 11.7 74.9 145.1 204.2 Adjusted EPS excludes foreign exchange gains and losses and profit on disposal of a subsidiary, which benefitted prior periods
Net cash and cash equivalents
8,893 19,092 8,893 19,092 Cash increased due to a $13m (gross) equity issue in Q3 of 2020
Net cash from operating activities
4,794 11,617 18,060 30,962 Improved cash generation due to the higher gold price
1 Non-IFRS measures such as “On-mine cost per ounce”, “AISC”, “average realised gold price” and “adjusted EPS” are used throughout this document. Refer to section 10 of this MD&A for a discussion of non-IFRS measures. 2 Gross profit is after deducting royalties, production costs and depreciation but before administrative expenses, other income, interest and finance charges and taxation.
An excellent operating and financial performance

4
Production in the Year was 57,899 ounces, which was at the top end of the guidance range and was a new record for annual production. Production for the Quarter, although lower than the comparable quarter, was 15,012 ounces and was in-line with our expectations. The strong performance, despite the impediments arising from the COVID-19 pandemic, reflects the measures taken in previous quarters to improve tonnes mined and increase metallurgical recoveries.
The robust operating performance was supported by a rising gold price: gross profit for the Year was $46.6 million – almost 50% higher than 2019; gross profit for the Quarter was $14.4 million - almost 27% higher than the comparable quarter.
The net financial performance for the Year when compared to 2019 was adversely affected by the large foreign exchange gains and a significant profit arising on the sale of a subsidiary which were recognised in 2019. Adjusted earnings per share for the Year increased by 41% from 145 cents to 204 cents.
Central Shaft Project almost complete
The Central Shaft was fully equipped by the end of the Year and the production headgear was erected in January 2021. The shaft is now being commissioned and is expected to be fully operational before the end of the first quarter of 2021.
Rising production in 2021 and 2022
Production is expected to increase after the Central Shaft has been commissioned. Production guidance for 2021 is a range of 61,000 to 67,000 ounces; guidance from 2022 onwards is 80,000 ounces – 38% higher than the production in 2020.
60% cumulative increase in the quarterly dividend since October 2019
The Company paid a quarterly dividend of 11 cents per share in January 2021. This is the fourth increase in the quarterly dividend in the last 15 months. The total dividend per share paid in 2020 was 33.5 cents – a 21.8% increase from 2019.
Decision to implement a $12 million solar project
The Company has resolved to construct a 12MWac solar plant at a cost of approximately $12 million to improve the quality and security of Blanket’s electricity supply and to reduce Blanket’s environmental footprint. The plant is expected to provide approximately 27% of Blanket’s total daily electricity demand. The plant will be constructed by Voltalia, an international renewable energy provider, and is expected to be operational in early 2022. Whilst the project is being done for largely defensive reasons, it is expected to yield a modest return to shareholders after taking account of the dilutive effect of the equity issued to fund it.
Successful equity issue to fund the solar project
During the third quarter of 2020, the Company issued approximately 600,000 shares to raise $13 million (before expenses) to fund the solar project. The number of shares issued was lower than the 800,000 new shares that the Company had expected to issue, thereby improving the anticipated returns to shareholders from the project.
Acquisition of new exploration assets
In the Quarter the Company entered into option agreements in respect of two properties in the Zimbabwe Midlands, which has historically been a substantial gold producing region. These options give the Company the right to explore each property for periods of 15 and 18 months; depending on the exploration success, the Company has the right to acquire each property for a consideration of approximately $5 million plus a net smelter royalty at 1%.
Appointment of an additional non executive director; management team strengthened

5
In February 2021, the Company announced Mrs Geralda Wildschutt had joined the board of directors of the Company as an independent non-executive director. Mrs Wildschutt has over 25 years’ experience working in social development and stakeholder management. She has consulted to Anglo American, Gold Fields, Ivanhoe Mines and South32 on a range of social performance areas including social investment, compliance with Environmental, Social Investment and Governance (“ESG”) guidelines, human rights and social impact assessments, strengthening of community trusts, capacity building and systems development.
During the Year, the Company made executive appointments in the areas of geology, rock mechanics and investor relations. In January 2021, the company also appointed an internal auditor. These appointments improve the strength and depth of the management team to support the Company’s planned growth.
Voluntary de-listing from Toronto Stock Exchange (“TSX”)
On June 5, 2020, the Company announced that it had applied for a voluntary delisting from the TSX effective as of the closing of trading on June 19, 2020. Following delisting, the Company's shares have continued to be listed and trade on NYSE American. Depositary interests representing shares also continue to trade on AIM of the London Stock Exchange plc. Since the Company's shares were listed on the NYSE American in 2017, trading on that market provides the most liquid market for Caledonia's shares. Accordingly, the financial and administrative costs associated with maintaining its listing on the TSX were no longer justified. In the six months following the de-listing from the TSX, liquidity in the Company’s shares on the NYSE American increased by over 150% to approximately 114,0000 shares per day compared to the combined liquidity on the NYSE American and TSX in the six months prior to the de-listing.
Strategy and Outlook
Caledonia’s immediate strategic focus is to complete the Central Shaft project, which is expected to increase production, reduce operating costs and increase the flexibility to undertake further exploration and development, thereby safeguarding and enhancing Blanket’s long-term future.
Caledonia will conduct exploration at the two optioned properties in Zimbabwe and will consider further investment opportunities in Zimbabwe that are privately-owned. Caledonia has also entered into an agreement with the Government of Zimbabwe in terms of which Caledonia may evaluate assets in the gold sector that are controlled by the Government with a view to assessing the potential for such assets to be commercially developed for mutual benefit.
Caledonia will evaluate investment opportunities in the gold and precious metals sector outside Zimbabwe.
6
3. SUMMARY FINANCIAL RESULTS
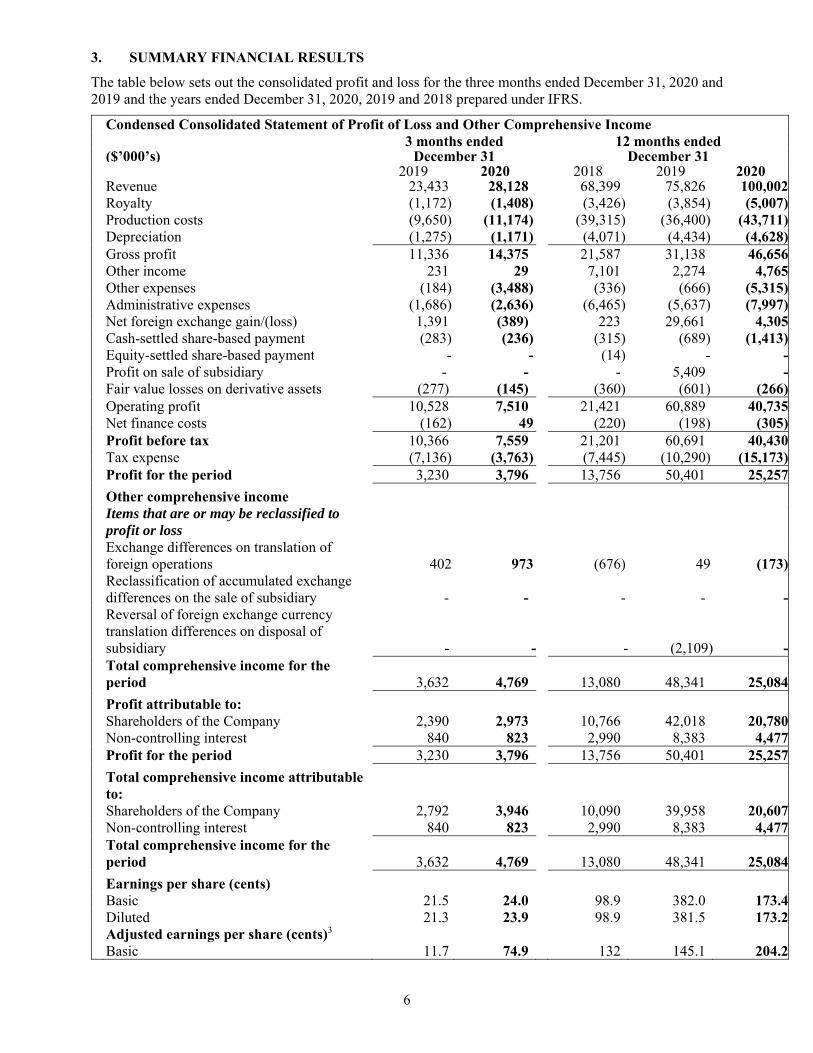
The table below sets out the consolidated profit and loss for the three months ended December 31, 2020 and 2019 and the years ended December 31, 2020, 2019 and 2018 prepared under IFRS.
Condensed Consolidated Statement of Profit of Loss and Other Comprehensive Income 3 months ended 12 months ended ($’000’s) December 31 December 31 2019 2020 2018 2019 2020 Revenue 23,433 28,128 68,399 75,826 100,002 Royalty (1,172) (1,408) (3,426) (3,854) (5,007) Production costs (9,650) (11,174) (39,315) (36,400) (43,711) Depreciation (1,275) (1,171) (4,071) (4,434) (4,628) Gross profit 11,336 14,375 21,587 31,138 46,656 Other income 231 29 7,101 2,274 4,765 Other expenses (184) (3,488) (336) (666) (5,315) Administrative expenses (1,686) (2,636) (6,465) (5,637) (7,997) Net foreign exchange gain/(loss) 1,391 (389) 223 29,661 4,305 Cash-settled share-based payment (283) (236) (315) (689) (1,413) Equity-settled share-based payment - - (14) - - Profit on sale of subsidiary - - - 5,409 - Fair value losses on derivative assets (277) (145) (360) (601) (266) Operating profit 10,528 7,510 21,421 60,889 40,735 Net finance costs (162) 49 (220) (198) (305) Profit before tax 10,366 7,559 21,201 60,691 40,430 Tax expense (7,136) (3,763) (7,445) (10,290) (15,173) Profit for the period 3,230 3,796 13,756 50,401 25,257
Other comprehensive income
Items that are or may be reclassified to profit or loss
Exchange differences on translation of foreign operations 402 973 (676) 49 (173)
Reclassification of accumulated exchange differences on the sale of subsidiary - - - - -
Reversal of foreign exchange currency translation differences on disposal of subsidiary - - - (2,109) -
Total comprehensive income for the period 3,632 4,769 13,080 48,341 25,084
Profit attributable to: Shareholders of the Company 2,390 2,973 10,766 42,018 20,780 Non-controlling interest 840 823 2,990 8,383 4,477 Profit for the period 3,230 3,796 13,756 50,401 25,257
Total comprehensive income attributable to:
Shareholders of the Company 2,792 3,946 10,090 39,958 20,607 Non-controlling interest 840 823 2,990 8,383 4,477
Total comprehensive income for the period 3,632 4,769 13,080 48,341 25,084
Earnings per share (cents) Basic 21.5 24.0 98.9 382.0 173.4 Diluted 21.3 23.9 98.9 381.5 173.2 Adjusted earnings per share (cents)3 Basic 11.7 74.9 132 145.1 204.2
7
Condensed Consolidated Statement of Profit of Loss and Other Comprehensive Income (cont.)
3 months ended
December 31 12 months ended
December 31 2019 2020 2018 2019 2020 Dividends declared per share (cents) 6.875 10.0 27.5 27.5 33.53 “Adjusted EPS” is a non-IFRS measure. Refer to section 10 of this MD&A for a reconciliation to IFRS EPS.
Revenue in the Quarter was 20% higher than in the comparable quarter due to a 27% increase in the average realised gold price offset by a 5% decrease in the quantity of gold sold. Gold sales in the Quarter include 1,803 ounces of gold that were included in work in progress at the end of the preceding quarter and were sold at the beginning of the Quarter and excludes 1,585 ounces of gold that were included in work in progress at the end of the Quarter and were sold immediately after the end of the Quarter. Revenue in the Year was 32% higher than in 2019 (the “previous year”) due to a 27% increase in the average realised gold price and a 4% increase in the quantity of gold sold. Gold production is discussed in section 4.3 of this MD&A.
Notwithstanding the increase in revenue for the Year, profit attributable to shareholders was 51% lower in the Year compared to the previous year. This was due to a combination of substantial foreign exchange gains and a significant profit arising on the disposal of a subsidiary in 2019. The increased revenue for the Quarter was reflected in a broadly corresponding increase in attributable profit for the Quarter.
The royalty rate payable to the Zimbabwe Government was unchanged at 5% in the Quarter. Due to the higher realised gold price in the Quarter, the royalty expense increased proportionately.
Production costs increased by 15.8% in the Quarter compared to the comparable quarter and by 20% in the Year compared to the previous year. As set out in section 4.6, production costs in the Quarter and the Year include certain costs that are beyond the control of management i.e. the incremental operating costs arising from COVID-19, increased use of diesel generators due to the instability of the grid power supply, the share-based payment expense (which is influenced by movement in the Company’s share price) and pre feasibility expenses. Excluding these costs, production costs for the Quarter increased by 39% compared to the comparable quarter and 16% in the Year compared to the previous year. The increase in costs, after adjustment for non-controlled items, was mainly due to the increased cost of maintaining the trackless underground equipment. Costs are discussed further in section 4.6 of this MD&A.
Other income for the Year mainly comprises the proceeds of the gold support price which is discussed in section 4.9; the gold support price mechanism was terminated in the preceding quarter and there was no revenue from this source in the Quarter and Other income for the Quarter was therefore insignificant.
Other expenses are detailed in note 13 to the Consolidated Financial Statements and include donations of $1,322 in the Year to the community to assist its efforts to address the coronavirus pandemic and an expense of $2,930 arising on the impairment of the Mascot, Eagle Vulture and Penzance exploration assets that have been identified to be disposed of as discussed further in section 5.
Administrative expenses are detailed in note 14 to the Consolidated Financial Statements and include the costs of Caledonia’s offices and personnel in Johannesburg, the UK, Jersey and Harare which provide the following functions: technical services, finance, procurement, investor relations, corporate development, legal and company secretarial. Administrative expenses in the Quarter were 56% higher than the comparable quarter and 42% higher in the Year compared to the previous year. The increase in the Quarterly expense was due to increased professional and advisory fees, higher wages and salaries and an increased cost of insurance cover for directors and officers. Increases in these areas were offset somewhat by lower travel and investor relations costs due to restrictions on travel resulting from the coronavirus pandemic.
Professional and advisory fees were $210 higher in the Quarter compared to the comparable quarter and $458 higher in the Year compared to 2019. The increase was due to, inter alia:
o Costs of evaluating potential investment opportunities, which culminated in the conclusion of option agreements over two exploration properties as discussed further in section 5;
o Costs associated with the Company’s voluntary de-listing from the TSX. Since the de-listing the liquidity of the Company’s shares on the NYSE American has increased substantially compared to the combined liquidity on NYSE American and TSX before the de-listing;

8
o Costs of preparing a Form F-3 Registration Statement which was subsequently used to raise $13m (before fees and expenses) as discussed in section 7; and
o Costs relating to the proposed solar project prior to the board decision to proceed.
Wages and salaries increased by $668 in the Quarter compared to the comparable quarter and by $1,035 in the Year. The increase was due to an increase in personnel in the areas of geology, rock mechanics and investor relations, and incentive payments to senior management to reflect the improved financial and operating performance in the Year and the near-completion of the Central Shaft.
The cost of directors and officers insurance cover increased from $86 in 2019 to $1,032. This considerable increase was explained to the Company as being due to several factors including a hardening of market conditions for directors and officers insurance, the exiting of the market by many insurance companies who are unwilling to write new lines of directors and officers insurance, anxieties due to the anticipated negative effects of the COVID-19 pandemic and a changing appetite of insurance companies towards taking on mining risks and in particular mining companies whose shares are traded in the United States (where derivative actions are more common).
Net foreign exchange movements relate to gains and losses arising on monetary assets and liabilities that are held in currencies other than the US Dollar. Foreign exchange movements principally arose due to the further devaluation of the Zimbabwe currency against the US Dollar which is discussed in section 4.9 of this MD&A. The net gain in the Quarter and the Year was smaller than in previous periods because financial liabilities (the devaluation of which had contributed the most to previous foreign exchange gains) are now devalued to such an extent that further devaluation has a reduced financial effect. The largest components of the net gain in the Quarter were unrealised gains on borrowings denominated in Zimbabwe currency and the deferred and income tax liability, offset by a realised loss on Zimbabwe currency denominated cash and VAT receivables.
The cash-settled share-based payment expense reflects an accrual for a payment which is expected to arise from the long-term incentive plan (“LTIP”) awards under the Company’s 2015 Omnibus Equity Incentive Compensation Plan (the “Plan”) to certain executives, heads of department and staff in the form of Restricted Share Units (“RSUs”) and Performance Units (“PUs”). LTIP awards may be settled in cash or, subject to conditions, shares or a combination of both at the request of the award holder. The LTIP expense reflects a combination of factors, including the change in the Company’s share price: the increased charge for the Year is mainly due to the increase in the price of the Company’s shares over the course of the Year. Further information on the calculation of the charge is set out in note 30 to the Consolidated Financial Statements.
The fair value loss on derivative assets in the Quarter was in respect of a gold ETF which was purchased in April 2020 by Caledonia Mining South Africa Proprietary Limited (“CMSA”) to protect against devaluation of the South African Rand against the US Dollar. South African foreign exchange restrictions do not allow CMSA to hold US Dollars in South Africa and administrative delays at commercial banks and the South African Reserve Bank impede CMSA’s ability to move cash around the Group as rapidly as operational considerations require. Accordingly, to protect against devaluation of the South African Rand and to retain CMSA’s operational flexibility, the surplus Rands were used to purchase a gold ETF.
The fair value loss on derivative assets in the Year includes a charge for a hedging arrangement which Caledonia put in place in January 2020 over 4,600 ounces of gold per month for the period from January 1, 2020 to June 30, 2020. The hedge comprised the purchase of out-of-the money put options which guaranteed that Caledonia received a minimum price of $1,400 per ounce in respect of the ounces hedged but retained full exposure to the gold price. The hedge was not for speculative purposes but was intended to protect Caledonia’s cashflows during a period when capital expenditure on the Central Shaft was expected to be high. The cash cost of the hedge was a once-off amount of $380; however, the accounting charge recognised the mark-to-market loss arising on the instruments.

9
The tax expense comprises the following:
Analysis of Consolidated Tax expense/(credit) for the Year ($’000’s) Zimbabwe South Africa UK Total Income tax 8,153 762 - 8,915 Withholding tax Management Fee - 122 - 122 Deemed Dividend 209 - - 209 CHZ Dividend to UK - - 110 110 CMSA Dividend to UK - - 136 136 Deferred tax 5,705 (24) - 5,681 14,067 860 246 15,173The overall effective taxation rate in the Year was 37%, the majority of which was made up of income tax and deferred tax in Zimbabwe.
Income tax in Zimbabwe is calculated at 25.75% of taxable profits which is IFRS profit before tax (in local currency terms) after adjustments which include the deduction of the government royalty, the add-back of depreciation and the deduction of capital expenditure in the year. The effective Zimbabwe income tax rate for the Year as a percentage of IFRS gross profit (which approximates to the on-mine profit before tax) was 16% which is lower than the headline rate of income tax due to the combined effect of the adjustments to IFRS profit set out above.
Deferred tax reflects the difference between the accounting and tax treatments of capital investment: 100% of capital expenditure is deductible in the year in which it is incurred for the purposes of calculating Zimbabwean income tax; whereas for accounting purposes depreciation commences when the project enters production. The deferred tax calculation is also affected by unrealised foreign exchange movements, which have been substantial in certain quarters and the requirement that tax computations are calculated using accounts denominated in local currency. The combined effective tax rate of Zimbabwean income tax and Zimbabwean deferred tax for the Year as a percentage of IFRS gross profit (which approximates to the on-mine profit before tax) was 27% which approximates to the headline tax rate of 25.75%.
South African income tax arises on intercompany profits arising at CMSA.
Withholding tax is Zimbabwean withholding tax on the management fees paid to CMSA and on dividend payments from Zimbabwe to the UK; South African withholding tax arose on dividends paid from CMSA to its parent company in the UK.
Following the acquisition by the Company of a further 15% interest in Blanket in January 2020, the effective non controlling interest share in profit or loss reduced from 16.2% to 13.2% of Blanket’s net profit. The non-controlling interest is discussed further in section 4.9.
Dividends comprise dividends paid by the Company and dividends paid by Blanket to its minority shareholders after deduction of amounts to repay the various advances and loans as discussed in section 4.9. The Company paid higher quarterly dividends during the Year (as discussed in section 14) totalling 33.5 cents per share – a 21.8% increase on the total dividends per share paid in the previous year. The increased quarterly dividend, in conjunction with the increased number of shares in issue following the equity issue in the third quarter of the Year (as discussed in section 7) resulted in an increase in Caledonia’s dividend distributions.
Risks that may affect Caledonia’s future financial condition are discussed in sections 4.9 and 17.
The table below sets out the consolidated statements of cash flows for the years ended December 31, 2020, 2019 and 2018 prepared under IFRS.

10
Cash generated from operating activities is detailed in note 32 to the Consolidated Financial Statements which shows that cash generated by operations before working capital changes in the Year was $42.4 million, 51% higher than $28.1 million in 2019. The increase was mainly due to the higher gross profit which is due mainly to the higher gold price offset somewhat by increased production costs. Working capital increased in the Year mainly due to an increase in inventories as discussed below in the review of the summarised consolidated statements of financial position.
Investment in property, plant and equipment remains high due to the continued investment in the Central Shaft project, which is discussed further in section 4.7 of this MD&A and in sustaining capital investment.
The acquisition of exploration and evaluation assets relates to the option fees payable in respect of the Glen Hume and Connemara North exploration properties as discussed further in section 5.
The purchase of the derivative financial assets relates to the purchase of the gold ETF by CMSA as discussed above.
Condensed Consolidated Statement of Cash Flows
($’000’s)
12 months ended December 31
2018 2019 2020Cash flows from operating activities Cash generated from operations 21,119 23,885 37,967Net interest paid (108) (308) (349)Tax paid (3,344) (5,517) (6,656)Net cash from operating activities 17,667 18,060 30,962 Cash flows used in investing activities Acquisition of property, plant and equipment (20,192) (20,024) (25,081)Acquisition of exploration and evaluation assets - - (2,759)Purchase of derivative financial asset - - (1,058)Proceeds from disposal of subsidiary - 1,000 900Net cash used in investing activities (20,192) (19,024) (27,998)
Cash flows from financing activities Dividends paid (3,497) (3,395) (4,542)Repayment of term loan facility (1,500) - (574)Term loan proceeds 6,000 2,340 -Term loan – transaction cost (60) (46) -Shares issued – equity raise - - 12,538Payment of lease liabilities - (124) (118)Share options exercised - - 30Net cash from/(used in) financing activities 943 (1,225) 7,334 Net (decrease)/increase in cash and cash equivalents (1,582) (2,189) 10,298Effect of exchange rate fluctuations on cash held 13 (105) (99)Net cash and cash equivalents at beginning of the period 12,756 11,187 8,893Net cash and cash equivalents at end of the period 11,187 8,893 19,092
11
Proceeds from the disposal of a subsidiary relates to the consideration received in respect of the sale of Eersteling Gold Mining Company Limited (“Eersteling”) as discussed in section 4.11.
The dividends paid relate to the dividends paid by Caledonia on the increased number of the Company’s shares in issue pursuant to the issue of shares to Fremiro (as discussed in section 5) and the equity issue (as discussed in section 7) and by Blanket to its minority shareholders.
The proceeds of the issue of shares relates to the issue of shares as discussed in section 7.
The effect of exchange rate fluctuations on cash held predominantly reflects gains or losses on cash balances held in currencies other than the US Dollar. The effect on cash balances forms part of an overall foreign exchange gain or loss arising on all affected financial assets and liabilities.
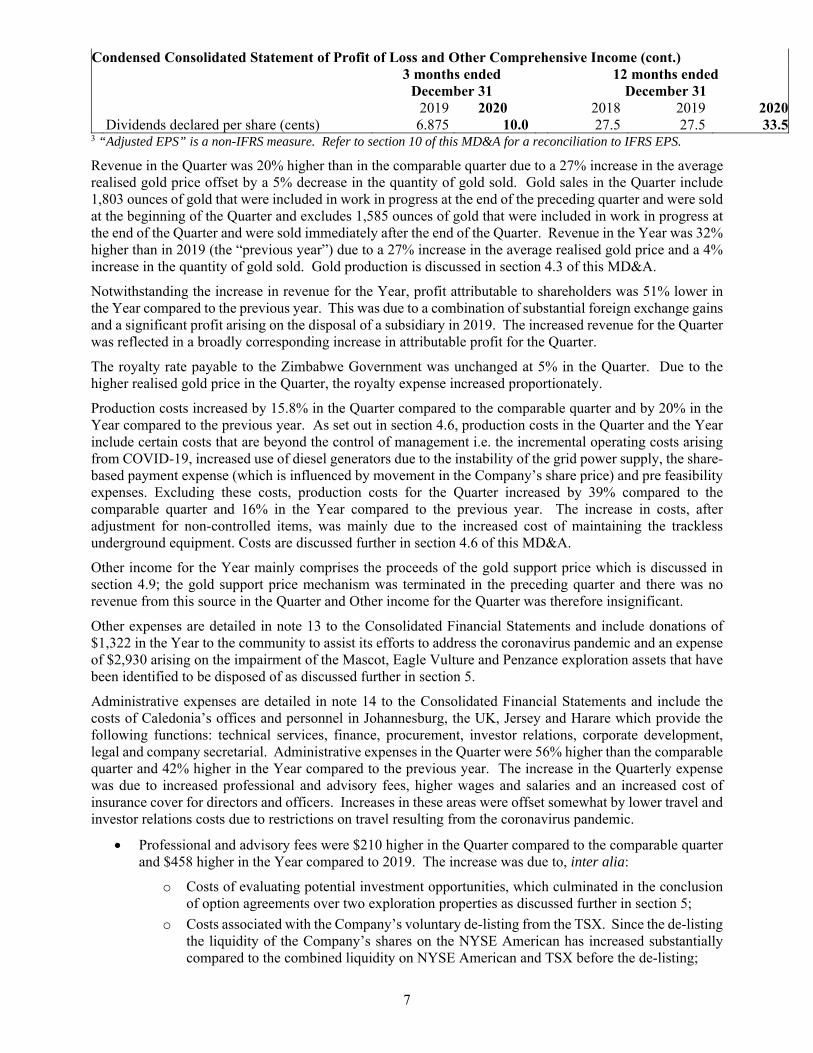
The table below sets out the consolidated statements of Caledonia’s financial position at December 31, 2020, December 31, 2019 and December 31, 2018 prepared under IFRS.
Summarised Consolidated Statements of Financial Position ($’000’s) As at Dec 31 Dec 31 Dec 31
2018 2019 2020
Total non-current assets 97,525 113,714 133,334 Inventories 9,427 11,092 16,798 Prepayments 866 2,350 1,974 Trade and other receivables 6,392 6,912 4,962 Income tax receivable - - 76 Cash and cash equivalents 11,187 9,383 19,092 Derivative financial assets - 102 1,184 Assets held for sale 296 - 500 Total assets 125,693 143,553 177,920 Total non-current liabilities 34,687 9,486 9,913 Term loan facility – short term portion - 529 408 Lease liabilities – short term portion - 112 61 Trade and other payables 10,051 8,348 8,664 Income taxes payable 1,538 163 495 Overdraft - 490 - Liabilities associated with assets held for sale 609 - - Cash-settled share-based payments - short term portion - - 336 Total liabilities 46,885 18,836 19,877 Total equity 78,808 124,717 158,043 Total equity and liabilities 125,693 143,553 177,920
Non-current assets increased due to the continued investment at the Central Shaft and investment to sustain existing operations.
Inventories increased due to the increased holdings of consumables in anticipation of any further disruption to Blanket’s supply chain due to the COVID-19 pandemic and to prepare Blanket for the usual shut-down in the supply chain from South Africa towards the end of each year. Items which contributed to the increased level of inventories include: spare parts for the trackless mining machinery; items of PPE and chemicals related to COVID-19; spare parts and consumables for the small scale metallurgical plant at Lima that has been re-commissioned to allow for increased production; and spare parts for new items of capital equipment.
Inventories include 1,585 ounces of gold work-in-progress (December 2019:840 ounces). For logistical reasons, this gold was delivered and sold to Fidelity Printers and Refiners (Private) Limited (“Fidelity”), a subsidiary of the Reserve Bank of Zimbabwe (“RBZ”), early in January 2021.
Prepayments represent deposits and advance payments for goods and services. Prepayments at 31 December 2020 and 2019 were higher than at 31 December 2018 because of the requirement to pay in advance for

12
consumables and other items due to the tightening of supplier credit due to the economic situation in Zimbabwe.
Trade and other receivables are detailed in note 22 to the Consolidated Financial Statements and include $1,311 (December 31, 2019: $2,987) due from Fidelity in respect of gold deliveries prior to the close of business on December 31, 2020 and $2,278 (December 31, 2019: $1,765) due from the Zimbabwe Government in respect of VAT refunds. The amounts due from Fidelity were received in full after the end of the Quarter. The amount due in respect of VAT refunds mainly comprises RTGS$-denominated VAT refunds which has increased because of the increased level of purchasing activity at the end of the Year in respect of which VAT refunds are due. Trade receivables also include $1,100 (December 31, 2019: $1,991) in respect of deferred consideration due on the disposal of Eersteling, the sale of which was concluded in the comparable quarter and is discussed in section 4.11 of this MD&A and $273 (December 31, 2019: $169) in respect of deposits for stores and equipment.
The distribution of the consolidated cash as at December 31, 2020 across the jurisdictions where the Company operates was as follows:
Geographical location of cash ($’000’s)
As at December 31
2019
December 31
2020
Zimbabwe (including overdraft) 3,499 5,115 South Africa 2,512 2,732 UK/Jersey 2,882 11,245 Total net cash and cash equivalents 8,893 19,092
The following information is provided for each of the eight most recent quarterly periods ending on the dates specified. The figures are extracted from underlying financial statements that have been prepared using accounting policies consistent with IFRS.
Mar 31, June 30, Sept 30, Dec 31, Mar 31, June 30, Sept 30, Dec 31($’000’s except per share amounts) 2019 2019 2019 2019 2020 2020 2020 2020
Revenue from operations 15,920 16,520 19,953 23,433 23,602 22,913 25,359 28,128
Profit attributable to owners of the Company 9,318 23,303 7,007 2,390 8,240 5,134 4,433 2,973Earnings per share – basic (cents) 88.6 210.8 63.4 21.5 71.2 43.1 36.6 24.0Earnings per share – diluted (cents) 88.5 210.9 63.4 21.3 71.1 43 36.5 23.9Net cash and cash equivalents 9,742 7,875 8,026 8,893 13,825 11,639 21,562 19,092
Fluctuations in profit attributable to owners of the Company on a quarterly basis are due to, inter alia, the incidence of substantial foreign exchange profits as discussed in the relevant MD&As and financial statements.

13
4. OPERATIONS AT THE BLANKET GOLD MINE, ZIMBABWE
4.1 Safety, Health and Environment
The following safety statistics have been recorded for the Quarter and the preceding seven quarters.
Blanket Mine Safety Statistics Classification
Q1 2019
Q2 2019
Q3 2019
Q4 2019
Q1 2020
Q2 2020
Q3 2020
Q4 2020
Fatal 0 0 0 0 0 0 0 0Lost time injury 2 0 0 1 1 1 1 3Restricted work activity 3 7 4 3 1 2 5 1First aid 0 0 0 0 0 1 0 0Medical aid 1 1 4 5 0 2 5 5Occupational illness 0 0 0 0 0 0 0 0Total 6 8 8 9 2 6 11 9Incidents 12 15 12 15 9 15 21 14Near misses 5 2 8 7 3 7 7 7Disability Injury Frequency Rate 0.81 1.08 0.62 0.60 0.29 0.42 0.80 0.55Total Injury Frequency Rate 0.97 1.23 1.23 1.34 0.29 0.83 1.48 1.23Man-hours worked (thousands) 1,240 1,296 1,297 1,341 1,395 1,443 1,491 1,460
In 2018 a training facility (called “Nyanzvi”) was established at Blanket using dedicated facilities and specially trained facilitators. The entire Blanket workforce has participated in the programme which resulted in the improvement in safety in the first two quarters of 2020. The Nyanzvi programme was suspended from late March 2020 due to the need to observe social distancing which contributed to the subsequent increase in reportable events. Management expects safety performance will improve when the Nyanzvi programme and other safety measures which were suspended due to COVID-19 restrictions are re-instated.
4.2 Social Investment and Contribution to the Zimbabwean Economy
Blanket’s investment in community and social projects which are not directly related to the operation of the mine or the welfare of Blanket’s employees, the payments made to the Gwanda Community Share Ownership Trust (“GCSOT”) in terms of Blanket’s indigenisation, and payments of royalties, taxation and other non-taxation charges to the Zimbabwe Government and its agencies are set out in the table below.
Payments to the Community and the Zimbabwe Government ($’000’s)
Period Year
Community and Social Investment
Payments to GCSOT
Payments to Zimbabwe
Government Total
Year 2013 2,147 2,000 15,354 19,501 Year 2014 35 - 12,319 12,354 Year 2015 50 - 7,376 7,426 Year 2016 12 - 10,637 10,649 Year 2017 5 - 11,988 11,993 Year 2018 4 - 10,140 10,144 Year 2019 47 - 10,357 10,404 Q1 2020 52 - 2,490 2,542 Q2 2020 1,002 84 2,787 3,873 Q3 2020 252 40 3,243 3,535 Q4 2020 383 60 4,006 4,449 Year 2020 1,689 184 12,526 14,399

14
There is no legal requirement in Zimbabwe to implement corporate and social responsibility (“CSR”), but there is an expectation from stakeholders and investors that mining companies should do more to address social and environmental issues. For many years Blanket has engaged in ad hoc CSR activities and Blanket’s CSR programme is set out on Caledonia’s website. The main activities during the Quarter were as follows: Women and Youth Empowerment: Blanket has 26 students on one-year attachment as part of their
tertiary studies. Education:
o Nsimbi Primary School: renovation of classrooms and drilling of boreholes o Sabiwa Primary School: renovation of classrooms and toilets; construction of new toilet block
and provision of desks Agriculture: Blanket supports the Gwakwe communal lands farming venture by providing water, seed
and fertilizer. Blanket has repaired the irrigation system, provided fencing and constructed a packing and tool shed. The project has harvested its first maize crop and is growing a second crop and is planting a sugar bean crop.
Health: o Blanket provided protective equipment and sanitisers to five local schools and the district
authority to assist in preventing the spread of the coronavirus; o Blanket constructed two 10-bed isolation wards at the Phakama Clinic including ablution facilities
and a fully-equipped kitchen. Each ward is equipped with 10 beds with lockers and stools; the centre has an autoclave to sterilise equipment, an anaesthetic machine, a ventilator, two multiple parameter monitors, bathrooms and nurses’ stations. The total cost of this project was $462,000.
As set out in section 15 of this MD&A, on February 22, 2021 Caledonia announced the appointment of a non-executive director with specific responsibility to oversee the Company’s CSR activities. 4.3 Gold Production
Tonnes milled, average grades, recoveries and gold produced during the Quarter, the preceding 11 quarters, the Year, the years 2017, 2018 and 2019 and January and February 2021 are shown in the table below.
Blanket Mine Production Statistics
Year Tonnes Milled
(t)
Gold Head (Feed) Grade (g/t
Au)
Gold Recovery (%)
Gold Produced (oz)
Year 2017 547,207 3.41 93.4 56,133 Quarter 1 2018 123,628 3.48 93.4 12,924Quarter 2 2018 132,585 3.19 92.8 12,657Quarter 3 2018 151,160 3.12 92.6 13,978Quarter 4 2018 153,540 3.27 92.8 14,952Year 2018 560,913 3.26 92.9 54,511 Quarter 1 2019 122,389 3.26 93.4 11,948Quarter 2 2019 135,847 3.11 93.2 12,712Quarter 3 2019 142,706 3.19 93.2 13,646Quarter 4 2019 155,389 3.61 93.8 16,876Year 2019 556,331 3.31 93.4 55,182 Quarter 1 2020 140,922 3.35 93.8 14,233Quarter 2 2020 143,210 3.13 93.9 13,499Quarter 3 2020 157,343 3.19 93.9 15,155Quarter 4 2020 156,487 3.19 93.5 15,012Year 2020 597,962 3.21 93.8 57,899 January 2021 52,449 2.68 92.4 4,177February 2021 46,145 2.96 92.8 4,080

15
Gold production for the Quarter was 11% lower than the comparable quarter and 0.9% lower than the previous quarter. Production for the Quarter was lower than the comparable quarter primarily due to lower grade and lower recovery. Gold production for the Year was 4.9% higher than in 2019. The higher production for the Year was due to increased tonnes milled and higher recovery the effect of which was offset somewhat by a lower grade. Tonnes milled and grade are discussed in section 4.4 of this MD&A; gold recoveries are discussed in section 4.5 of this MD&A.
Production in January and February was negatively influenced by a lower than planned grade which also affected the recovery. The lower grade was mainly due to fall-of-ground issues which resulted in lower tons from the high-grade area of AR South. This has been resolved by the end of February. Tonnages in February was also adversely affected by record high rainfalls for January and February which caused flooding underground and resulted in the loss of five production days. The flooding was rectified by installing extra pumps and an extra pump column in the shaft; the high rainfall levels have now eased as the region moves into the dry season.
4.4 Underground
The grade in the Quarter was 11.6% lower than the comparable quarter and unchanged from the preceding quarter; the grade in the Year was 3.0% lower than in 2019. The achieved grade for the Quarter and the Year was as expected in terms of the mine plan. Total development advanced in the Quarter by 4,213 meters compared to 3,781 meters in the previous quarter and 3,809 in the comparable quarter. The increased development reflects increased management focus and changes to the incentivization structure which rewards personnel equally on achieving targets for production, safety and development targets as pre-qualifiers to be eligible for bonuses.
4.5 Metallurgical Plant
Recoveries in the Quarter were 93.5% compared to 93.9% in the previous quarter; recoveries in the Year were 93.8% compared to 93.4% in 2019. The general improvement in recoveries in the Year was due to the commissioning of the new oxygen plant in October 2019 and the commissioning of an upgraded oxygen sparging system in the first quarter of 2020. The new oxygen plant has also reduced cyanide consumption by approximately 15%. In the Quarter work commenced on installing an additional mill which will increase milling capacity from 75 to 100 tonnes per hour which will be required to achieve target production of 80,000 ounces per annum.
4.6 Production Costs
A narrow focus on the direct costs of production (mainly labour, electricity and consumables) does not fully reflect the total cost of gold production. Accordingly, cost per ounce data for the Quarter and the comparable quarter have been prepared in accordance with the Guidance Note issued by the World Gold Council on June 23, 2013 and is set out in the table below on the following bases:
i. On-mine cost per ounce1, which shows the on-mine costs of producing an ounce of gold and includes direct labour, electricity, consumables and other costs that are incurred at the mine including insurance, security and on-mine administration;
ii. All-in sustaining cost per ounce1, which shows the on-mine cost per ounce plus royalty paid, additional costs incurred outside the mine (i.e. at offices in Harare, Johannesburg and Jersey), costs associated with maintaining the operating infrastructure and resource base that are required to maintain production at the current levels (sustaining capital investment), the share-based expense (or credit) arising from the LTIP awards less silver by-product revenue. The all-in sustaining cost also includes as a credit (i.e. as a deduction from costs) any revenue from the gold support price (or its predecessor); and
iii. All-in cost per ounce1, which shows the all-in sustaining cost per ounce plus the costs associated with activities that are undertaken with a view to increasing production (expansion capital investment).
1 On-mine cost per ounce, all-in sustaining cost per ounce and all-in cost per ounce are non-IFRS measures. Refer to section 10 for a reconciliation of these amounts to IFRS.

16
Cost per Ounce of Gold Sold (US$/ounce)
3 Months to December 31 12 Months to December 31
2019 2020 2019 2020 On-mine cost1 603 770 651 744 All-in sustaining cost per ounce1
812 1,083 820 946 All-in cost per ounce1 1,159 1,835 1,191 1,418
A reconciliation of costs per ounce to IFRS production costs is set out in section 10.
On-mine cost
On-mine cost comprises labour, electricity, consumables and other costs such as security and insurance. Production costs are detailed in note 9 to the Consolidated Financial Statements. The on-mine cost per ounce of gold sold in the Quarter excludes the costs relating to 1,585 ounces of work in progress which was sold immediately after the end of the Quarter.
The on-mine cost per ounce in the Quarter increased by 28% compared to the comparable quarter. The on-mine cost per ounce in the comparable quarter benefitted from a higher grade: the grade in the comparable quarter was 3.61 g/t compared to 3.21g/t in the Quarter. A higher grade reduces the on-mine cost per ounce which is generally related to tonnes of production. The on-mine cost per ounce for the Year increased by 14% compared to 2019. On-mine cost in the Quarter and the Year was adversely affected by increased maintenance costs for the underground trackless equipment. To reduce capital costs, the fleet largely comprised refurbished, second-hand equipment which requires more maintenance. Due to travel restrictions relating to the coronavirus pandemic, the Johannesburg-based contractor who was engaged to supervise and optimise the maintenance schedule was unable to travel to Blanket. The maintenance programme has been re-instated and the fleet is being replaced with new equipment. The performance of the fleet has improved in 2021.
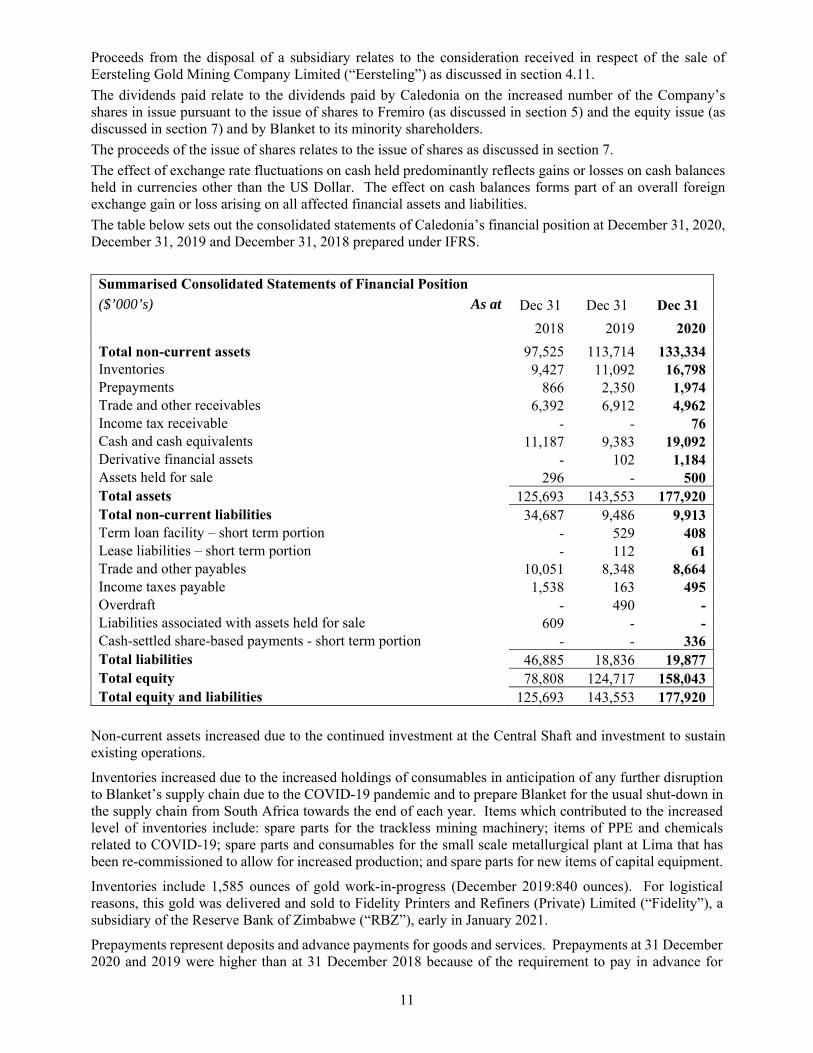
On-mine cost includes certain costs that are beyond the control of management (i.e. “non-controlled costs”) which include costs relating to COVID-19 (e.g. items of PPE, sanitisers etc); the cost of running diesel generators due to the instability of the grid electricity supply and cash settled share based expenses for employees at the mine (which is largely determined by the performance of the Company’s share price). The table below shows IFRS production costs adjusted for such costs for the Year and the Quarter and comparative periods.
17
Adjusted production costs ($’000)
3 Months to December 31 12 Months to December 31
2019 2020 2019 2020
IFRS production costs 9,650 11,174 36,400 43,711
Minus “non-controlled costs”:
COVID-19 related cost included in production cost - (198) - (824)
Diesel generator costs (337) (507) (1,366) (1,825)
Cash-settled share-based payments (34) (154) (107) (634)
Total non-controlled costs (371) (859) (1,473) (3,283)
Adjusted IFRS production cost 9,279 10,315 34,927 40,428
Tonnes milled (tonnes) 155,389 156,487 556,331 597,962
Adjusted dollar production cost per tonne milled ($/tonne) 59.71 65.92 62.78 67.61
Ounces of gold sold (0z) 16,053 15,230 54,801 57,137
Adjusted IFRS production cost per ounce of gold sold ($/oz) 578 677 637 708
Excluding non-controlled costs, IFRS production costs per tonne (which excludes the effect of variations in the grade or recovery) increased for the Year by 7.7% from $637/tonne to $708/tonne; the cost per tonne milled increased for the Quarter by 10.4% from $59.71/tonne to $65.92/tonne.
All-in sustaining cost
The all-in sustaining cost per ounce in the Quarter was 33% higher than the comparable quarter; the all-in sustaining cost for the Year was 15% higher than 2019. The increase was due to the higher on-mine cost per ounce as discussed above and the cost of increased insurance cover for directors and officers and increased wages and salaries as discussed in section 3. Administrative expenses are detailed in note 9 to the Consolidated Financial Statements and are discussed in section 3.
All-in cost
All-in cost includes investment in expansion projects which remained at a high level in the Quarter due to the continued investment at Blanket, as discussed in section 4.7 of this MD&A.
4.7 Capital Projects
The main capital development project is the Central Shaft which will allow for three new production levels below the current operations; a fourth level is intended to be added in due course via a decline construction. Shaft sinking commenced in early 2015 and the shaft reached its target depth of 1,204 metres (approx. 4,000 feet) in July 2019; shaft equipping was completed in the Quarter and the production headgear was erected in January 2021. Work on the Central Shaft project from April 2020 was delayed by restrictions on the movement of specialised personnel and the transport of equipment due to the coronavirus pandemic. The Central Shaft is now expected to be commissioned in the first quarter of 2021 instead of the fourth quarter of 2020. The delay in commissioning has affected target production for 2021 which has been reduced from approximately 75,000 ounces to a range of 61,000 to 67,000 ounces. There is no change to the target production rate of 80,000 ounces from 2022 onwards.
Work on underground development continued but was hampered by the unstable electricity supply which

18
caused frequent power interruptions and by systemic power outages due to the general lack of electricity in Zimbabwe as discussed in section 4.9. Capital development was also adversely affected by a reduction in the number of workers who could work underground due to restrictions arising from measures to prevent the spread of coronavirus.
In addition to the Central Shaft, work continued at the following developments with total capital development of 554 meters in the Quarter:
Blanket Decline 4. This development, which is located between the Blanket and AR South ore bodies, was established in the previous quarter and will be mined from the 870-meter level down to the 930-meter level where a new decline (decline 6) will be developed to link with the haulage on the 990-meter level from Central Shaft. Decline 4 face has reached 915-meter level;
Blanket Decline 5 which is branching off Decline 4 has been developed past 900-meter level and is 15m from reaching 915-meter level;
AR Main Decline (Decline 2): this decline has been mined to 825 meters but further work has been paused to allow for more geological evaluation; in the meantime, work has commenced on creating development blocks from the 825-meter level to the 750-meter level above; and
Eroica Decline 3: the decline face is now at the 810-meter level and will continue to the 870-meter level so that the Eroica ore body can be established from the 870-meter level up to the 750-meter level above.
4.8 Indigenisation
Transactions that implemented the indigenisation of Blanket (which expression in this section and in certain other sections throughout this MD&A refers to the Zimbabwe company that owns Blanket Mine) were completed on September 5, 2012 following which Caledonia owned 49% of Blanket, which fully complied with the Indigenisation and Economic Empowerment Act.
The requirement for gold mining companies to be indigenised was removed by a change in legislation with effect from March 2018. On November 6, 2018, the Company announced it had entered into a sale agreement with Fremiro to purchase Femiro’s 15% shareholding in Blanket for a gross consideration of $16.7 million which was to be settled through a combination of the cancellation of the loan between the two entities which stood at $11.5 million as at June 30, 2018 and the issue of 727,266 new shares in Caledonia at an issue price of $7.15 per share. This transaction was completed on January 20, 2020 after which Caledonia’s shareholding in Blanket increased to 64% shareholding in Blanket and Fremiro received approximately 6.3% of Caledonia’s enlarged issued share capital at that date.
As a 64% shareholder, Caledonia receives 64% of Blanket’s dividends plus the repayment of vendor facilitation loans which were extended by Blanket to certain of the indigenous shareholders. The outstanding balance of the facilitation loans at December 31, 2020 was $19.4 million (December 31, 2019: $31.0 million), the reduction being largely due to the cancellation of the loan due from Fremiro on completion of the Fremiro transaction (described above). The facilitation loans (including interest thereon) are repaid by way of dividends from Blanket; 80% of the dividends declared by Blanket which are attributable to the beneficiaries of the facilitation loans are used to repay such loans and the remaining 20% accrues to the respective indigenous shareholders. The dividends attributable to GCSOT, which holds 10% of Blanket, are withheld by Blanket to repay the advance dividends which were paid to GCSOT in 2012 and 2013 and which had an outstanding balance of $994,436 at December 31, 2020 (December 31, 2019; $1.63 million). In February 2020, Blanket agreed to a request from GCSOT that the terms of the debt relating to the repayment of the advance dividends be amended so that GCSOT would receive 20% of its attributable dividends and the balance of 80% will be applied to repay the advance dividends.
The facilitation loans are not shown as receivables in Caledonia’s financial statements in terms of IFRS. These loans are equity instruments as their only means of repayment is via dividend distributions from Blanket. Caledonia continues to consolidate Blanket for accounting purposes. Further information on the accounting effects of indigenisation at Blanket is set out in note 5 to the Consolidated Financial Statements.

19
4.9 Zimbabwe Commercial Environment
Monetary Conditions
The current situation in Zimbabwe can be summarized as follows:
There continues to be a shortage of foreign currency in Zimbabwe, although Blanket continues to have satisfactory access to foreign exchange.
The rate of annual inflation increased from 5% in September 2018 to approximately 500% by December 2019. By December 2020, the monthly inflation rate had fallen to approximately 4.2% and the annual rate was approximately 350%. A high rate of inflation has little effect on Blanket’s operations now that Blanket has adjusted employee remuneration to reflect the increased cost of living – this is discussed further below.
Since October 2018, bank accounts in Zimbabwe are bifurcated between Foreign Currency Accounts (“FCA”), which are effectively US Dollar denominated, and local currency (known as “ZWL$”, “RTGS Dollars” or “RTGS$”) accounts which are subject to devaluation in US$ terms and can only be used for domestic transactions.
On February 20, 2019, the RBZ allowed inter-bank trading between currency in the RTGS$ and the FCA systems. Prior to this, the RBZ had stipulated that a Dollar in the RTGS system was worth 1 US Dollar in the FCA system. The interbank exchange rate at each quarter end since the introduction of the interbank rate in February 2019 and the most recent exchange rate is set out below.
Interbank Exchange Rates (ZWL$:US$1) February 20, 2019 2.500 March 31, 2019 3.003 June 30, 2019 6.543 September 30, 2019 15.090 December 31, 2019 16.773 March 31, 2020 25.000 June 30, 2020 57.3582 September 30, 2020 81.4439 December 31, 2020 81.7866 March 17, 2021 85.5
The interbank trading mechanism addressed the most pressing difficulty that emerged after the October 2018 policy implementation, being the erosion of the purchasing power of Blanket’s employees due to rapidly increasing retail prices which had an adverse effect on employee morale. Management has increased RTGS$-denominated remuneration so that it remains more closely aligned to the US Dollar value using the interbank rate. More recently, Management has also introduced an element of FCA-denominated remuneration. These measures have alleviated some of the financial anxiety experienced by Blanket employees.
In February 2020, the RBZ announced its intention to further liberalise the interbank market with the objective of increasing liquidity and transparency. However, in response to the COVID-19 pandemic, the Minister of Finance reversed this policy and re-established a fixed exchange rate of ZWL$25:US$1 with effect from March 26, 2020. Despite the fixed exchange rate, the local currency continued to devalue on the informal exchange markets. On June 23, 2020, the RBZ introduced an “auction system” whereby, on a weekly basis, buyers and sellers of local currency and foreign exchange submit tenders which the RBZ uses to determine a revised interbank rate.
Zimbabwean gold producers, including Blanket, are required to sell their gold to Fidelity. Prior to May 26, 2020, 55% of the sale proceeds were received in FCA and the balance was received in RTGS$. From May 26, 2020 gold producers received 70% of their sale proceeds in FCA and the balance was received in RTGS$. With effect from 7 January, 2021, gold producers receive 60% of their revenues in FCA and the balance in RTGS$. Blanket uses the FCA component to pay for imported goods, services, electricity

20
and a portion of the wages and salaries at Blanket; the RTGS$ component is used to pay for goods and services procured in Zimbabwe, the remaining portion of wages and salaries at Blanket and payroll taxes and a proportion of Blanket’s income tax. At prevailing gold prices and the current rate of production, the 60% FCA allocation in conjunction with the weekly auction system is sufficient for Blanket to continue normal mining operations, to fully implement the investment plan as scheduled and allow Caledonia to remit dividends from Zimbabwe.
Provided the interbank exchange rate is efficient, Blanket continues to participate effectively in the weekly foreign exchange auctions and Blanket receives the amounts due promptly, in full and at an exchange rate which reflects economic fundamentals, management is optimistic the current policy is an acceptable environment. Investors should recognize that Blanket’s ability to implement its investment plan and Caledonia’s ability to sustain its operations outside Zimbabwe and pay future dividends depends, inter alia, on the ability to continue to externalise cash from Zimbabwe.
Throughout these developments and to the date of issue of the Consolidated Financial Statements the US Dollar has remained the primary currency in which the Group’s Zimbabwean entities operate and the functional currency of these entities.
Gold support price
Blanket sells gold to Fidelity at a price which is 98.75% of the price fixed by the London Bullion Market Association (the “LBMA price”).
Prior to February 20, 2019, Blanket, in common with the other gold producers, received the Export Credit Incentive (“ECI”) which was a 10% premium to the LBMA price. On February 27, 2019 Caledonia announced the ECI programme had been terminated. However, from March 6, 2019 it became apparent that Blanket’s sales proceeds were calculated at a gross price of $44,000 per kilogram (US$1,368.58 per ounce), which exceeded the prevailing LBMA price. On May 12, 2019, the Company received confirmation from Fidelity of this arrangement, called the “gold support price”, which was intended to incentivize gold producers to increase gold production. The gold support price was not increased when the LBMA gold price subsequently increased above $1,368.58 per ounce and therefore from early June 2019 there was no further income in respect of the gold support price because the LBMA gold price exceeded the gold support price on each delivery date.
On March 16, 2020 Blanket received notification from Fidelity that, henceforth, Blanket would receive an incentive of 25% of the LBMA price. The incentive was receivable in RTGS$ and was calculated at 25% of the LBMA price for each delivery at the prevailing interbank rate. This incentive was withdrawn on May 26, 2020 at the same time as the FCA allocation for revenues was increased from 55% to 70% as discussed above.
There was no income arising in the Quarter from the ECI and the gold support price; any income from such sources in previous quarters was included as “Government Grant - Other Income” and was treated as a deduction from costs for the purposes of calculating all-in sustaining costs, as set out in section 10.1.
Electricity supply
Blanket experiences interruptions to its power supply from the grid and the supply from the grid is also subject to frequent surges and dips in voltage which, if not controlled, cause severe damage to Blanket’s electrical equipment. To address this matter, in 2019 Blanket increased its diesel generating capacity to 18MW of installed capacity which is sufficient to maintain all operations and capital projects. Caledonia’s board has approved a project to construct a 12 MWac solar project which will provide approximately 27% of Blanket’s average daily electricity demand at a cost of approximately $12 million. This is discussed further in section 4.13.
Water supply
Blanket uses water in the metallurgical process, some of which is pumped from the deeper levels of the mine but most of which is obtained from the “Blanket dam” (which, despite its name, is neither owned nor managed by Blanket Mine) which also supplies water to the nearby town of Gwanda. Blanket is situated

21
in a semi-arid region and rainfall typically only occurs in the period November to February. The 2020/21 rainy season has been excellent and water supply is adequate for the foreseeable future.
Taxation
The main elements of the Zimbabwe tax regime insofar as it affects Blanket Mine and Caledonia are as follows:
A royalty is levied on gold revenues at a rate of 5% if the gold price is above $1,200 per ounce; a royalty rate at 3% applies if the gold price is below $1,200. With effect from January 1, 2020 the royalty is allowable as a deductible expense for the calculation of income tax.
Income tax in the Year was levied at 25.75% on profits as adjusted for tax purposes. The main adjustments to profit for the purposes of calculating tax are the add-back of depreciation and most of the management fees paid by Blanket to CMSA. 100% of all capital expenditure incurred in the year of assessment is allowed as a deductible expense. Deferred tax is raised for the difference between capital expenditure and depreciation, in addition to other timing differences such as unrealized foreign exchange gains and losses. The calculation of taxable income is performed using financial records prepared in RTGS$: in an environment where the local currency is rapidly depreciating against the US Dollar, this significantly reduces the deferred tax liability; however, it increases the taxable profits denominated in local currency. The income tax liability is translated into US Dollars for reporting purposes, but the eventual payment of the liability is made in a combination of US Dollars and local currency, which may give rise to further exchanges gains or losses. With effect from 1 January 2021 mining entities will be levied income tax at a rate of 24.72%.
Withholding tax is levied on certain remittances from Zimbabwe i.e. dividend payments from Zimbabwe to the UK and payments of management fees from Blanket to CMSA.
4.10 Opportunities and Outlook
Central Shaft Project to Increase Production and Extend Mine Life
As discussed in section 4.7 the Company has sunk a new shaft to a depth of 1,204 meters and this shaft is expected to be commissioned by the end of the first quarter of 2021. Once commissioned, the shaft should allow production to increase to the targeted rate of approximately 80,000 ounces per annum from 2022 onwards.
Production Guidance
On October 5, 2020, following record production in the third quarter of 2020 the Company increased production guidance for 2020 from a range of 53,000 to 56,000 ounces to a range of 55,000 to 58,000 ounces. Production for the Year was 57,899 ounces, which was towards the upper end of the guidance range.
Production guidance for 2021 is a range of 61,000 to 67,000 ounces. This is forward looking information as defined by National Instrument 51-102. Refer to section 18 of this MD&A for further information on forward looking statements.

22
Cost Guidance
Guidance in respect of on-mine cost per ounce and AISC per ounce for 2020 and 2021 and the outcome for 2020 is set out in the table below.
Cost guidance for 2020 and 2021 and 2020 actual costs
2020 2021
Guidance Actual Guidance
On-mine cost per ounce ($/oz) 693-767 770 740-815
AISC per ounce ($/oz) 951-1,033 1,083 985-1,080
Actual on-mine cost per ounce and AISC per ounce for the Year were higher than guidance for the reasons set out in section 4.6 which include: costs relating to COVID-19 and increased use of diesel generators; and higher administrative costs due to the increased cost of insurance cover and higher wages and salaries.
Cost guidance is forward looking information as defined by National Instrument 51-102. Refer to section 18 of this MD&A for further information on forward looking statements.
4.11 Sale of Eersteling
On May 31, 2018, the Group entered into a share sale agreement to sell the shares and claims of Eersteling, a South African subsidiary which owns a mine that was on care and maintenance since 1997. The share sale agreement allowed for a purchase price of $3 million to be settled by three payments of $1 million, the last of which fell due on July 30, 2020. The purchaser was unable to make the final payment due to the closure of the operation during the South African lock-down period and the death of one of the purchaser’s principals. Caledonia continues constructive engagement with the purchaser to recover the outstanding consideration of $1,099 (December 31, 2019: $1,991). An amount of R5 million (US$342) was received in 2021 in part settlement of the outstanding amount; Caledonia is of the opinion that the remaining outstanding amount is fully recoverable.
4.12 COVID-19
One case of coronavirus was recorded at Blanket during the Year; 37 cases of coronavirus have been detected in 2021 and some cases were also detected at the Company’s offices in Harare and amongst its employees in Johannesburg. None of the identified cases resulted in hospitalisation and all infected persons appear to have made a full recovery. Periodic lockdowns from March 2020 in Zimbabwe and South Africa had a negligible effect on production in the Quarter or the Year and in 2021 to the date of this MD&A. However, as discussed in section 4.7, they caused some slippage in the timetable to complete Central Shaft.
COVID-19 related operating costs such as the cost of protective equipment were $179 in the Quarter and $824 for the Year. Blanket also donated $290 in the Quarter and $1,322 in the Year to the community to assist its efforts to address the pandemic.
4.13 Proposed solar project
As noted in section 4.9, Blanket suffers from unstable grid power and frequent and prolonged power outages due to load shedding. In late 2019 Caledonia initiated a tender process to identify parties to make proposals for a solar project to reduce Blanket’s reliance on grid power. After careful consideration, Caledonia’s board approved the construction of a 12MWac solar plant at a cost of approximately $12 million. The plant is expected to provide all of Blanket’s minimum electricity demand during daylight hours; Blanket will continue to rely on the grid and generators to provide additional power during daylight hours and at night. It is estimated that the solar plant will provide approximately 27% of Blanket’s total daily electricity requirement. Battery power is currently too expensive to justify their use to augment the solar project, but the Company will continue to monitor this situation as battery technology develops. The Company will also

23
evaluate a further phase for the solar project to provide Blanket’s peak demand during daylight hours, but this will require an agreement between the Company and the Zimbabwe authorities regarding the treatment of power that will be generated by a second phase that is surplus to Blanket’s requirements.
The Company investigated the possibility of raising non-recourse debt to fund all or part of the proposed project but such funding was not available. Accordingly, the Company raised $13 million (before commission and expenses) through the sale of 597,963 shares at an average price of $21.74 per share.
The status of the project is as follows:
the 40-hectare site for the project has been cleared and fenced and is ready for civil work to commence;
Caledonia has obtained the necessary licences and permits for the project;
Contracts between Caledonia and the various other parties have been negotiated and on October 7, 2020 the Company announced it had appointed Voltalia, an international renewable energy provider, as contractor for the project; and
Caledonia and Voltalia are currently in the process of satisfying final conditions precedent, including production of the detailed design for the project, after which procurement and construction are expected to begin with current indicated commissioning for the 12MWac solar plant in early 2022.
5. EXPLORATION
Caledonia’s exploration activities are focussed on the growth and development of Blanket Mine and on two new exploration properties in respect of which Caledonia acquired purchase options during the Quarter. In January 2020 Ms Janet Hobkirk joined Caledonia as Group Mineral Resource Manager. Ms Hobkirk will be responsible for driving Caledonia’s exploration activities both at Blanket and any new properties.
There was no deep exploration drilling in the Quarter as all the available drilling sites had been drilled out in accordance with the annual budget. Deep level exploration drilling will re-commence after the Central Shaft and the related development has been completed to provide access to new drilling positions.
Exploration at Blanket’s portfolio of satellite properties has been suspended since 2016 so that resources could be re-deployed at Blanket. Since then, the Company has evaluated other investment opportunities in Zimbabwe and has concluded that the satellite properties other than GG are unattractive due to their relatively small size, low grade, limited exploration potential, operating complexity and metallurgical incompatibility with the existing Blanket plant. Accordingly, Blanket has entered discussions to sell the Mascot, Eagle Vulture and Penzance properties for a cash consideration of $500. This transaction entails an impairment of the carrying value of these assets of $2,930 which is classified as “Other expense” in the Statement of Profit and Loss and Other Comprehensive Income and is a non-cash item.
The GG satellite property remains on care and maintenance. Limited surface drilling was undertaken in the Quarter to test for parallel zones to the south of the existing mineralised zone. Preliminary results are encouraging and drilling continues. The Lima pilot plant, which could be used to process any material from GG, has recently been upgraded to accommodate 200 tonnes per day.
During the Quarter, Caledonia acquired purchase options in respect of two properties, Glen Hume and Connemara North, located in the Gweru mining district in the Zimbabwe Midlands – an area that has historically produced significant quantities of gold.
Glen Hume In December 2020 Caledonia acquired the exclusive right to explore an area of approximately 350 hectares with substantial evidence of gold mineralisation including historical mining activity for a period of up to 15 months. If exploration is successful and at its sole discretion, Caledonia has the right to acquire the mining claims over the area. The total consideration is an initial payment of $2.5 million in cash, followed by a further payment of $2.5 million (payable in cash or shares at the discretion of the vendor) which would be payable should Caledonia decide to exercise its right to acquire the mining claims. Caledonia has also agreed to the payment of a 1% net smelter royalty ("NSR") to the vendor on gold it produces from the area. The NSR can subsequently be bought out at Caledonia's discretion for a lump sum payment of $15 million within the first five years following the acquisition by Caledonia of the claims, or $10 million until the tenth anniversary of operation or $5 million thereafter.

24
Caledonia has conducted airborne geophysics which indicates attractive exploration targets and has also conducted preliminary metallurgical work indicating favourable grade and recovery. A preliminary contract has been signed with the existing drilling contractor, a drill programme has commenced with 1,012.6 metres of reverse circulation drilling completed. Diamond drilling commenced in January 2021. The planned drilling programme across the entire duration of the 15-month option period is for 5,100 meters of reverse circulation drilling and 3,500 meters of diamond drilling. The necessary quality assurance and control protocols have been implemented, laboratory services procured and samples submitted for assay.
Connemara North
In December 2020 Caledonia announced it had entered into an option agreement which gives the Company the exclusive right to explore for a period of 18 months and subsequently, if exploration is successful and at its sole discretion, acquire the mining claims over an area known as Connemara North. The total consideration is an initial payment of $300, followed by a further payment of $5 million (payable in cash or shares at the discretion of the vendor) which would be payable should Caledonia decide to exercise its right to acquire the mining claims. Caledonia has also agreed to the payment of a 1% NSR to the vendor on gold it produces from Connemara North. Connemara North is the northern section of the currently closed Connemara mine which was previously owned by First Quantum Minerals (“First Quantum”); it was placed on care and maintenance in 2001 and subsequently disposed of in 2003. It has not been commercially mined since this time but before being placed on care and maintenance the Connemara mine produced approximately 20,000 ounces of gold per annum from an open pit heap leach operation. Previous public disclosures made by First Quantum in 2001 indicated that they had plans to expand the existing open pit operations at Connemara mine, when gold prices were approximately $300/oz. At this stage it is not possible for Caledonia to verify any of the work performed by previous owners or to ascertain what proportion of any purported resource lies within the boundaries of the Connemara North property over which Caledonia has secured the option. The property is approximately 30km from Glen Hume with good road access between them offering the potential of operating synergies should Caledonia decide to develop both areas. Existing data sets have been reviewed for scoping of the proposed exploration programme which will commence in 2021.

25
6. INVESTING
An analysis of investment in the Quarter, the Year, the preceding quarters in 2020 and the years 2018 and 2019 is set out below.
($’000’s) 2018 2019 2020 2020 2020 2020 2020 Year Year Q1 Q2 Q3 Q4 Year
Total Investment – Property, plant and equipment 19,453 20,423 4,072 4,054 5,714 10,938 24,778Blanket 19,438 20,128 4,066 4,042 5,537 10,670 24,315Solar - - - - 136 236 372Other 15 295 6 12 41 32 91 Total investment – Exploration and evaluation assets 462 172 28 34 14 2,982 3,058Connemara North - - - - - 300 300Glen Hume - - - - - 2,661 2,661Other Satellite properties 462 172 28 34 14 21 97
Investment at Blanket is in terms of the investment plan that was announced in October 2014 and which is discussed in section 4.7 of this MD&A. Investment that takes place other than at Blanket largely comprises investment in the proposed solar project after it had received board approval (as discussed in section 4.13) and capital items that are purchased by CMSA which will be sold on to Blanket in due course. All further investment at Blanket is expected to be funded from Blanket’s internal cash flows and its Zimbabwean borrowing facilities.
7. FINANCING
The Company raised $13 million (before expenses) during the third quarter of 2020 by issuing 597,963 shares at an average price of $21.74 per share. The proceeds of this financing are intended to fund the construction of a solar plant as discussed in section 4.13. Other than the issue of equity to fund the solar project, Caledonia financed all its operations using funds on hand and those generated by its operations. The Company has no debt other than loan facilities which are held by Blanket and which were as set out below at December 31, 2020:
Blanket debt facilities
Lender Date drawn Principal valueBalance drawn at December 31, 2020 Repayment terms Security
Term Facilities Stanbic Bank Zimbabwe Limited
December 2018
RTGS$6 million RTGS$6 million
Single bullet in December 2021 Unsecured
First Capital Bank Limited October 2018
RTGS$35 million RTGS$35 million
4 equal quarterly instalments commencing December 2020 Unsecured

26
Blanket debt facilities (cont.) Overdraft facilities
Lender Date drawn Principal valueBalance drawn at December 31, 2020 Repayment terms Security
Stanbic Bank Zimbabwe Limited August 2019
RTGS$15 million Nil On demand Unsecured
First Capital Bank Limited October 2019
RTGS$10 million Nil On demand Unsecured
8. LIQUIDITY AND CAPITAL RESOURCES
An analysis of Caledonia’s capital resources at December 31, 2020 and at the end of each of the preceding 5 quarters is set out below.
Liquidity and Capital Resources ($’000’s)
As at Sept 30 Dec 31 Mar 31 Jun 30 Sept 30 Dec 31 2019 2019 2020 2020 2020 2020
Overdraft – 490 – – – - Term facility 424 2,471 1,585 721 515 408 Gold ETF – – – 1,112 1,160 1,184 Cash and cash equivalents in the statement of cashflows (net of overdraft) 8,026 8,893 13,825 11,639 21,562 19,092 Working capital 17,614 19,960 22,798 24,937 37,691 34,622
Movements in Caledonia’s net cash, the overdraft and working capital and an analysis of the sources and uses of Caledonia’s cash are discussed in section 3 of this MD&A. The overdraft and term facilities are held by Blanket with Zimbabwean banks with security and repayment periods as detailed in section 7. The Company’s liquid assets as at December 31, 2020 plus anticipated cashflows exceed its planned and foreseeable commitments as set out in section 9 of this MD&A.
9. OFF-BALANCE SHEET ARRANGEMENTS, CONTRACTUAL COMMITMENTS AND CONTINGENCIES
There are no off-balance sheet arrangements apart from the facilitation loans of $19.5 million which are not reflected as loans receivable for IFRS purposes (refer to note 5 of the Consolidated Financial Statements). The Company had the following contractual obligations at December 31, 2020:
Payments due by Period ($’000’s)
Falling due Within 1
year 1-3 Years 4-5 Years After 5 Years Total
Trade and other payables 8,664 - - - 8,664Term loan 408 - - - 408Provisions 139 793 93 2,542 3,567Capital expenditure commitments 2,998 - - - 2,998Lease Liabilities 61 178 - - 239Cash-settled share-based payments 336 1,934 - - 2,270
The capital expenditure commitments relate primarily to materials and equipment which have been ordered by CMSA and which will be sold on to Blanket. In addition to the committed purchase obligations set out above, Blanket currently intends to invest a further $35.8 million in 2021 which is also uncommitted and

27
includes $12.4 million on the solar project and $1.8 million on the optioned exploration properties. Other than the proposed investment on the solar project and at the exploration properties, the committed and uncommitted investment will be used to maintain Blanket’s existing operations and implement the Central Shaft which is discussed in section 4.7 of this MD&A.
Committed and uncommitted purchase obligations are expected to be met from the cash generated from Blanket’s existing operations and Blanket’s existing borrowing facilities and, in respect of the cost of the proposed solar project, the proceeds of the issue of shares as discussed in section 7.
The Group leases property for its administrative offices in Jersey, Harare and Johannesburg; following the implementation of IFRS 16 the Group recognises the liabilities for these leases. As of December 31, 2020, Caledonia had potential liabilities for rehabilitation work on Blanket – if the mine is permanently closed – at an estimated discounted cost of $3.6 million (2019: $3.3 million; 2018: $3.3 million).
10. NON-IFRS MEASURES
Throughout this document, we have provided measures prepared in accordance with IFRS in addition to some non-IFRS performance measures for investors who use them to evaluate our performance. Since there is no standard method for calculating non-IFRS measures, they are not a reliable way to compare Caledonia against other companies. Non-IFRS measures should be used along with other performance measures prepared in accordance with IFRS. We have defined below the non-IFRS measures we have used in this document and provide a reconciliation of such non-IFRS measures to the IFRS measures we report.
10.1 Cost per ounce
Non-IFRS performance measures such as “on-mine cost per ounce”, “all-in sustaining cost per ounce” and “all-in cost per ounce” are used in this document. Management believes these measures assist investors and other stakeholders in understanding the economics of gold mining over the life-cycle of a mine. These measures are calculated on the basis set out by the World Gold Council in a Guidance Note published on June 23, 2013 and accordingly differ from the previous basis of calculation. The table below reconciles “on-mine cost per ounce”, “all-in sustaining cost per ounce” and “all-in cost per ounce” to the production costs shown in the financial statements which have been prepared under IFRS.

28
Reconciliation of IFRS Production Cost to Non-IFRS Costs per ounce ($’000’s unless otherwise indicated)
3 months ended December
31 12 months ended December
31 *2019 2020 *2019 2020Production cost (IFRS) 9,650 11,174 36,400 43,711 COVID-19 expenses included in operating cost
- (198) - (1,038)
Cash-settled share-based expense (34) (154) (107) (634)Less exploration and site restoration costs (234) (160) (826) (708)Other cost and intercompany adjustments 304 1,063 212 1,201 On-mine production cost 9,686 11,725 35,679 42,532 Gold sales (oz) 16,053 15,230 54,801 57,137 On-mine cost per ounce ($/oz) 603 770 651 744
Royalty 1,172 1,408 3,854 5,007 Exploration, remediation and permitting cost 108 196 416 468 Sustaining capital expenditure 93 171 565 760 Administrative expenses 1,686 2,636 5,637 7,997 Silver by-product credit (20) (27) (64) (86)Share-based payment expense included in production cost 34 154 107 634 Share-based payment expense 283 236 689 1,413 All-in sustaining cost 13,042 16,499 46,883 58,725 Gold sales (oz) 16,053 15,230 54,801 57,137 All-in sustaining cost per ounce before ECI ($/oz) 812 1,083 856 1,028 ECI - - (1,930) (4,695)All-in sustaining cost 13,042 16,499 44,953 54,030 Gold sales (oz) 16,053 15,230 54,801 57,137 All-in sustaining cost per ounce after ECI ($/oz) 812 1,083 820 946
Solar expenses 75 28 160 230COVID-19 donations - 274 - 1,322COVID-19 expenses 198 1,038Permitting and exploration expenses 31 251 132 373 Non-sustaining capital expenditure 5,452 10,691 20,030 24,018 Total all-in cost 18,600 27,941 65,275 81,011 Gold sales (oz) 16,053 15,230 54,801 57,137 All-in cost per ounce ($/oz) 1,159 1,835 1,191 1,418 * Restated

29
10.2 Average realised gold price per ounce
“Average realised gold price per ounce” is a non-IFRS measure which, in conjunction with the cost per ounce measures described above, allows stakeholders to assess our performance. The table below reconciles “Average realised gold price per ounce” to the Revenue shown in the financial statements which have been prepared under IFRS.
Reconciliation of Average Realised Gold Price per Ounce($’000’s unless otherwise indicated)
3 months ended
December 31 12 months ended
December 31 2019 2020 2019 2020
Revenue (IFRS) 23,433 28,128 75,826 100,002 Revenues from sales of silver (20) (27) (64) (86)Revenues from sales of gold 23,413 28,101 75,762 99,916 Gold ounces sold (oz) 16,053 15,230 54,801 57,137 Average realised gold price per ounce (US$/oz) 1,458 1,845 1,382 1,749

30
10.3 Adjusted earnings per share
“Adjusted earnings per share” is a non-IFRS measure which management believes assists investors in understanding the Company’s underlying performance. The table below reconciles “adjusted earnings per share” to the Profit/Loss attributable to owners of the Company shown in the financial statements which have been prepared under IFRS.
Reconciliation of Adjusted Earnings per Share (“Adjusted EPS”) to IFRS Profit Attributable to Owners of the Company ($’000’s unless otherwise indicated)
3 months ended
December 31 12 months ended
December 31 *2019 2020 *2019 2020
Profit for the period (IFRS) 3,230 3,796 50,401 25,257 Non-controlling interest share of profit for the period
(840) (823) (8,383) (4,477)
Profit attributable to owners of the Company 2,390 2,973 42,018 20,780 Blanket Mine Employee Trust adjustment (55) (67) (986) (485)Earnings (IFRS) 2,335 2,906 41,032 20,295 Weighted average shares in issue (thousands) 10,742 12,119 10,742 11,704 IFRS EPS (cents) 22 24 382 173 Add back/(deduct) amounts in respect of foreign exchange movements
Realised net foreign exchange (gains)/losses (846) 292 1,648 4,062 - less tax 228 (40) (414) (1,006) - less non-controlling interest 108 (15) (198) (383)Unrealised net foreign exchange (gains) (546) 94 (31,309) (8,369)- less tax 9 89 519 2,158 - less non-controlling interest 98 1 5,000 836
Adjusted IFRS profit excl. foreign exchange 1,386 3,327 16,278 17,593 Weighted average shares in issue (thousands) 10,742 12,119 10,742 11,704 Adjusted IFRS EPS excl. foreign exchange (cents) 13 27 152 150 Add back/(deduct) amounts in respect of:
Reversal of Blanket Mine Employee Trust adjustment
55 67 986 485
Impairment of E&E assets - 2,930 - 2,930 Deferred tax 4,716 3,519 2,460 3,523 Non-controlling interest portion deferred tax and impairment
(768) (914) (477) (900)
Profit on sale of subsidiary (4,409) - (4,409) - Hedge loss 277 145 601 266
Adjusted profit 1,257 9,074 15,439 23,897 Weighted average shares in issue (thousands) 10,742 12,119 10,742 11,704 Adjusted EPS (cents) 12 75 144 204 * Restated
11. RELATED PARTY TRANSACTIONS
There were no related party transactions in the Quarter.
12. CRITICAL ACCOUNTING ESTIMATES
Caledonia's accounting policies are set out in the Consolidated Financial Statements which have been publicly filed on SEDAR at www.sedar.com. In preparing the Consolidated Financial Statements,

31
management is required to make estimates and assumptions that affect the amounts represented in the Consolidated Financial Statements and related disclosures. Use of available information and the application of judgement are inherent in the formation of estimates. Estimates and underlying assumptions are reviewed on an on-going basis. Revisions to accounting estimates are recognised in the period in which the estimates are revised and in any future periods affected. Discussion of recently issued accounting pronouncements is set out in note 4 of the Consolidated Financial Statements.
Information about critical judgements in applying accounting policies that have the most significant effect on the amounts recognised in the Consolidated Financial Statements is included in the following notes:
i) Indigenisation transaction
The directors of Caledonia Holdings Zimbabwe (Private) Limited (“CHZ”), a wholly owned subsidiary of the Company, performed an assessment, using the requirements of IFRS 10: Consolidated Financial Statements (IFRS 10), and concluded that CHZ should continue to consolidate Blanket and accounted for the transaction as follows:
Non-controlling interests (“NCI”) are recognised on the portion of shareholding upon which dividends declared by Blanket accrue unconditionally to equity holders as follows:
(a) 20% of the 16% shareholding of National Indigenisation and Economic Empowerment Fund (“NIEEF”); and
(b) 100% of the 10% shareholding of GCSOT.
This effectively means that NCI is recognised at Blanket at 13.2% of its net assets.
The remaining 80% of the shareholding of NIEEF is recognised as a non-controlling interest to the extent that its attributable share of the net asset value of Blanket exceeds the balance on the facilitation loans including interest. At December 31, 2020 the attributable net asset value did not exceed the balance on the loan account and thus no additional NCI was recognised.
The transaction with Blanket Employee Trust Services (Private) Limited (“BETS”) is accounted for in accordance with IAS 19 Employee Benefits (profit sharing arrangement) as the ownership of the shares does not ultimately pass to the employees. The employees are entitled to participate in 20% of the dividends accruing to the 10% shareholding in Blanket if they are employed at the date of such distribution. To the extent that 80% of the attributable dividends exceeds the balance on BETS’ facilitation loan they will accrue to the employees at the date of such declaration.
The Employee Trust, which owns BETS, and BETS are structured entities which are effectively controlled and consolidated by Blanket. Accordingly, the shares held by BETS are effectively treated as treasury shares in Blanket and no NCI is recognised. ii) Site restoration provisions The site restoration provision has been calculated for the Blanket Mine based on an independent analysis of the rehabilitation costs as performed in 2018. Estimates and assumptions are made when determining the inflationary effect on current restoration costs and the discount rate to be applied in arriving at the present value of the provision. Assumptions, based on the current economic environment, have been made which management believes are a reasonable basis upon which to estimate the future liability. These estimates take account of any material changes to the assumptions that occur when reviewed by management. Estimates are reviewed annually and are based on current regulatory requirements. Significant changes in estimates of contamination, restoration standards and techniques will result in changes to provisions from period to period. Actual rehabilitation costs will ultimately depend on future market prices for the rehabilitation costs which will reflect the market condition at the time the rehabilitation costs are incurred. The final cost of the currently recognized site rehabilitation provisions may be higher or lower than currently provided for. iii) Exploration and evaluation (“E&E”) expenditure The Group makes estimates and assumptions regarding the possible impairment of E&E properties by evaluating whether it is likely that future economic benefits will flow to the Group, which may be based on assumptions about future events or circumstances. Estimates and assumptions made may change if new information becomes available. If information becomes available suggesting that the recovery of
32
expenditures is unlikely, the amount capitalized is written off in profit or loss in the period the new information becomes available. The recoverability of the carrying amounts of exploration and evaluation assets depends upon the availability of sufficient funding to bring the properties into commercial production, the price of the products to be recovered and the undertaking of profitable mining operations. As a result of these uncertainties, the actual amount recovered may vary significantly from the carrying amount. iv) Income taxes
Significant estimates and assumptions are required in determining the provision for income taxes. There are many transactions and calculations undertaken during the ordinary course of business for which the ultimate tax determination is uncertain. Caledonia records its best estimate of the tax liability including any related interest and penalties in the current tax provision. In addition, Caledonia applies judgement in recognizing deferred tax assets relating to tax losses carried forward to the extent that there are sufficient taxable temporary differences (deferred tax liabilities) relating to the same taxation authority and the same taxable entity against which the unused tax losses can be utilized or sufficient estimated taxable income against which the losses can be utilized.
v) Share-based payment transactions
The fair value of the amount payable to employees in respect of share-based awards, which are settled in cash, is recognised as an expense with a corresponding increase in liabilities, over the period over which the employee becomes unconditionally entitled to payment. The liability is re-measured at each reporting date. Any changes in the fair value of the liability are recognised as a personnel expense in profit or loss. Additional information about significant judgements and estimates and the assumptions used to estimate fair value for cash settled share-based payment transactions are disclosed in note 30 to the Consolidated Financial Statements.
vi) Impairment
At each reporting date, Caledonia determines if impairment indicators exist and, if present, performs an impairment review of the non-financial assets held in Caledonia. The exercise is subject to various judgemental decisions and estimates. Financial assets are also reviewed regularly for impairment.
vii) Depreciation
Depreciation on mine development, infrastructure and other assets in the production phase is computed on the units-of-production method over the life-of-mine based on the estimated quantities of reserves (proven and probable) and resources (measured, indicated and inferred), which are planned to be extracted in the future from known mineral deposits. Where items have a shorter useful life than the life-of-mine, the mine development, infrastructure and other assets are depreciated over their useful life. Confidence in the existence, commercial viability and economical recovery of reserves and resources included in the life-of-mine plan may be based on historical experience and available geological information. This is in addition to the drilling results obtained by the Group and management’s knowledge of the geological setting of the surrounding areas, which would enable simulations and extrapolations to be done with a sufficient degree of accuracy. In instances where management can demonstrate the economic recovery of resources with a high level of confidence, such additional resources are included in the calculation of depreciation.
viii) Mineral reserves and resources
Mineral reserves and resources are estimates of the amount of product that can be economically and legally extracted. In order to calculate the reserves and resources, estimates and assumptions are required about a range of geological, technical and economic factors, including but not limited to quantities, grades, production techniques, recovery rates, production costs, transport costs, commodity prices and exchange rates. Estimating the quantity and grade of mineral reserves and resources requires the size, shape and depth of orebodies to be determined by analysing geological data such as the logging and assaying of drill samples. This process may require complex and difficult geological assumptions and calculations to interpret the data. Estimates of mineral reserves and resources may change due to the change in economic assumptions used to

33
estimate mineral reserves and resources and due to additional geological data becoming available during operations.
The Group estimates its reserves (proven and probable) and resources (measured, indicated and inferred) based on information compiled by a Qualified Person in terms of the Canadian National Instrument 43-101 – Standards of Disclosure for Mineral Projects (“NI 43-101”) relating to geological and technical data of the size, depth, shape and grade of the ore body and suitable production techniques and recovery rates. Such an analysis requires geological and engineering assumptions to interpret the data. These assumptions include:
correlation between drill-holes intersections where multiple reefs are intersected; continuity of mineralisation between drill-hole intersections within recognised reefs; and appropriateness of the planned mining methods.
The Group estimates and reports reserves and resources in accordance with NI 43-101 and the Canadian Institute of Mining, Metallurgy and Petroleum (the “CIM”) - CIM Definition Standards for Mineral Resources and Mineral Reserves. Complying with the CIM code, NI 43-101 requires the use of reasonable assumptions to calculate the recoverable resources. These assumptions include:
the gold price based on current market price and the Group’s assessment of future prices; estimated future on-mine costs, sustaining and non-sustaining capital expenditures; cut-off grade; dimensions and extent, determined both from drilling and mine development, of ore bodies; and planned future production from measured, indicated and inferred resources.
Changes in reported reserves and resources may affect the Group’s financial results and position in several ways, including the following:
asset carrying values may be affected due to changes in the estimated cash flows; depreciation and amortisation charges to profit or loss may change as these are calculated on the unit-
of-production method or where useful lives of an asset change; and decommissioning, site restoration and environmental provisions may change in ore reserves and
resources which may affect expectations about the timing or cost of these activities.
13. FINANCIAL INSTRUMENTS
i) Commodity risk
Caledonia is exposed to fluctuations in the price of gold because Blanket produces and sells gold doré and receives the prevailing spot price for the gold contained therein. Caledonia currently has no arrangements to mitigate commodity price risk but continues to assess the requirement for any hedging in the context of, inter alia, the prevailing gold price and Blanket’s production and capital expenditure programme.
ii) Credit risk
The carrying amount of financial assets as disclosed in the statements of financial position and related notes represents the maximum credit exposure. The trade receivable relates to gold bullion sold before the end of the Quarter, VAT receivables and deferred consideration due in respect of the sale of Eersteling. The amount due in respect of bullion sales was settled in January 2021. The VAT receivables were within the agreed terms of such refunds.
iii) Impairment losses
None of the trade and other receivables is past due at the period-end date other than a tranche of deferred consideration in respect of the sale of Eersteling in respect of which discussions continue regarding the rescheduling of the amount due.

34
iv) Liquidity risk
All trade payables and the bank overdraft have maturity dates that are expected to mature in under 6 months. The term loans are repayable as set out in section 7.
v) Currency risk
A proportion of Caledonia’s assets, financial instruments and transactions are denominated in currencies other than the US Dollar. The financial results and financial position of Caledonia are reported in US Dollars in the Consolidated Financial Statements.
The fluctuation of the US Dollar in relation to other currencies will consequently have an impact upon the profitability of Caledonia and may also affect the value of Caledonia’s assets and liabilities and the amount of shareholders’ equity.
During the second quarter of 2020, Caledonia purchased a gold ETF using a portion of the cash that is held by CMSA in South African Rands to protect against further devaluation of the South African Rand.
As discussed in section 4.9 of this MD&A, the RTGS$ is subject to variations in the exchange rate against the US Dollar. This may result in Blanket’s assets, liabilities and transactions that are denominated in RTGS$ being subject to further fluctuations in the exchange rate between RTGS$ and US Dollars. In addition, the Company may be subject to fluctuations in the exchange rate between the South African Rand and the US Dollar in respect of cash that is held in Rands in South Africa.
vi) Interest rate risk
Interest rate risk is the risk borne by an interest-bearing asset or liability due to fluctuations in interest rates. Unless otherwise noted, it is the opinion of management that Caledonia is not exposed to significant interest rate risk as it has limited debt financing. Caledonia’s cash and cash equivalents include highly liquid investments that earn interest at market rates. Caledonia manages its interest rate risk by endeavouring to maximize the interest income earned on excess funds while maintaining the liquidity necessary to conduct operations on a day-to-day basis. Caledonia’s policy focuses on preservation of capital and limits the investing of excess funds to liquid term deposits in high credit quality financial institutions.
14. DIVIDEND POLICY
Following the share consolidation on June 26, 2017, the Company announced on July 4, 2017 an increased quarterly dividend of 6.875 United States cents which has been paid at the end of July, October, January and April thereafter. The dividend of 6.875 US cents per share effectively maintained the dividend at the previous level of 1.375 United States cents per share, after adjusting for the effect of the consolidation.
On January 3, 2020, the Company announced a 9.1% increase in the quarterly dividend from 6.875 cents to 7.5 cents per share.
On April 1, 2020, the Company announced the deferral of the quarterly dividend that would ordinarily have been declared and paid in April 2020 due to the uncertainty surrounding the COVID-19 pandemic. On April 29, 2020, the Company announced this dividend would be paid at the end of May 2020 at a rate of 7.5 cents per share.
On June 29, 2020, the Company announced a 13% increase in the quarterly dividend from 7.5 cents to 8.5 cents per share.
On October 1, 2020, the Company announced an 18% increase in the quarterly dividend from 8.5 cents to 10 cents per share.
On January 4, 2021, the Company announced a 10% increase in the quarterly dividend from 10 cents to 11 cents per share. This fourth increase within a 15-month period represents a cumulative 60% increase in the quarterly dividend since October 2019.The board will consider the continuation of the dividend and any future increases in the dividend as appropriate in line with its prudent approach to risk management including: Blanket maintaining a reasonable level of production; receiving payment in full and on-time for all gold sales; being able to make the necessary local and international payments and being able to replenish its supplies of consumables and other items.

35
15. MANAGEMENT AND BOARD
In January 2020 Janet Hobkirk joined the Group as Group Mineral Resource Manager. Ms Hobkirk is a qualified geologist with broad operational experience across the mining value chain from resource delineation to metal accounting. She holds a BSc (Hons) in Geology and Engineering Geology from the University of Natal. Prior to joining Caledonia Janet worked for Harmony Gold Mining Company and Anglo American Platinum. Until 2017 Janet managed the 240-member mineral resource management team at the Amandelbult Complex which extracted 7 million tonnes per annum from a complex infrastructure of vertical and decline shafts and from small surface pits.
In March 2020 Pieter Greyling joined the Group as a Rock Engineer to enhance safety at Blanket’s undergound operations. Mr Greyling has 34 years of experience in the mining industry. Prior to joining the Group, he was in charge of the Rock Engineering department at Goldfields and was Group Rock Engineering Manager for Anglogold at their West Wits operations.
In October 2020 Camilla Horsfall joined the Company as Vice President, Investor Relations. Miss Horsfall was previously a Partner at Blytheweigh, a London-based financial public relations and investor relations consultancy, of which Caledonia remains a client.
In January 2021 Mrs Leonet Steyn CA (SA), CISA, joined the Group as Internal Auditor. Mrs Steyn was previously a senior manager in the IT Risk Assurance division at PriceWaterhouseCoopers in Johannesburg.
In February 2021 the Company announced that Mrs Geralda Wildschutt had joined the board of directors of the Company as an independent non-executive director with immediate effect. Mrs Wildschutt has over 25 years’ experience working in social development and stakeholder management in the fields of social performance, community relations in mining operations, financial services and industry bodies focused on responsible mining. She has been a consultant to Anglo American, Gold Fields, Ivanhoe Mines and South32 on a range of social performance areas including social investment, ESG compliance, human rights and social impact assessments, strengthening of community trusts, capacity building and systems development. Mrs Wildschutt hold a Masters’ Degree in Psychology from the University of Cape Town, an MBA from the Business School of the Netherlands and a post-graduate Certificate in Cross-sector Partnerships from Cambridge University.
16. SECURITIES OUTSTANDING
At March 22, 2021, being the last day practicable prior to the publication of this MD&A, Caledonia had 12,118,823 common shares issued and outstanding options to purchase common shares (“Options”) as follows:
Number of Options Exercise Price Expiry Date Canadian $ 18,000 11.5 13-Oct-21 10,000 9.3 25-Aug-24 28,000
The Plan allows that the number of shares reserved for issuance to participants under the Plan, together with shares reserved for issue under any other share compensation arrangements of the Company, shall not exceed the number which represents 10% of the issued and outstanding shares from time to time. Accordingly, Caledonia could grant Options on a further 1,183,882 shares at March 22, 2021 on the assumption that all outstanding LTIPs are settled in cash, at the request of the LTIP holders.
17. RISK ANALYSIS
The business of Caledonia contains significant risk due to the nature of mining, exploration and development activities. Risks such as interest rate, foreign exchange rates and credit risks are considered in notes 7 and 30 to the Consolidated Financial Statements. Caledonia’s business contains significant additional risks due

36
to the jurisdictions in which it operates and the nature of mining, exploration and development. Included in the risk factors below are details of how management seeks to mitigate the risks where this is possible.
COVID-19 pandemic: The COVID-19 pandemic, and measures that may be taken by governments and other parties to counter the spread of the virus may, inter alia, have the following effects on the Company: its workforce may fall ill which could affect operations; restrictions on transport and travel may impede the Company’s ability to procure consumables, equipment and services which may affect operations and progress on capital projects; the banking system may not operate effectively which may impede the Company’s ability to effect domestic and international payments; it may be difficult to secure a route to market for the gold doré produced by Blanket. In response to these risks, management has: introduced measures to safeguard its employees from the virus; maximised the inventory of consumable stock; engaged closely with its customer, Fidelity, regarding access to refiners and the eventual route to market for Blanket’s production; and management regularly reviews its financial status and projections. However, it must be recognised that the duration and effects of the COVID-19 pandemic are uncertain and therefore not capable of accurate forecasting.
Liquidity risk: The Company aims to generate capital to be able to continue to invest in properties and projects without raising further third-party financing. Caledonia currently has sufficient cash resources and continues to generate sufficient cash to cover all its anticipated investment needs.
Availability of foreign currency: The Company needs access to foreign currency in Zimbabwe so that it can pay for imported goods and equipment and remit funds to Group companies outside Zimbabwe. As discussed in section 4.9, at prevailing gold prices and the current rate of production the Company has access to sufficient foreign currency to continue normal mining operations, to fully implement the investment plan as scheduled and allow Caledonia to remit dividends and loan repayments from Zimbabwe. No assurance can be given that sufficient foreign currency will continue to be available.
Exploration risk: The Company needs to identify new resources to replace ore which has been depleted by mining activities and to commence new projects. No assurance can be given that exploration will be successful in identifying sufficient mineral resources of an adequate grade and suitable metallurgical characteristics that are suitable for further development or production.
Development risk: The Company is engaged in the implementation of the Central Shaft project as set out in section 4.7 of this MD&A. Construction and development of projects are subject to numerous risks including: obtaining equipment, permits and services; changes in regulations; currency rate changes; labour shortages; fluctuations in metal prices and the loss of community support. There can be no assurance that construction will commence or continue in accordance with the current expectations or at all.
Production estimates: Estimates for future production are based on mining plans and are subject to change. Production estimates are subject to risk and no assurance can be given that future production estimates will be achieved. Actual production may vary from estimated production for a variety of reasons including un-anticipated variations in grades, mined tonnages and geological conditions, accident and equipment breakdown, changes in metal prices and the cost and supply of inputs and changes to government regulations.
Mineral rights: The Company’s existing mining lease, claims, licences and permits are in good standing. The Company must pay fees etc. to maintain its lease, claims and licences. No assurance can be given that the Company will be able to make payments by the required date or will meet development and production schedules that are required to protect its lease, claims and licences.
Metal prices: The Company’s operations and exploration and development projects are heavily influenced by the price of gold, which is particularly subject to fluctuation. Caledonia had hedging arrangements over 4,600 ounces of gold per month for the period from January 1, 2020 to June 30, 2020 which guaranteed that Caledonia would receive a minimum price of $1,400 per ounce in respect of the ounces hedged. The Company currently has no hedging arrangements in place. Management regularly reviews future cash flow forecasts in the context of the prevailing gold price and likely downside scenarios for future gold prices.
Increasing input costs: Mining companies generally have experienced higher costs of steel, reagents, labour and electricity and from local and national government for levies, fees, royalties and other direct

37
and indirect taxes. Blanket’s planned growth should allow the fixed cost component to be absorbed over increased production, thereby helping to alleviate somewhat the effect of any further price increases.
Illegal mining: In previous years there have been incidences of illegal mining activities on properties controlled by Blanket which resulted in increased security costs and an increased risk of theft and damage to equipment. Blanket has received adequate support and assistance from the Zimbabwean police in investigating such cases. Those properties that are at most risk from such activity have been sold.
Electricity supply: Zimbabwe produces and imports less electricity than it requires and has insufficient funds to adequately maintain or upgrade its distribution infrastructure. This has resulted in frequent interruptions to the power supply at Blanket Mine. Blanket has addressed the issue of interrupted power supply by installing stand-by generators and entering an arrangement with the state-owned electricity company to receive ring-fenced imported power in return for paying a US Dollar denominated tariff. More recently, production at Blanket has been adversely affected by the instability of the incoming electricity supply. The Company’s board has resolved to install a solar plant which will provide some of Blanket’s power requirements.
Water supply: Blanket uses water in the metallurgical process, most of which is obtained from a nearby dam. Blanket is situated in a semi-arid area and rainfall typically occurs only in the period November to February. The most recent rainy season has been better than average and management believes there is enough water in the Blanket dam to maintain normal operations until the next rainy season.
Succession planning: The limited availability of mining and other technical skills and experience in Zimbabwe and the difficulty of attracting appropriately skilled employees to Zimbabwe creates a risk that appropriate skills may not be available if, for whatever reason, the current skills base at the Blanket Mine is depleted. The Caledonia and Blanket management teams have been augmented so that, if required, it could provide appropriate support to Blanket if this is required.
Country risk: The commercial environment in which the Company operates is unpredictable. Potential risks may arise from: unforeseen changes in the legal and regulatory framework which means that laws may change, may not be enforced, or judgements may not be upheld; restrictions on the movement of currency and the availability of foreign currency to make payments from Zimbabwe; risks relating to inflationary pressures as mentioned in section 4.9; risks relating to possible corruption, bribery, civil disorder, expropriation or nationalisation; risks relating to restrictions on access to assets and the risk that the Zimbabwe Government is unable to pay its liabilities to Blanket. Management believes that it has minimised such risks by complying fully with all relevant legislation, by obtaining all relevant regulatory permissions and approvals and by regular and proactive engagement with the relevant authorities.
Gold marketing arrangements: In terms of regulations introduced by the Zimbabwean Ministry of Finance in January 2014, all gold produced in Zimbabwe must be sold to Fidelity, a company which is controlled by the Zimbabwean authorities. Accordingly, all of Blanket’s production has been sold to Fidelity. Blanket has received all payments due from Fidelity in full and on time. However, the requirement to sell to Fidelity increases Blanket’s credit risk because Fidelity failed to pay Blanket in the period of hyper-inflation which existed prior to the adoption of the multi-currency system by Zimbabwe in early 2009.
18. FORWARD LOOKING STATEMENTS
Information and statements contained in this MD&A that are not historical facts are “forward-looking information” within the meaning of applicable securities legislation that involve risks and uncertainties relating, but not limited to, Caledonia’s current expectations, intentions, plans, and beliefs. Forward-looking information can often be identified by forward-looking words such as “anticipate”, “believe”, “expect”, “goal”, “plan”, “target”, “intend”, “estimate”, “could”, “should”, “may” and “will” or the negative of these terms or similar words suggesting future outcomes, or other expectations, beliefs, plans, objectives, assumptions, intentions or statements about future events or performance. Examples of forward-looking information in this MD&A include: implementation schedules for, and other uncertainties inherent in, the

38
Central Shaft project; production guidance; estimates of future/targeted production rates; planned mill capacity increases; estimates of future metallurgical recovery rates and the ability to maintain high metallurgical recovery rates; timing of commencement of operations; plans and timing regarding further exploration, drilling and development; the prospective nature of exploration and development targets; the ability to upgrade and convert mineral resources to mineral reserves; capital and operating costs; our intentions with respect to financial position and third party financing; and future dividend payments. This forward-looking information is based, in part, on assumptions and factors that may change or prove to be incorrect, thus causing actual results, performance or achievements to be materially different from those expressed or implied by forward-looking information. Such factors and assumptions include, but are not limited to: failure to establish estimated resources and reserves, the grade and recovery of ore which is mined varying from estimates, success of future exploration and drilling programs, reliability of drilling, sampling and assay data, assumptions regarding the representativeness of mineralization being inaccurate, success of planned metallurgical test-work, capital and operating costs varying significantly from estimates, delays in obtaining or failures to obtain required governmental, environmental or other project approvals, changes in government regulations, legislation and rates of taxation, inflation, changes in exchange rates, fluctuations in commodity prices, delays in the development of projects and other factors.
Security holders, potential security holders and prospective investors should be aware that these statements are subject to known and unknown risks, uncertainties and other factors that could cause actual results to differ materially from those suggested by the forward-looking statements. Such factors include, but are not limited to: risks relating to estimates of mineral reserves and mineral resources proving to be inaccurate, fluctuations in gold price and payment terms for gold sold to Fidelity, risks and hazards associated with the business of mineral exploration, development and mining (including environmental hazards, industrial accidents, unusual or unexpected geological or structural formations, pressures, power outages, fire, explosions, landslides, cave-ins and flooding), risks relating to the credit worthiness or financial condition of suppliers, refiners and other parties with whom the Company does business, inadequate insurance, or inability to obtain insurance, to cover these risks and hazards, employee relations, relationships with and claims by local communities and indigenous populations, political risk, risks related to natural disasters, terrorism, civil unrest, public health concerns (including health epidemics or outbreaks of communicable diseases such as the coronavirus (COVID-19)), availability and increasing costs associated with mining inputs and labour, the speculative nature of mineral exploration and development, including the risks of obtaining or maintaining necessary licenses and permits, diminishing quantities or grades of mineral reserves as mining occurs, global financial condition, the actual results of current exploration activities, changes to conclusions of economic evaluations, and changes in project parameters to deal with un-anticipated economic or other factors, risks of increased capital and operating costs, environmental, safety or regulatory risks, expropriation, the Company’s title to properties including ownership thereof, increased competition in the mining industry for properties, equipment, qualified personnel and their costs, risks relating to the uncertainty of timing of events including targeted production rate increase and currency fluctuations. Security holders, potential security holders and prospective investors are cautioned not to place undue reliance on forward-looking information. By its nature, forward-looking information involves numerous assumptions, inherent risks and uncertainties, both general and specific, that contribute to the possibility that the predictions, forecasts, projections and various future events will not occur. Caledonia reviews forward-looking information for the purposes of preparing each MD&A; however, Caledonia undertakes no obligation to update publicly or otherwise revise any forward-looking information whether as a result of new information, future events or other such factors which affect this information, except as required by law.
19. CONTROLS
The Company has established and maintains disclosure controls and procedures (“DC&P”) designed to provide reasonable assurance that material information relating to the Company is made known to the Chief Executive Officer and the Chief Financial Officer by others, particularly during the period in which annual filings are being prepared, and that information required to be disclosed in the Company’s annual filings, interim filings or other reports filed or submitted by it under securities legislation is recorded, processed, summarized and reported within the time periods specified by such securities legislation.

39
The Company’s management, along with the participation of the Chief Executive Officer and the Chief Financial Officer, have evaluated the effectiveness of the Company’s DC&P as of December 31, 2020. Based on that evaluation, the Chief Executive Officer and the Chief Financial Officer have concluded that, at December 31, 2020, the Company’s DC&P were effective.
The Company also maintains a system of internal controls over financial reporting (“ICFR”) designed under the supervision of the Company’s Chief Executive Officer and Chief Financial Officer to provide reasonable assurance regarding the reliability of financial reporting and the preparation of financial statements for external purposes in accordance with IFRS; however, due to inherent limitations, ICFR may not prevent or detect all misstatements and fraud. The board of directors approves the financial statements and ensures that management discharges its financial responsibilities. The Audit Committee, which is composed of independent directors, meets periodically with management and auditors to review financial reporting and control matters and reviews the financial statements and recommends them for approval to the board of directors.
The Company’s management, including the Chief Executive Officer and the Chief Financial Officer, is responsible for establishing and maintaining adequate ICFR and evaluating the effectiveness of the Company’s ICFR as at each fiscal year end. Management has used the 2013 Internal Control–Integrated Framework from the Committee of Sponsoring Organizations of the Treadway Commission (the “COSO”) to evaluate the effectiveness of the Company’s ICFR at December 31, 2020. Based on this evaluation, the Chief Executive Officer and the Chief Financial Officer have concluded that at December 31, 2020, the Company’s ICFR was effective.
There have been no changes in the Company’s ICFR during the period ended December 31, 2020 that have materially affected, or are reasonably likely to materially affect, the Company’s ICFR. In January 2021 Leonet Steyn joined the Group as Internal Auditor; this is expected to enhance the Company’s ICFR for future reporting periods.
20. QUALIFIED PERSON
Mr. Dana Roets (B Eng (Min), MBA, Pr..Eng, FSAIMM, AMMSA) is the Company’s qualified person as defined by Canada’s National Instrument 43-101. Mr. Roets is responsible for the technical information provided in this MD&A except where otherwise stated. Mr. Roets has reviewed the scientific and technical information included in this document and has approved the disclosure of this information for the purposes of this MD&A.