calhoun county groundwater conservation district ... county groundwater conservation district...
TRANSCRIPT
Calhoun County Groundwater Conservation District
Management Plan
Calhoun County Groundwater Conservation District Board of Directors Management Plan
Original Adoption: May 31, 2017
Texas Water Development Board Administrative Management Plan Original Approval:
Management Plan of the District - 2017 - Adopted.docx Page 2
Table of Contents DISTRICT MISSION ......................................................................................................... 4PURPOSE OF THE MANAGEMENT PLAN ..................................................................... 5DISTRICT INFORMATION ............................................................................................... 6
Creation ......................................................................................................................... 6Directors ........................................................................................................................ 6Authority ........................................................................................................................ 6Location and Extent ....................................................................................................... 6
GROUNDWATER RESOURCES OF CALHOUN COUNTY ............................................ 7STATEMENT OF GUIDING PRINCIPLES ....................................................................... 8CRITERIA FOR PLAN APPROVAL ................................................................................. 9
Planning Horizon ........................................................................................................... 9Notice and Hearing Related to Plan Adoption - TWC §36.1071(a) ............................... 9Coordination with Regional Surface Water Management Entities - TWC §36.1071(a) . 9Calhoun County Groundwater Conservation District Board of Director Resolution Adopting Management Plan .......................................................................................... 9
ESTIMATES OF TECHNICAL INFORMATION REQUIRED BY §36.1071 OF THE TEXAS WATER CODE AND RULE 356.52 OF TITLE 31 OF THE TEXAS ADMINISTRATIVE CODE .............................................................................................. 10
Estimate of Modeled Available Groundwater in the DISTRICT based on Desired Future Conditions – TWC §36.1071(e)(3)(A) and 31 TAC 356.52(a)(5)(A) ................ 10Estimate of amount of groundwater being used within the district on an annual basis – TWC §36.1071(e)(3)(B) and 31 TAC 356.52(a)(5)(B) ................................................. 12Estimate of annual amount of recharge from precipitation to the groundwater resources within the district – TWC §36.1071(e)(3)(C) and 31 TAC 356.52(a)(5)(C) . 12Estimate for each aquifer, annual volume of water that discharges from the aquifer to springs and any surface water bodies, including lakes, streams, and rivers – TWC §36.1071(e)(3)(D) and 31 TAC 356.52(a)(5)(D) .......................................................... 12Estimate of annual volume of flow into and out of the district within each aquifer and between aquifers in the district – TWC §36.1071(e)(3)(E) and 31 TAC 356.52(a)(5)(E) ..................................................................................................................................... 12Estimate of projected surface water supply in the district according to the most recently adopted state water plan – TWC §36.1071(e)(3)(F) and 31 TAC 356.52(a)(5)(F) ............................................................................................................ 12Estimate of projected total demand for water in the district according to the most recently adopted state water plan – TWC §36.1071(e)(3)(G) and 31 TAC 356.52(a)(5)(G) ............................................................................................................ 12
CONSIDER THE WATER SUPPLY NEEDS AND WATER MANAGEMENT STRATEGIES INCLUDED IN THE ADOPTED STATE WATER PLAN – TWC §36.1071(e)(4) ................................................................................................................ 13DETAILS ON THE DISTRICT MANAGEMENT OF GROUNDWATER .......................... 14
Management Plan of the District - 2017 - Adopted.docx Page 3
ACTIONS, PROCEDURES, PERFORMANCE AND AVOIDANCE FOR PLAN IMPLEMENTATION – TWC §36.1071(e)(2) .................................................................. 17METHODOLOGY FOR TRACKING DISTRICT PROGRESS IN ACHIEVING MANAGEMENT GOALS – 31TAC 356.52(a)(4) ............................................................ 17GOALS, MANAGEMENT OBJECTIVES and PERFORMANCE STANDARDS ............. 18
Providing the most efficient use of groundwater – TWC §36.1071(a)(1) and 31 TAC 356.52(a)(1)(A) ............................................................................................................ 18Controlling and preventing waste of groundwater – TWC §36.1071(a)(2) and 31 TAC 356.52(a)(1)(B) ............................................................................................................ 18Controlling and preventing subsidence – TWC §36.1071(a)(3) and 31 TAC 356.52(a)(1)(C) ............................................................................................................ 18Addressing conjunctive surface water management issues – TWC §36.1071(a)(4) and 31 TAC 356.52(a)(1)(D) .............................................................................................. 18Addressing natural resource issues which impact the use and availability of groundwater, and which are impacted by the use of groundwater – TWC §36.1071(a)(5) and 31 TAC §356.52(a)(1)(E) ............................................................. 19Addressing drought conditions – TWC §36.1071(a)(6) and 31 TAC 356.52(a)(1)(F) . 19Addressing conservation, recharge enhancement, rainwater harvesting, precipitation enhancement, or brush control, where appropriate and cost-effective – TWC §36.1071(a)(7) and 31 TAC 356.52(a)(1)(G) .............................................................. 19Addressing the desired future conditions adopted by the district under Section 36.108 – TWC §36.1071(a)(8) and 31 TAC 356.52(a)(1)(H) .................................................. 20
List of Appendices .......................................................................................................... 21
Management Plan of the District - Proposed Page 4
DISTRICT MISSION
The mission of the Calhoun County Groundwater Conservation District (DISTRICT) is to develop sound water conservation and management strategies designed to conserve, preserve, protect, and prevent waste of groundwater resources for long-term sustainability within Calhoun County for the benefit of Calhoun County's landowners, citizens, economy, and environment. The DISTRICT will implement these strategies through the acquisition and dissemination of hydrogeological information, the development of programs and incentives to conserve and protect groundwater resources, and the adoption and enforcement of fair and appropriate rules governing the production and protection of the groundwater resources within Calhoun County.
Management Plan of the District - Proposed Page 5
PURPOSE OF THE MANAGEMENT PLAN
Senate Bill 1, enacted by the 75th Texas Legislature in 1997, and Senate Bill 2, enacted by the 77th Texas Legislature in 2001, established a comprehensive statewide water resource planning process and the actions necessary for groundwater conservation districts to manage and conserve the groundwater resources of the state of Texas. These bills required all groundwater conservation districts to develop a management plan which defines the groundwater needs and groundwater supplies within each district and the goals each district has set to achieve its mission. In addition, the 79th Texas Legislature enacted House Bill 1763 in 2005 that requires joint planning among districts that are in the same groundwater management area. These districts must jointly agree upon and establish the desired future conditions of the aquifers within their respective groundwater management areas. Through this process, the groundwater conservation districts will submit the desired future conditions to the executive administrator of the Texas Water Development Board who, in turn, will provide each district within the groundwater management area with the amount of modeled available groundwater within each district. The modeled available groundwater will be based on the desired future conditions jointly established for each aquifer within the groundwater management area. Technical information, such as the desired future conditions within the DISTRICT’S jurisdiction and the amount of modeled available groundwater from such aquifers is required by statute to be included in the DISTRICT’s management plan and will guide the DISTRICT’s regulatory and management policies. This management plan is intended to satisfy the requirements of Senate Bill 1, Senate Bill 2, House Bill 1763, the statutory requirements of Chapter 36 of the Texas Water Code, and the rules and requirements of the Texas Water Development Board.

Management Plan of the District - Proposed Page 6
DISTRICT INFORMATION
Creation
The DISTRICT was created by Senate Bill 1290, 82nd Legislature and continued by Senate Bill 1835, 83rd Legislature, and codified as Chapter 8860, Special District and Local Laws Code. The citizens of Calhoun County through a confirmation election held on November 4, 2014 ratified the DISTRICT. The boundaries of the District are conterminous with those of Calhoun County, Texas. The DISTRICT was formed to protect, conserve, and prevent waste of the groundwater resources beneath the area of Calhoun County. To manage the groundwater resources under its jurisdiction, the DISTRICT is charged with the rights and responsibilities specified in its enabling legislation; the provisions of Chapter 36 of the Texas Water Code; this Management Plan, and the District Rules.
Directors
The Calhoun County Groundwater Conservation District Board of Directors consists of five members. These five directors are elected by the voters of Calhoun County and serve a four-year term. The DISTRICT observes the same four precincts as the Calhoun County Commissioners' with one at-large position. Director terms are staggered on a two-year election interval in even numbered years.
Authority
The DISTRICT has the rights and responsibilities provided in Chapter 36 of the Texas Water Code and Chapter 356 of Title 31 of the Texas Administrative Code. The DISTRICT has the authority to undertake hydrogeological studies, adopt a management plan, provide for the permitting of certain water wells, and implement programs to achieve statutory requirements. The DISTRICT has rule-making authority to implement its policies and procedures to manage the groundwater resources of Calhoun County.
Location and Extent
The boundaries of the DISTRICT are the same as Calhoun County. This area encompasses approximately 1,032 square miles. The District is bounded by Refugio County, Victoria County, Jackson County, and Matagorda County.

Management Plan of the District - Proposed Page 7
GROUNDWATER RESOURCES OF CALHOUN COUNTY
Depositions from sediment-laden rivers, currents from the Gulf of Mexico, and storm waves have influenced the geologic formations in Calhoun County. The fluctuation of the coastline over geologic eons contributed to the deposition of sediments within the Calhoun County as well. The geologic formations in the Calhoun County according to their depositional age are summarized in Figure 1. The Gulf Coast Aquifer underlies Calhoun County. Figure 1: Geologic and Hydrogeological Units of the Gulf Coast Aquifer in Calhoun County.
Stratigraphic Unit Hydrogeologic Unit Alluvium
Chicot Aquifer
Beaumont Clay Montgomery Formation Lissie
Formation Bentley Formation
Willis Sand Goliad Sand Evangeline Aquifer
Fleming Formation Burkeville Confining Unit Oakville Sandstone Jasper Aquifer Catahoula Sandstone (Tuff)
The Gulf Coast Aquifer System is conceptualized to comprise of four distinct aquifer components: Chicot, Evangeline, Burkeville Confining Unit and the Jasper aquifer (Baker, 1979). These aquifer components are included within the Central Gulf Coast Groundwater Availability Model developed by the Texas Water Development Board (Chowdhury and Mace, 2004). The Chicot Aquifer is utilized the most within Calhoun County. The Chicot Aquifer outcrops across the entire county. The thickness of the Chicot aquifer ranges between approximately 500 feet to 1,200 feet in Calhoun County. The thickness of the Evangeline aquifer ranges between approximately 1,100 feet to 1,600 feet in Calhoun County. The Chicot and Evangeline aquifer consist of interbedded sands, silts and clays. The sand content is higher in the Evangeline aquifer compared to the Chicot aquifer. The water quality in the aquifer generally deteriorates along the coast.
Management Plan of the District - Proposed Page 8
STATEMENT OF GUIDING PRINCIPLES
The DISTRICT recognizes that the groundwater resources of Calhoun County and the region are of vital importance to the many users who are dependent on these valuable resources. In addition, the DISTRICT recognizes that the landowners have an ownership right in the groundwater resources associated with their properties and are the primary stewards of the groundwater resources associated with their properties. The DISTRICT will work with interested parties, especially landowners, in Calhoun County to conserve, preserve, protect, and prevent waste of this most valuable resource, for the benefit of the landowners, the public, the local economy, and the environment. The DISTRICT’s management plan is intended to serve as a tool to focus the thoughts and actions of those given the responsibility for the execution of the DISTRICT’s activities as well as to provide information to the staff of the DISTRICT, landowners, and others responsible for the execution of, or compliance with, the DISTRICT’s policies and rules. The DISTRICT will carry out its programs and responsibilities in implementing this management plan in a prudent and cost effective manner. The DISTRICT, with public input, will adopt and enforce rules necessary to implement this management plan.

Management Plan of the District - Proposed Page 9
CRITERIA FOR PLAN APPROVAL
Planning Horizon
The time period for this plan is 10 years from the date of approval by the Texas Water Development Board. This plan will be reviewed within five years as required by §36.1072(e) of the Texas Water Code. The DISTRICT will consider the necessity to amend the plan and re-adopt this management plan with or without amendments as required by §36.1072(e) of the Texas Water Code. This management plan will remain in effect until replaced by a revised management plan approved by the Texas Water Development Board.
Notice and Hearing Related to Plan Adoption - TWC §36.1071(a)
Public notices documenting that this plan was considered and adopted following appropriate public hearings are included in Appendix D.
Coordination with Regional Surface Water Management Entities - TWC §36.1071(a)
Letters transmitting this plan to the surface water management entities of the Calhoun County region for coordination purposes are included in Appendix E.
Calhoun County Groundwater Conservation District Board of Director Resolution Adopting Management Plan
A copy of the DISTRICT’s resolution adopting this plan is included in Appendix F.

Management Plan of the District - Proposed Page 10
ESTIMATES OF TECHNICAL INFORMATION REQUIRED BY §36.1071 OF THE TEXAS WATER CODE AND RULE 356.52 OF TITLE 31 OF THE TEXAS ADMINISTRATIVE CODE
Estimate of Modeled Available Groundwater in the DISTRICT based on Desired Future Conditions – TWC §36.1071(e)(3)(A) and 31 TAC 356.52(a)(5)(A)
Modeled available groundwater is defined in §36.001 of the Texas Water Code as "the amount of water that the executive administrator determines may be produced on an average annual basis to achieve a desired future condition established under Section 36.108." Desired future condition is defined in §36.001 of the Texas Water Code as “a quantitative description, adopted in accordance with §36.108 of the Texas Water Code, of the desired condition of the groundwater resources in a management area at one or more specified future times.” The desired future condition of an aquifer may only be determined through joint planning with other groundwater conservation districts in the same groundwater management area as required by the 79th Legislature with the passage of House Bill 1763 into law. The DISTRICT is located in Groundwater Management Area 15. The groundwater conservation districts of Groundwater Management Area 15 completed the second-round of joint planning process to determine the desired future condition of the aquifers within the groundwater management area. District representatives of Groundwater Management Area 15 adopted, by resolution, the desired future condition for Gulf Coast Aquifer within Groundwater Management Area 15 on April 29, 2016. The administrator of Groundwater Management Area 15 submitted the adopted desired future conditions and explanatory report for Groundwater Management Area 15 on June 23, 2016 to Texas Water Development Board. The Texas Water Development Board designated the Groundwater Management Area 15 Explanatory Report administratively complete on October 20, 2016. The Texas Water Development Board provided the Modeled Available Groundwater estimates for Groundwater Management Area 15 to district representatives on March 22, 2017. The desired future condition for the entire area is stated as follows: “Drawdown of the Gulf Coast Aquifer System shall not exceed an average of 13 feet in December 2069 from estimated year 2000 conditions.” The desired future condition for Calhoun County is stated as follows: “Drawdown of the Gulf Coast Aquifer System shall not exceed an average of 5 feet in December 2069 from estimated year 2000 conditions.” The Texas Water Development Board reported the modeled available groundwater for Groundwater Management Area 15 based on the desired future condition in GAM Run 16-025 MAG which is incorporated into this management plan as Appendix C. The
Management Plan of the District - Proposed Page 11
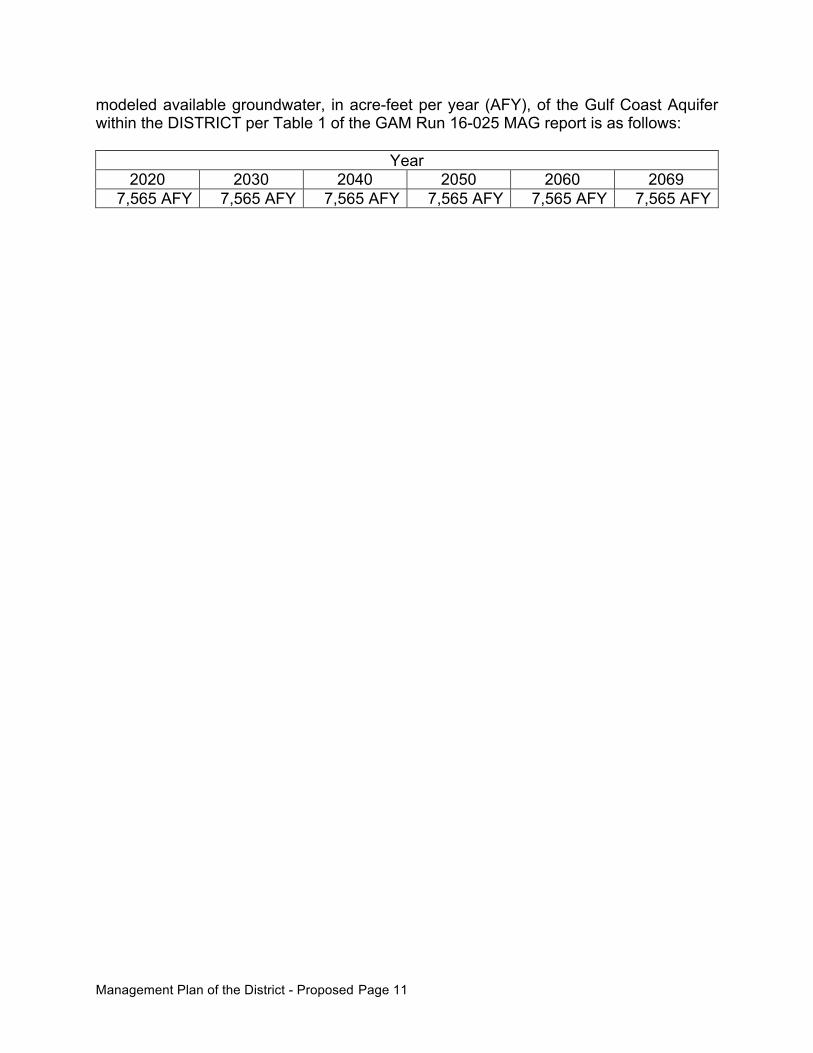
modeled available groundwater, in acre-feet per year (AFY), of the Gulf Coast Aquifer within the DISTRICT per Table 1 of the GAM Run 16-025 MAG report is as follows:
Year 2020 2030 2040 2050 2060 2069
7,565 AFY 7,565 AFY 7,565 AFY 7,565 AFY 7,565 AFY 7,565 AFY

Management Plan of the District - Proposed Page 12
Estimate of amount of groundwater being used within the district on an annual basis – TWC §36.1071(e)(3)(B) and 31 TAC 356.52(a)(5)(B)
Please refer to Appendix A.
Estimate of annual amount of recharge from precipitation to the groundwater resources within the district – TWC §36.1071(e)(3)(C) and 31 TAC 356.52(a)(5)(C)
Please refer to Appendix B.
Estimate for each aquifer, annual volume of water that discharges from the aquifer to springs and any surface water bodies, including lakes, streams, and rivers – TWC §36.1071(e)(3)(D) and 31 TAC 356.52(a)(5)(D)
Please refer to Appendix B.
Estimate of annual volume of flow into and out of the district within each aquifer and between aquifers in the district – TWC §36.1071(e)(3)(E) and 31 TAC 356.52(a)(5)(E)
Please refer to Appendix B.
Estimate of projected surface water supply in the district according to the most recently adopted state water plan – TWC §36.1071(e)(3)(F) and 31 TAC 356.52(a)(5)(F)
Please refer to Appendix A.
Estimate of projected total demand for water in the district according to the most recently adopted state water plan – TWC §36.1071(e)(3)(G) and 31 TAC 356.52(a)(5)(G)
Please refer to Appendix A.
Management Plan of the District - Proposed Page 13
CONSIDER THE WATER SUPPLY NEEDS AND WATER MANAGEMENT STRATEGIES INCLUDED IN THE ADOPTED STATE WATER PLAN – TWC §36.1071(e)(4)
Please refer to Appendix A.

Management Plan of the District - Proposed Page 14
DETAILS ON THE DISTRICT MANAGEMENT OF GROUNDWATER
The Texas Legislature established that groundwater conservation districts are the preferred method of groundwater management in TWC §36.0015. The DISTRICT will manage the use of groundwater within Calhoun County in order to protect, preserve, conserve, and prevent waste of the resource while seeking to maintain the economic viability of all resource user groups, public and private. The DISTRICT seeks to manage the groundwater resources of Calhoun County as practicably as possible as established in the plan. In consideration of the economic and cultural activities occurring within Calhoun County, the DISTRICT will identify and engage in such activities and practices, that if implemented may result in the reasonable and effective protection, preservation, conservation, waste prevention of groundwater in Calhoun County. The DISTRICT will manage groundwater resources through rules developed and implemented in accordance with Chapter 36 of the Texas Water Code and the provisions of the DISTRICT’s enabling legislation. For the purposes of this management plan, the following definitions are used:
• Protection of groundwater is the activity and practice of seeking to prevent harm or injury to a groundwater resource.
• Preservation of groundwater is the activity and practice of seeking to extend the useful longevity or life of a groundwater resource.
• Conservation of groundwater is the activity and practice of seeking to use a groundwater resource in a manner that appropriately balances the impacts associated with consuming the resource and preserving the resource for the future.
• Waste prevention of groundwater is the activity and practices seeking to prevent the use of groundwater in any manner defined as waste in Section 36.001 of the Texas Water Code.
An observation well network will be established and maintained by the DISTRICT in order to monitor changing water levels and water quality of groundwater supplies within Calhoun County. When a monitoring well network has been established, the DISTRICT will make a regular assessment of water supply and groundwater storage conditions, water quality conditions and will report those conditions to the Calhoun County Groundwater Conservation District Board of Directors and to the public. The DISTRICT may undertake, as necessary, investigations of the groundwater resources within Calhoun County and will make the results of investigations available to the public. The DISTRICT will co-operate with investigations of the groundwater resources of Calhoun County undertaken by other local political subdivisions or agencies of the State of Texas. In order to better manage groundwater resources the DISTRICT may establish management zones for; and adopt different rules for:
1. Each aquifer, subdivision of an aquifer, or geologic strata located in whole or in part within Calhoun County; or
Management Plan of the District - Proposed Page 15
2. Each geographic area overlying an aquifer or subdivision of an aquifer located in whole or in part within Calhoun County.
For the purpose of managing the use of groundwater within Calhoun County, the DISTRICT may define sustainable use as the use of an amount of groundwater in Calhoun County as a whole or any management zone established by the DISTRICT that does not exceed any of the following conditions:
1. The long-term average historical groundwater production from aquifers in Calhoun County established by the DISTRICT prior to the establishment of the desired future condition of aquifers in a groundwater management area in which the DISTRICT is located; or
2. The desired future conditions of aquifers in Calhoun County established by a groundwater management area in which the DISTRICT is located; or
3. The amount of modeled available groundwater resulting from the establishment of a desired future aquifer condition by the DISTRICT or a groundwater management area in which the DISTRICT is located; or
4. The estimated long-term average historical amount of annual recharge of the aquifer or aquifer subdivision in which the use occurs as recognized by the DISTRICT; or
5. Any other criteria established by the DISTRICT as being a threshold of use beyond which further use of the aquifer or aquifer subdivision may result in a specified undesirable or injurious condition.
The DISTRICT may adopt rules that protect historic use of groundwater in Calhoun County to the maximum extent practical and consistent with this plan and the goals and objectives set forth herein. The DISTRICT may impose more restrictive conditions on non-historic-use permits and non-historic-use permit amendments to increase use by historic users if the limitations:
1. Apply to all non-historic-use permits and non-historic-use permit amendments to increase use by historic users, regardless of the type or location of use;
2. Bear a reasonable relationship to the DISTRICT’s management plan; and 3. Are reasonably necessary to protect historic use.
The DISTRICT may adopt rules to regulate groundwater withdrawals by means of spacing and/or production limits. The relevant factors to be considered in making a determination to grant or deny a permit or limit groundwater withdrawals shall include those set forth in the DISTRICT enabling Legislation, Chapter 36 of the Texas Water Code, and the rules of the District. The District may employ technical resources at its disposal, as needed, to evaluate the groundwater resources available within Calhoun County and to determine the effectiveness of regulatory or conservation measures. In consideration of particular individual, localized or District-wide conditions, including without limitation climatic conditions, the DISTRICT may, by rule, allow an increase or impose a decrease in the total production in a management zone above or below the sustainable amount for a period of time considered necessary by the DISTRICT in order to accomplish the purposes set forth in Chapter 36 of the Texas Water Code, or the DISTRICT’s enabling legislation. The exercise of said discretion by the Calhoun County

Management Plan of the District - Proposed Page 16
Groundwater Conservation District Board of Directors shall not be construed as limiting the power of the Calhoun County Groundwater Conservation District Board of Directors.

Management Plan of the District - Proposed Page 17
ACTIONS, PROCEDURES, PERFORMANCE AND AVOIDANCE FOR PLAN IMPLEMENTATION – TWC §36.1071(e)(2)
The DISTRICT will implement the provisions of this plan and will utilize the provisions of this plan as a guidepost for determining the direction or priority for all DISTRICT activities. All operations of the DISTRICT, all agreements entered into by the DISTRICT, and any additional planning efforts in which the DISTRICT may participate will be consistent with the provisions of this plan. Rules adopted by the DISTRICT for the permitting of wells and the use of groundwater shall comply with Chapter 36 of the Texas Water Code, including §36.113 of the Texas Water Code, and the provisions of this management plan. All rules will be adhered to and enforced. The promulgation and enforcement of the rules will be based on the best technical evidence available to the DISTRICT. The DISTRICT’s rules are available at the following website addresses: www.calhouncountygcd.org
METHODOLOGY FOR TRACKING DISTRICT PROGRESS IN ACHIEVING MANAGEMENT GOALS – 31TAC 356.52(a)(4)
The staff of the DISTRICT will prepare and present an annual report to the Calhoun County Groundwater Conservation District Board of Directors regarding the DISTRICT’s performance in achieving management goals and objectives for the fiscal year. The report will be presented within 120 days following the completion of the DISTRICT’s fiscal year. The DISTRICT will maintain the report on file for public inspection at the District's offices upon adoption at a meeting of the Calhoun County Groundwater Conservation Board of Directors.

Management Plan of the District - Proposed Page 18
GOALS, MANAGEMENT OBJECTIVES and PERFORMANCE STANDARDS
Providing the most efficient use of groundwater – TWC §36.1071(a)(1) and 31 TAC 356.52(a)(1)(A)
Objective: Develop and maintain a water well registration program for tracking well information for wells within Calhoun County.
Performance Standard: Each year, the DISTRICT will summarize within the annual report the changes related to water well registration including the number of non-grandfathered and grandfathered wells registered.
Objective: Develop and maintain a water well permitting program for processing and tracking all permits authorizing groundwater production.
Performance Standard: Each year, the DISTRICT will summarize within the annual report the changes related to water well permitting including the number of new applications and the disposition of the applications.
Controlling and preventing waste of groundwater – TWC §36.1071(a)(2) and 31 TAC 356.52(a)(1)(B)
Objective: Develop and maintain a water well inspection program for non-exempt wells.
Performance Standard: Each year, the DISTRICT will summarize within the annual report the findings of the inspection activities including information regarding the number of wells that require improvement to control or prevent waste of groundwater.
Controlling and preventing subsidence – TWC §36.1071(a)(3) and 31 TAC 356.52(a)(1)(C)
This category of management goal is not applicable to the DISTRICT at this time because no significant subsidence has occurred in Calhoun County. The DISTRICT will monitor geological conditions for evidence of subsidence, particularly in high groundwater production areas near the coast and take appropriate action should subsidence develop.
Addressing conjunctive surface water management issues – TWC §36.1071(a)(4) and 31 TAC 356.52(a)(1)(D)
Management Plan of the District - Proposed Page 19
Objective: Participate in the regional water planning process by attending at least one South Central Texas Regional Water Planning Group (Region L) meeting per year.
Performance Standard: Each year, the DISTRICT will summarize within the annual report the representatives of the DISTRICT, dates, and the number of meetings of the South Central Texas Regional Water Planning Group attended.
Addressing natural resource issues which impact the use and availability of groundwater, and which are impacted by the use of groundwater – TWC §36.1071(a)(5) and 31 TAC §356.52(a)(1)(E)
Objective: Develop and maintain a water quality monitoring program.
Performance Standard: Each year, the DISTRICT will summarize within the annual report the monitoring activities including the number of wells monitored and the year-to-year change of water quality.
Addressing drought conditions – TWC §36.1071(a)(6) and 31 TAC 356.52(a)(1)(F)
Objective: Collect and review drought condition information related to Calhoun County and the surrounding region of Texas.
Performance Standard: Each year, the District will summarize within the annual report the drought condition information collected and reviewed.
Addressing conservation, recharge enhancement, rainwater harvesting, precipitation enhancement, or brush control, where appropriate and cost-effective – TWC §36.1071(a)(7) and 31 TAC 356.52(a)(1)(G)
Objective: Promote conservation, rainwater harvesting or brush control within Calhoun County.
Performance Standard: Each year, the DISTRICT will summarize within the annual report the activities directly related to conservation, rainwater harvesting or brush control including participation in scientific investigations and studies, educational materials developed and delivered to local schools, cooperative educational contributions and grants, public speaking events and presentations, community event participation, and educational publications. Recharge enhancement and precipitation enhancement are deemed to be

Management Plan of the District - Proposed Page 20
not appropriate or cost-effective programs for the DISTRICT at this time because there are no existing recharge enhancement or precipitation enhancement programs operating in nearby counties in which the DISTRICT could participate and share costs. The costs of operating a single-county recharge enhancement or precipitation enhancement program are prohibitive and would require the DISTRICT to increase taxes. Therefore, these goals are not applicable to the DISTRICT at this time.
Addressing the desired future conditions adopted by the district under Section 36.108 – TWC §36.1071(a)(8) and 31 TAC 356.52(a)(1)(H)
Objective: Develop and maintain a water level monitoring program.
Performance Standard: Each year, the DISTRICT will summarize within the annual report the water level monitoring activities including the number of wells monitored and the year-to-year change of water level.
Objective: Analyze water level monitoring information to evaluate water level trends and determine the degree to which the DISTRICT is complying with the desired future conditions of Gulf Coast Aquifer in Calhoun County.
Performance Standard: Each year, the DISTRICT will summarize within the annual report the water level trends and the conclusions regarding the DISTRICT’s compliance with the desired future condition of the Gulf Coast Aquifer in Calhoun County.
Management Plan of the District - Proposed Page 21
List of Appendices
Appendix A. Estimated Historical Water Use and State Water Plan Datasets provided by Texas Water Development Board
Appendix B. Groundwater Availability Model Run 15-010 provided by Texas
Water Development Board
Appendix C. Groundwater Availability Model Run 16-025 MAG
Appendix D. Public Notices Regarding Hearings Related to Plan Adoption
Appendix E. Letters Coordinating with Regional Surface Water Management Entities
Appendix F. Calhoun County Groundwater Conservation District Board of
Director Resolution Adopting Management Plan
Appendix G. Minutes of Calhoun County Groundwater Conservation District Board of Director Meeting related to the public hearings for and adoption of the Management Plan
Appendix H. Calhoun County Groundwater Conservation District Contact
Information

Appendix A. Estimated Historical Water Use and State Water Plan Datasets provided by Texas Water Development Board
Estimated Historical Water Use And 2017 State Water Plan Datasets:Calhoun County Groundwater Conservation District
by Stephen Allen
Texas Water Development Board
Groundwater Division
Groundwater Technical Assistance Section
May 11, 2017
GROUNDWATER MANAGEMENT PLAN DATA:This package of water data reports (part 1 of a 2-part package of information) is being provided to groundwater conservation districts to help them meet the requirements for approval of their five-year groundwater management plan. Each report in the package addresses a specific numbered requirement in the Texas Water Development Board's groundwater management plan checklist. The checklist can be viewed and downloaded from this web address:
http://www.twdb.texas.gov/groundwater/docs/GCD/GMPChecklist0113.pdf
The five reports included in this part are:1. Estimated Historical Water Use (checklist item 2)
from the TWDB Historical Water Use Survey (WUS)
2. Projected Surface Water Supplies (checklist item 6)
3. Projected Water Demands (checklist item 7)
4. Projected Water Supply Needs (checklist item 8)
5. Projected Water Management Strategies (checklist item 9)
from the 2017 Texas State Water Plan (SWP)
(512) 463-7317
Part 2 of the 2-part package is the groundwater availability model (GAM) report for the District (checklist items 3 through 5). The District should have received, or will receive, this report from the Groundwater Availability Modeling Section. Questions about the GAM can be directed to Dr. Shirley Wade, [email protected], (512) 936-0883.

DISCLAIMER:The data presented in this report represents the most up-to-date WUS and 2017 SWP data available as of 5/11/2017. Although it does not happen frequently, either of these datasets are subject to change pending the availability of more accurate WUS data or an amendment to the 2017 SWP. District personnel must review these datasets and correct any discrepancies in order to ensure approval of their groundwater management plan.
The WUS dataset can be verified at this web address:http://www.twdb.texas.gov/waterplanning/waterusesurvey/estimates/
The 2017 SWP dataset can be verified by contacting Sabrina Anderson ([email protected] or 512-936-0886).
For additional questions regarding this data, please contact Stephen Allen ([email protected] or 512-463-7317) or Rima Petrossian ([email protected] or 512-936-2420).
Estimated Historical Water Use and 2017 State Water Plan Dataset:
Calhoun County Groundwater Conservation District
May 11, 2017
Page 2 of 8

Estimated Historical Water Use TWDB Historical Water Use Survey (WUS) Data
Groundwater and surface water historical use estimates are currently unavailable for calendar year 2016. TWDB staff anticipates the calculation and posting of these estimates at a later date.
CALHOUN COUNTY All values are in acre-feet
Year Source Municipal Manufacturing Mining Steam Electric Irrigation Livestock Total
2015 GW 568 1,440 0 0 355 188 2,551
SW 2,474 41,394 0 0 3,000 81 46,949
2012 GW 917 1,576 0 0 0 200 2,693
SW 2,137 42,502 0 0 20,000 85 64,724
2011 GW 1,074 1,488 16 0 345 220 3,143
SW 2,550 42,933 10 0 17,000 94 62,587
2007 GW 305 1 1,280 0 1,270 229 3,085
SW 2,350 36,261 910 0 11,000 98 50,619
2006 GW 322 1 1,110 0 0 229 1,662
SW 2,118 35,802 246 0 15,812 98 54,076
2008 GW 248 1,111 2 0 0 240 1,601
SW 2,451 37,389 1 0 14,015 103 53,959
2009 GW 356 997 12 0 0 252 1,617
SW 2,505 37,131 8 0 14,900 108 54,652
2005 GW 310 2 1,290 0 0 253 1,855
SW 2,073 39,994 885 0 19,805 109 62,866
2004 GW 326 2 1,249 27 0 195 1,799
SW 2,028 37,212 1,165 0 15,509 169 56,083
2003 GW 332 2 1,303 8 0 204 1,849
SW 2,045 39,804 980 0 14,030 176 57,035
2010 GW 979 909 23 0 0 219 2,130
SW 2,319 38,482 14 0 10,459 96 51,370
2002 GW 335 3 1,160 101 0 176 1,775
SW 2,097 40,583 837 0 6,375 153 50,045
2001 GW 343 2 1,299 75 0 175 1,894
SW 1,996 37,125 658 0 14,655 152 54,586
2000 GW 395 3 1,322 62 0 206 1,988
SW 2,328 40,235 818 0 8,077 138 51,596
2013 GW 901 1,406 0 0 23 190 2,520
SW 2,092 41,459 0 0 15,225 80 58,856
2014 GW 799 1,170 0 0 643 187 2,799
SW 2,099 42,987 0 0 15,500 79 60,665
Estimated Historical Water Use and 2017 State Water Plan Dataset:
Calhoun County Groundwater Conservation District
May 11, 2017
Page 3 of 8

Estimated Historical Water Use and 2017 State Water Plan Dataset:
Calhoun County Groundwater Conservation District
May 11, 2017
Page 4 of 8

Projected Surface Water SuppliesTWDB 2017 State Water Plan Data
CALHOUN COUNTY All values are in acre-feet
RWPG WUG WUG Basin Source Name 2020 2030 2040 2050 2060 2070
L CALHOUN COUNTY WS LAVACA-GUADALUPE
GUADALUPE RUN-OF-RIVER
1,500 1,500 1,500 1,500 1,500 1,500
L LIVESTOCK, CALHOUN COLORADO-LAVACA
COLORADO-LAVACA LIVESTOCK LOCAL SUPPLY
64 64 64 64 64 64
L LIVESTOCK, CALHOUN LAVACA-GUADALUPE
LAVACA-GUADALUPE LIVESTOCK LOCAL SUPPLY
92 92 92 92 92 92
L LIVESTOCK, CALHOUN SAN ANTONIO-NUECES
SAN ANTONIO-NUECES LIVESTOCK LOCAL SUPPLY
16 16 16 16 16 16
L MANUFACTURING, CALHOUN
COLORADO-LAVACA
GUADALUPE RUN-OF-RIVER
18,865 18,865 18,865 18,865 18,865 18,865
L MANUFACTURING, CALHOUN
COLORADO-LAVACA
TEXANA LAKE/RESERVOIR
16,857 16,857 16,857 16,857 16,858 16,857
L MANUFACTURING, CALHOUN
LAVACA-GUADALUPE
CANYON LAKE/RESERVOIR
100 100 100 100 100 100
L MANUFACTURING, CALHOUN
LAVACA-GUADALUPE
GUADALUPE RUN-OF-RIVER
15,435 15,435 15,435 15,435 15,435 15,435
L MANUFACTURING, CALHOUN
LAVACA-GUADALUPE
TEXANA LAKE/RESERVOIR
13,793 13,793 13,793 13,793 13,792 13,793
L POINT COMFORT COLORADO-LAVACA
TEXANA LAKE/RESERVOIR
178 178 178 178 178 178
L PORT LAVACA LAVACA-GUADALUPE
GUADALUPE RUN-OF-RIVER
4,480 4,480 4,480 4,480 4,480 4,480
L PORT O'CONNOR MUD LAVACA-GUADALUPE
GUADALUPE RUN-OF-RIVER
1,120 1,120 1,120 1,120 1,120 1,120
Sum of Projected Surface Water Supplies (acre-feet) 72,500 72,500 72,500 72,500 72,500 72,500
Estimated Historical Water Use and 2017 State Water Plan Dataset:
Calhoun County Groundwater Conservation District
May 11, 2017
Page 5 of 8

Projected Water DemandsTWDB 2017 State Water Plan Data
Please note that the demand numbers presented here include the plumbing code savings found in the Regional and State Water Plans.
CALHOUN COUNTY All values are in acre-feet
RWPG WUG WUG Basin 2020 2030 2040 2050 2060 2070
L CALHOUN COUNTY WS LAVACA-GUADALUPE 356 376 398 425 457 490
L COUNTY-OTHER, CALHOUN COLORADO-LAVACA 94 101 110 120 129 138
L COUNTY-OTHER, CALHOUN LAVACA-GUADALUPE 141 152 167 180 195 210
L COUNTY-OTHER, CALHOUN SAN ANTONIO-NUECES 9 9 11 12 13 13
L IRRIGATION, CALHOUN COLORADO-LAVACA 712 630 575 536 499 461
L IRRIGATION, CALHOUN LAVACA-GUADALUPE 12,748 11,294 10,309 9,603 8,945 8,257
L IRRIGATION, CALHOUN SAN ANTONIO-NUECES 12 11 10 9 9 8
L LIVESTOCK, CALHOUN COLORADO-LAVACA 66 66 66 66 66 66
L LIVESTOCK, CALHOUN GUADALUPE 2 2 2 2 2 2
L LIVESTOCK, CALHOUN LAVACA-GUADALUPE 260 260 260 260 260 260
L LIVESTOCK, CALHOUN SAN ANTONIO-NUECES 16 16 16 16 16 16
L MANUFACTURING, CALHOUN COLORADO-LAVACA 30,171 32,579 34,966 37,073 39,731 42,030
L MANUFACTURING, CALHOUN LAVACA-GUADALUPE 24,686 26,656 28,609 30,333 32,507 34,389
L MINING, CALHOUN COLORADO-LAVACA 26 27 20 15 9 6
L MINING, CALHOUN LAVACA-GUADALUPE 26 28 21 15 10 6
L POINT COMFORT COLORADO-LAVACA 87 92 99 107 115 124
L PORT LAVACA LAVACA-GUADALUPE 1,927 2,080 2,237 2,408 2,598 2,786
L PORT O'CONNOR MUD LAVACA-GUADALUPE 110 116 123 132 142 152
L SEADRIFT LAVACA-GUADALUPE 256 278 300 324 349 374
Sum of Projected Water Demands (acre-feet) 71,705 74,773 78,299 81,636 86,052 89,788
Estimated Historical Water Use and 2017 State Water Plan Dataset:
Calhoun County Groundwater Conservation District
May 11, 2017
Page 6 of 8

Projected Water Supply NeedsTWDB 2017 State Water Plan Data
Negative values (in red) reflect a projected water supply need, positive values a surplus.
CALHOUN COUNTY All values are in acre-feet
RWPG WUG WUG Basin 2020 2030 2040 2050 2060 2070
L CALHOUN COUNTY WS LAVACA-GUADALUPE 1,144 1,124 1,102 1,075 1,043 1,010
L COUNTY-OTHER, CALHOUN COLORADO-LAVACA 76 69 59 50 41 31
L COUNTY-OTHER, CALHOUN LAVACA-GUADALUPE 90 80 65 51 36 23
L COUNTY-OTHER, CALHOUN SAN ANTONIO-NUECES 15 14 13 12 11 10
L IRRIGATION, CALHOUN COLORADO-LAVACA -564 -482 -427 -388 -351 -313
L IRRIGATION, CALHOUN LAVACA-GUADALUPE -11,697 -10,243 -9,258 -8,552 -7,894 -7,206
L IRRIGATION, CALHOUN SAN ANTONIO-NUECES -12 -11 -10 -9 -9 -8
L LIVESTOCK, CALHOUN COLORADO-LAVACA 0 0 0 0 0 0
L LIVESTOCK, CALHOUN GUADALUPE 0 0 0 0 0 0
L LIVESTOCK, CALHOUN LAVACA-GUADALUPE 0 0 0 0 0 0
L LIVESTOCK, CALHOUN SAN ANTONIO-NUECES 0 0 0 0 0 0
L MANUFACTURING, CALHOUN COLORADO-LAVACA 5,746 3,338 951 -1,156 -3,813 -6,113
L MANUFACTURING, CALHOUN LAVACA-GUADALUPE 4,642 2,672 719 -1,005 -3,180 -5,061
L MINING, CALHOUN COLORADO-LAVACA 2 0 8 13 19 22
L MINING, CALHOUN LAVACA-GUADALUPE 1 0 6 12 17 21
L POINT COMFORT COLORADO-LAVACA 91 86 79 71 63 54
L PORT LAVACA LAVACA-GUADALUPE 2,553 2,400 2,243 2,072 1,882 1,694
L PORT O'CONNOR MUD LAVACA-GUADALUPE 1,210 1,204 1,197 1,188 1,178 1,168
L SEADRIFT LAVACA-GUADALUPE 472 450 428 404 379 354
Sum of Projected Water Supply Needs (acre-feet) -12,273 -10,736 -9,695 -11,110 -15,247 -18,701
Estimated Historical Water Use and 2017 State Water Plan Dataset:
Calhoun County Groundwater Conservation District
May 11, 2017
Page 7 of 8

Projected Water Management StrategiesTWDB 2017 State Water Plan Data
CALHOUN COUNTYWUG, Basin (RWPG) All values are in acre-feet
Water Management Strategy Source Name [Origin] 2020 2030 2040 2050 2060 2070
IRRIGATION, CALHOUN, COLORADO-LAVACA (L )
IRRIGATION WATER CONSERVATION DEMAND REDUCTION [CALHOUN]
0 0 0 0 0 0
0 0 0 0 0 0
IRRIGATION, CALHOUN, LAVACA-GUADALUPE (L )
IRRIGATION WATER CONSERVATION DEMAND REDUCTION [CALHOUN]
0 0 0 0 0 0
0 0 0 0 0 0
IRRIGATION, CALHOUN, SAN ANTONIO-NUECES (L )
IRRIGATION WATER CONSERVATION DEMAND REDUCTION [CALHOUN]
0 0 0 0 0 0
0 0 0 0 0 0
MANUFACTURING, CALHOUN, COLORADO-LAVACA (L )
GBRA NEW APPROPRIATION (LOWER BASIN)
GUADALUPE RUN-OF-RIVER [CALHOUN]
0 0 0 1,156 3,813 6,113
0 0 0 1,156 3,813 6,113
MANUFACTURING, CALHOUN, LAVACA-GUADALUPE (L )
GBRA NEW APPROPRIATION (LOWER BASIN)
GUADALUPE RUN-OF-RIVER [CALHOUN]
0 0 0 1,005 3,180 5,061
0 0 0 1,005 3,180 5,061
SEADRIFT, LAVACA-GUADALUPE (L )
MUNICIPAL WATER CONSERVATION (RURAL)
DEMAND REDUCTION [CALHOUN]
6 14 16 22 31 41
6 14 16 22 31 41
Sum of Projected Water Management Strategies (acre-feet) 6 14 16 2,183 7,024 11,215
Estimated Historical Water Use and 2017 State Water Plan Dataset:
Calhoun County Groundwater Conservation District
May 11, 2017
Page 8 of 8

Appendix B. Groundwater Availability Model Run 15-010 provided by Texas Water Development Board

This page is intentionally blank
GAM RUN 15-010: CALHOUN COUNTY
GROUNDWATER CONSERVATION DISTRICT
MANAGEMENT PLAN by Richard C. Bagans and Shirley Wade, Ph.D., P.G.
Texas Water Development Board Groundwater Resources Division
Groundwater Availability Modeling Section (512) 936-0883
August 12, 2015
EXECUTIVE SUMMARY:
Texas State Water Code, Section 36.1071, Subsection (h) (Texas Water Code, 2011),
states that, in developing its groundwater management plan, a groundwater
conservation district shall use groundwater availability modeling information provided
by the executive administrator of the Texas Water Development Board (TWDB) in
conjunction with any available site-specific information provided by the district for
review and comment to the executive administrator. Information derived from
groundwater availability models that shall be included in the groundwater
management plan includes:
the annual amount of recharge from precipitation to the groundwater resources within the district, if any;
for each aquifer within the district, the annual volume of water that discharges from the aquifer to springs and any surface water bodies, including lakes, streams, and rivers; and
the annual volume of flow into and out of the district within each aquifer and between aquifers in the district.
This report—Part 2 of a two-part package of information from the TWDB to the
Calhoun County Groundwater Conservation District—fulfills the requirements noted
above. Part 1 of the two-part package is the Estimated Historical Water Use/State
Water Plan data report. The District will receive this data report from the TWDB
Groundwater Technical Assistance Section. Questions about the data report can be
directed to Mr. Stephen Allen, [email protected], (512) 463-7317.

GAM Run 15-010: Calhoun County Groundwater Conservation District Management Plan August 12, 2015 Page 4 of 9
The groundwater management plan for Calhoun County Groundwater Conservation
District should be adopted by the district on or before August 4, 2017 and submitted
to the Executive Administrator of the TWDB on or before September 5, 2017. The
management plan for the Calhoun County Groundwater Conservation District is due by
on November 4, 2017.
This report discusses the methods, assumptions, and results from model runs using the
groundwater availability model of the central portion of the Gulf Coast Aquifer
System (Chowdhury and others, 2004). Table 1 summarizes the groundwater
availability model data required by statute, and Figure 1 shows the area of the model
from which the values in the table were extracted. If after review of the figure, the
Calhoun County Groundwater Conservation District determines that the district
boundaries used in the assessment do not reflect current conditions, please notify the
TWDB at your earliest convenience.
METHODS:
In accordance with the provisions of the Texas State Water Code, Section 36.1071,
Subsection (h), the central portion of the Gulf Coast Aquifer System (Chowdhury and
others, 2004) was run for this analysis. Calhoun County Groundwater Conservation
District water budgets were extracted for the historical model period used for
calibration of the model using ZONEBUDGET Version 3.01 (Harbaugh, 2009). The
average annual water budget values for recharge, surface water outflow, inflow to
the district, outflow from the district, net inter-aquifer flow (upper), and net inter-
aquifer flow (lower) for the portion of the aquifer system located within the district
are summarized in this report.
PARAMETERS AND ASSUMPTIONS:
Gulf Coast Aquifer System
Version 1.01 of the groundwater availability model for the central part of the Gulf Coast Aquifer System was used for this analysis. See Chowdhury and others (2004) and Waterstone and others (2003) for assumptions and limitations of the groundwater availability model.
This groundwater availability model includes four layers which generally represent the Chicot Aquifer (Layer 1), the Evangeline Aquifer (Layer 2), the Burkeville Confining Unit (Layer 3), and the Jasper Aquifer including parts of the Catahoula Formation near where it outcrops (Layer 4).

GAM Run 15-010: Calhoun County Groundwater Conservation District Management Plan August 12, 2015 Page 5 of 9
The model for the central portion of the Gulf Coast Aquifer System assumes that wells screened in the Evangeline Aquifer do not penetrate the full thickness of the aquifer near the Gulf of Mexico. This means the areas where wells are drilled into the Evangeline Aquifer are represented using data from the shallow portions of the aquifer, such as the outcrop or just below the Chicot Aquifer closer to the Gulf of Mexico. Lower portions of the aquifer near the Gulf of Mexico are not accessible with existing wells so deeper wells will be needed to understand the aquifer properties over the entire thickness of the aquifer.
The model was run with MODFLOW-96 (Harbaugh and McDonald, 1996).
RESULTS:
A groundwater budget summarizes the amount of water entering and leaving the
aquifer according to the groundwater availability model. Selected groundwater
budget components listed below were extracted from the model results for the
aquifers located within the district and averaged over the duration of the calibration
and verification portion of the model run in the district, as shown in Tables 1 through
6.
Precipitation recharge—The areally distributed recharge sourced from precipitation falling on the outcrop areas of the aquifers (where the aquifer is exposed at land surface) within the district.
Surface water outflow—The total water discharging from the aquifer (outflow) to surface water features such as streams, reservoirs, and springs.
Flow into and out of district—The lateral flow within the aquifer between the district and adjacent counties.
Flow between aquifers—The net vertical flow between the aquifer and adjacent aquifers or confining units. This flow is controlled by the relative water levels in each aquifer or confining unit and aquifer properties of each aquifer or confining unit that define the amount of leakage that occurs.
The information needed for the District’s management plan is summarized in Table 1.
It is important to note that sub-regional water budgets are not exact. This is due to
the size of the model cells and the approach used to extract data from the model. To
avoid double accounting, a model cell that straddles a political boundary, such as a
district or county boundary, is assigned to one side of the boundary based on the
location of the centroid of the model cell. For example, if a cell contains two
counties, the cell is assigned to the county where the centroid of the cell is located.

GAM Run 15-010: Calhoun County Groundwater Conservation District Management Plan August 12, 2015 Page 6 of 9
FIGURE 1: AREA OF THE GROUNDWATER AVAILABILITY MODEL FOR THE CENTRAL PORTION OF THE GULF COAST AQUIFER SYSTEM FROM WHICH THE INFORMATION IN TABLE 1 WAS EXTRACTED [THE CENTRAL PORTION OF THE GULF COAST AQUIFER SYSTEM EXTENT MODELED WITHIN THE DISTRICT BOUNDARY].

GAM Run 15-010: Calhoun County Groundwater Conservation District Management Plan August 12, 2015 Page 7 of 9
TABLE 1: SUMMARIZED INFORMATION FOR THE GULF COAST AQUIFER SYSTEM THAT IS NEEDED FOR THE CALHOUN COUNTY GROUNDWATER CONSERVATION DISTRICT’S GROUNDWATER MANAGEMENT PLAN. ALL VALUES ARE REPORTED IN ACRE-FEET PER YEAR AND ROUNDED TO THE NEAREST 1 ACRE-FOOT.
Management Plan requirement Aquifer or confining unit Results
Estimated annual amount of recharge from
precipitation to the district Gulf Coast Aquifer System 2,573
Estimated annual volume of water that
discharges from the aquifer to springs and any
surface water body including lakes, streams,
and rivers
Gulf Coast Aquifer System 7,236
Estimated annual volume of flow into the
district within each aquifer in the district Gulf Coast Aquifer System 11,921
Estimated annual volume of flow out of the
district within each aquifer in the district Gulf Coast Aquifer System 8,967
Estimated net annual volume of flow between
each aquifer in the district Not applicable* Not applicable*
* The groundwater availability model for the central portion of the Gulf Coast Aquifer System assumes no-flow
conditions at the base of the aquifer system.

GAM Run 15-010: Calhoun County Groundwater Conservation District Management Plan August 12, 2015 Page 8 of 9
LIMITATIONS:
The groundwater model(s) used in completing this analysis is the best available
scientific tool that can be used to meet the stated objective(s). To the extent that
this analysis will be used for planning purposes and/or regulatory purposes related to
pumping in the past and into the future, it is important to recognize the assumptions
and limitations associated with the use of the results. In reviewing the use of models
in environmental regulatory decision making, the National Research Council (2007)
noted:
“Models will always be constrained by computational limitations, assumptions, and knowledge gaps. They can best be viewed as tools to help inform decisions rather than as machines to generate truth or make decisions. Scientific advances will never make it possible to build a perfect model that accounts for every aspect of reality or to prove that a given model is correct in all respects for a particular regulatory application. These characteristics make evaluation of a regulatory model more complex than solely a comparison of measurement data with model results.”
A key aspect of using the groundwater model to evaluate historic groundwater flow
conditions includes the assumptions about the location in the aquifer where historic
pumping was placed. Understanding the amount and location of historic pumping is as
important as evaluating the volume of groundwater flow into and out of the district,
between aquifers within the district (as applicable), interactions with surface water
(as applicable), recharge to the aquifer system (as applicable), and other metrics that
describe the impacts of that pumping. In addition, assumptions regarding
precipitation, recharge, and interaction with streams are specific to particular
historic time periods.
Because the application of the groundwater models was designed to address regional
scale questions, the results are most effective on a regional scale. The TWDB makes
no warranties or representations related to the actual conditions of any aquifer at a
particular location or at a particular time.
It is important for groundwater conservation districts to monitor groundwater
pumping and overall conditions of the aquifer. Because of the limitations of the
groundwater model and the assumptions in this analysis, it is important that the
groundwater conservation districts work with the TWDB to refine this analysis in the
future given the reality of how the aquifer responds to the actual amount and
location of pumping now and in the future. Historic precipitation patterns also need

GAM Run 15-010: Calhoun County Groundwater Conservation District Management Plan August 12, 2015 Page 9 of 9
to be placed in context as future climatic conditions, such as dry and wet year
precipitation patterns, may differ and affect groundwater flow conditions.
REFERENCES:
Chowdhury, Ali. H., Wade, S., Mace, R.E., and Ridgeway, C., 2004, Groundwater Availability Model of the Central Gulf Coast Aquifer System: Numerical Simulations through 1999- Model Report, 114 p., http://www.twdb.texas.gov/groundwater/models/gam/glfc_c/TWDB_Recalibration_Report.pdf.
Harbaugh, A. W., 2009, Zonebudget Version 3.01, A computer program for computing subregional water budgets for MODFLOW ground-water flow models, U.S. Geological Survey Groundwater Software.
Harbaugh, A. W., and McDonald, M. G., 1996, User’s documentation for MODFLOW-96, an update to the U.S. Geological Survey modular finite-difference groundwater-water flow model: U.S. Geological Survey Open-File Report 96-485, 56 p.
National Research Council, 2007, Models in Environmental Regulatory Decision Making Committee on Models in the Regulatory Decision Process, National Academies Press, Washington D.C., 287 p., http://www.nap.edu/catalog.php?record_id=11972.
Texas Water Code, 2011, http://www.statutes.legis.state.tx.us/docs/WA/pdf/WA.36.pdf
Waterstone Environmental Hydrology and Engineering Inc. and Parsons, 2003, Groundwater availability of the Central Gulf Coast Aquifer: Numerical Simulations to 2050, Central Gulf Coast, Texas Contract report to the Texas Water Development Board, 157 p.

Appendix C. Groundwater Availability Model Run 16-025 MAG
GAM RUN 16-025 MAG: MODELED AVAILABLE GROUNDWATER FOR
THE GULF COAST AQUIFER SYSTEM IN
GROUNDWATER MANAGEMENT AREA 15 Rohit Raj Goswami, Ph.D., P.E.
Texas Water Development Board Groundwater Division
Groundwater Availability Modeling Section (512) 463-0495 March 22, 2017

This page is intentionally left blank.
GAM RUN 16-025 MAG: MODELED AVAILABLE GROUNDWATER FOR THE
GULF COAST AQUIFER SYSTEM IN GROUNDWATER
MANAGEMENT AREA 15 Rohit Raj Goswami, Ph.D., P.E.
Texas Water Development Board Groundwater Division
Groundwater Availability Modeling Section (512) 463-0495 March 22, 2017
EXECUTIVE SUMMARY:
The modeled available groundwater for Groundwater Management Area 15 for the Gulf
Coast Aquifer System is summarized by decade for the groundwater conservation districts
(Table 1) and for use in the regional water planning process (Table 2). The modeled
available groundwater estimates range from approximately 515,000 acre-feet per year in
2020 to approximately 518,000 acre-feet per year in 2069(Table 1). The estimates were
extracted from results of a model run using the groundwater availability model for the
central part of the Gulf Coast Aquifer System (version 1.01). The model run files, which
meet the desired future conditions adopted by district representatives of Groundwater
Management Area 15, were submitted to the Texas Water Development Board (TWDB) on
June 28, 2016, as part of the Desired Future Conditions Explanatory Report for
Groundwater Management Area 15. The explanatory report and other materials submitted
to the Texas Water Development Board (TWDB) were determined to be administratively
complete on October 20, 2016.
REQUESTOR:
Mr. Tim Andruss, chair of Groundwater Management Area 15.
DESCRIPTION OF REQUEST:
In a letter dated June 23, 2016, Mr. Tim Andruss provided the TWDB with the desired
future conditions of the Gulf Coast Aquifer System adopted by the groundwater
conservation districts in Groundwater Management Area 15. The Gulf Coast Aquifer System
includes the Chicot Aquifer, Evangeline Aquifer, Burkeville Confining Unit and the Jasper
Aquifer (including parts of the Catahoula Formation). TWDB staff worked with INTERA
Incorporated, the consultant for Groundwater Management Area 15, in reviewing

GAM Run 16-025 MAG: Modeled Available Groundwater for the Gulf Coast Aquifer System in Groundwater Management Area 15 March 22, 2017
Page 4 of 16
model files associated with the desired future conditions. We received clarification from
INTERA Incorporated, on behalf of Groundwater Management Area 15, on September 18,
2016, concerning assumptions on variances of average drawdown values per county to
model results, which was ±3.5 feet for nearly all areas within the Groundwater
Management Area 15. The exception is Goliad County which has a variance in drawdown of
±5 feet. The desired future conditions for the Gulf Coast Aquifer System, as described in
Resolution No. 2016-01 and adopted April 29, 2016, by the groundwater conservation
districts within Groundwater Management Area 15, are described below:
Groundwater Management Area 15 [all counties]
Drawdown of the Gulf Coast Aquifer System shall not exceed an average of 13 feet in
December 2069 from estimated year 2000 conditions.
Aransas County
Drawdown of the Gulf Coast Aquifer System shall not exceed an average of 0 feet in
December 2069 from estimated year 2000 conditions.
Bee County
Drawdown of the Gulf Coast Aquifer System shall not exceed an average of 7 feet in
December 2069 from estimated year 2000 conditions.
Calhoun County
Drawdown of the Gulf Coast Aquifer System shall not exceed an average of 5 feet in
December 2069 from estimated year 2000 conditions.
Colorado County
Drawdown shall not exceed an average of 17 feet in Chicot and Evangeline Aquifers and 23
feet in in the Jasper Aquifer in December 2069 from estimated year 2000 conditions.
DeWitt County
Drawdown of the Gulf Coast Aquifer System shall not exceed an average of 17 feet in
December 2069 from estimated year 2000 conditions.

GAM Run 16-025 MAG: Modeled Available Groundwater for the Gulf Coast Aquifer System in Groundwater Management Area 15 March 22, 2017
Page 5 of 16
Fayette County
Drawdown of the Gulf Coast Aquifer System shall not exceed an average of 16 feet in
December 2069 from estimated year 2000 conditions.
Goliad County
Drawdown of the Gulf Coast Aquifer System shall not exceed an average of 10 feet in
December 2069 from estimated year 2000 conditions.
Jackson County
Drawdown of the Gulf Coast Aquifer System shall not exceed an average of 15 feet in
December 2069 from estimated year 2000 conditions.
Karnes County
Drawdown of the Gulf Coast Aquifer System shall not exceed an average of 22 feet in
December 2069 from estimated year 2000 conditions.
Lavaca County
Drawdown of the Gulf Coast Aquifer System shall not exceed an average of 18 feet in
December 2069 from estimated year 2000 conditions.
Matagorda County
Drawdown shall not exceed an average of 11 feet in Chicot and Evangeline Aquifers in
December 2069 from estimated year 2000 conditions.
Refugio County
Drawdown of the Gulf Coast Aquifer System shall not exceed an average of 5 feet in
December 2069 from estimated year 2000 conditions.
Victoria County
Drawdown of the Gulf Coast Aquifer System shall not exceed an average of 5 feet in
December 2069 from estimated year 2000 conditions.
Wharton County
Drawdown shall not exceed an average of 15 feet in Chicot and Evangeline Aquifers in
December 2069 from estimated year 2000 conditions.
GAM Run 16-025 MAG: Modeled Available Groundwater for the Gulf Coast Aquifer System in Groundwater Management Area 15 March 22, 2017
Page 6 of 16
Based on the adopted desired future conditions, TWDB has estimated the modeled
available groundwater for the Gulf Coast Aquifer System in Groundwater Management Area
15.
METHODS:
The groundwater availability model for the central part of the Gulf Coast Aquifer System
(Figure 1) was run using the model files submitted with the explanatory report (GMA 15
and others, 2016). Model-calculated water levels were extracted for the year 2000 and the
end of the year 2069, and drawdown was calculated as the difference between water levels
at the beginning of 2000 and water levels at the end of 2069. Drawdown averages were
calculated for each county by aquifer and for the entire Groundwater Management Area 15
by aquifer. As specified in the explanatory report (GMA 15 and others, 2016), drawdown
for cells which became dry during the simulation (water level dropped below the base of
the cell) were excluded from the averaging. The calculated drawdown averages were
compared with the desired future conditions to verify that the pumping scenario achieved
the desired future conditions within one foot.
The modeled available groundwater values were determined by extracting pumping rates
by decade from the model results using ZONEBUDGET Version 3.01 (Harbaugh, 2009).
Annual pumping rates are presented by county and groundwater conservation district,
subtotaled by groundwater conservation district, and then summed by Groundwater
Management Area 15 (Figure 2 and Table 1). Annual pumping rates are also presented by
county, river basin, and regional water planning area within Groundwater Management
Area 15 (Figure 2 and Table 2).
Modeled Available Groundwater and Permitting
As defined in Chapter 36 of the Texas Water Code, “modeled available groundwater” is the
estimated average amount of water that may be produced annually to achieve a desired
future condition. Groundwater conservation districts are required to consider modeled
available groundwater, along with several other factors, when issuing permits in order to
manage groundwater production to achieve the desired future condition(s). The other
factors districts must consider include annual precipitation and production patterns, the
estimated amount of pumping exempt from permitting, existing permits, and a reasonable
estimate of actual groundwater production under existing permits.

GAM Run 16-025 MAG: Modeled Available Groundwater for the Gulf Coast Aquifer System in Groundwater Management Area 15 March 22, 2017
Page 7 of 16
PARAMETERS AND ASSUMPTIONS:
The parameters and assumptions for the groundwater availability are described below:
Version 1.01 of the groundwater availability model for the central portion of the Gulf Coast Aquifer System was used for this analysis. See Chowdhury and others (2004) and Waterstone and others (2003) for assumptions and limitations of the model.
The model has four layers which represent the Chicot Aquifer (Layer 1), the Evangeline Aquifer (Layer 2), the Burkeville Confining Unit (Layer 3), and the Jasper Aquifer and parts of the Catahoula Formation in direct hydrologic communication with the Jasper Aquifer (Layer 4).
The model was run with MODFLOW-96 (Harbaugh and others, 1996).
Drawdown averages and modeled available groundwater values are based on the extent of the model area rather than official aquifer boundaries (Figures 1 and 2).
Drawdown for cells with water levels below the base elevation of the cell (“dry” cells) were excluded from the averaging per emails exchanged with INTERA, Inc. dated October 21, 2015.
Estimates of modeled available groundwater from the model simulation were rounded to whole numbers.
A model drawdown tolerance of up to 5 feet was assumed for Goliad County and up to 3.5 feet for the rest of Groundwater Management Area 15 when comparing desired future conditions (average drawdown values per county) to model drawdown results.
Average drawdown by county may include some model cells that represent portions of surface water such as bays, reservoirs, and the Gulf of Mexico.
RESULTS:
The modeled available groundwater for the Gulf Coast Aquifer System that achieves the
desired future conditions adopted by Groundwater Management Area 15 increases from
approximately 515,000 acre-feet per year in 2020 to approximately 518,000 acre-feet per
year in 2069 (Table 1). The modeled available groundwater is summarized by groundwater
conservation district and county (Table 1). The modeled available groundwater has also
been summarized by county, river basin, and regional water planning area for use in the
regional water planning process (Table 2). Small differences of values between table
summaries are due to rounding.
GAM Run 16-025 MAG: Modeled Available Groundwater for the Gulf Coast Aquifer System in Groundwater Management Area 15 March 22, 2017
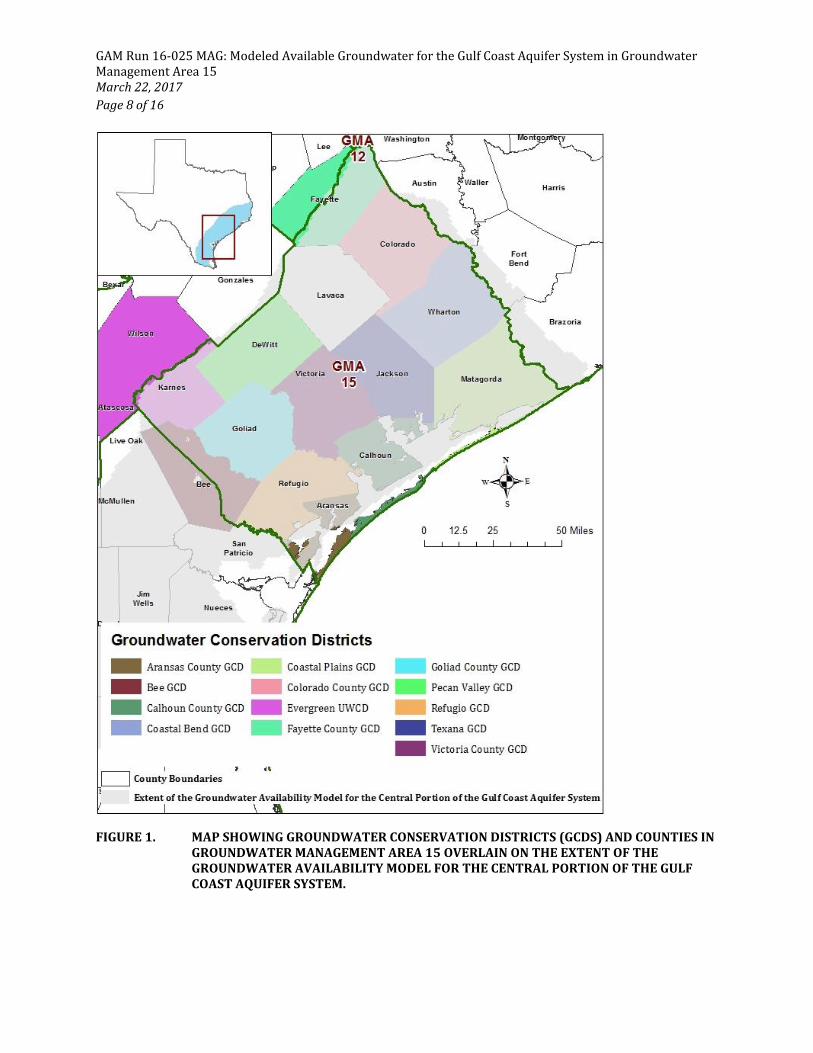
Page 8 of 16
FIGURE 1. MAP SHOWING GROUNDWATER CONSERVATION DISTRICTS (GCDS) AND COUNTIES IN GROUNDWATER MANAGEMENT AREA 15 OVERLAIN ON THE EXTENT OF THE GROUNDWATER AVAILABILITY MODEL FOR THE CENTRAL PORTION OF THE GULF COAST AQUIFER SYSTEM.
GAM Run 16-025 MAG: Modeled Available Groundwater for the Gulf Coast Aquifer System in Groundwater Management Area 15 March 22, 2017
Page 9 of 16
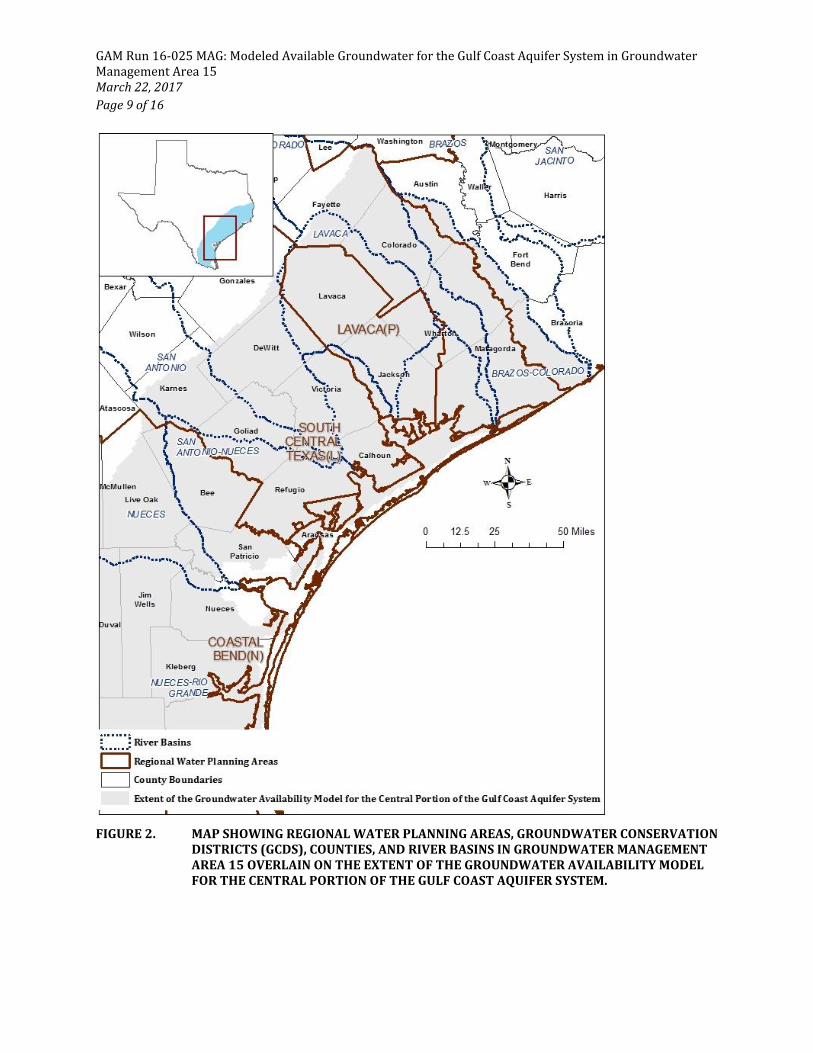
FIGURE 2. MAP SHOWING REGIONAL WATER PLANNING AREAS, GROUNDWATER CONSERVATION
DISTRICTS (GCDS), COUNTIES, AND RIVER BASINS IN GROUNDWATER MANAGEMENT AREA 15 OVERLAIN ON THE EXTENT OF THE GROUNDWATER AVAILABILITY MODEL FOR THE CENTRAL PORTION OF THE GULF COAST AQUIFER SYSTEM.
GAM Run 16-025 MAG: Modeled Available Groundwater for the Gulf Coast Aquifer System in Groundwater Management Area 15 March 22, 2017
Page 10 of 16
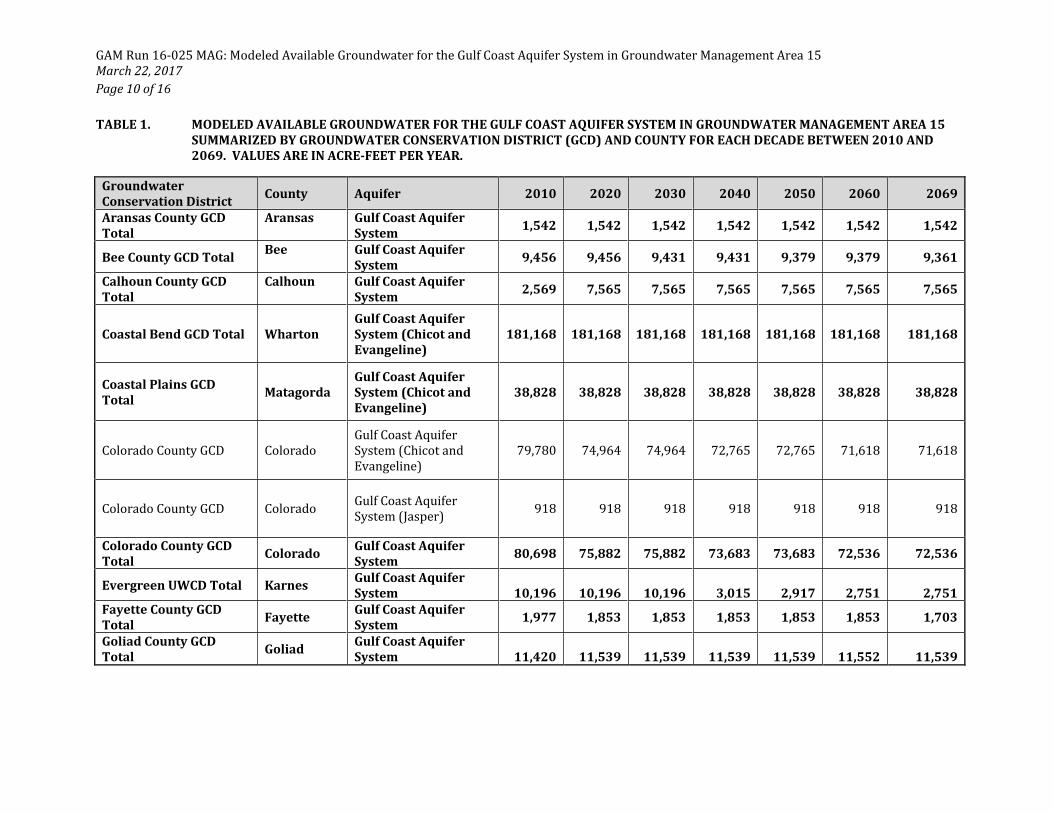
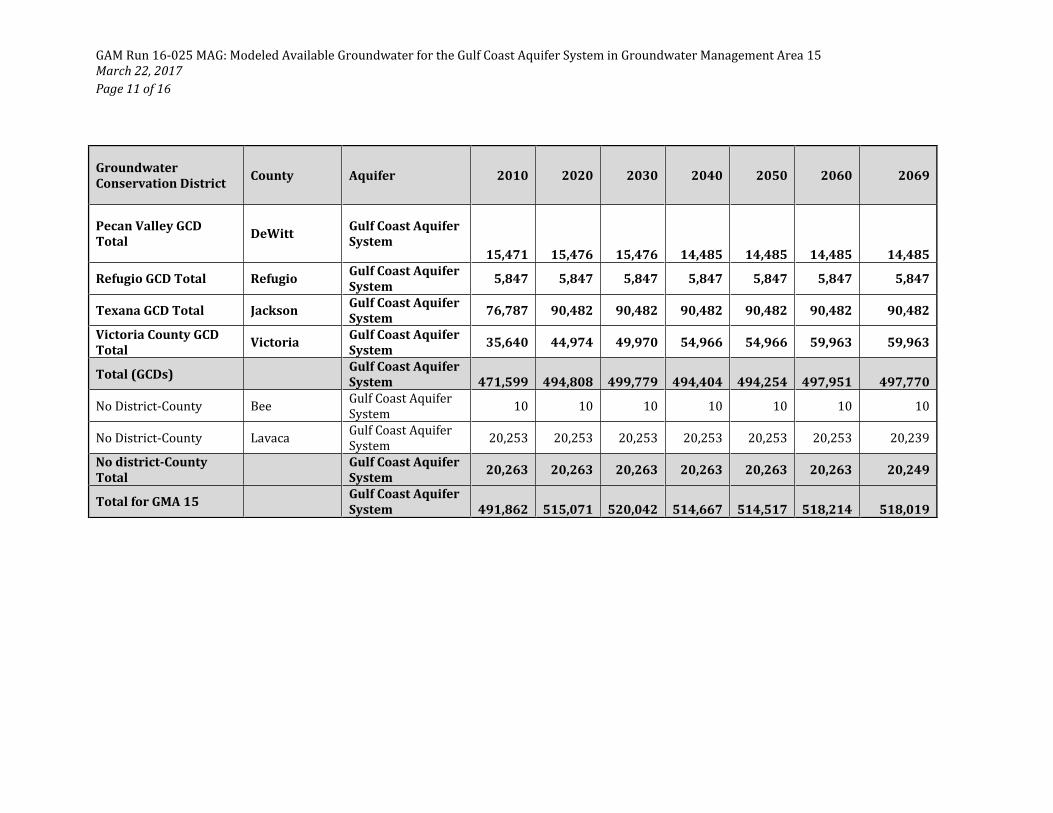
TABLE 1. MODELED AVAILABLE GROUNDWATER FOR THE GULF COAST AQUIFER SYSTEM IN GROUNDWATER MANAGEMENT AREA 15 SUMMARIZED BY GROUNDWATER CONSERVATION DISTRICT (GCD) AND COUNTY FOR EACH DECADE BETWEEN 2010 AND 2069. VALUES ARE IN ACRE-FEET PER YEAR.
Groundwater Conservation District
County Aquifer 2010 2020 2030 2040 2050 2060 2069
Aransas County GCD Total
Aransas Gulf Coast Aquifer System
1,542 1,542 1,542 1,542 1,542 1,542 1,542
Bee County GCD Total Bee Gulf Coast Aquifer
System 9,456 9,456 9,431 9,431 9,379 9,379 9,361
Calhoun County GCD Total
Calhoun Gulf Coast Aquifer System
2,569 7,565 7,565 7,565 7,565 7,565 7,565
Coastal Bend GCD Total Wharton Gulf Coast Aquifer System (Chicot and Evangeline)
181,168 181,168 181,168 181,168 181,168 181,168 181,168
Coastal Plains GCD Total
Matagorda Gulf Coast Aquifer System (Chicot and Evangeline)
38,828 38,828 38,828 38,828 38,828 38,828 38,828
Colorado County GCD Colorado Gulf Coast Aquifer System (Chicot and Evangeline)
79,780 74,964 74,964 72,765 72,765 71,618 71,618
Colorado County GCD Colorado Gulf Coast Aquifer System (Jasper)
918 918 918 918 918 918 918
Colorado County GCD Total
Colorado Gulf Coast Aquifer System
80,698 75,882 75,882 73,683 73,683 72,536 72,536
Evergreen UWCD Total Karnes Gulf Coast Aquifer System
10,196
10,196
10,196
3,015
2,917
2,751 2,751
Fayette County GCD Total
Fayette Gulf Coast Aquifer System
1,977 1,853 1,853 1,853 1,853 1,853 1,703
Goliad County GCD Total
Goliad Gulf Coast Aquifer System
11,420
11,539
11,539
11,539
11,539
11,552 11,539
GAM Run 16-025 MAG: Modeled Available Groundwater for the Gulf Coast Aquifer System in Groundwater Management Area 15 March 22, 2017
Page 11 of 16
Groundwater Conservation District
County Aquifer 2010 2020 2030 2040 2050 2060 2069
Pecan Valley GCD Total
DeWitt Gulf Coast Aquifer System
15,471
15,476
15,476
14,485
14,485
14,485 14,485
Refugio GCD Total Refugio Gulf Coast Aquifer System
5,847 5,847 5,847 5,847 5,847 5,847 5,847
Texana GCD Total Jackson Gulf Coast Aquifer System
76,787 90,482 90,482 90,482 90,482 90,482 90,482
Victoria County GCD Total
Victoria Gulf Coast Aquifer System
35,640 44,974 49,970 54,966 54,966 59,963 59,963
Total (GCDs)
Gulf Coast Aquifer System
471,599
494,808
499,779
494,404
494,254
497,951 497,770
No District-County Bee Gulf Coast Aquifer System
10 10 10 10 10 10 10
No District-County Lavaca Gulf Coast Aquifer System
20,253 20,253 20,253 20,253 20,253 20,253 20,239
No district-County Total
Gulf Coast Aquifer System
20,263 20,263 20,263 20,263 20,263 20,263 20,249
Total for GMA 15 Gulf Coast Aquifer System
491,862
515,071
520,042
514,667
514,517
518,214 518,019
GAM Run 16-025 MAG: Modeled Available Groundwater for the Gulf Coast Aquifer System in Groundwater Management Area 15 March 22, 2017
Page 12 of 16
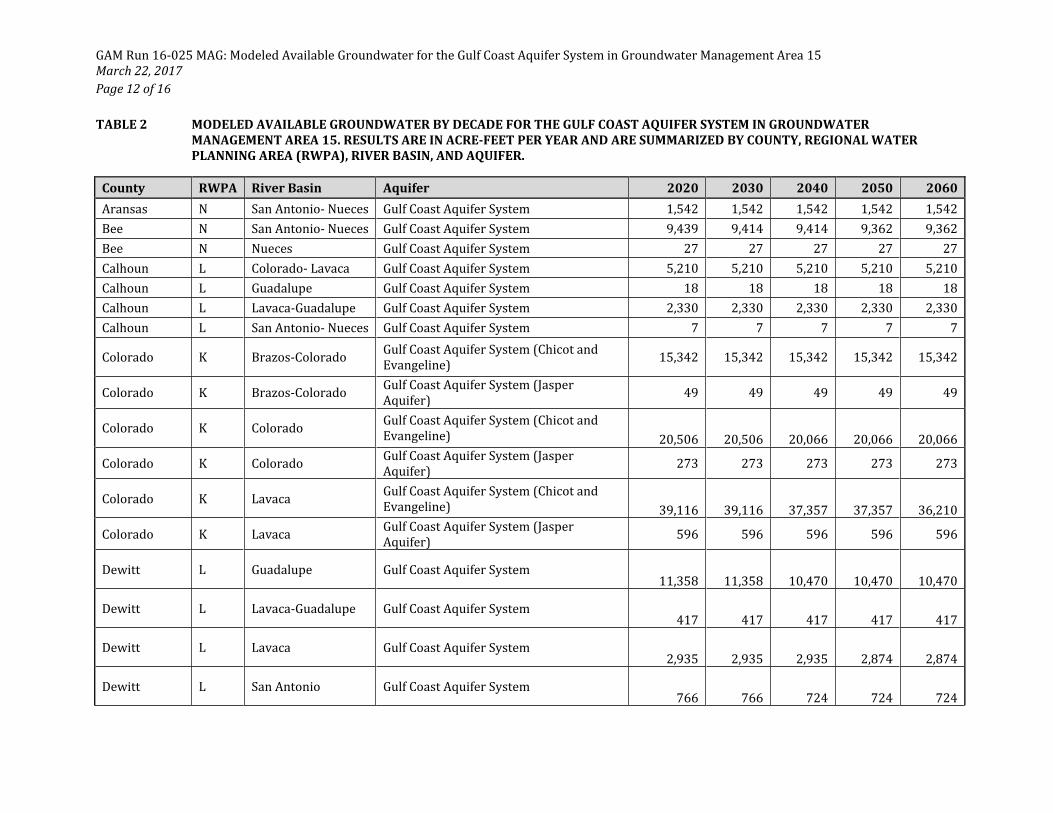
TABLE 2 MODELED AVAILABLE GROUNDWATER BY DECADE FOR THE GULF COAST AQUIFER SYSTEM IN GROUNDWATER MANAGEMENT AREA 15. RESULTS ARE IN ACRE-FEET PER YEAR AND ARE SUMMARIZED BY COUNTY, REGIONAL WATER PLANNING AREA (RWPA), RIVER BASIN, AND AQUIFER.
County RWPA River Basin Aquifer 2020 2030 2040 2050 2060
Aransas N San Antonio- Nueces Gulf Coast Aquifer System 1,542 1,542 1,542 1,542 1,542
Bee N San Antonio- Nueces Gulf Coast Aquifer System 9,439 9,414 9,414 9,362 9,362
Bee N Nueces Gulf Coast Aquifer System 27 27 27 27 27
Calhoun L Colorado- Lavaca Gulf Coast Aquifer System 5,210 5,210 5,210 5,210 5,210
Calhoun L Guadalupe Gulf Coast Aquifer System 18 18 18 18 18
Calhoun L Lavaca-Guadalupe Gulf Coast Aquifer System 2,330 2,330 2,330 2,330 2,330
Calhoun L San Antonio- Nueces Gulf Coast Aquifer System 7 7 7 7 7
Colorado K Brazos-Colorado Gulf Coast Aquifer System (Chicot and Evangeline)
15,342 15,342 15,342 15,342 15,342
Colorado K Brazos-Colorado Gulf Coast Aquifer System (Jasper Aquifer)
49 49 49 49 49
Colorado K Colorado Gulf Coast Aquifer System (Chicot and Evangeline) 20,506 20,506 20,066 20,066 20,066
Colorado K Colorado Gulf Coast Aquifer System (Jasper Aquifer)
273 273 273 273 273
Colorado K Lavaca Gulf Coast Aquifer System (Chicot and Evangeline) 39,116 39,116 37,357 37,357 36,210
Colorado K Lavaca Gulf Coast Aquifer System (Jasper Aquifer)
596 596 596 596 596
Dewitt L Guadalupe Gulf Coast Aquifer System 11,358 11,358 10,470 10,470 10,470
Dewitt L Lavaca-Guadalupe Gulf Coast Aquifer System 417 417 417 417 417
Dewitt L Lavaca Gulf Coast Aquifer System 2,935 2,935 2,935 2,874 2,874
Dewitt L San Antonio Gulf Coast Aquifer System 766 766 724 724 724

GAM Run 16-025 MAG: Modeled Available Groundwater for the Gulf Coast Aquifer System in Groundwater Management Area 15 March 22, 2017
Page 13 of 16
County RWPA River Basin Aquifer 2020 2030 2040 2050 2060
Fayette K Brazos Gulf Coast Aquifer System 2 2 2 2 2
Fayette K Colorado Gulf Coast Aquifer System 989 989 989 989 989
Fayette K Lavaca Gulf Coast Aquifer System 862 862 862 862 862
Goliad L Guadalupe Gulf Coast Aquifer System 4,377 4,377 4,377 4,377 4,380
Goliad L San Antonio- Nueces Gulf Coast Aquifer System 1,190 1,190 1,190 1,190 1,195
Goliad L San Antonio Gulf Coast Aquifer System 5,972 5,972 5,972 5,972 5,977
Jackson P Colorado-Lavaca Gulf Coast Aquifer System 28,025 28,025 28,025 28,025 28,025
Jackson P Lavaca-Guadalupe Gulf Coast Aquifer System 12,875 12,875 12,875 12,875 12,875
Jackson P Lavaca Gulf Coast Aquifer System 49,582 49,582 49,582 49,582 49,582
Karnes L Guadalupe Gulf Coast Aquifer System 11 11 11 11 11
Karnes L Nueces Gulf Coast Aquifer System 1,057 1,057 78 78 78
Karnes L San Antonio Gulf Coast Aquifer System 9,082 9,082 2,880 2,782 2,616
Karnes L San Antonio-Nueces Gulf Coast Aquifer System 46 46 46 46 46
Lavaca P Guadalupe Gulf Coast Aquifer System 41 41 41 41 41
Lavaca P Lavaca-Guadalupe Gulf Coast Aquifer System 401 401 401 401 401
Lavaca P Lavaca Gulf Coast Aquifer System 19,811 19,811 19,811 19,811 19,811
Matagorda K Brazos-Colorado Gulf Coast Aquifer System (Chicot and Evangeline)
15,282 15,282 15,282 15,282 15,282
Matagorda K Colorado-Lavaca Gulf Coast Aquifer System (Chicot and Evangeline)
20,329 20,329 20,329 20,329 20,329
Matagorda K Colorado Gulf Coast Aquifer System (Chicot and Evangeline)
3,217 3,217 3,217 3,217 3,217
Refugio L San Antonio- Nueces Jasper Aquifer 5,526 5,526 5,526 5,526 5,526
Refugio L San Antonio Gulf Coast Aquifer System 321 321 321 321 321
Victoria L Guadalupe Gulf Coast Aquifer System 17,600 22,596 27,592 27,592 27,592
Victoria L Lavaca-Guadalupe Gulf Coast Aquifer System 25,451 25,451 25,451 25,451 30,448
Victoria L Lavaca Gulf Coast Aquifer System 234 234 234 234 234
Victoria L San Antonio Gulf Coast Aquifer System 1,689 1,689 1,689 1,689 1,689
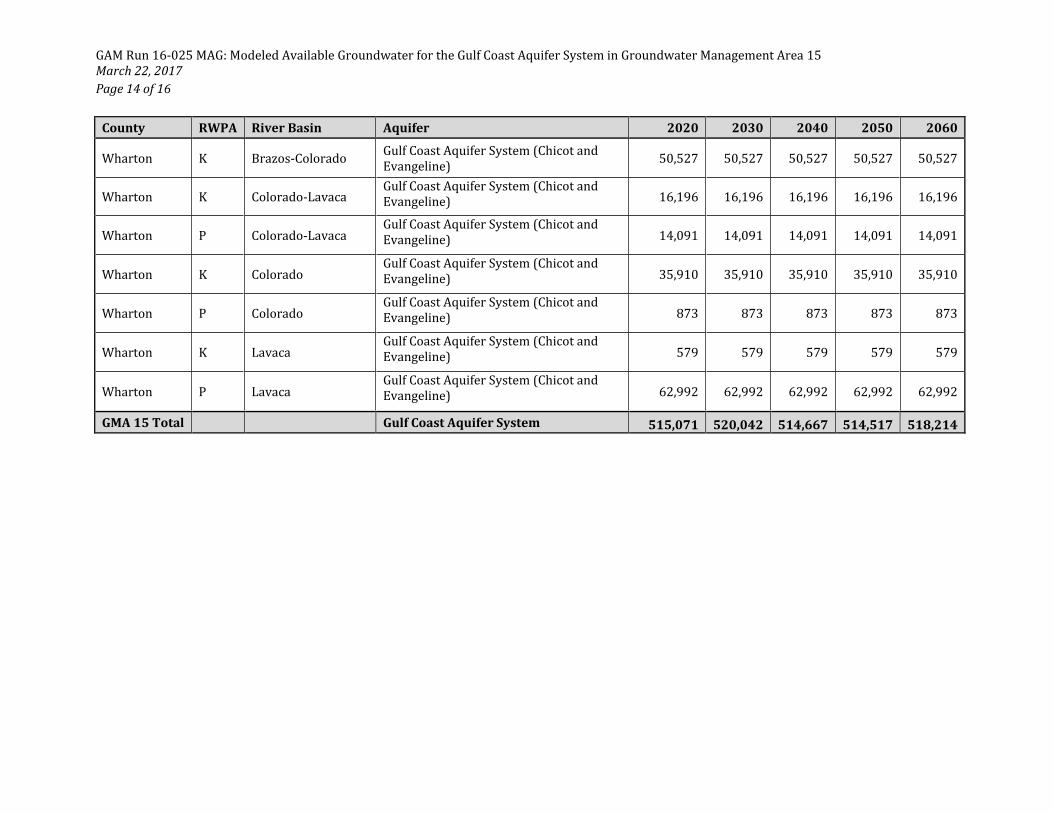
GAM Run 16-025 MAG: Modeled Available Groundwater for the Gulf Coast Aquifer System in Groundwater Management Area 15 March 22, 2017
Page 14 of 16
County RWPA River Basin Aquifer 2020 2030 2040 2050 2060
Wharton K Brazos-Colorado Gulf Coast Aquifer System (Chicot and Evangeline)
50,527 50,527 50,527 50,527 50,527
Wharton K Colorado-Lavaca Gulf Coast Aquifer System (Chicot and Evangeline) 16,196 16,196 16,196 16,196 16,196
Wharton P Colorado-Lavaca Gulf Coast Aquifer System (Chicot and Evangeline) 14,091 14,091 14,091 14,091 14,091
Wharton K Colorado Gulf Coast Aquifer System (Chicot and Evangeline) 35,910 35,910 35,910 35,910 35,910
Wharton P Colorado Gulf Coast Aquifer System (Chicot and Evangeline) 873 873 873 873 873
Wharton K Lavaca Gulf Coast Aquifer System (Chicot and Evangeline) 579 579 579 579 579
Wharton P Lavaca Gulf Coast Aquifer System (Chicot and Evangeline) 62,992 62,992 62,992 62,992 62,992
GMA 15 Total Gulf Coast Aquifer System 515,071 520,042 514,667 514,517 518,214

GAM Run 16-025 MAG: Modeled Available Groundwater for the Gulf Coast Aquifer System in Groundwater Management Area 15 March 22, 2017
Page 15 of 16
LIMITATIONS:
The groundwater model used in completing this analysis is the best available scientific tool
that can be used to meet the stated objectives. To the extent that this analysis will be used
for planning purposes and/or regulatory purposes related to pumping in the past and into
the future, it is important to recognize the assumptions and limitations associated with the
use of the results. In reviewing the use of models in environmental regulatory decision
making, the National Research Council (2007) noted:
“Models will always be constrained by computational limitations, assumptions, and knowledge gaps. They can best be viewed as tools to help inform decisions rather than as machines to generate truth or make decisions. Scientific advances will never make it possible to build a perfect model that accounts for every aspect of reality or to prove that a given model is correct in all respects for a particular regulatory application. These characteristics make evaluation of a regulatory model more complex than solely a comparison of measurement data with model results.”
A key aspect of using the groundwater model to evaluate historic groundwater flow
conditions includes the assumptions about the location in the aquifer where historic
pumping was placed. Understanding the amount and location of historic pumping is as
important as evaluating the volume of groundwater flow into and out of the district,
between aquifers within the district (as applicable), interactions with surface water (as
applicable), recharge to the aquifer system (as applicable), and other metrics that describe
the impacts of that pumping. In addition, assumptions regarding precipitation, recharge,
and streamflow are specific to a particular historic time period.
Because the application of the groundwater model was designed to address regional scale
questions, the results are most effective on a regional scale. The TWDB makes no
warranties or representations relating to the actual conditions of any aquifer at a particular
location or at a particular time.
It is important for groundwater conservation districts to monitor groundwater pumping
and groundwater levels in the aquifer. Because of the limitations of the groundwater model
and the assumptions in this analysis, it is important that the groundwater conservation
districts work with the TWDB to refine this analysis in the future given the reality of how
the aquifer responds to the actual amount and location of pumping now and in the future.
Historic precipitation patterns also need to be placed in context as future climatic
conditions, such as dry and wet year precipitation patterns, may differ and affect
groundwater flow conditions.

GAM Run 16-025 MAG: Modeled Available Groundwater for the Gulf Coast Aquifer System in Groundwater Management Area 15 March 22, 2017
Page 16 of 16
REFERENCES:
Chowdhury, A., Wade, S., Mace, R.E., and Ridgeway, C. 2004. Groundwater Availability of the Central Gulf Coast Aquifer System: Numerical Simulations through 1999: Texas Water Development Board, unpublished report.
Harbaugh, A. W., 2009, Zonebudget Version 3.01, A computer program for computing subregional water budgets for MODFLOW ground-water flow models, U.S. Geological Survey Groundwater Software.
Harbaugh, A.W. and McDonald, M.G., 1996, User’s documentation for MODFLOW-96, an update to the U.S. Geological Survey Modular Finite-Difference Ground-Water Flow Model: U.S. Geological Survey, Open-File Report 96-485.
National Research Council, 2007, Models in Environmental Regulatory Decision Making Committee on Models in the Regulatory Decision Process, National Academies Press, Washington D.C., 287 p., http://www.nap.edu/catalog.php?record_id=11972.
Texas Water Code, 2011, http://www.statutes.legis.state.tx.us/docs/WA/pdf/WA.36.pdf.
Waterstone Engineering, Inc., and Parsons, Inc., 2003, Groundwater Availability of the Central Gulf Coast Aquifer: Numerical Simulations to 2050, Central Gulf Coast, Texas: Contract draft report submitted to Texas Water Development Board