calibration of a crr model based on an expanded spt...
TRANSCRIPT
Engineering Geology 196 (2015) 305–312
Contents lists available at ScienceDirect
Engineering Geology
j ourna l homepage: www.e lsev ie r .com/ locate /enggeo
Technical note
Calibration of a CRRmodel based on an expanded SPT-based database forassessing soil liquefaction potential
Guoxing Chen a,b,⁎, Lingyu Xu a,b, Mengyun Kong a,b, Xiaojun Li a,c
a Institute of Geotechnical Engineering, Nanjing Tech University, Nanjing 210009, Chinab Civil Engineering and Earthquake Disaster Prevention Center of Jiangsu Province, Nanjing 210009, Chinac Institute of Geophysics, China Earthquake Administration, Beijing 100081, China
⁎ Corresponding author at: Institute of GeotechnicUniversity, Nanjing 210009, China.
E-mail address: [email protected] (G. Chen).
http://dx.doi.org/10.1016/j.enggeo.2015.08.0020013-7952/© 2015 Elsevier B.V. All rights reserved.
a b s t r a c t
a r t i c l e i n f oArticle history:Received 3 November 2014Received in revised form 28 July 2015Accepted 1 August 2015Available online 5 August 2015
Keywords:Soil liquefaction potentialDeterministic assessmentProbabilistic assessmentLiquefaction triggering correlationExpanded SPT-based database
A new calibrated empirical liquefaction triggering correlation equation with five parameters determined by trialand error is derived from the expanded SPT-based database of the Idriss and Boulanger (2010) and Xie (1984)case histories. The new calibrated correlation equation is reasonably conservative for the expanded SPT-baseddatabase and is insensitive to reasonable variations in the components of the liquefaction analysis frameworkadopted in this study. In addition, a probabilistic version of the new calibrated correlation equation expressedin the form of a mapping function that relates the liquefaction probability to a nominal safety factor obtainedusing the weighted maximum likelihood technique is verified using a weighted empirical probability approachand Monte Carlo simulations. Liquefaction, transition and non-liquefaction zones for clean sands are definedbased on different probability contours, i.e., empirical correlations with different liquefaction probabilities.Liquefaction triggering correlations for liquefaction probabilities of 4%, 15% and 25% represent the very low,low, and moderate probability events, respectively, of a liquefiable soil being mistaken for a non-liquefiablesoil in the liquefaction potential evaluation.
© 2015 Elsevier B.V. All rights reserved.
1. Introduction
A certain amount of soil liquefaction has often been observedduring major seismic events. Soil liquefaction has caused seriousdamage to buildings and infrastructure as well as loss of life, espe-cially when coastal natural or backfilled soils have liquefied, as inthe 1964 Niigata earthquake (Ohsaki, 1966), the 1995 Hyogoken-Nanbu earthquake (Sitar, 1995), the 2011 Christchurch earthquake(Yamada et al., 2011) and the 2011 Great East Japan Earthquake(Bhattacharya et al., 2011). Therefore, soil liquefaction is one of theprimary seismic geological disasters that has attracted a great dealof attention in the area of evaluating the seismic safety of civilprojects. These cases of liquefaction raise concerns regarding theliquefaction of saturated soil.
The most commonly accepted and widely used method for evaluat-ing soil liquefaction potential is the simplified procedure pioneered bySeed and Idriss (1971). The simplified procedure is generally expressedin terms of a deterministic model and was developed using empirical
al Engineering, Nanjing Tech
evaluations of field observations, field and laboratory tests, and a strongtheoretical basis (Youd et al., 2001; Juang et al., 2012). Later updates ofthis simplified procedure relied almost entirely on case histories involv-ing liquefaction or non-liquefaction (Seed, 1979, 1987; Seed et al., 1983,1985; Youd et al., 2001; Cetin et al., 2002, 2004; Idriss and Boulanger,2004, 2008, 2010; Boulanger and Idriss, 2012). Although the simplifiedprocedure is widely used in practice, it lacks case history data fromChinese earthquakes that occurred prior to 1980, such as the 1976Tangshan earthquake. However, these prior simplified proceduresrepresent excellent research efforts and provide the best types of exam-ples; no perfect empirical relationship for determining or evaluating thepotential for soil liquefaction exists, and each empirical relationship isalways open to improvement based on updated data. In this study, thedata from Chinese earthquakes prior to 1980 are used to update the l-iquefaction case history database published by Idriss and Boulanger(2010).
Recently, probabilistic analyses have been used in assessments of asoil's liquefaction potential that consider uncertainty in the model,and certain researchers have developed a probabilistic model usingthemaximum likelihood principlewith anupdated database of case his-tories (Cetin et al., 2002, 2004; Idriss and Boulanger, 2010; Boulangerand Idriss, 2012; Juang et al., 2012, 2013). In a similar way, Cetin et al.(2004) and Boulanger and Idriss (2012) have developed a probabilistic

306 G. Chen et al. / Engineering Geology 196 (2015) 305–312
model for the Idriss and Boulanger (2004, 2008) liquefaction triggeringcorrelation equation. It is expressed by Eq. (1):
PL ¼ 1−Φln Fs þ 0:13
0:13
� �
¼ Φ −N1ð Þ60CS14:1
þ N1ð Þ60CS126
� �2
−N1ð Þ60CS23:6
� �3
þ N1ð Þ60CS25:4
� �4
−2:67−ln CSRð Þ" #�
0:13
!
ð1Þ
where Φ is the cumulative standard normal distribution function; PL isthe liquefaction probability; FS is the anti-liquefaction safety factordefined as the ratio of the cyclic resistance ratio (CRR) to the cyclic stressratio (CSR); and (N1)60CS is the equivalent SPT blow count for clean sand.In this paper, unless otherwise stated, all of the equations are for(N1)60CS.
Fig. 1 shows the liquefaction triggering correlations for liquefactionprobabilities of 15%, 50%, and 85% in the Boulanger and Idriss (2012)model and points from the case histories in the Idriss and Boulanger(2010) database. The input parameters are treated as random variablesin the Boulanger and Idriss (2012) model, and, therefore, the parame-ters of the CRR and the CSR and the FS are also random variables. UnlikeBoulanger and Idriss (2012), Juang et al. (2012, 2013) express PL as afunction of the ~FS, i.e., a fixed value defined as the ratio of the nominalcyclic resistance ratio (C~RR) to the nominal cyclic stress ratio (C~SR).Therefore, Eq. (1) is equivalent to Eq. (2), which was given by Juanget al. (2013):
PL ¼ Φ−
~N1
� �60CS
þ ε
14:1þ
~N1
� �60CS
þ ε
126
0@
1A
2
−~N1
� �60CS
þ ε
23:6
0@
1A
3
þ~N1
� �60CS
þ ε
25:4
0@
1A
4264
−2:67− ln C~SR� �
þ ei=0:13
0BBBB@
1CCCCA
ð2Þ
where ε and e are the uncertainties of (N1)60CS and lnCSR, respectively.Boulanger and Idriss (2012) suggested that ε should be taken as a nor-mal random variable with a zero mean and a standard deviationbetween 0.15 (Ñ1)60CS and 0.2 (Ñ1)60CS, while e is taken as a normal ran-dom variable with a zero mean and a standard deviation between 0.15and 0.25.
Because of the complexity of the Boulanger and Idriss (2012) prob-abilisticmodel, Juang et al. (2012, 2013) derived a simplified probabilis-tic model in terms of PL and the nominal safety factor (~Fs) for the Idrissand Boulanger (2004, 2008) liquefaction triggering correlation equation
Fig. 1. The liquefaction triggering correlation equations of Boulanger and Idriss (2012) forliquefaction probabilities of 15%, 50%, and 85% compared with data from the Idriss andBoulanger (2010) case history database.Revised using the Idriss and Boulanger case history database (2010) and Eq. (1).
using the weighted maximum likelihood technique, as expressedby Eq. (3):
PL ¼ 1
1þ exp a � ~Fs−b� �h i ð3Þ
where a and b are themodel parameters. The values of a and b are 7.545and 0.952 (Juang et al., 2012) and 7.612 and 0.898 (Juang et al., 2013),respectively.
The Idriss and Boulanger (2004, 2008) liquefaction triggering corre-lation equation is equivalent to Juang et al. (2012 and 2013) modelswith liquefaction probabilities of 41.0% and 31.5% when ~Fs ¼ 1:0 issubstituted into Eq. (3). Therefore, Juang et al. (2012 and 2013) modelscorresponding to the Idriss and Boulanger (2004, 2008) liquefactiontriggering correlation equation might be reasonable to use in commoncivil projectswith low tomediumpotential risk levels but are dangerousand unacceptable for enormously complex civil projects that have ex-tremely high risk potential. Therefore, it is necessary to re-calibratethe CRR model using the expanded SPT-based case history databasesuch that it has a very low probability of mistaking liquefiable soil fornon-liquefiable soil when the liquefaction potential of soil sites isevaluated for projects with different potential risk levels.
2. A new calibration of the empirical liquefaction triggeringcorrelation equation
2.1. The liquefaction case history database
Both the Idriss and Boulanger (2010) and theXie (1984) case historydatabases are used in this study. The total number of cases in the up-dated Idriss and Boulanger (2010) database is 230 of which 115 caseshave surface evidence of liquefaction, 112 cases have no surfaceevidence of liquefaction, and 3 cases are on the border between lique-faction and non-liquefaction. The total number of case histories in theXie (1984) database (see Table 1) is 155 of which 94 cases have surfaceevidence of liquefaction, and 61 cases have no surface evidence ofliquefaction.
The Xie (1984) database includes the SPT-based case history datafrom the Chinese code for the Seismic Design of Buildings (TJ11-74)and from the 1975 Haicheng and 1976 Tangshan earthquakes. Itincludes data from seven strong earthquakes that occurred in China be-tween 1962 and 1976 (Xie, 1979; Seed et al., 1983, 1985). The results ofevaluating the soil liquefaction potential using Xie's empirical equation(Xie, 1979; Ishihara, 1985) have been incorporated into the Chinesecode (TJ11-74), and the results of Seed's simplified procedure aregenerally in excellent agreement with them (Seed et al., 1983, 1985).Additionally, the reliability of Xie's empirical equation has been verifiedusing case history data from the 1975 Haicheng and 1976 Tangshanearthquakes (Xie, 1984), and the updated Xie (1984) equation waslater incorporated into updated versions of the Chinese code (GBJ11-89, GB5001-2001, GB5001-2010).
According to Xie (1984), most of the sands in the database are fineand silty. Unfortunately, the database lacks plausibility for the fine con-tent of the sands, the effective overburden stress, and themomentmag-nitude. In this study, the fine content (FC) is set to 5%. During thecalculation of the total and effective overburden stress in the CSR andthe CRR equations for the Xie (1984) case histories, theweight densitiesof the soils above and below the ground water level are set to 20 kN/m3
and 18.5 kN/m3, respectively. In the original case history data, themagnitudes of the earthquakes were measured using the Richter scale(Xie, 1984). The moment magnitudes are available only for the 1975Haicheng earthquake (Mw = 7.0) and the 1976 Tangshan earthquake(Mw = 7.6); the other five earthquakes are considered in terms oftheir moment magnitudes in this study.
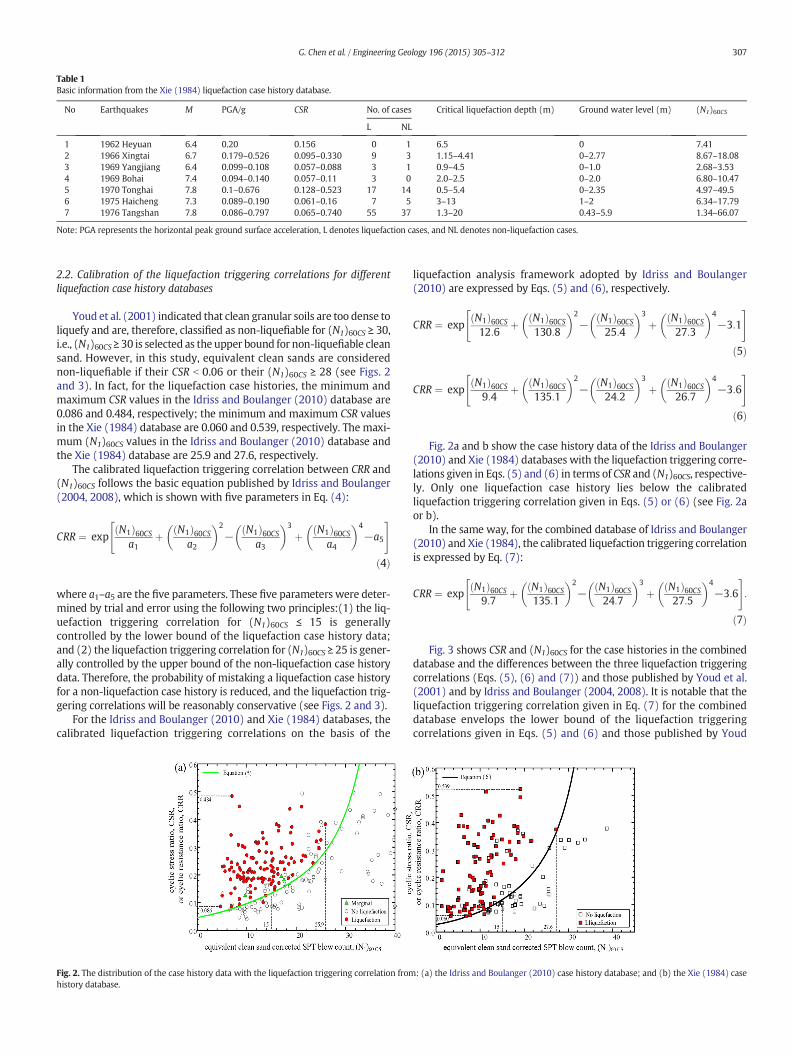
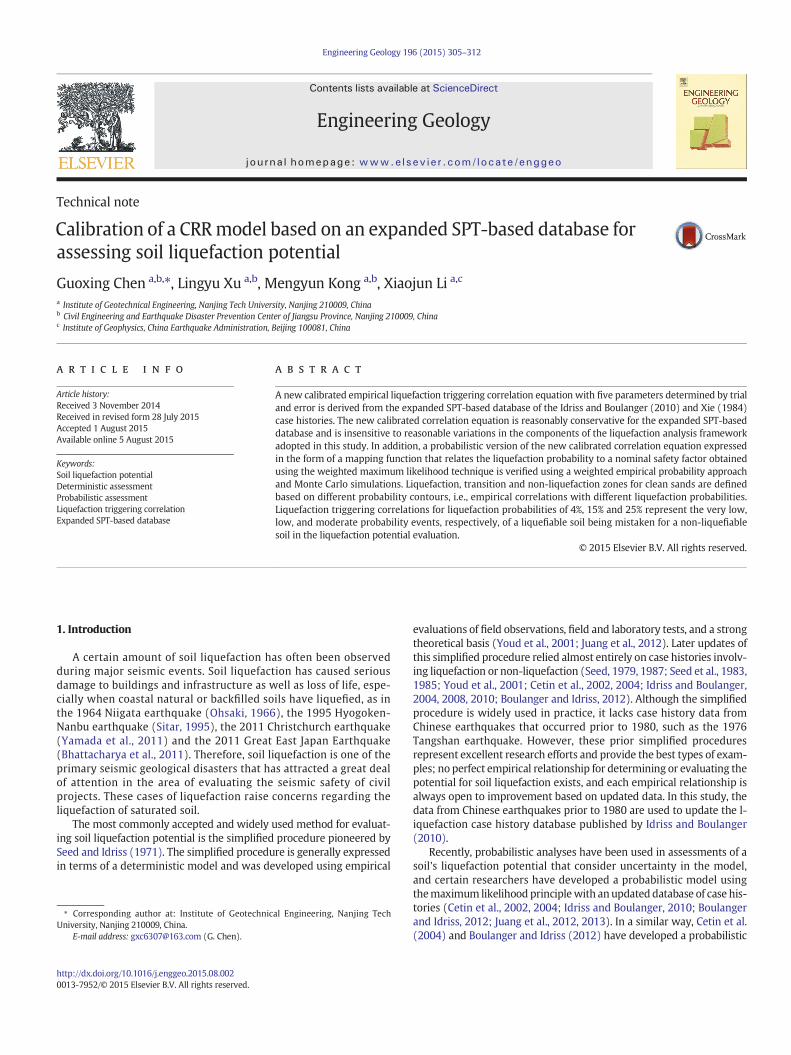
Table 1Basic information from the Xie (1984) liquefaction case history database.
No Earthquakes M PGA/g CSR No. of cases Critical liquefaction depth (m) Ground water level (m) (N1)60CS
L NL
1 1962 Heyuan 6.4 0.20 0.156 0 1 6.5 0 7.412 1966 Xingtai 6.7 0.179–0.526 0.095–0.330 9 3 1.15–4.41 0–2.77 8.67–18.083 1969 Yangjiang 6.4 0.099–0.108 0.057–0.088 3 1 0.9–4.5 0–1.0 2.68–3.534 1969 Bohai 7.4 0.094–0.140 0.057–0.11 3 0 2.0–2.5 0–2.0 6.80–10.475 1970 Tonghai 7.8 0.1–0.676 0.128–0.523 17 14 0.5–5.4 0–2.35 4.97–49.56 1975 Haicheng 7.3 0.089–0.190 0.061–0.16 7 5 3–13 1–2 6.34–17.797 1976 Tangshan 7.8 0.086–0.797 0.065–0.740 55 37 1.3–20 0.43–5.9 1.34–66.07
Note: PGA represents the horizontal peak ground surface acceleration, L denotes liquefaction cases, and NL denotes non-liquefaction cases.
307G. Chen et al. / Engineering Geology 196 (2015) 305–312
2.2. Calibration of the liquefaction triggering correlations for differentliquefaction case history databases
Youd et al. (2001) indicated that clean granular soils are too dense toliquefy and are, therefore, classified as non-liquefiable for (N1)60CS ≥ 30,i.e., (N1)60CS ≥ 30 is selected as the upper bound for non-liquefiable cleansand. However, in this study, equivalent clean sands are considerednon-liquefiable if their CSR b 0.06 or their (N1)60CS ≥ 28 (see Figs. 2and 3). In fact, for the liquefaction case histories, the minimum andmaximum CSR values in the Idriss and Boulanger (2010) database are0.086 and 0.484, respectively; the minimum and maximum CSR valuesin the Xie (1984) database are 0.060 and 0.539, respectively. The maxi-mum (N1)60CS values in the Idriss and Boulanger (2010) database andthe Xie (1984) database are 25.9 and 27.6, respectively.
The calibrated liquefaction triggering correlation between CRR and(N1)60CS follows the basic equation published by Idriss and Boulanger(2004, 2008), which is shown with five parameters in Eq. (4):
CRR ¼ expN1ð Þ60CSa1
þ N1ð Þ60CSa2
� �2
−N1ð Þ60CSa3
� �3
þ N1ð Þ60CSa4
� �4
−a5
" #
ð4Þ
where a1–a5 are the five parameters. These five parameters were deter-mined by trial and error using the following two principles:(1) the liq-uefaction triggering correlation for (N1)60CS ≤ 15 is generallycontrolled by the lower bound of the liquefaction case history data;and (2) the liquefaction triggering correlation for (N1)60CS ≥ 25 is gener-ally controlled by the upper bound of the non-liquefaction case historydata. Therefore, the probability of mistaking a liquefaction case historyfor a non-liquefaction case history is reduced, and the liquefaction trig-gering correlations will be reasonably conservative (see Figs. 2 and 3).
For the Idriss and Boulanger (2010) and Xie (1984) databases, thecalibrated liquefaction triggering correlations on the basis of the
Fig. 2. The distribution of the case history data with the liquefaction triggering correlation fromhistory database.
liquefaction analysis framework adopted by Idriss and Boulanger(2010) are expressed by Eqs. (5) and (6), respectively.
CRR ¼ expN1ð Þ60CS12:6
þ N1ð Þ60CS130:8
� �2
−N1ð Þ60CS25:4
� �3
þ N1ð Þ60CS27:3
� �4
−3:1
" #
ð5Þ
CRR ¼ expN1ð Þ60CS9:4
þ N1ð Þ60CS135:1
� �2
−N1ð Þ60CS24:2
� �3
þ N1ð Þ60CS26:7
� �4
−3:6
" #
ð6Þ
Fig. 2a and b show the case history data of the Idriss and Boulanger(2010) and Xie (1984) databases with the liquefaction triggering corre-lations given in Eqs. (5) and (6) in terms of CSR and (N1)60CS, respective-ly. Only one liquefaction case history lies below the calibratedliquefaction triggering correlation given in Eqs. (5) or (6) (see Fig. 2aor b).
In the same way, for the combined database of Idriss and Boulanger(2010) and Xie (1984), the calibrated liquefaction triggering correlationis expressed by Eq. (7):
CRR ¼ expN1ð Þ60CS9:7
þ N1ð Þ60CS135:1
� �2
−N1ð Þ60CS24:7
� �3
þ N1ð Þ60CS27:5
� �4
−3:6
" #:
ð7Þ
Fig. 3 shows CSR and (N1)60CS for the case histories in the combineddatabase and the differences between the three liquefaction triggeringcorrelations (Eqs. (5), (6) and (7)) and those published by Youd et al.(2001) and by Idriss and Boulanger (2004, 2008). It is notable that theliquefaction triggering correlation given in Eq. (7) for the combineddatabase envelops the lower bound of the liquefaction triggeringcorrelations given in Eqs. (5) and (6) and those published by Youd
: (a) the Idriss and Boulanger (2010) case history database; and (b) the Xie (1984) case
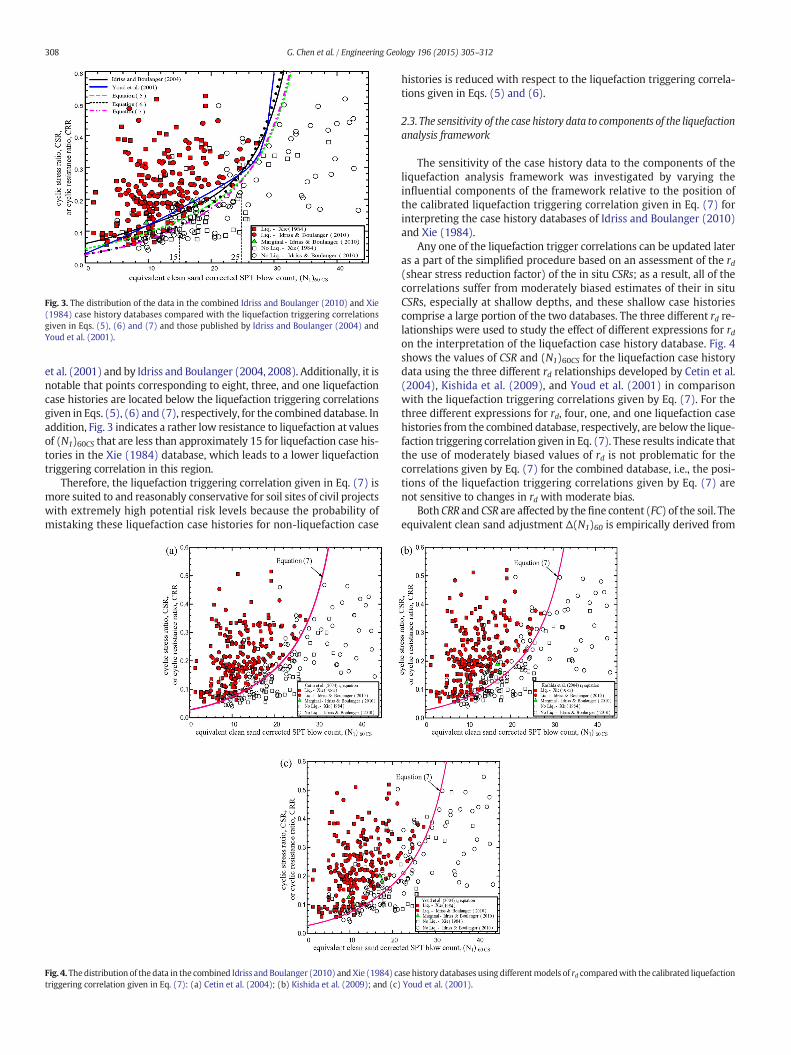
Fig. 3. The distribution of the data in the combined Idriss and Boulanger (2010) and Xie(1984) case history databases compared with the liquefaction triggering correlationsgiven in Eqs. (5), (6) and (7) and those published by Idriss and Boulanger (2004) andYoud et al. (2001).
308 G. Chen et al. / Engineering Geology 196 (2015) 305–312
et al. (2001) and by Idriss and Boulanger (2004, 2008). Additionally, it isnotable that points corresponding to eight, three, and one liquefactioncase histories are located below the liquefaction triggering correlationsgiven in Eqs. (5), (6) and (7), respectively, for the combined database. Inaddition, Fig. 3 indicates a rather low resistance to liquefaction at valuesof (N1)60CS that are less than approximately 15 for liquefaction case his-tories in the Xie (1984) database, which leads to a lower liquefactiontriggering correlation in this region.
Therefore, the liquefaction triggering correlation given in Eq. (7) ismore suited to and reasonably conservative for soil sites of civil projectswith extremely high potential risk levels because the probability ofmistaking these liquefaction case histories for non-liquefaction case
Fig. 4.Thedistribution of thedata in the combined Idriss and Boulanger (2010) andXie (1984) ctriggering correlation given in Eq. (7): (a) Cetin et al. (2004); (b) Kishida et al. (2009); and (c)
histories is reduced with respect to the liquefaction triggering correla-tions given in Eqs. (5) and (6).
2.3. The sensitivity of the case history data to components of the liquefactionanalysis framework
The sensitivity of the case history data to the components of theliquefaction analysis framework was investigated by varying theinfluential components of the framework relative to the position ofthe calibrated liquefaction triggering correlation given in Eq. (7) forinterpreting the case history databases of Idriss and Boulanger (2010)and Xie (1984).
Any one of the liquefaction trigger correlations can be updated lateras a part of the simplified procedure based on an assessment of the rd(shear stress reduction factor) of the in situ CSRs; as a result, all of thecorrelations suffer from moderately biased estimates of their in situCSRs, especially at shallow depths, and these shallow case historiescomprise a large portion of the two databases. The three different rd re-lationships were used to study the effect of different expressions for rdon the interpretation of the liquefaction case history database. Fig. 4shows the values of CSR and (N1)60CS for the liquefaction case historydata using the three different rd relationships developed by Cetin et al.(2004), Kishida et al. (2009), and Youd et al. (2001) in comparisonwith the liquefaction triggering correlations given by Eq. (7). For thethree different expressions for rd, four, one, and one liquefaction casehistories from the combined database, respectively, are below the lique-faction triggering correlation given in Eq. (7). These results indicate thatthe use of moderately biased values of rd is not problematic for thecorrelations given by Eq. (7) for the combined database, i.e., the posi-tions of the liquefaction triggering correlations given by Eq. (7) arenot sensitive to changes in rd with moderate bias.
Both CRR and CSR are affected by the fine content (FC) of the soil. Theequivalent clean sand adjustment Δ(N1)60 is empirically derived from
asehistory databases using differentmodels of rd comparedwith the calibrated liquefactionYoud et al. (2001).

309G. Chen et al. / Engineering Geology 196 (2015) 305–312
the liquefaction case history data and accounts for the effects that FC hason the CRR and the SPT blow count. The effect of using the equivalentclean sand adjustment Δ(N1)60 from the procedures described byYoud et al. (2001) and the Idriss and Boulanger (2010) procedure is an-alyzed. The fine content correction is equivalent to a null adjustment forFC ≤ 5% and reaches a limiting value for FC ≥ 35% (Youd et al., 2001) orFC ≥ 50% (Idriss and Boulanger, 2010). Because the Xie (1984) databaselacks data on thefine contents of the sands, Fig. 5 illustrates the case his-tory data of only sandswith FC N 15% in the Idriss and Boulanger (2010)database using the equations proposed by Idriss and Boulanger (2010)and Youd et al. (2001). Zero liquefaction case histories fall below theliquefaction triggering correlation given in Eq. (7) for the FC given bydifferent equations. These results indicate that the position of thecalibrated liquefaction triggering correlation given in Eq. (7) is notsensitive to the two clean sand adjustment procedures for the Idrissand Boulanger database (2010) used.
Both the expression for the magnitude scaling factor (MSF) derivedby Idriss (1999) and the values of rd depend on the momentmagnitudeMw. Therefore, variations in the earthquake magnitude can affect theMSF and the rd and, therefore, the CSR. Fig. 6 illustrates the Xie (1984)liquefaction case history data for the 1975 Haicheng earthquake andthe 1976 Tangshan earthquake by comparing the Richter magnitudeML and the moment magnitudeMw to the liquefaction triggering corre-lation given in Eq. (7). The comparisons indicate that theuse of the Rich-ter magnitude ML instead of the moment magnitude Mw shifts the casehistory data slightly upward. However, the amount of liquefaction casehistory data below the liquefaction triggering correlation line remainsthe same (only one point) whether the Richter magnitude ML or themoment magnitude Mw is used. This result indicates that the distribu-tion of the data in the Xie (1984) database can be reasonably wellinterpreted using the calibrated liquefaction triggering correlationgiven in Eq. (7) and that the position of the calibrated liquefaction trig-gering correlation given in Eq. (7) is not sensitive to the twomagnitudescales used for the data in the Xie (1984) database.
3. A probabilistic version of the new calibrated liquefactiontriggering correlation equation
Deterministic liquefaction triggering correlations only give a “yes orno” answer to the question of whether soil liquefies. However, liquefac-tion triggering correlations for general project sites cannot and shouldnot envelop all of the liquefaction case histories (Idriss and Boulanger,2010) shown in Fig. 3. Therefore, statistical methods should be used toevaluate the uncertainty in liquefaction triggering correlations.
In this section, probability contour curves for the new calibratedliquefaction triggering correlation given in Eq. (7) for the combineddatabase were determined using the weighted maximum likelihoodtechnique that was initially adopted for a probabilistic liquefaction
Fig. 5. The distribution of the data in the Idriss and Boulanger (2010) case history database for sprocedures to determine Δ(N1)60 compared with the calibrated liquefaction triggering correlat
analysis by Cetin et al. (2004) and verified using theweighted empiricalprobability approach and Monte Carlo simulations (MCS).
3.1. The weighted maximum-likelihood technique and the empiricalprobability approach
The logistic regression model used in the weighted maximum-likelihood technique was suggested by Juang et al. (2002) and Chenand Li (2006); in this model, the probability of liquefaction (PL)corresponding to the nominal safety factor (~Fs) is:
PL ¼ 1
1þ ~Fs=a� �b ; ð8Þ
where a and b are the model parameters.Therefore, the weighted likelihood function (Juang et al., 2012,
2013) is:
L a; b Djð Þ ¼ ∏209
i¼1
1
1þ ~Fs=a� �b
8><>:
9>=>;
wL
� ∏173
j¼11−
1
1þ ~Fs=a� �b
0B@
1CA
8><>:
9>=>;
wNL
; ð9Þ
where D is the combined database. In this paper, D ¼ fðLðiÞ; ~FðiÞS Þ; i ¼1 ; … ; 382g, where L(i) indicates the ith case and L(i) = 1 in the case ofliquefaction and 0 otherwise. The values of wL and wNL are the weightsassigned to liquefaction and non-liquefaction cases, respectively.According to the results of Cetin et al. (2002), the ratio of wNL to wL isusually between 1.5 and 2.0. The use of wNL/wL = 1.5 (i.e., wNL = 1.2and wL = 0.8) for the combined database appears to be reasonable.
For each case in the combined database, the nominal safety factor ~Fsis computed using the deterministic liquefaction triggering correlationgiven in Eq. (7). Therefore, a set of case history data (PL, ~Fs) can be ob-tained using the weighted empirical probability approach describedby Juang et al. (2013), and the empirical relationship of PL and ~Fs canbe graphed.
3.2. Results and discussion
The results of the maximum-likelihood analyses using different ra-tios of wNL to wL are given in Table 2. The models are shown in Fig. 7in the form PL ¼ f ð~FSÞ with different values of the model parameters aand b. As observed, the results of the weighted maximum-likelihoodtechnique are consistent with the empirical liquefaction probabilitydata (see Fig. 7), and theweighted empirical liquefaction probability de-creases slightly as wNL/wL increases. The true value of wNL/wL is un-known; however, wNL/wL = 1.5 was suggested by Cetin et al. (2002),
ands with FC N 15 % reprocessed using the two different equivalent clean sand adjustmention given in Eq. (7): (a) Idriss and Boulanger (2010); and (b) Youd et al. (2001).
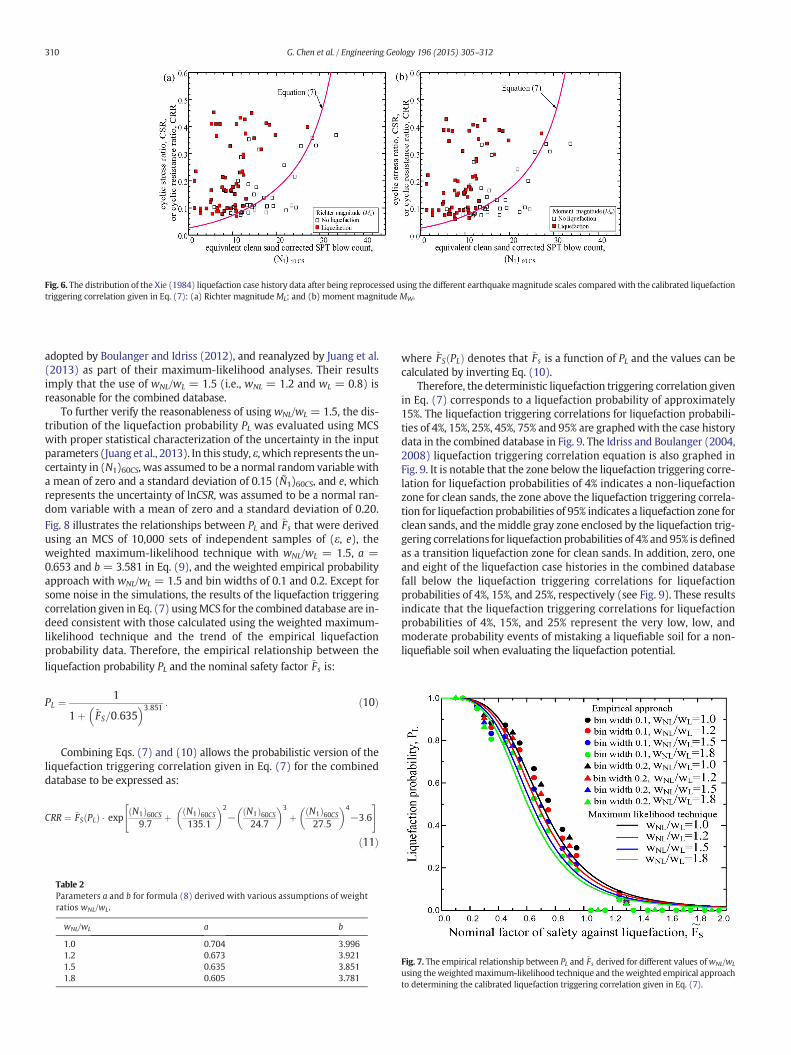
Fig. 6. The distribution of the Xie (1984) liquefaction case history data after being reprocessed using the different earthquakemagnitude scales compared with the calibrated liquefactiontriggering correlation given in Eq. (7): (a) Richter magnitudeML; and (b) moment magnitude MW.
310 G. Chen et al. / Engineering Geology 196 (2015) 305–312
adopted by Boulanger and Idriss (2012), and reanalyzed by Juang et al.(2013) as part of their maximum-likelihood analyses. Their resultsimply that the use of wNL/wL = 1.5 (i.e., wNL = 1.2 and wL = 0.8) isreasonable for the combined database.
To further verify the reasonableness of using wNL/wL = 1.5, the dis-tribution of the liquefaction probability PL was evaluated using MCSwith proper statistical characterization of the uncertainty in the inputparameters (Juang et al., 2013). In this study, ε, which represents theun-certainty in (N1)60CS, was assumed to be a normal random variable witha mean of zero and a standard deviation of 0.15 (Ñ1)60CS, and e, whichrepresents the uncertainty of lnCSR, was assumed to be a normal ran-dom variable with a mean of zero and a standard deviation of 0.20.Fig. 8 illustrates the relationships between PL and ~Fs that were derivedusing an MCS of 10,000 sets of independent samples of (ε, e), theweighted maximum-likelihood technique with wNL/wL = 1.5, a =0.653 and b = 3.581 in Eq. (9), and the weighted empirical probabilityapproach with wNL/wL = 1.5 and bin widths of 0.1 and 0.2. Except forsome noise in the simulations, the results of the liquefaction triggeringcorrelation given in Eq. (7) usingMCS for the combined database are in-deed consistent with those calculated using the weighted maximum-likelihood technique and the trend of the empirical liquefactionprobability data. Therefore, the empirical relationship between theliquefaction probability PL and the nominal safety factor ~Fs is:
PL ¼ 1
1þ ~FS=0:635� �3:851 : ð10Þ
Combining Eqs. (7) and (10) allows the probabilistic version of theliquefaction triggering correlation given in Eq. (7) for the combineddatabase to be expressed as:
CRR ¼ ~FS PLð Þ � exp N1ð Þ60CS9:7
þ N1ð Þ60CS135:1
� �2
−N1ð Þ60CS24:7
� �3
þ N1ð Þ60CS27:5
� �4
−3:6
" #
ð11Þ
Table 2Parameters a and b for formula (8) derived with various assumptions of weightratios wNL/wL.
wNL/wL a b
1.0 0.704 3.9961.2 0.673 3.9211.5 0.635 3.8511.8 0.605 3.781
where ~FSðPLÞ denotes that ~Fs is a function of PL and the values can becalculated by inverting Eq. (10).
Therefore, the deterministic liquefaction triggering correlation givenin Eq. (7) corresponds to a liquefaction probability of approximately15%. The liquefaction triggering correlations for liquefaction probabili-ties of 4%, 15%, 25%, 45%, 75% and 95% are graphed with the case historydata in the combined database in Fig. 9. The Idriss and Boulanger (2004,2008) liquefaction triggering correlation equation is also graphed inFig. 9. It is notable that the zone below the liquefaction triggering corre-lation for liquefaction probabilities of 4% indicates a non-liquefactionzone for clean sands, the zone above the liquefaction triggering correla-tion for liquefaction probabilities of 95% indicates a liquefaction zone forclean sands, and themiddle gray zone enclosed by the liquefaction trig-gering correlations for liquefaction probabilities of 4% and 95% is definedas a transition liquefaction zone for clean sands. In addition, zero, oneand eight of the liquefaction case histories in the combined databasefall below the liquefaction triggering correlations for liquefactionprobabilities of 4%, 15%, and 25%, respectively (see Fig. 9). These resultsindicate that the liquefaction triggering correlations for liquefactionprobabilities of 4%, 15%, and 25% represent the very low, low, andmoderate probability events of mistaking a liquefiable soil for a non-liquefiable soil when evaluating the liquefaction potential.
Fig. 7. The empirical relationship between PL and ~Fs derived for different values ofwNL/wL
using theweightedmaximum-likelihood technique and theweighted empirical approachto determining the calibrated liquefaction triggering correlation given in Eq. (7).
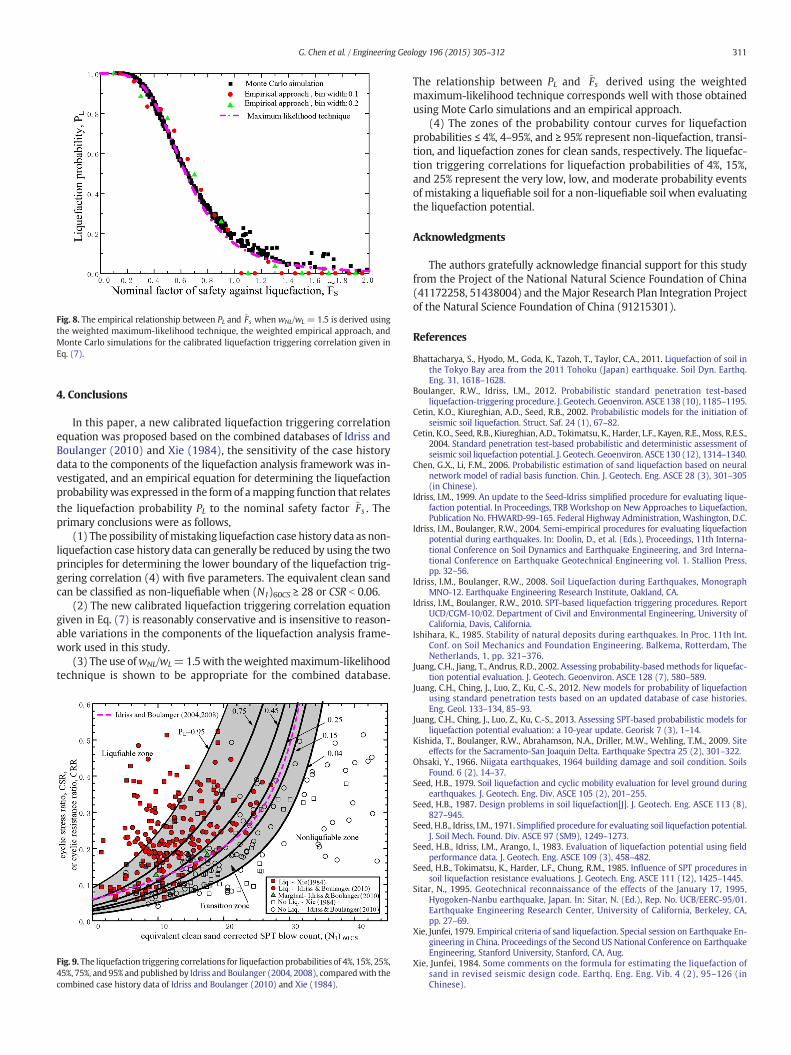
Fig. 8. The empirical relationship between PL and ~Fs when wNL/wL = 1.5 is derived usingthe weighted maximum-likelihood technique, the weighted empirical approach, andMonte Carlo simulations for the calibrated liquefaction triggering correlation given inEq. (7).
311G. Chen et al. / Engineering Geology 196 (2015) 305–312
4. Conclusions
In this paper, a new calibrated liquefaction triggering correlationequation was proposed based on the combined databases of Idriss andBoulanger (2010) and Xie (1984), the sensitivity of the case historydata to the components of the liquefaction analysis framework was in-vestigated, and an empirical equation for determining the liquefactionprobabilitywas expressed in the formof amapping function that relatesthe liquefaction probability PL to the nominal safety factor ~Fs . Theprimary conclusions were as follows,
(1) The possibility ofmistaking liquefaction case history data as non-liquefaction case history data can generally be reduced by using the twoprinciples for determining the lower boundary of the liquefaction trig-gering correlation (4) with five parameters. The equivalent clean sandcan be classified as non-liquefiable when (N1)60CS ≥ 28 or CSR b 0.06.
(2) The new calibrated liquefaction triggering correlation equationgiven in Eq. (7) is reasonably conservative and is insensitive to reason-able variations in the components of the liquefaction analysis frame-work used in this study.
(3) The use ofwNL/wL=1.5with theweightedmaximum-likelihoodtechnique is shown to be appropriate for the combined database.
Fig. 9. The liquefaction triggering correlations for liquefaction probabilities of 4%, 15%, 25%,45%, 75%, and 95% and published by Idriss and Boulanger (2004, 2008), comparedwith thecombined case history data of Idriss and Boulanger (2010) and Xie (1984).
The relationship between PL and ~Fs derived using the weightedmaximum-likelihood technique corresponds well with those obtainedusing Mote Carlo simulations and an empirical approach.
(4) The zones of the probability contour curves for liquefactionprobabilities ≤ 4%, 4–95%, and ≥ 95% represent non-liquefaction, transi-tion, and liquefaction zones for clean sands, respectively. The liquefac-tion triggering correlations for liquefaction probabilities of 4%, 15%,and 25% represent the very low, low, and moderate probability eventsof mistaking a liquefiable soil for a non-liquefiable soil when evaluatingthe liquefaction potential.
Acknowledgments
The authors gratefully acknowledge financial support for this studyfrom the Project of the National Natural Science Foundation of China(41172258, 51438004) and theMajor Research Plan Integration Projectof the Natural Science Foundation of China (91215301).
References
Bhattacharya, S., Hyodo, M., Goda, K., Tazoh, T., Taylor, C.A., 2011. Liquefaction of soil inthe Tokyo Bay area from the 2011 Tohoku (Japan) earthquake. Soil Dyn. Earthq.Eng. 31, 1618–1628.
Boulanger, R.W., Idriss, I.M., 2012. Probabilistic standard penetration test-basedliquefaction-triggering procedure. J. Geotech. Geoenviron. ASCE 138 (10), 1185–1195.
Cetin, K.O., Kiureghian, A.D., Seed, R.B., 2002. Probabilistic models for the initiation ofseismic soil liquefaction. Struct. Saf. 24 (1), 67–82.
Cetin, K.O., Seed, R.B., Kiureghian, A.D., Tokimatsu, K., Harder, L.F., Kayen, R.E., Moss, R.E.S.,2004. Standard penetration test-based probabilistic and deterministic assessment ofseismic soil liquefaction potential. J. Geotech. Geoenviron. ASCE 130 (12), 1314–1340.
Chen, G.X., Li, F.M., 2006. Probabilistic estimation of sand liquefaction based on neuralnetwork model of radial basis function. Chin. J. Geotech. Eng. ASCE 28 (3), 301–305(in Chinese).
Idriss, I.M., 1999. An update to the Seed-Idriss simplified procedure for evaluating lique-faction potential. In Proceedings, TRB Workshop on New Approaches to Liquefaction,Publication No. FHWARD-99-165. Federal Highway Administration,Washington, D.C.
Idriss, I.M., Boulanger, R.W., 2004. Semi-empirical procedures for evaluating liquefactionpotential during earthquakes. In: Doolin, D., et al. (Eds.), Proceedings, 11th Interna-tional Conference on Soil Dynamics and Earthquake Engineering, and 3rd Interna-tional Conference on Earthquake Geotechnical Engineering vol. 1. Stallion Press,pp. 32–56.
Idriss, I.M., Boulanger, R.W., 2008. Soil Liquefaction during Earthquakes, MonographMNO-12. Earthquake Engineering Research Institute, Oakland, CA.
Idriss, I.M., Boulanger, R.W., 2010. SPT-based liquefaction triggering procedures. ReportUCD/CGM-10/02. Department of Civil and Environmental Engineering, University ofCalifornia, Davis, California.
Ishihara, K., 1985. Stability of natural deposits during earthquakes. In Proc. 11th Int.Conf. on Soil Mechanics and Foundation Engineering. Balkema, Rotterdam, TheNetherlands, 1, pp. 321–376.
Juang, C.H., Jiang, T., Andrus, R.D., 2002. Assessing probability-basedmethods for liquefac-tion potential evaluation. J. Geotech. Geoenviron. ASCE 128 (7), 580–589.
Juang, C.H., Ching, J., Luo, Z., Ku, C.-S., 2012. New models for probability of liquefactionusing standard penetration tests based on an updated database of case histories.Eng. Geol. 133–134, 85–93.
Juang, C.H., Ching, J., Luo, Z., Ku, C.-S., 2013. Assessing SPT-based probabilistic models forliquefaction potential evaluation: a 10-year update. Georisk 7 (3), 1–14.
Kishida, T., Boulanger, R.W., Abrahamson, N.A., Driller, M.W., Wehling, T.M., 2009. Siteeffects for the Sacramento-San Joaquin Delta. Earthquake Spectra 25 (2), 301–322.
Ohsaki, Y., 1966. Niigata earthquakes, 1964 building damage and soil condition. SoilsFound. 6 (2), 14–37.
Seed, H.B., 1979. Soil liquefaction and cyclic mobility evaluation for level ground duringearthquakes. J. Geotech. Eng. Div. ASCE 105 (2), 201–255.
Seed, H.B., 1987. Design problems in soil liquefaction[J]. J. Geotech. Eng. ASCE 113 (8),827–945.
Seed, H.B., Idriss, I.M., 1971. Simplified procedure for evaluating soil liquefaction potential.J. Soil Mech. Found. Div. ASCE 97 (SM9), 1249–1273.
Seed, H.B., Idriss, I.M., Arango, I., 1983. Evaluation of liquefaction potential using fieldperformance data. J. Geotech. Eng. ASCE 109 (3), 458–482.
Seed, H.B., Tokimatsu, K., Harder, L.F., Chung, R.M., 1985. Influence of SPT procedures insoil liquefaction resistance evaluations. J. Geotech. Eng. ASCE 111 (12), 1425–1445.
Sitar, N., 1995. Geotechnical reconnaissance of the effects of the January 17, 1995,Hyogoken-Nanbu earthquake, Japan. In: Sitar, N. (Ed.), Rep. No. UCB/EERC-95/01.Earthquake Engineering Research Center, University of California, Berkeley, CA,pp. 27–69.
Xie, Junfei, 1979. Empirical criteria of sand liquefaction. Special session on Earthquake En-gineering in China. Proceedings of the Second US National Conference on EarthquakeEngineering, Stanford University, Stanford, CA, Aug.
Xie, Junfei, 1984. Some comments on the formula for estimating the liquefaction ofsand in revised seismic design code. Earthq. Eng. Eng. Vib. 4 (2), 95–126 (inChinese).

312 G. Chen et al. / Engineering Geology 196 (2015) 305–312
Yamada, S., Orense, R., Cubrinovski, M., 2011. Earthquake news: geotechnical damage dueto the 2011 Christchurch, New Zealand. Int. Soc. Soil Mech. Geotech. Eng. Bull. 5 (2),27–45.
Youd, T.L., Idriss, I.M., Andrus, R.D., Arango, I., Castro, G., Christian, J.T., Dobry, R., Finn,W.D.L., Harder, L.F., Hynes, M.E., Ishihara, K., Koester, J.P., Liao, S.S.C., Marcuson III,
W.F., Martin, G.R., Mitchell, J.K., Moriwaki, Y., Power, M.S., Robertson, P.K., Seed,R.B., Stokoe, K.H., 2001. Liquefaction resistance of soils: summary report from the1996 NCEER and 1998 NCEER/NSFworkshops on evaluation of liquefaction resistanceof soils. J. Geotech. Geoenviron. ASCE 127 (10), 817–833.