calibration of gauge blocks by interferometry final...
TRANSCRIPT

CCL-K1 Final Report 17 janv. 2001 1
Eidgenössisches Amt für MesswesenOffice fédéral de métrologieUfficio federale di metrologiaSwiss Federal Office of Metrology
CCL Key Comparison
CCL-K1
Calibration of gauge blocksby interferometry
Final report
Wabern, November 2000 / R. Thalmann
CCL-K1 Final Report 17 janv. 2001 2
Content
1 Introduction............................................................................................................. 3
2 Organisation............................................................................................................ 3
2.1 Participants.......................................................................................................... 3
2.2 Schedule ............................................................................................................. 5
3 Standards................................................................................................................ 5
4 Measurement instructions and reporting............................................................... 6
5 Measurement methods and instruments used by the participants...................... 7
6 Stability and condition of the gauge blocks .......................................................... 7
7 Measurement results............................................................................................ 10
7.1 Deviation from nominal length, steel gauge blocks........................................ 10
7.2 Deviation from nominal length, tungsten carbide gauge blocks .................... 14
7.3 Difference between left and right wringing...................................................... 18
8 Measurement uncertainties.................................................................................. 19
9 Statistical analysis of the results.......................................................................... 21
9.1 Average deviation and standard deviation...................................................... 21
9.2 Statistical distribution........................................................................................ 22
9.3 Statistical consistency...................................................................................... 23
10 Conclusions .......................................................................................................... 24
11 References ........................................................................................................... 25
Appendix 1: Measurement conditions ........................................................................ 26
Appendix 2: Determination of the reference values.................................................. 27
A2.1 Arithmetic mean ............................................................................................ 27
A2.2 Weighted mean............................................................................................. 27
A2.3 Uncertainty of the difference between results and the reference values.. 28
A2.4 Exclusion of results contributing to the reference values........................... 28
A2.5 Reference values and comparison of the different methods .................... 29
Appendix 3: Comparison with reference value .......................................................... 31
Appendix 4: Transfer of reference values to RMO key comparisons...................... 32
Appendix 5: Results not to be published ................................................................... 33

CCL-K1 Final Report 17 janv. 2001 3
1 Introduction
The metrological equivalence of national measurement standards and of calibrationcertificates issued by national metrology institutes is established by a set of key com-parisons chosen and organized by the Consultative Committees of the CIPM or by theregional metrology organizations in collaboration with the Consultative Committees.
At its meeting in September 1997, the Consultative Committee for Length, CCL, hasdecided upon a key comparison on gauge block measurements by interferometry,named CCL-K1, starting in spring 1998, with the Swiss Federal Office of Metrology(OFMET) as the pilot laboratory.
The results of this international comparison contribute to the mutual recognition ar-rangement (MRA) between the national metrology institutes of the Metre Convention.This CIPM key comparison is combined - where necessary - with regional compari-sons (RMO key comparisons) following exactly the same scheme. Laboratories par-ticipating in both, the CIPM and the RMO comparisons establish the link betweenthese comparisons and assure their equivalence.
2 Organisation
According to the rules set up by the BIPM [1] a small group from the list of participat-ing laboratories has drafted the detailed technical protocols. The group was com-posed of Jennifer Decker from the NRC, Canada, Nicholas Brown from CSIRO/NML,Australia and the pilot laboratory, all experienced in organizing gauge block compari-sons and representing also a regional metrology organisation.
2.1 ParticipantsLaboratoryCode
Contact person, Laboratory Phone, Fax, email
NPL Andrew LewisNPLDimensional MetrologyTeddingtonMiddlesex TW11 OLWEngland
Tel. +44 208 943 61 24Fax +44 208 943 29 45e-mail:[email protected]
LNE Georges VailleauBNM-LNELaboratoire National d’Essais1, rue Gaston BoissierF-75015 ParisFrance
Tel. +33 1 40 43 3777Fax +33 1 40 43 3737e-mail:Georges [email protected]
NRC Jennifer DeckerInstitute for National MeasurementStandardsNational Research Council CanadaOttawa, K1A 0R6Canada
Tel. +1 613 991 1633Fax +1 613 952 1394e-mail:[email protected]
NIST John R. StoupNational Institute of Standards andTechnologyNISTRoom B113, Metrology BuildingGaithersburg, MD 20899-0001USA
Tel. +1 301 975 3476Fax +1 301 869 0822e-mail:[email protected]
CCL-K1 Final Report 17 janv. 2001 4
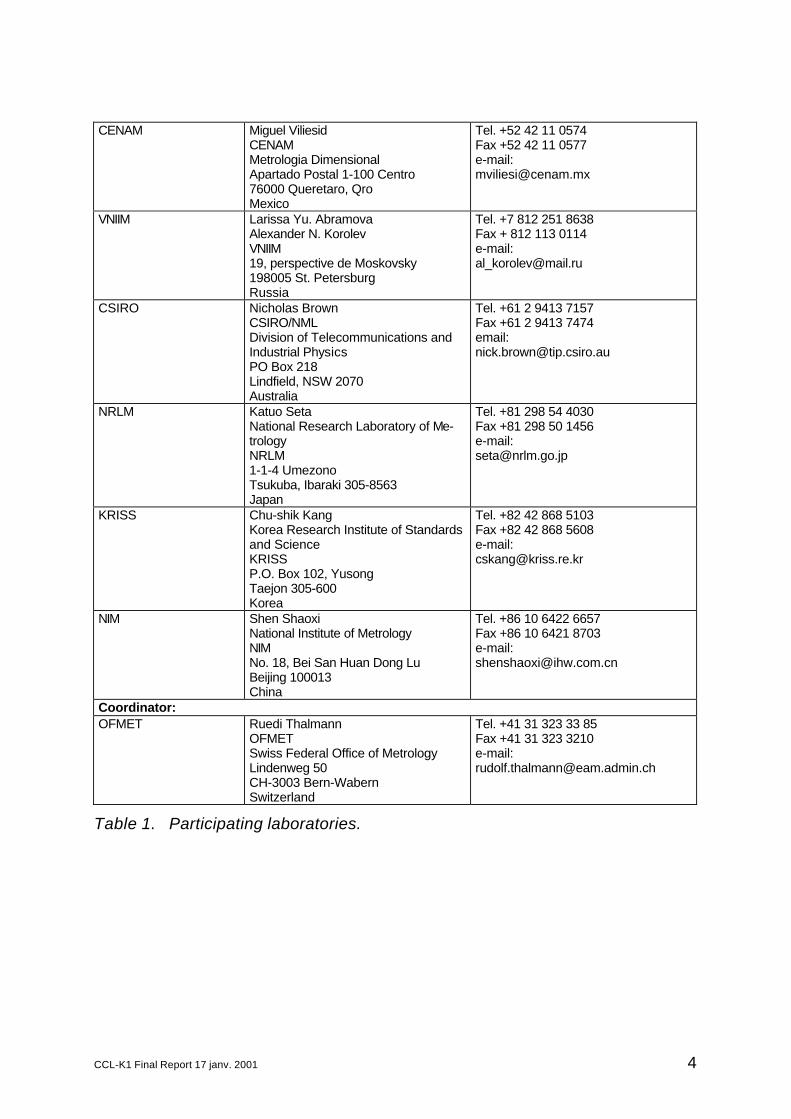
CENAM Miguel ViliesidCENAMMetrologia DimensionalApartado Postal 1-100 Centro76000 Queretaro, QroMexico
Tel. +52 42 11 0574Fax +52 42 11 0577e-mail:[email protected]
VNIIM Larissa Yu. AbramovaAlexander N. KorolevVNIIM19, perspective de Moskovsky198005 St. PetersburgRussia
Tel. +7 812 251 8638Fax + 812 113 0114e-mail:[email protected]
CSIRO Nicholas BrownCSIRO/NMLDivision of Telecommunications andIndustrial PhysicsPO Box 218Lindfield, NSW 2070Australia
Tel. +61 2 9413 7157Fax +61 2 9413 7474email:[email protected]
NRLM Katuo SetaNational Research Laboratory of Me-trologyNRLM1-1-4 UmezonoTsukuba, Ibaraki 305-8563Japan
Tel. +81 298 54 4030Fax +81 298 50 1456e-mail:[email protected]
KRISS Chu-shik KangKorea Research Institute of Standardsand ScienceKRISSP.O. Box 102, YusongTaejon 305-600Korea
Tel. +82 42 868 5103Fax +82 42 868 5608e-mail:[email protected]
NIM Shen ShaoxiNational Institute of MetrologyNIMNo. 18, Bei San Huan Dong LuBeijing 100013China
Tel. +86 10 6422 6657Fax +86 10 6421 8703e-mail:[email protected]
Coordinator:OFMET Ruedi Thalmann
OFMETSwiss Federal Office of MetrologyLindenweg 50CH-3003 Bern-WabernSwitzerland
Tel. +41 31 323 33 85Fax +41 31 323 3210e-mail:[email protected]
Table 1. Participating laboratories.
CCL-K1 Final Report 17 janv. 2001 5
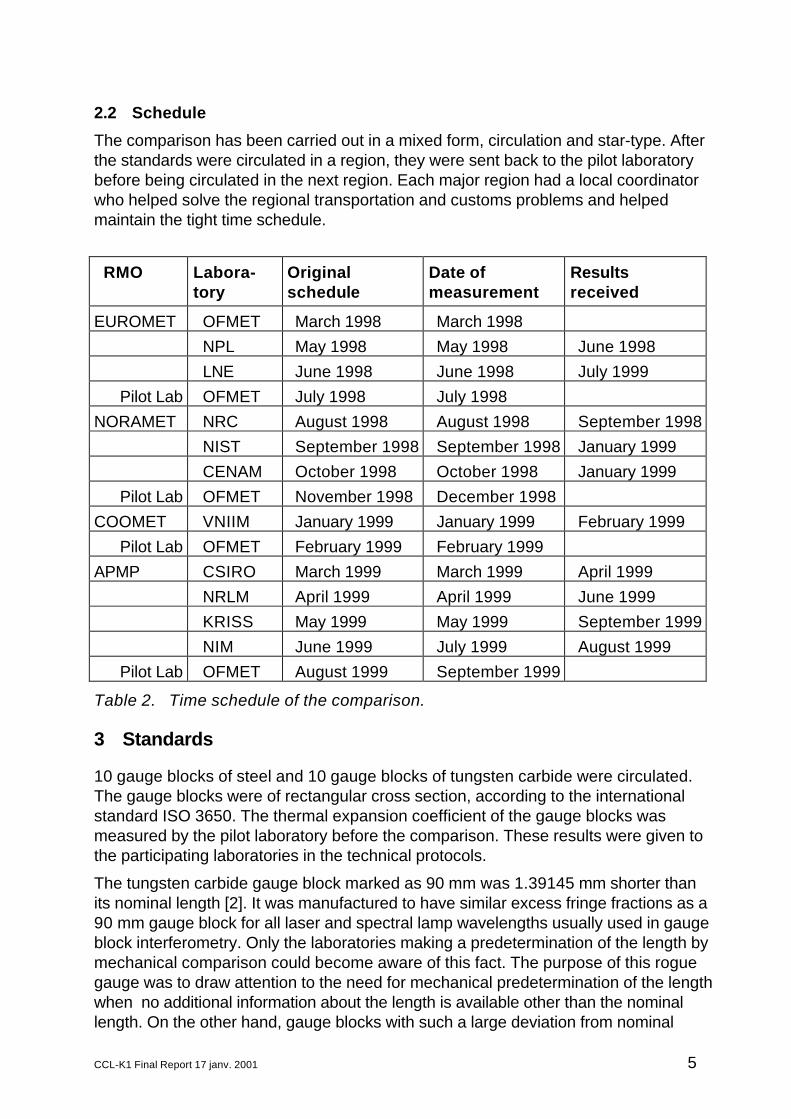
2.2 Schedule
The comparison has been carried out in a mixed form, circulation and star-type. Afterthe standards were circulated in a region, they were sent back to the pilot laboratorybefore being circulated in the next region. Each major region had a local coordinatorwho helped solve the regional transportation and customs problems and helpedmaintain the tight time schedule.
RMO Labora-tory
Originalschedule
Date ofmeasurement
Resultsreceived
EUROMET OFMET March 1998 March 1998NPL May 1998 May 1998 June 1998LNE June 1998 June 1998 July 1999
Pilot Lab OFMET July 1998 July 1998NORAMET NRC August 1998 August 1998 September 1998
NIST September 1998 September 1998 January 1999CENAM October 1998 October 1998 January 1999
Pilot Lab OFMET November 1998 December 1998COOMET VNIIM January 1999 January 1999 February 1999
Pilot Lab OFMET February 1999 February 1999APMP CSIRO March 1999 March 1999 April 1999
NRLM April 1999 April 1999 June 1999KRISS May 1999 May 1999 September 1999NIM June 1999 July 1999 August 1999
Pilot Lab OFMET August 1999 September 1999
Table 2. Time schedule of the comparison.
3 Standards
10 gauge blocks of steel and 10 gauge blocks of tungsten carbide were circulated.The gauge blocks were of rectangular cross section, according to the internationalstandard ISO 3650. The thermal expansion coefficient of the gauge blocks wasmeasured by the pilot laboratory before the comparison. These results were given tothe participating laboratories in the technical protocols.
The tungsten carbide gauge block marked as 90 mm was 1.39145 mm shorter thanits nominal length [2]. It was manufactured to have similar excess fringe fractions as a90 mm gauge block for all laser and spectral lamp wavelengths usually used in gaugeblock interferometry. Only the laboratories making a predetermination of the length bymechanical comparison could become aware of this fact. The purpose of this roguegauge was to draw attention to the need for mechanical predetermination of the lengthwhen no additional information about the length is available other than the nominallength. On the other hand, gauge blocks with such a large deviation from nominal
CCL-K1 Final Report 17 janv. 2001 6
length do not exist in practice, in particular with a length having the same excess fringefractions. Also, the time for measurement allocated to the participants did not alwaysallow for a mechanical comparison, in particular where this would usually be done atanother place. The results for this gauge block do therefore not necessarily representthe measurement capability of the laboratories and are not reported here.
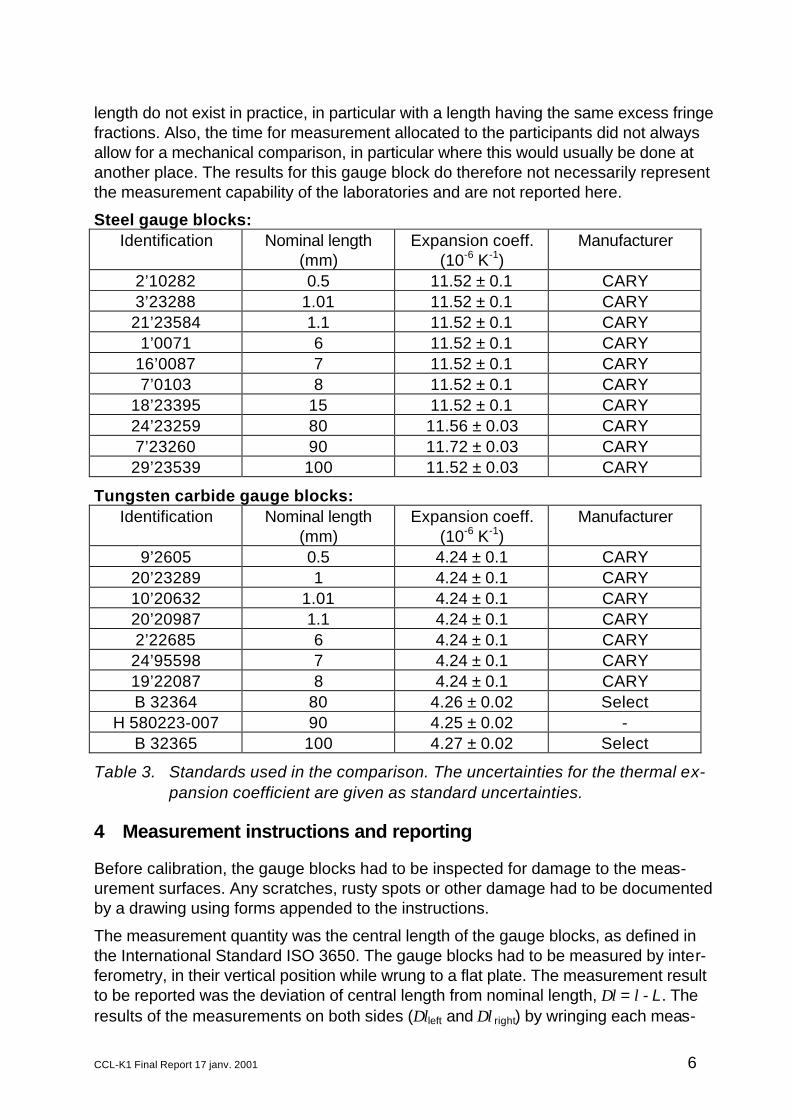
Steel gauge blocks:Identification Nominal length
(mm)Expansion coeff.
(10-6 K-1)Manufacturer
2’10282 0.5 11.52 ± 0.1 CARY3’23288 1.01 11.52 ± 0.1 CARY21’23584 1.1 11.52 ± 0.1 CARY
1’0071 6 11.52 ± 0.1 CARY16’0087 7 11.52 ± 0.1 CARY7’0103 8 11.52 ± 0.1 CARY
18’23395 15 11.52 ± 0.1 CARY24’23259 80 11.56 ± 0.03 CARY7’23260 90 11.72 ± 0.03 CARY29’23539 100 11.52 ± 0.03 CARY
Tungsten carbide gauge blocks:Identification Nominal length
(mm)Expansion coeff.
(10-6 K-1)Manufacturer
9’2605 0.5 4.24 ± 0.1 CARY20’23289 1 4.24 ± 0.1 CARY10’20632 1.01 4.24 ± 0.1 CARY20’20987 1.1 4.24 ± 0.1 CARY2’22685 6 4.24 ± 0.1 CARY24’95598 7 4.24 ± 0.1 CARY19’22087 8 4.24 ± 0.1 CARYB 32364 80 4.26 ± 0.02 Select
H 580223-007 90 4.25 ± 0.02 -B 32365 100 4.27 ± 0.02 Select
Table 3. Standards used in the comparison. The uncertainties for the thermal ex-pansion coefficient are given as standard uncertainties.
4 Measurement instructions and reporting
Before calibration, the gauge blocks had to be inspected for damage to the meas-urement surfaces. Any scratches, rusty spots or other damage had to be documentedby a drawing using forms appended to the instructions.
The measurement quantity was the central length of the gauge blocks, as defined inthe International Standard ISO 3650. The gauge blocks had to be measured by inter-ferometry, in their vertical position while wrung to a flat plate. The measurement resultto be reported was the deviation of central length from nominal length, ∆l = l - L. Theresults of the measurements on both sides (∆lleft and ∆l right) by wringing each meas-
CCL-K1 Final Report 17 janv. 2001 7
urement face in turn to the reference flat and the average of the two wringings had tobe reported. The measurement results had to be corrected to the reference tem-perature of 20°C using the thermal expansion coefficients given above. Additional cor-rections (aperture, phase correction) had to be applied according to the usual proce-dure of the laboratory.
The uncertainty of measurement had to be estimated according to the ISO Guide forthe Expression of Uncertainty in Measurement. In order to achieve optimum compa-rability, a mathematical model [3] containing the principal influence parameters forgauge block calibration by interferometry was given in the technical protocol.
5 Measurement methods and instruments used by the participants
All laboratories have measured the gauge blocks by optical interferometry, applyingthe method of fringe fractions. The instruments used and further details to the meas-urement procedures and conditions are summarized in table A1 in the appendix.
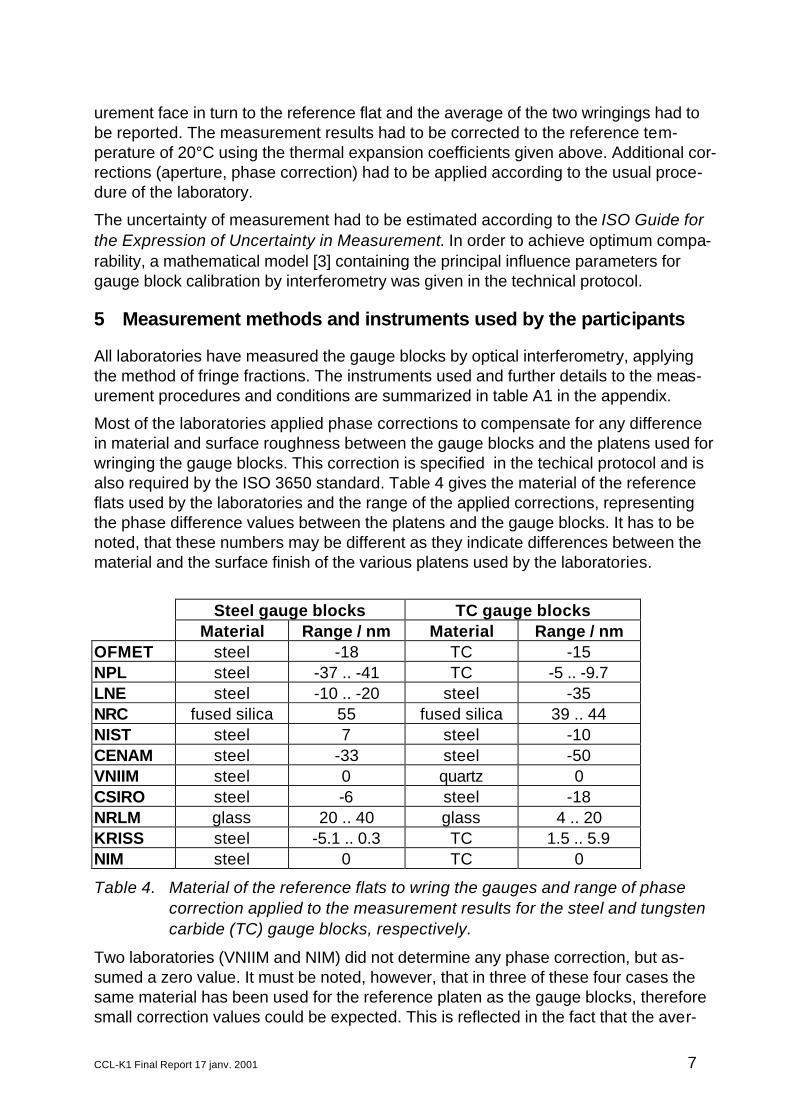
Most of the laboratories applied phase corrections to compensate for any differencein material and surface roughness between the gauge blocks and the platens used forwringing the gauge blocks. This correction is specified in the techical protocol and isalso required by the ISO 3650 standard. Table 4 gives the material of the referenceflats used by the laboratories and the range of the applied corrections, representingthe phase difference values between the platens and the gauge blocks. It has to benoted, that these numbers may be different as they indicate differences between thematerial and the surface finish of the various platens used by the laboratories.
Steel gauge blocks TC gauge blocksMaterial Range / nm Material Range / nm
OFMET steel -18 TC -15NPL steel -37 .. -41 TC -5 .. -9.7LNE steel -10 .. -20 steel -35NRC fused silica 55 fused silica 39 .. 44NIST steel 7 steel -10CENAM steel -33 steel -50VNIIM steel 0 quartz 0CSIRO steel -6 steel -18NRLM glass 20 .. 40 glass 4 .. 20KRISS steel -5.1 .. 0.3 TC 1.5 .. 5.9NIM steel 0 TC 0
Table 4. Material of the reference flats to wring the gauges and range of phasecorrection applied to the measurement results for the steel and tungstencarbide (TC) gauge blocks, respectively.
Two laboratories (VNIIM and NIM) did not determine any phase correction, but as-sumed a zero value. It must be noted, however, that in three of these four cases thesame material has been used for the reference platen as the gauge blocks, thereforesmall correction values could be expected. This is reflected in the fact that the aver-
CCL-K1 Final Report 17 janv. 2001 8
age deviations of NIM for both steel and tungsten carbide, and of VNIIM for steel,were reasonably small. Only the tungsten carbide results of VNIIM were offset bymore than 30 nm from the average of the others, which is obvious, since quartz plat-ens were used.
6 Stability and condition of the gauge blocks
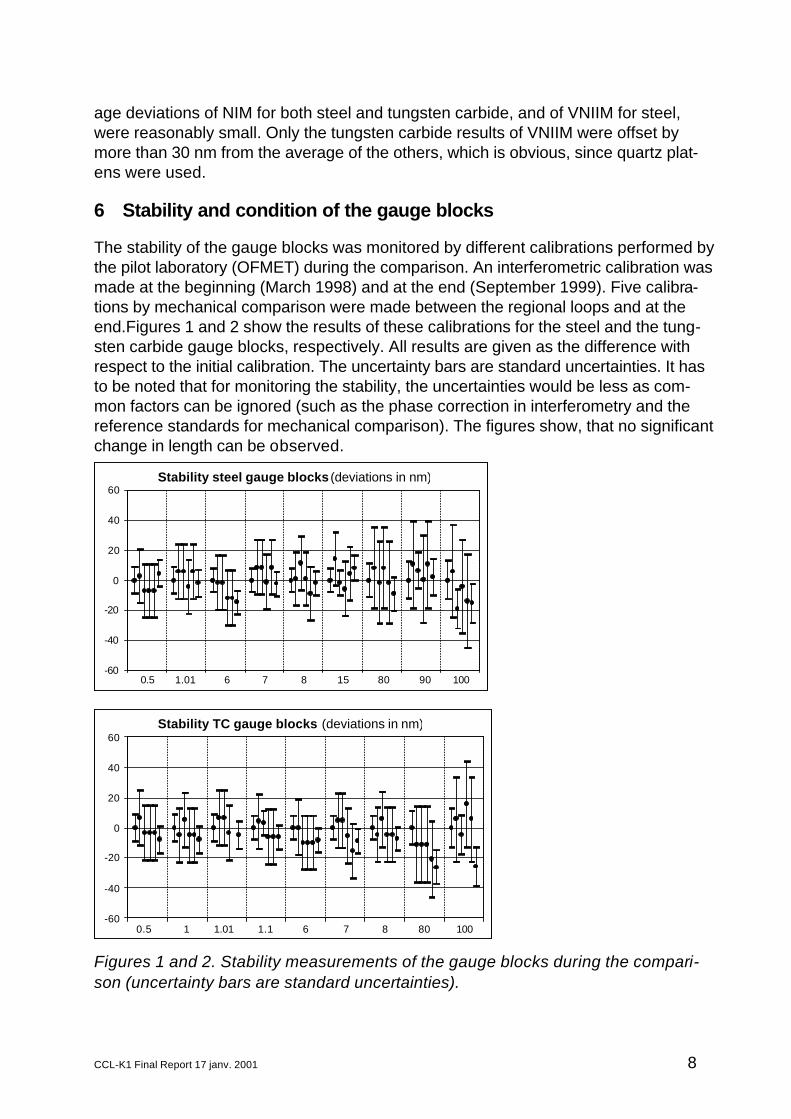
The stability of the gauge blocks was monitored by different calibrations performed bythe pilot laboratory (OFMET) during the comparison. An interferometric calibration wasmade at the beginning (March 1998) and at the end (September 1999). Five calibra-tions by mechanical comparison were made between the regional loops and at theend.Figures 1 and 2 show the results of these calibrations for the steel and the tung-sten carbide gauge blocks, respectively. All results are given as the difference withrespect to the initial calibration. The uncertainty bars are standard uncertainties. It hasto be noted that for monitoring the stability, the uncertainties would be less as com-mon factors can be ignored (such as the phase correction in interferometry and thereference standards for mechanical comparison). The figures show, that no significantchange in length can be observed.
Figures 1 and 2. Stability measurements of the gauge blocks during the compari-son (uncertainty bars are standard uncertainties).
-60
-40
-20
0
20
40
60Stability steel gauge blocks (deviations in nm)
0.5 1.01 6 7 8 15 80 90 100
-60
-40
-20
0
20
40
60Stability TC gauge blocks (deviations in nm)
0.5 1 1.01 1.1 6 7 8 80 100
CCL-K1 Final Report 17 janv. 2001 9
The gauge blocks were essentially free of any damage at the beginning of the com-parison. The participating laboratories were asked to document any scratches andother damage to the measurement surfaces with a drawing, made when receiving thegauge blocks. The surface quality of the tungsten carbide gauge blocks remained im-peccable until the end of the comparison. The steel gauge blocks, however, got moreand more scratches from the repeated wringing and also some small spots could beobserved, probably caused by rust. This degradation of the surface quality must beconsidered to be normal in the course of a comparison. All except the 1.1 mm steelgauge block wrung reasonably well at the final calibration. The 1.1 mm gauge blockcould not be calibrated by the last laboratories and therefore the results are not re-ported here. When arriving at CSIRO the 100 mm steel gauge block showed threesmall edge scratches which were slightly high. Since the burs risked damage to theplaten, they were carefully repaired by CSIRO using a granite dressing plate.
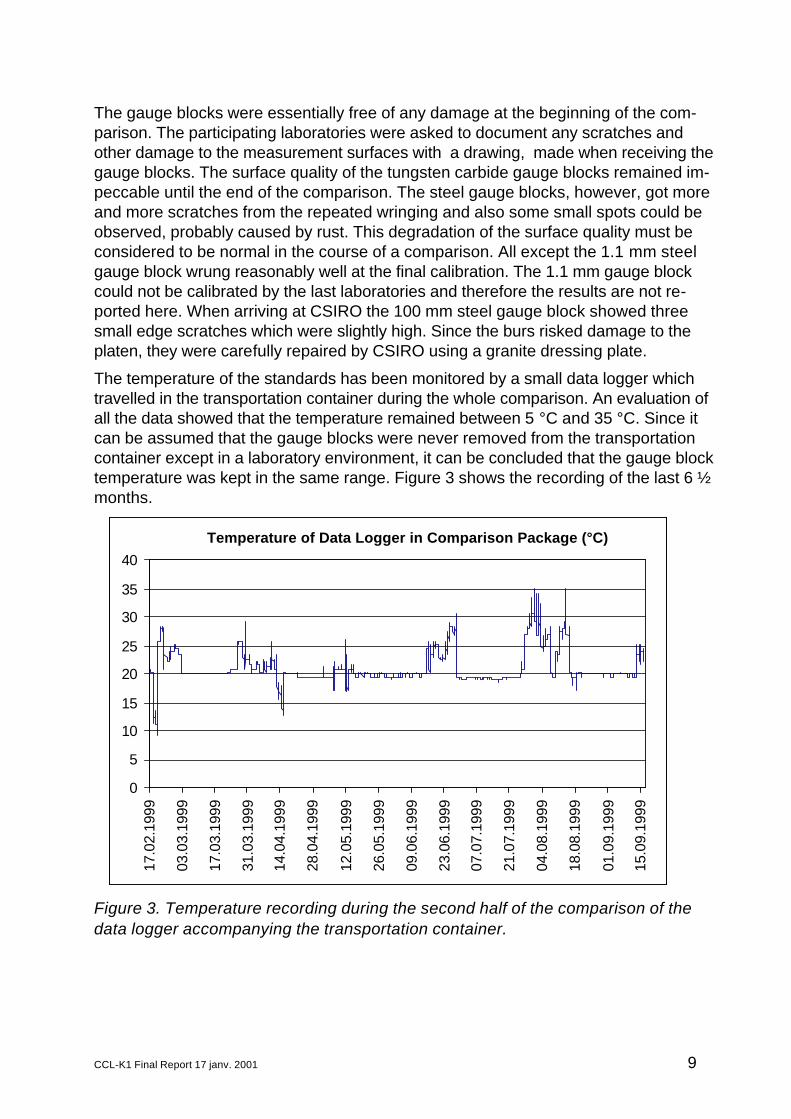
The temperature of the standards has been monitored by a small data logger whichtravelled in the transportation container during the whole comparison. An evaluation ofall the data showed that the temperature remained between 5 °C and 35 °C. Since itcan be assumed that the gauge blocks were never removed from the transportationcontainer except in a laboratory environment, it can be concluded that the gauge blocktemperature was kept in the same range. Figure 3 shows the recording of the last 6 ½months.
Figure 3. Temperature recording during the second half of the comparison of thedata logger accompanying the transportation container.
0
5
10
15
20
25
30
35
40
17.0
2.19
99
03.0
3.19
99
17.0
3.19
99
31.0
3.19
99
14.0
4.19
99
28.0
4.19
99
12.0
5.19
99
26.0
5.19
99
09.0
6.19
99
23.0
6.19
99
07.0
7.19
99
21.0
7.19
99
04.0
8.19
99
18.0
8.19
99
01.0
9.19
99
15.0
9.19
99
Temperature of Data Logger in Comparison Package (°C)
CCL-K1 Final Report 17 janv. 2001 10
7 Measurement results
7.1 Deviation from nominal length, steel gauge blocks
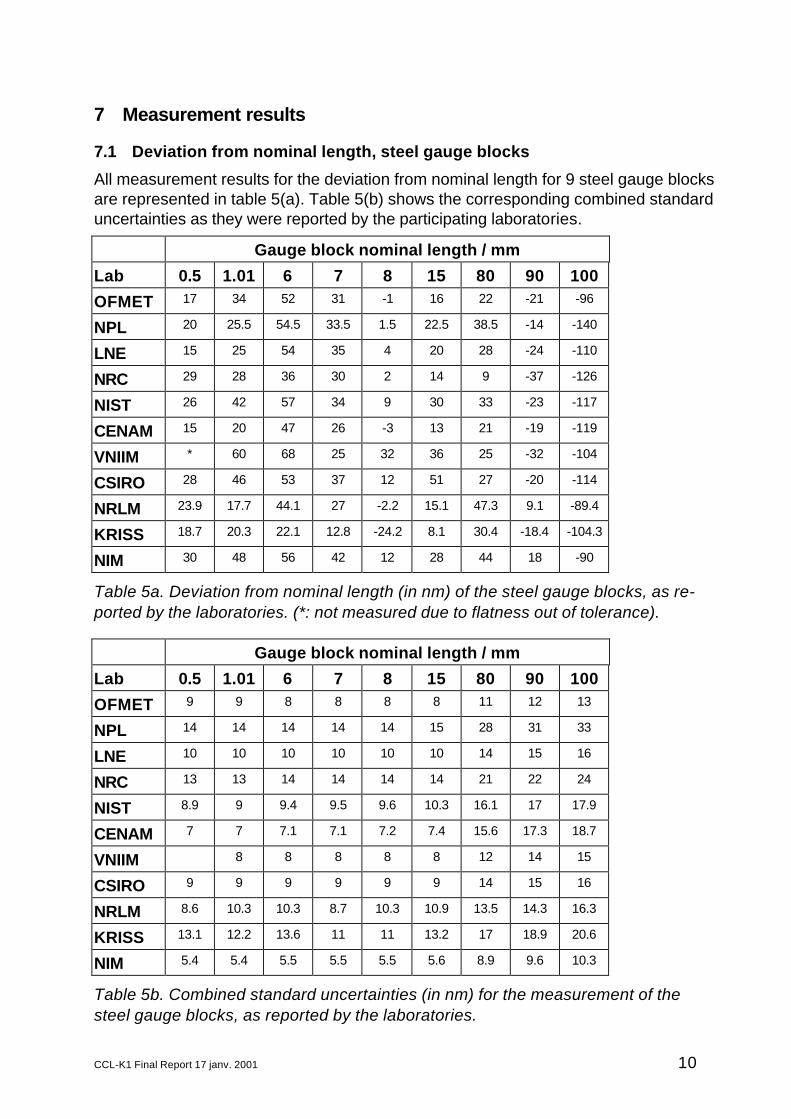
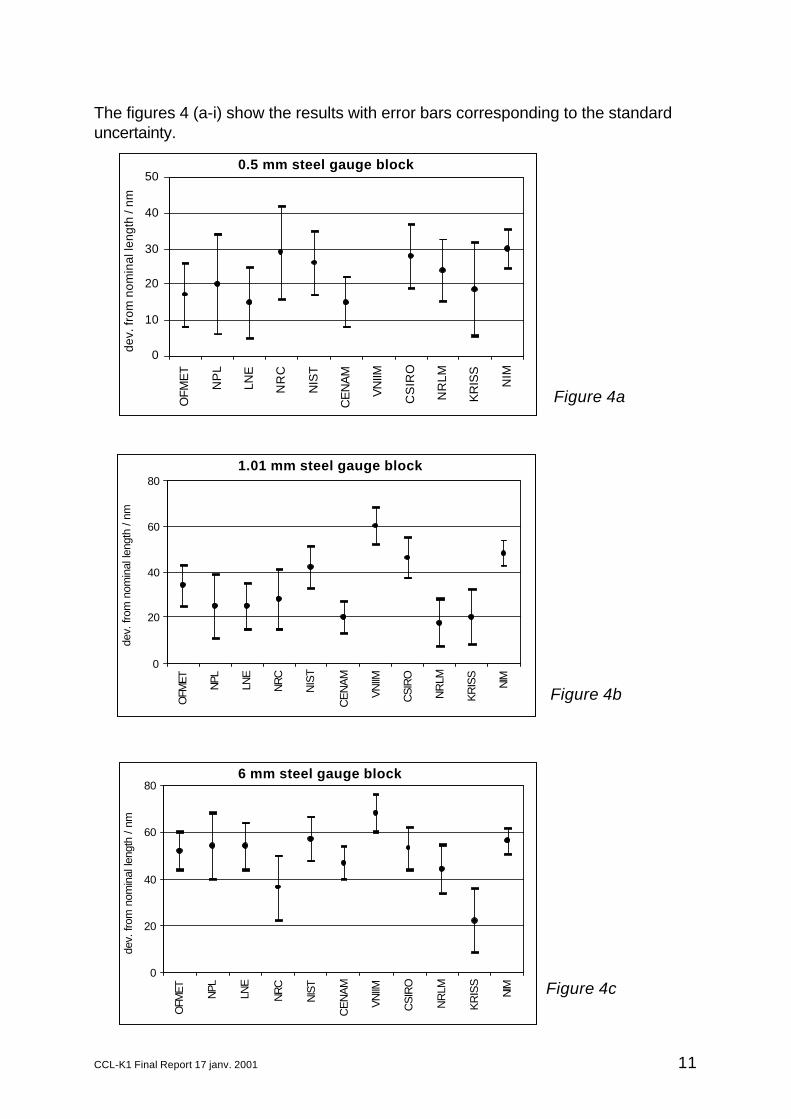
All measurement results for the deviation from nominal length for 9 steel gauge blocksare represented in table 5(a). Table 5(b) shows the corresponding combined standarduncertainties as they were reported by the participating laboratories.
Gauge block nominal length / mm
Lab 0.5 1.01 6 7 8 15 80 90 100
OFMET 17 34 52 31 -1 16 22 -21 -96
NPL 20 25.5 54.5 33.5 1.5 22.5 38.5 -14 -140
LNE 15 25 54 35 4 20 28 -24 -110
NRC 29 28 36 30 2 14 9 -37 -126
NIST 26 42 57 34 9 30 33 -23 -117
CENAM 15 20 47 26 -3 13 21 -19 -119
VNIIM * 60 68 25 32 36 25 -32 -104
CSIRO 28 46 53 37 12 51 27 -20 -114
NRLM 23.9 17.7 44.1 27 -2.2 15.1 47.3 9.1 -89.4
KRISS 18.7 20.3 22.1 12.8 -24.2 8.1 30.4 -18.4 -104.3
NIM 30 48 56 42 12 28 44 18 -90
Table 5a. Deviation from nominal length (in nm) of the steel gauge blocks, as re-ported by the laboratories. (*: not measured due to flatness out of tolerance).
Gauge block nominal length / mm
Lab 0.5 1.01 6 7 8 15 80 90 100
OFMET 9 9 8 8 8 8 11 12 13
NPL 14 14 14 14 14 15 28 31 33
LNE 10 10 10 10 10 10 14 15 16
NRC 13 13 14 14 14 14 21 22 24
NIST 8.9 9 9.4 9.5 9.6 10.3 16.1 17 17.9
CENAM 7 7 7.1 7.1 7.2 7.4 15.6 17.3 18.7
VNIIM 8 8 8 8 8 12 14 15
CSIRO 9 9 9 9 9 9 14 15 16
NRLM 8.6 10.3 10.3 8.7 10.3 10.9 13.5 14.3 16.3
KRISS 13.1 12.2 13.6 11 11 13.2 17 18.9 20.6
NIM 5.4 5.4 5.5 5.5 5.5 5.6 8.9 9.6 10.3
Table 5b. Combined standard uncertainties (in nm) for the measurement of thesteel gauge blocks, as reported by the laboratories.
CCL-K1 Final Report 17 janv. 2001 11
The figures 4 (a-i) show the results with error bars corresponding to the standarduncertainty.
Figure 4a
Figure 4b
Figure 4c
0
10
20
30
40
50O
FMET
NP
L
LNE
NR
C
NIS
T
CE
NA
M
VN
IIM
CS
IRO
NR
LM
KR
ISS
NIM
dev.
from
nom
inal
leng
th /
nm
0.5 mm steel gauge block
0
20
40
60
80
OFM
ET NPL
LNE
NRC
NIS
T
CEN
AM
VNIIM
CSI
RO
NR
LM
KRIS
S
NIM
dev.
from
nom
inal
leng
th /
nm
1.01 mm steel gauge block
0
20
40
60
80
OFM
ET NPL
LNE
NRC
NIS
T
CEN
AM
VNIIM
CSI
RO
NR
LM
KRIS
S
NIM
dev.
from
nom
inal
leng
th /
nm
6 mm steel gauge block

CCL-K1 Final Report 17 janv. 2001 12
Figure 4d
Figure 4e
Figure 4f
0
10
20
30
40
50
60O
FMET NP
L
LNE
NRC
NIS
T
CEN
AM
VNIIM
CSI
RO
NR
LM
KRIS
S
NIM
dev.
from
nom
inal
leng
th /
nm
7 mm steel gauge block
-40
-20
0
20
40
OFM
ET NPL
LNE
NRC
NIS
T
CEN
AM
VNIIM
CSI
RO
NR
LM
KRIS
S
NIM
dev.
from
nom
inal
leng
th /
nm
8 mm steel gauge block
-10
10
30
50
70
OFM
ET NPL
LNE
NRC
NIS
T
CEN
AM
VNIIM
CSI
RO
NR
LM
KRIS
S
NIM
dev.
from
nom
inal
leng
th /
nm
15 mm steel gauge block

CCL-K1 Final Report 17 janv. 2001 13
Figure 4g
Figure 4h
Figure 4i
-20
0
20
40
60
80
OFM
ET NPL
LNE
NRC
NIS
T
CEN
AM
VNIIM
CSI
RO
NR
LM
KRIS
S
NIM
dev.
from
nom
inal
leng
th /
nm80 mm steel gauge block
-60
-40
-20
0
20
40
OFM
ET NPL
LNE
NRC
NIS
T
CEN
AM
VNIIM
CSI
RO
NR
LM
KRIS
S
NIM
dev.
from
nom
inal
leng
th /
nm
90 mm steel gauge block
-180
-160
-140
-120
-100
-80
-60
OFM
ET NPL
LNE
NRC
NIS
T
CEN
AM
VNIIM
CSI
RO
NR
LM
KRIS
S
NIM
dev.
from
nom
inal
leng
th /
nm
100 mm steel gauge block
CCL-K1 Final Report 17 janv. 2001 14
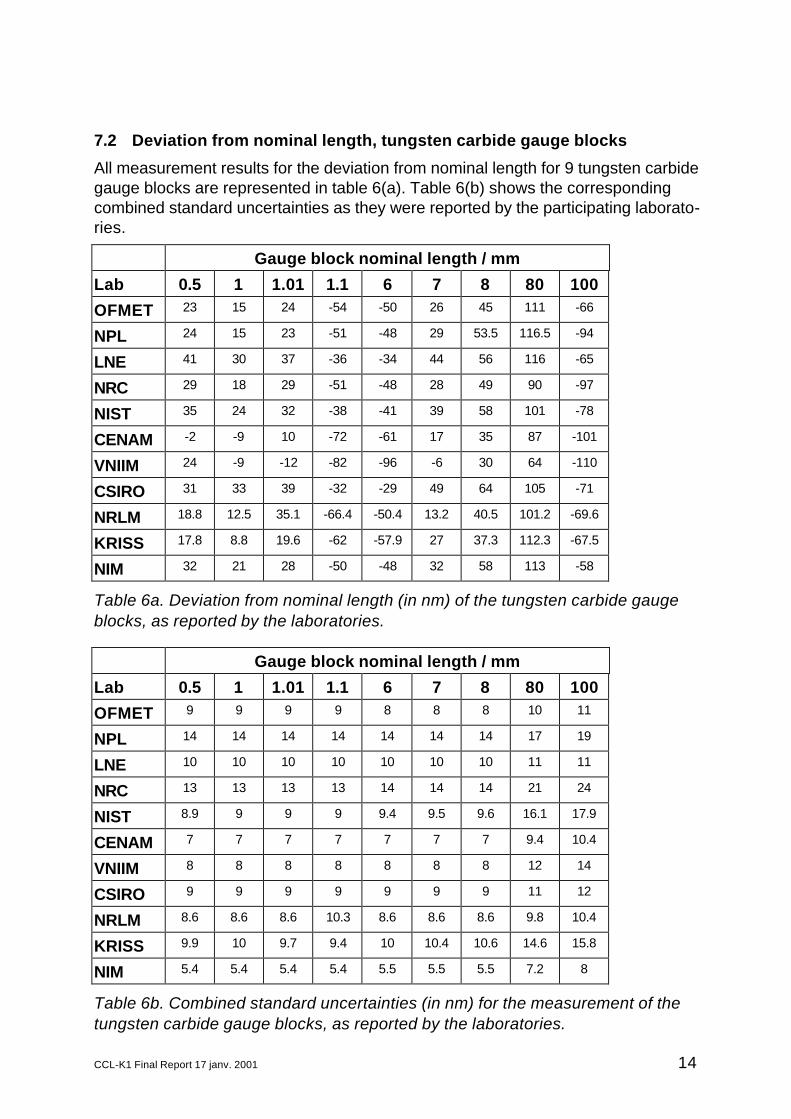
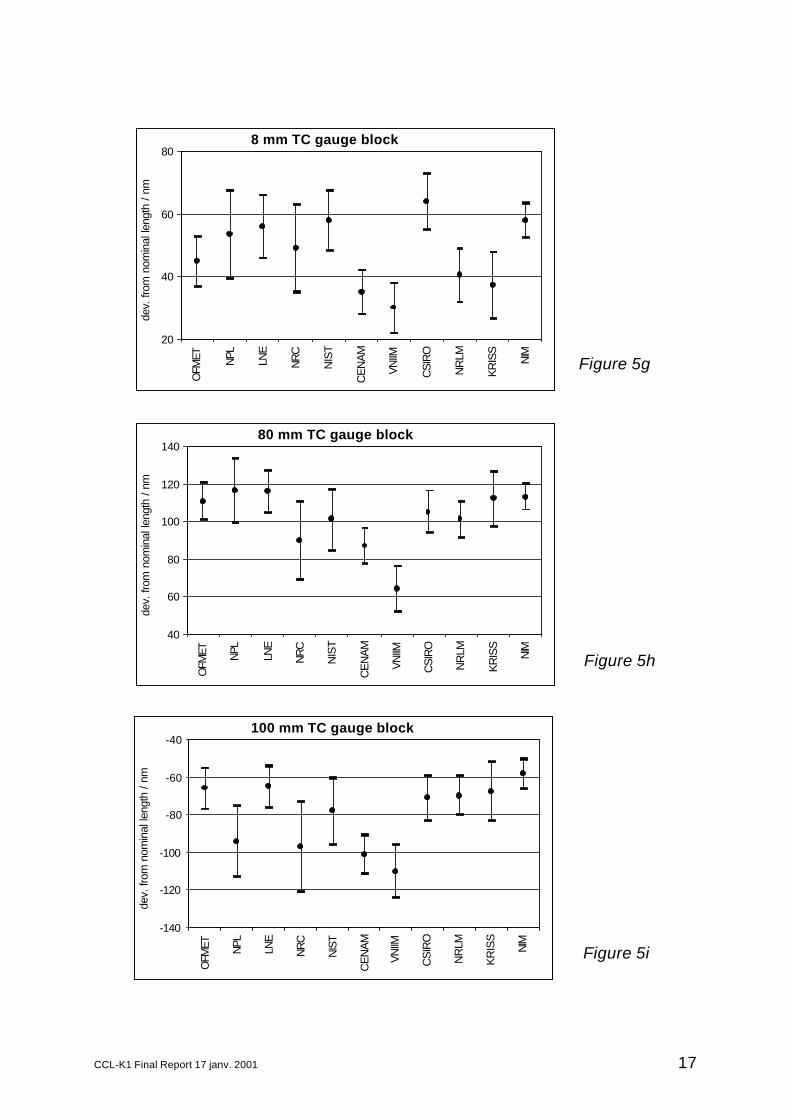
7.2 Deviation from nominal length, tungsten carbide gauge blocks
All measurement results for the deviation from nominal length for 9 tungsten carbidegauge blocks are represented in table 6(a). Table 6(b) shows the correspondingcombined standard uncertainties as they were reported by the participating laborato-ries.
Gauge block nominal length / mm
Lab 0.5 1 1.01 1.1 6 7 8 80 100
OFMET 23 15 24 -54 -50 26 45 111 -66
NPL 24 15 23 -51 -48 29 53.5 116.5 -94
LNE 41 30 37 -36 -34 44 56 116 -65
NRC 29 18 29 -51 -48 28 49 90 -97
NIST 35 24 32 -38 -41 39 58 101 -78
CENAM -2 -9 10 -72 -61 17 35 87 -101
VNIIM 24 -9 -12 -82 -96 -6 30 64 -110
CSIRO 31 33 39 -32 -29 49 64 105 -71
NRLM 18.8 12.5 35.1 -66.4 -50.4 13.2 40.5 101.2 -69.6
KRISS 17.8 8.8 19.6 -62 -57.9 27 37.3 112.3 -67.5
NIM 32 21 28 -50 -48 32 58 113 -58
Table 6a. Deviation from nominal length (in nm) of the tungsten carbide gaugeblocks, as reported by the laboratories.
Gauge block nominal length / mm
Lab 0.5 1 1.01 1.1 6 7 8 80 100
OFMET 9 9 9 9 8 8 8 10 11
NPL 14 14 14 14 14 14 14 17 19
LNE 10 10 10 10 10 10 10 11 11
NRC 13 13 13 13 14 14 14 21 24
NIST 8.9 9 9 9 9.4 9.5 9.6 16.1 17.9
CENAM 7 7 7 7 7 7 7 9.4 10.4
VNIIM 8 8 8 8 8 8 8 12 14
CSIRO 9 9 9 9 9 9 9 11 12
NRLM 8.6 8.6 8.6 10.3 8.6 8.6 8.6 9.8 10.4
KRISS 9.9 10 9.7 9.4 10 10.4 10.6 14.6 15.8
NIM 5.4 5.4 5.4 5.4 5.5 5.5 5.5 7.2 8
Table 6b. Combined standard uncertainties (in nm) for the measurement of thetungsten carbide gauge blocks, as reported by the laboratories.
CCL-K1 Final Report 17 janv. 2001 15
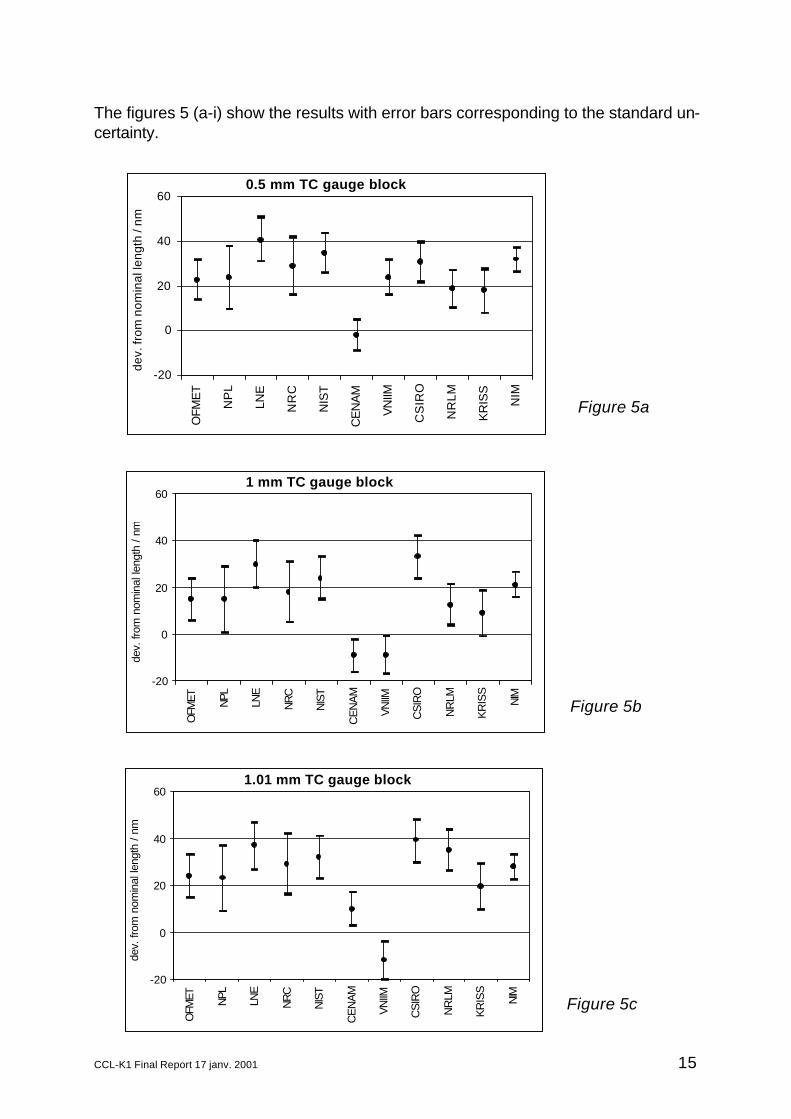
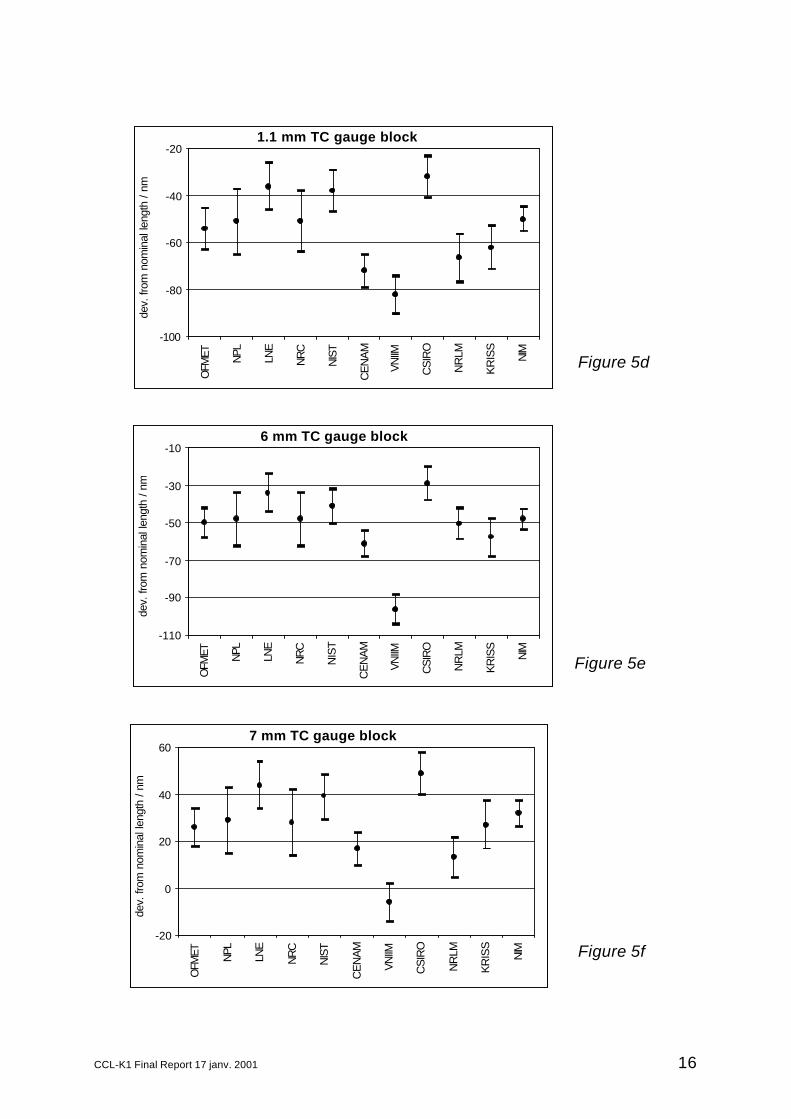
The figures 5 (a-i) show the results with error bars corresponding to the standard un-certainty.
Figure 5a
Figure 5c
Figure 5b
-20
0
20
40
60O
FMET
NP
L
LNE
NR
C
NIS
T
CE
NA
M
VN
IIM
CS
IRO
NR
LM
KR
ISS
NIM
dev.
from
nom
inal
leng
th /
nm
0.5 mm TC gauge block
-20
0
20
40
60
OFM
ET NPL
LNE
NRC
NIS
T
CEN
AM
VNIIM
CSI
RO
NR
LM
KRIS
S
NIM
dev.
from
nom
inal
leng
th /
nm
1 mm TC gauge block
-20
0
20
40
60
OFM
ET NPL
LNE
NRC
NIS
T
CEN
AM
VNIIM
CSI
RO
NR
LM
KRIS
S
NIM
dev.
from
nom
inal
leng
th /
nm
1.01 mm TC gauge block
CCL-K1 Final Report 17 janv. 2001 16
Figure 5d
Figure 5e
-100
-80
-60
-40
-20
OFM
ET NPL
LNE
NRC
NIS
T
CEN
AM
VNIIM
CSI
RO
NR
LM
KRIS
S
NIM
dev.
from
nom
inal
leng
th /
nm1.1 mm TC gauge block
-110
-90
-70
-50
-30
-10
OFM
ET NPL
LNE
NRC
NIS
T
CEN
AM
VNIIM
CSI
RO
NR
LM
KRIS
S
NIM
dev.
from
nom
inal
leng
th /
nm
6 mm TC gauge block
-20
0
20
40
60
OFM
ET NPL
LNE
NRC
NIS
T
CEN
AM
VNIIM
CSI
RO
NR
LM
KRIS
S
NIM
dev.
from
nom
inal
leng
th /
nm
7 mm TC gauge block
Figure 5f
CCL-K1 Final Report 17 janv. 2001 17
Figure 5g
Figure 5h
Figure 5i
20
40
60
80
OFM
ET NPL
LNE
NRC
NIS
T
CEN
AM
VNIIM
CSI
RO
NR
LM
KRIS
S
NIM
dev.
from
nom
inal
leng
th /
nm8 mm TC gauge block
40
60
80
100
120
140
OFM
ET NPL
LNE
NRC
NIS
T
CEN
AM
VNIIM
CSI
RO
NR
LM
KRIS
S
NIM
dev.
from
nom
inal
leng
th /
nm
80 mm TC gauge block
-140
-120
-100
-80
-60
-40
OFM
ET NPL
LNE
NRC
NIS
T
CEN
AM
VNIIM
CSI
RO
NR
LM
KRIS
S
NIM
dev.
from
nom
inal
leng
th /
nm
100 mm TC gauge block
CCL-K1 Final Report 17 janv. 2001 18
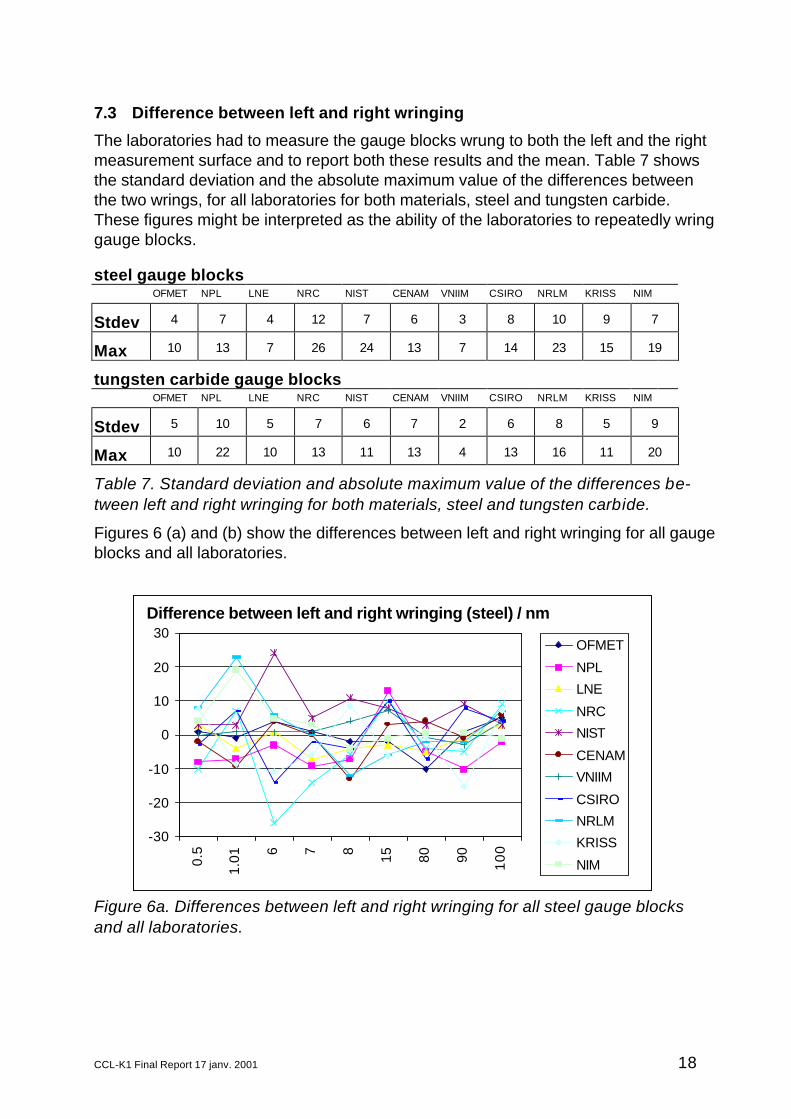
7.3 Difference between left and right wringing
The laboratories had to measure the gauge blocks wrung to both the left and the rightmeasurement surface and to report both these results and the mean. Table 7 showsthe standard deviation and the absolute maximum value of the differences betweenthe two wrings, for all laboratories for both materials, steel and tungsten carbide.These figures might be interpreted as the ability of the laboratories to repeatedly wringgauge blocks.
steel gauge blocksOFMET NPL LNE NRC NIST CENAM VNIIM CSIRO NRLM KRISS NIM
Stdev 4 7 4 12 7 6 3 8 10 9 7
Max 10 13 7 26 24 13 7 14 23 15 19
tungsten carbide gauge blocksOFMET NPL LNE NRC NIST CENAM VNIIM CSIRO NRLM KRISS NIM
Stdev 5 10 5 7 6 7 2 6 8 5 9
Max 10 22 10 13 11 13 4 13 16 11 20
Table 7. Standard deviation and absolute maximum value of the differences be-tween left and right wringing for both materials, steel and tungsten carbide.
Figures 6 (a) and (b) show the differences between left and right wringing for all gaugeblocks and all laboratories.
Figure 6a. Differences between left and right wringing for all steel gauge blocksand all laboratories.
Difference between left and right wringing (steel) / nm
-30
-20
-10
0
10
20
30
0.5
1.01 6 7 8 15 80 90 10
0
OFMET
NPL
LNE
NRC
NIST
CENAM
VNIIM
CSIRO
NRLM
KRISS
NIM

CCL-K1 Final Report 17 janv. 2001 19
Figure 6b. Differences between left and right wringing for all tungsten carbidegauge blocks and all laboratories.
8 Measurement uncertainties
The participants were asked in the technical protocols of the comparison to estimatethe uncertainty of measurement according to the ISO Guide for the Expression ofUncertainty in Measurement. An example mathematical model [3] was given and theparticipants were encouraged to use this model as closely as possible which allowsfor a detailed comparison of all the uncertainties. Thus all laboratories have indicatedtheir uncertainty contributions according to the various components of that model.Some laboratories indicated, however, that they usually use another model for the un-certainty leading to somewhat different results.
The following contributions to the combined uncertainty were taken into account:λi vacuum wavelengths of the different light sources used;Fi fractional part of fringe order;n index of refraction of the air;∆tG difference of the gauge block temperature from the reference temperature of
20 °C;α linear coefficient of thermal expansion of the gauge block;δlΩ obliquity correction for the shift in phase resulting from the angular alignment er-
rors of the collimating assembly;
∆ls aperture correction accounting for the shift in phase resulting from the finiteaperture diameter s of the light source;
δlA correction for wave front errors as a result of imperfect interferometer optics;
δlG correction accounting for flatness deviation and variation in length of the gaugeblock;
Difference between left and right wringing (TC) / nm
-30
-20
-10
0
10
20
300.
5 1
1.01 1.
1 6 7 8 80 100
OFMET
NPL
LNE
NRC
NIST
CENAM
VNIIM
CSIRO
NRLM
KRISS
NIM
CCL-K1 Final Report 17 janv. 2001 20
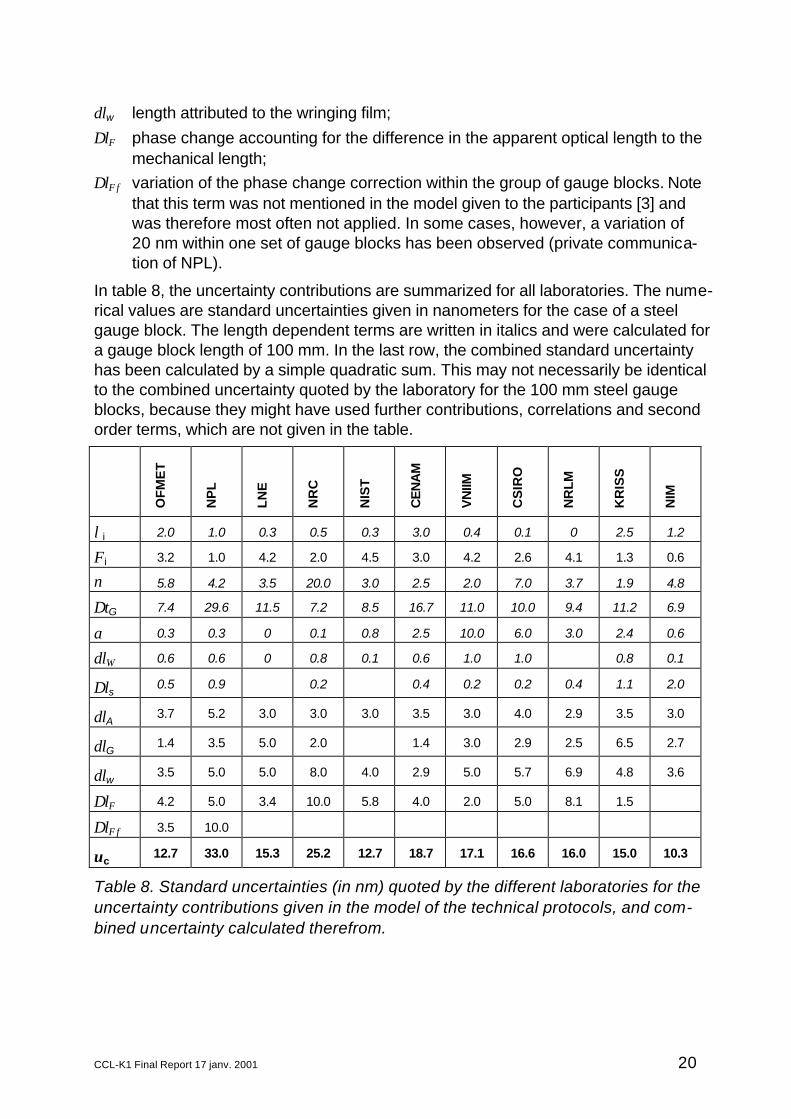
δlw length attributed to the wringing film;∆lΦ phase change accounting for the difference in the apparent optical length to the
mechanical length;∆lΦφ variation of the phase change correction within the group of gauge blocks. Note
that this term was not mentioned in the model given to the participants [3] andwas therefore most often not applied. In some cases, however, a variation of20 nm within one set of gauge blocks has been observed (private communica-tion of NPL).
In table 8, the uncertainty contributions are summarized for all laboratories. The nume-rical values are standard uncertainties given in nanometers for the case of a steelgauge block. The length dependent terms are written in italics and were calculated fora gauge block length of 100 mm. In the last row, the combined standard uncertaintyhas been calculated by a simple quadratic sum. This may not necessarily be identicalto the combined uncertainty quoted by the laboratory for the 100 mm steel gaugeblocks, because they might have used further contributions, correlations and secondorder terms, which are not given in the table.
OF
ME
T
NP
L
LN
E
NR
C
NIS
T
CE
NA
M
VN
IIM
CS
IRO
NR
LM
KR
ISS
NIM
λi 2.0 1.0 0.3 0.5 0.3 3.0 0.4 0.1 0 2.5 1.2
Fi 3.2 1.0 4.2 2.0 4.5 3.0 4.2 2.6 4.1 1.3 0.6
n 5.8 4.2 3.5 20.0 3.0 2.5 2.0 7.0 3.7 1.9 4.8
∆tG 7.4 29.6 11.5 7.2 8.5 16.7 11.0 10.0 9.4 11.2 6.9
α 0.3 0.3 0 0.1 0.8 2.5 10.0 6.0 3.0 2.4 0.6
δlΩ 0.6 0.6 0 0.8 0.1 0.6 1.0 1.0 0.8 0.1
∆ls 0.5 0.9 0.2 0.4 0.2 0.2 0.4 1.1 2.0
δlA 3.7 5.2 3.0 3.0 3.0 3.5 3.0 4.0 2.9 3.5 3.0
δlG 1.4 3.5 5.0 2.0 1.4 3.0 2.9 2.5 6.5 2.7
δlw 3.5 5.0 5.0 8.0 4.0 2.9 5.0 5.7 6.9 4.8 3.6
∆lΦ 4.2 5.0 3.4 10.0 5.8 4.0 2.0 5.0 8.1 1.5
∆lΦφ 3.5 10.0
uc12.7 33.0 15.3 25.2 12.7 18.7 17.1 16.6 16.0 15.0 10.3
Table 8. Standard uncertainties (in nm) quoted by the different laboratories for theuncertainty contributions given in the model of the technical protocols, and com-bined uncertainty calculated therefrom.

CCL-K1 Final Report 17 janv. 2001 21
9 Statistical analysis of the results
The reported measurement results are analysed by simple statistical means. This al-lowed the identification of any significant bias or outliers, and the investigation of thestatistical distribution of the results.
9.1 Average deviation and standard deviation
For each laboratory, the average <∆l> of the deviations from the mean over all gaugeblocks has been calculated:
∑=
−>=∆<N
jjj xx
Nl
1
)(1
(1)
where xj is the result for the individual gauge block j and jx the mean over all laborato-
ries for that gauge block. N = 10 is the number of gauge blocks for each material. Bythe same way the standard deviations s of the differences xj - jx has been calculated:
( )∑=
>∆<−−−
=N
jjj lxx
Ns
1
22 )(1
1(2)
The normalised standard deviation sn is the standard deviation divided by the standarduncertainty uj given by the laboratory for the individual gauge block j
∑=
>∆<−−
−=
N
j j
jjn
u
lxx
Ns
1
2
2 (
1
1 (3)
In table 9, the three figures described above are given for each laboratory and gaugeblock material separately.
Steel gauge blocks Tungsten carbide gauge blocks
<∆l> / nm s / nm sn <∆l> / nm s / nm sn
OFMET -1.2 6.8 0.6 2.1 5.6 0.5
NPL -2.8 11.3 0.4 1.5 7.6 0.4
LNE -2.0 5.0 0.5 14.9 3.0 0.3
NRC -8.9 9.5 0.5 -0.9 7.9 0.4
NIST 2.9 5.8 0.5 8.6 5.1 0.6
CENAM -7.1 3.6 0.6 -16.8 6.0 0.9
VNIIM 8.4 16.0 1.8 -28.0 12.9 1.2
CSIRO 6.1 10.0 1.1 14.9 7.2 0.8
NRLM 3.1 14.5 1.1 -2.2 8.8 1.0
KRISS -11.1 12.1 1.0 -2.2 8.3 0.7
NIM 13.7 9.1 0.8 8.1 5.8 0.7
Table 9. Average deviation, standard deviation from mean and normalised stan-dard deviation from mean for all laboratories.
CCL-K1 Final Report 17 janv. 2001 22
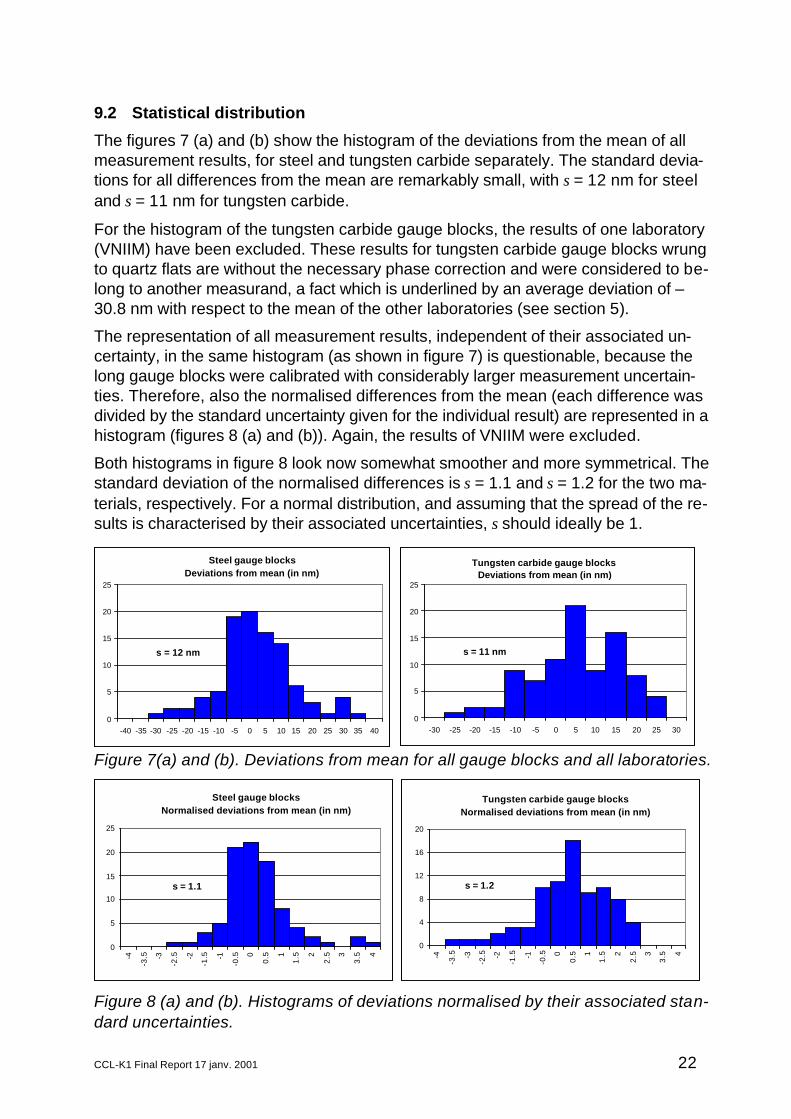
9.2 Statistical distribution
The figures 7 (a) and (b) show the histogram of the deviations from the mean of allmeasurement results, for steel and tungsten carbide separately. The standard devia-tions for all differences from the mean are remarkably small, with s = 12 nm for steeland s = 11 nm for tungsten carbide.
For the histogram of the tungsten carbide gauge blocks, the results of one laboratory(VNIIM) have been excluded. These results for tungsten carbide gauge blocks wrungto quartz flats are without the necessary phase correction and were considered to be-long to another measurand, a fact which is underlined by an average deviation of –30.8 nm with respect to the mean of the other laboratories (see section 5).
The representation of all measurement results, independent of their associated un-certainty, in the same histogram (as shown in figure 7) is questionable, because thelong gauge blocks were calibrated with considerably larger measurement uncertain-ties. Therefore, also the normalised differences from the mean (each difference wasdivided by the standard uncertainty given for the individual result) are represented in ahistogram (figures 8 (a) and (b)). Again, the results of VNIIM were excluded.
Both histograms in figure 8 look now somewhat smoother and more symmetrical. Thestandard deviation of the normalised differences is s = 1.1 and s = 1.2 for the two ma-terials, respectively. For a normal distribution, and assuming that the spread of the re-sults is characterised by their associated uncertainties, s should ideally be 1.
Figure 7(a) and (b). Deviations from mean for all gauge blocks and all laboratories.
Figure 8 (a) and (b). Histograms of deviations normalised by their associated stan-dard uncertainties.
0
5
10
15
20
25
-40 -35 -30 -25 -20 -15 -10 -5 0 5 10 15 20 25 30 35 40
s = 12 nm
Steel gauge blocksDeviations from mean (in nm)
0
5
10
15
20
25
-30 -25 -20 -15 -10 -5 0 5 10 15 20 25 30
Tungsten carbide gauge blocksDeviations from mean (in nm)
s = 11 nm
0
5
10
15
20
25
-4
-3.5 -3
-2.5 -2
-1.5 -1
-0.5 0
0.5 1
1.5 2
2.5 3
3.5 4
s = 1.1
Steel gauge blocksNormalised deviations from mean (in nm)
0
4
8
12
16
20
-4
-3.5 -3
-2.5 -2
-1.5 -1
-0.5 0
0.5 1
1.5 2
2.5 3
3.5 4
Tungsten carbide gauge blocksNormalised deviations from mean (in nm)
s = 1.2
CCL-K1 Final Report 17 janv. 2001 23
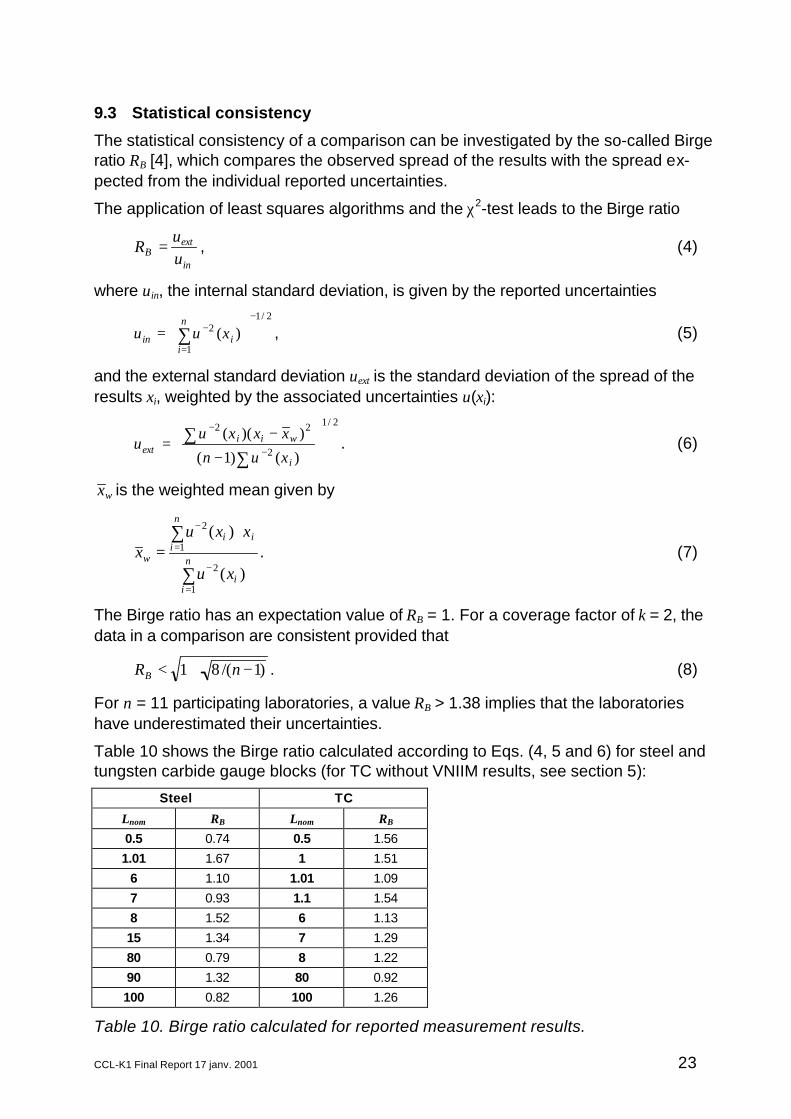
9.3 Statistical consistency
The statistical consistency of a comparison can be investigated by the so-called Birgeratio RB [4], which compares the observed spread of the results with the spread ex-pected from the individual reported uncertainties.
The application of least squares algorithms and the χ2-test leads to the Birge ratio
in
extB u
uR = , (4)
where uin, the internal standard deviation, is given by the reported uncertainties2/1
1
2 )(−
=
−
= ∑
n
iiin xuu , (5)
and the external standard deviation uext is the standard deviation of the spread of theresults xi, weighted by the associated uncertainties u(xi):
2/1
2
22
)()1(
))((
−
−=
∑∑
−
−
i
wiiext
xun
xxxuu . (6)
wx is the weighted mean given by
∑
∑
=
−
=
− ⋅=
n
ii
n
iii
w
xu
xxux
1
2
1
2
)(
)(. (7)
The Birge ratio has an expectation value of RB = 1. For a coverage factor of k = 2, thedata in a comparison are consistent provided that
)1/(81 −+< nRB . (8)
For n = 11 participating laboratories, a value RB > 1.38 implies that the laboratorieshave underestimated their uncertainties.
Table 10 shows the Birge ratio calculated according to Eqs. (4, 5 and 6) for steel andtungsten carbide gauge blocks (for TC without VNIIM results, see section 5):
Steel TC
Lnom RB Lnom RB
0.5 0.74 0.5 1.561.01 1.67 1 1.51
6 1.10 1.01 1.097 0.93 1.1 1.548 1.52 6 1.1315 1.34 7 1.2980 0.79 8 1.2290 1.32 80 0.92100 0.82 100 1.26
Table 10. Birge ratio calculated for reported measurement results.
CCL-K1 Final Report 17 janv. 2001 24
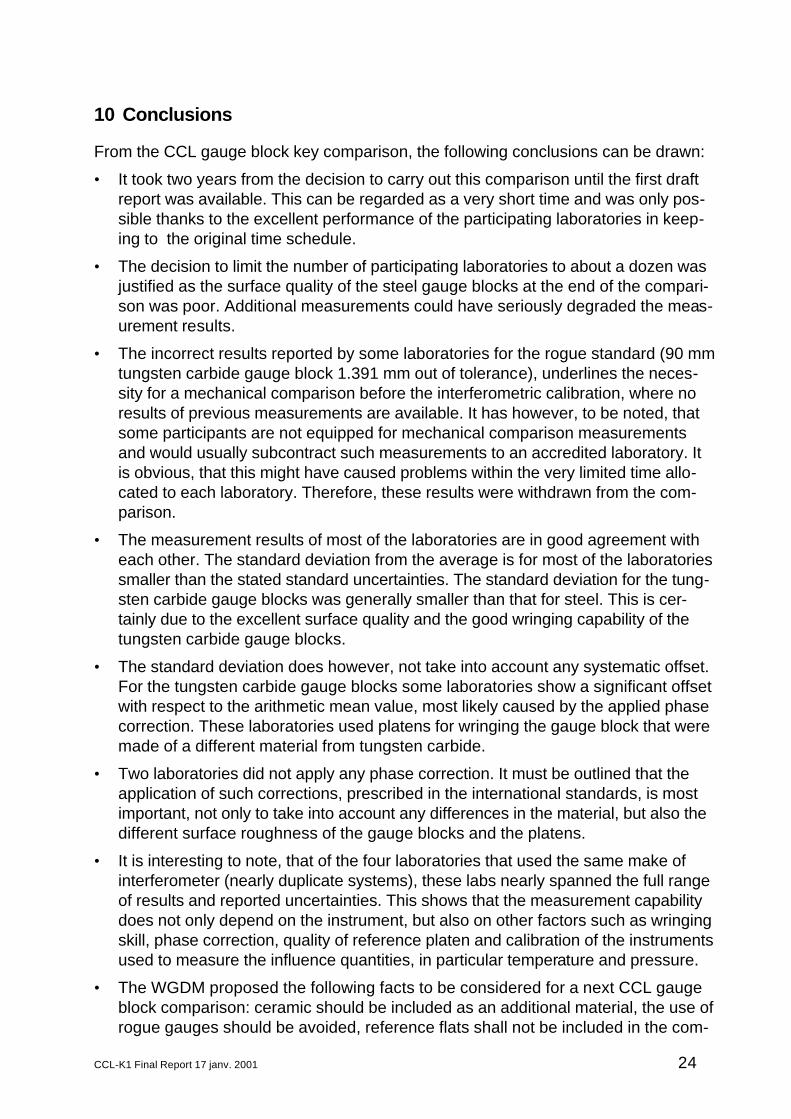
10 Conclusions
From the CCL gauge block key comparison, the following conclusions can be drawn:
• It took two years from the decision to carry out this comparison until the first draftreport was available. This can be regarded as a very short time and was only pos-sible thanks to the excellent performance of the participating laboratories in keep-ing to the original time schedule.
• The decision to limit the number of participating laboratories to about a dozen wasjustified as the surface quality of the steel gauge blocks at the end of the compari-son was poor. Additional measurements could have seriously degraded the meas-urement results.
• The incorrect results reported by some laboratories for the rogue standard (90 mmtungsten carbide gauge block 1.391 mm out of tolerance), underlines the neces-sity for a mechanical comparison before the interferometric calibration, where noresults of previous measurements are available. It has however, to be noted, thatsome participants are not equipped for mechanical comparison measurementsand would usually subcontract such measurements to an accredited laboratory. Itis obvious, that this might have caused problems within the very limited time allo-cated to each laboratory. Therefore, these results were withdrawn from the com-parison.
• The measurement results of most of the laboratories are in good agreement witheach other. The standard deviation from the average is for most of the laboratoriessmaller than the stated standard uncertainties. The standard deviation for the tung-sten carbide gauge blocks was generally smaller than that for steel. This is cer-tainly due to the excellent surface quality and the good wringing capability of thetungsten carbide gauge blocks.
• The standard deviation does however, not take into account any systematic offset.For the tungsten carbide gauge blocks some laboratories show a significant offsetwith respect to the arithmetic mean value, most likely caused by the applied phasecorrection. These laboratories used platens for wringing the gauge block that weremade of a different material from tungsten carbide.
• Two laboratories did not apply any phase correction. It must be outlined that theapplication of such corrections, prescribed in the international standards, is mostimportant, not only to take into account any differences in the material, but also thedifferent surface roughness of the gauge blocks and the platens.
• It is interesting to note, that of the four laboratories that used the same make ofinterferometer (nearly duplicate systems), these labs nearly spanned the full rangeof results and reported uncertainties. This shows that the measurement capabilitydoes not only depend on the instrument, but also on other factors such as wringingskill, phase correction, quality of reference platen and calibration of the instrumentsused to measure the influence quantities, in particular temperature and pressure.
• The WGDM proposed the following facts to be considered for a next CCL gaugeblock comparison: ceramic should be included as an additional material, the use ofrogue gauges should be avoided, reference flats shall not be included in the com-
CCL-K1 Final Report 17 janv. 2001 25
parison package, the expansion coefficient of the gauge blocks shall not be givenwith an exceptionally small uncertainty, but only as a manufacturer specification (tobe verified by the pilot laboratory).
11 References
[1] T.J. Quinn, Guidelines for key comparisons carried out by Consultative Commit-tees, draft of 21. November 1997, BIPM, Paris. In the meantime, this documenthas been replaced by a new version: Guidelines for CIPM key comparisons, 1.March 1999 (available at http://www.bipm.fr).
[2] This 90 mm gauge block has kindly been loaned by Han Haitjema, TechnicalUniversity Eindhoven, Netherlands.
[3] J.E. Decker and J.R. Pekelsky, Uncertainty Evaluation for the Measurement ofGauge Blocks by Optical Interferometry, Metrologia 34, 479-493 (1997).
[4] Statistical Analysis of Interlaboratory Comparisons, EUROMET workshop heldat NPL on 11.-12. November 1999,http://www.npl.co.uk/ssfm/download/documents/sss_m_00_173.pdf
CCL-K1 Final Report 17 janv. 2001 26
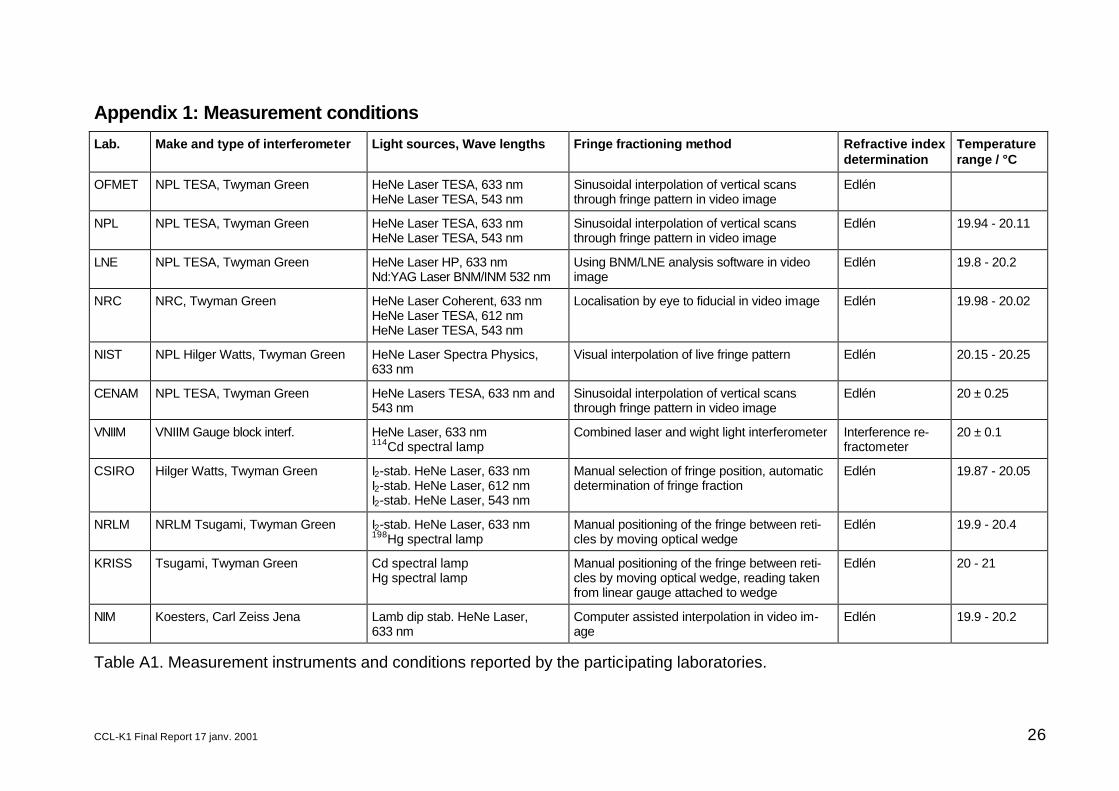
Appendix 1: Measurement conditions
Lab. Make and type of interferometer Light sources, Wave lengths Fringe fractioning method Refractive indexdetermination
Temperaturerange / °C
OFMET NPL TESA, Twyman Green HeNe Laser TESA, 633 nmHeNe Laser TESA, 543 nm
Sinusoidal interpolation of vertical scansthrough fringe pattern in video image
Edlén
NPL NPL TESA, Twyman Green HeNe Laser TESA, 633 nmHeNe Laser TESA, 543 nm
Sinusoidal interpolation of vertical scansthrough fringe pattern in video image
Edlén 19.94 - 20.11
LNE NPL TESA, Twyman Green HeNe Laser HP, 633 nmNd:YAG Laser BNM/INM 532 nm
Using BNM/LNE analysis software in videoimage
Edlén 19.8 - 20.2
NRC NRC, Twyman Green HeNe Laser Coherent, 633 nmHeNe Laser TESA, 612 nmHeNe Laser TESA, 543 nm
Localisation by eye to fiducial in video image Edlén 19.98 - 20.02
NIST NPL Hilger Watts, Twyman Green HeNe Laser Spectra Physics,633 nm
Visual interpolation of live fringe pattern Edlén 20.15 - 20.25
CENAM NPL TESA, Twyman Green HeNe Lasers TESA, 633 nm and543 nm
Sinusoidal interpolation of vertical scansthrough fringe pattern in video image
Edlén 20 ± 0.25
VNIIM VNIIM Gauge block interf. HeNe Laser, 633 nm114Cd spectral lamp
Combined laser and wight light interferometer Interference re-fractometer
20 ± 0.1
CSIRO Hilger Watts, Twyman Green I2-stab. HeNe Laser, 633 nmI2-stab. HeNe Laser, 612 nmI2-stab. HeNe Laser, 543 nm
Manual selection of fringe position, automaticdetermination of fringe fraction
Edlén 19.87 - 20.05
NRLM NRLM Tsugami, Twyman Green I2-stab. HeNe Laser, 633 nm198Hg spectral lamp
Manual positioning of the fringe between reti-cles by moving optical wedge
Edlén 19.9 - 20.4
KRISS Tsugami, Twyman Green Cd spectral lampHg spectral lamp
Manual positioning of the fringe between reti-cles by moving optical wedge, reading takenfrom linear gauge attached to wedge
Edlén 20 - 21
NIM Koesters, Carl Zeiss Jena Lamb dip stab. HeNe Laser,633 nm
Computer assisted interpolation in video im-age
Edlén 19.9 - 20.2
Table A1. Measurement instruments and conditions reported by the participating laboratories.
CCL-K1 Final Report 17 janv. 2001 27
Appendix 2: Determination of the reference values
Proposals for key comparison reference values are worked out according to two dif-ferent methods, i.e. the arithmetic mean and the weighted mean.
Note that the results of the pilot laboratory contribute only once to the calculation ofthe reference values, namely by the first measurement, because it has to be as-sumed, that the further measurements are correlated to some extent.
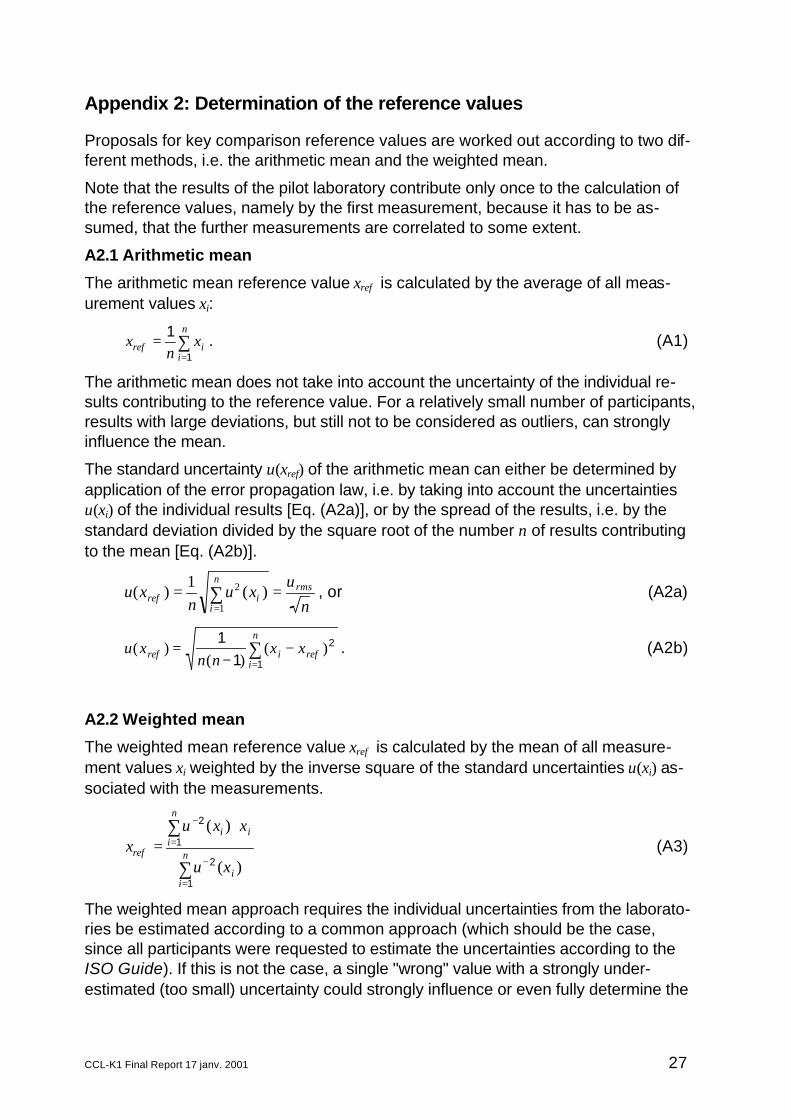
A2.1 Arithmetic mean
The arithmetic mean reference value xref is calculated by the average of all meas-urement values xi:
∑=
=n
iiref x
nx
1
1 . (A1)
The arithmetic mean does not take into account the uncertainty of the individual re-sults contributing to the reference value. For a relatively small number of participants,results with large deviations, but still not to be considered as outliers, can stronglyinfluence the mean.
The standard uncertainty u(xref) of the arithmetic mean can either be determined byapplication of the error propagation law, i.e. by taking into account the uncertaintiesu(xi) of the individual results [Eq. (A2a)], or by the spread of the results, i.e. by thestandard deviation divided by the square root of the number n of results contributingto the mean [Eq. (A2b)].
n
uxu
nxu rms
n
iiref == ∑
=1
2 )(1
)( , or (A2a)
∑=
−−
=n
irefiref xx
nnxu
1
2
11
)()(
)( . (A2b)
A2.2 Weighted mean
The weighted mean reference value xref is calculated by the mean of all measure-ment values xi weighted by the inverse square of the standard uncertainties u(xi) as-sociated with the measurements.
∑
∑
=
−
=
− ⋅=
n
ii
n
iii
ref
xu
xxux
1
2
1
2
)(
)((A3)
The weighted mean approach requires the individual uncertainties from the laborato-ries be estimated according to a common approach (which should be the case,since all participants were requested to estimate the uncertainties according to theISO Guide). If this is not the case, a single "wrong" value with a strongly under-estimated (too small) uncertainty could strongly influence or even fully determine the

CCL-K1 Final Report 17 janv. 2001 28
weighted mean. On the other hand, a high quality measurement with overestimateduncertainty would contribute to the reference value only to a small extent.
The standard uncertainty u(xref) of the reference value is calculated either by appro-priately combining the individual uncertainties [Eq. (A4a)], or by the spread of the re-sults [Eq. (A4b)], which is identical to the external standard deviation given in Eq. (6)of section 9.3).
21
1
2/
)()(−
=
−
= ∑
n
iiref xuxu (A4a)
∑∑
−
−
−
−=
)()1(
))(()(
2
22
i
refiiref
xun
xxxuxu . (A4b)
It has to be noted that Eqs. (A2b) and (A4b) do not result from the law of error pro-pagation and are certainly not in accordance to the GUM. In statistically consistentcases, these standard deviations should be approximately equal to the standard un-certainties evaluated according to Eqs. (A2a) and (A4a), respectively, resulting in aBirge ratio of approximately 1 (see section 9.3).
A2.3 Uncertainty of the difference between results and the reference values
For calculating the uncertainty of the difference between an individual result and thereference value, the corresponding uncertainties u(xi) and u(xref) cannot simply begeometrically added, because the values xi and xref are correlated. It can be shown1,that for the weighted mean with an uncertainty u(xref) according to Eq.(A4a), the ex-panded uncertainty U(∆x) of the difference ∆x = xi - xref is given by
)()(2)( 22refi xuxuxU −=∆ . (A5)
For the arithmetic mean approach, the expanded uncertainty U(∆x) is given by
∑=
+
−=∆
n
jji xu
nxu
nxU
1
22
2 )(1
)(2
12)( . (A6)
In the case, where all uncertainties u(xi) are equal, this results in an expression iden-tical to Eq.(A5).
If external standard deviations are taken for the uncertainty of u(xref), according toEqs. (A2b) and (A4b), there is no way to calculate the expanded uncertainty U(∆x)analytically by application of the law of error propagation. The assumption, that U(∆x)be given by the geometric sum of u(xi) and u(xref) would, however, lead to a too largevalue, since correlation between xi and xref are not taken into account.
A2.4 Exclusion of results contributing to the reference values
Before calculating the reference values, it must be assured, that there are no “out-liers” or erroneous results which may significantly bias the reference value. Looking
1 see e.g. Lars Nielsen, Evaluation of measurement intercomparisons by the method of least squares, paperpresented at [4].
CCL-K1 Final Report 17 janv. 2001 29
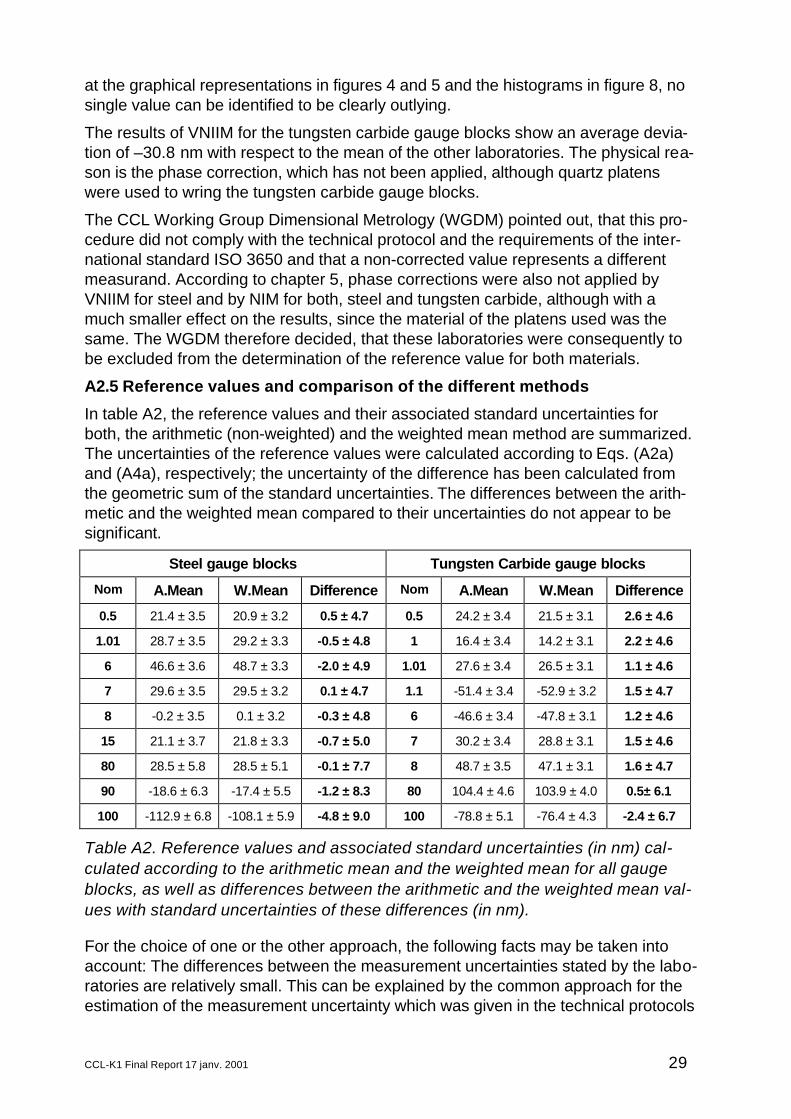
at the graphical representations in figures 4 and 5 and the histograms in figure 8, nosingle value can be identified to be clearly outlying.
The results of VNIIM for the tungsten carbide gauge blocks show an average devia-tion of –30.8 nm with respect to the mean of the other laboratories. The physical rea-son is the phase correction, which has not been applied, although quartz platenswere used to wring the tungsten carbide gauge blocks.
The CCL Working Group Dimensional Metrology (WGDM) pointed out, that this pro-cedure did not comply with the technical protocol and the requirements of the inter-national standard ISO 3650 and that a non-corrected value represents a differentmeasurand. According to chapter 5, phase corrections were also not applied byVNIIM for steel and by NIM for both, steel and tungsten carbide, although with amuch smaller effect on the results, since the material of the platens used was thesame. The WGDM therefore decided, that these laboratories were consequently tobe excluded from the determination of the reference value for both materials.
A2.5 Reference values and comparison of the different methods
In table A2, the reference values and their associated standard uncertainties forboth, the arithmetic (non-weighted) and the weighted mean method are summarized.The uncertainties of the reference values were calculated according to Eqs. (A2a)and (A4a), respectively; the uncertainty of the difference has been calculated fromthe geometric sum of the standard uncertainties. The differences between the arith-metic and the weighted mean compared to their uncertainties do not appear to besignificant.
Steel gauge blocks Tungsten Carbide gauge blocks
Nom A.Mean W.Mean Difference Nom A.Mean W.Mean Difference
0.5 21.4 ± 3.5 20.9 ± 3.2 0.5 ± 4.7 0.5 24.2 ± 3.4 21.5 ± 3.1 2.6 ± 4.6
1.01 28.7 ± 3.5 29.2 ± 3.3 -0.5 ± 4.8 1 16.4 ± 3.4 14.2 ± 3.1 2.2 ± 4.6
6 46.6 ± 3.6 48.7 ± 3.3 -2.0 ± 4.9 1.01 27.6 ± 3.4 26.5 ± 3.1 1.1 ± 4.6
7 29.6 ± 3.5 29.5 ± 3.2 0.1 ± 4.7 1.1 -51.4 ± 3.4 -52.9 ± 3.2 1.5 ± 4.7
8 -0.2 ± 3.5 0.1 ± 3.2 -0.3 ± 4.8 6 -46.6 ± 3.4 -47.8 ± 3.1 1.2 ± 4.6
15 21.1 ± 3.7 21.8 ± 3.3 -0.7 ± 5.0 7 30.2 ± 3.4 28.8 ± 3.1 1.5 ± 4.6
80 28.5 ± 5.8 28.5 ± 5.1 -0.1 ± 7.7 8 48.7 ± 3.5 47.1 ± 3.1 1.6 ± 4.7
90 -18.6 ± 6.3 -17.4 ± 5.5 -1.2 ± 8.3 80 104.4 ± 4.6 103.9 ± 4.0 0.5± 6.1
100 -112.9 ± 6.8 -108.1 ± 5.9 -4.8 ± 9.0 100 -78.8 ± 5.1 -76.4 ± 4.3 -2.4 ± 6.7
Table A2. Reference values and associated standard uncertainties (in nm) cal-culated according to the arithmetic mean and the weighted mean for all gaugeblocks, as well as differences between the arithmetic and the weighted mean val-ues with standard uncertainties of these differences (in nm).
For the choice of one or the other approach, the following facts may be taken intoaccount: The differences between the measurement uncertainties stated by the labo-ratories are relatively small. This can be explained by the common approach for theestimation of the measurement uncertainty which was given in the technical protocols
CCL-K1 Final Report 17 janv. 2001 30
of this comparison. In addition, the measurement method and the equipment usedby the participants are all quite similar. Therefore the remaining differences in thestated uncertainties are partly due to a more or less conservative judgement of theuncertainty contributions from the influence quantities. It is therefore felt that weighingthe results by their uncertainty for the determination of the reference values is notappropriate. For the evaluation of the degree of equivalence, the arithmetic meanreference values are proposed.
CCL-K1 Final Report 17 janv. 2001 31
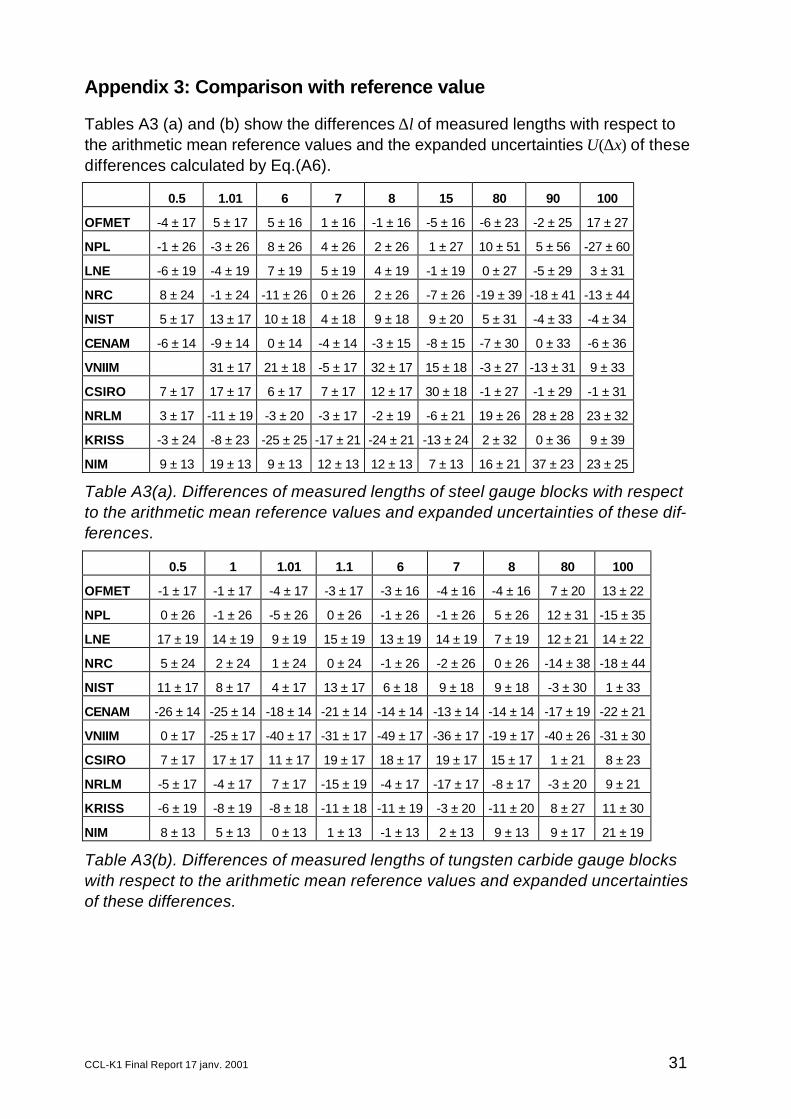
Appendix 3: Comparison with reference value
Tables A3 (a) and (b) show the differences ∆l of measured lengths with respect tothe arithmetic mean reference values and the expanded uncertainties U(∆x) of thesedifferences calculated by Eq.(A6).
0.5 1.01 6 7 8 15 80 90 100
OFMET -4 ± 17 5 ± 17 5 ± 16 1 ± 16 -1 ± 16 -5 ± 16 -6 ± 23 -2 ± 25 17 ± 27
NPL -1 ± 26 -3 ± 26 8 ± 26 4 ± 26 2 ± 26 1 ± 27 10 ± 51 5 ± 56 -27 ± 60
LNE -6 ± 19 -4 ± 19 7 ± 19 5 ± 19 4 ± 19 -1 ± 19 0 ± 27 -5 ± 29 3 ± 31
NRC 8 ± 24 -1 ± 24 -11 ± 26 0 ± 26 2 ± 26 -7 ± 26 -19 ± 39 -18 ± 41 -13 ± 44
NIST 5 ± 17 13 ± 17 10 ± 18 4 ± 18 9 ± 18 9 ± 20 5 ± 31 -4 ± 33 -4 ± 34
CENAM -6 ± 14 -9 ± 14 0 ± 14 -4 ± 14 -3 ± 15 -8 ± 15 -7 ± 30 0 ± 33 -6 ± 36
VNIIM 31 ± 17 21 ± 18 -5 ± 17 32 ± 17 15 ± 18 -3 ± 27 -13 ± 31 9 ± 33
CSIRO 7 ± 17 17 ± 17 6 ± 17 7 ± 17 12 ± 17 30 ± 18 -1 ± 27 -1 ± 29 -1 ± 31
NRLM 3 ± 17 -11 ± 19 -3 ± 20 -3 ± 17 -2 ± 19 -6 ± 21 19 ± 26 28 ± 28 23 ± 32
KRISS -3 ± 24 -8 ± 23 -25 ± 25 -17 ± 21 -24 ± 21 -13 ± 24 2 ± 32 0 ± 36 9 ± 39
NIM 9 ± 13 19 ± 13 9 ± 13 12 ± 13 12 ± 13 7 ± 13 16 ± 21 37 ± 23 23 ± 25
Table A3(a). Differences of measured lengths of steel gauge blocks with respectto the arithmetic mean reference values and expanded uncertainties of these dif-ferences.
0.5 1 1.01 1.1 6 7 8 80 100
OFMET -1 ± 17 -1 ± 17 -4 ± 17 -3 ± 17 -3 ± 16 -4 ± 16 -4 ± 16 7 ± 20 13 ± 22
NPL 0 ± 26 -1 ± 26 -5 ± 26 0 ± 26 -1 ± 26 -1 ± 26 5 ± 26 12 ± 31 -15 ± 35
LNE 17 ± 19 14 ± 19 9 ± 19 15 ± 19 13 ± 19 14 ± 19 7 ± 19 12 ± 21 14 ± 22
NRC 5 ± 24 2 ± 24 1 ± 24 0 ± 24 -1 ± 26 -2 ± 26 0 ± 26 -14 ± 38 -18 ± 44
NIST 11 ± 17 8 ± 17 4 ± 17 13 ± 17 6 ± 18 9 ± 18 9 ± 18 -3 ± 30 1 ± 33
CENAM -26 ± 14 -25 ± 14 -18 ± 14 -21 ± 14 -14 ± 14 -13 ± 14 -14 ± 14 -17 ± 19 -22 ± 21
VNIIM 0 ± 17 -25 ± 17 -40 ± 17 -31 ± 17 -49 ± 17 -36 ± 17 -19 ± 17 -40 ± 26 -31 ± 30
CSIRO 7 ± 17 17 ± 17 11 ± 17 19 ± 17 18 ± 17 19 ± 17 15 ± 17 1 ± 21 8 ± 23
NRLM -5 ± 17 -4 ± 17 7 ± 17 -15 ± 19 -4 ± 17 -17 ± 17 -8 ± 17 -3 ± 20 9 ± 21
KRISS -6 ± 19 -8 ± 19 -8 ± 18 -11 ± 18 -11 ± 19 -3 ± 20 -11 ± 20 8 ± 27 11 ± 30
NIM 8 ± 13 5 ± 13 0 ± 13 1 ± 13 -1 ± 13 2 ± 13 9 ± 13 9 ± 17 21 ± 19
Table A3(b). Differences of measured lengths of tungsten carbide gauge blockswith respect to the arithmetic mean reference values and expanded uncertaintiesof these differences.

CCL-K1 Final Report 17 janv. 2001 32
Appendix 4: Transfer of reference values to RMO key comparisons
In order to appropriately link CCL with RMO key comparisons in the case of artefactbased comparisons, the application of the concept to transfer the key comparisonreference value to a second, independent comparison, turns out to be difficult. Notonly that the reference values do not have the importance of a realisation of an SIunit (they have no metrological significance apart from the fact that they represent thebest estimate of a particular measurand of an artefact at a given time), but also a ri-gorous transfer of the reference value would necessitate the introduction of metrolo-gically meaningless corrections and lead to an undue increase in the uncertainty ofthe regional reference value used to express the degree of equivalence.
An alternative more adequate approach is the one which has been applied by theCCEM-K4 comparison where the key comparison reference value is the nominal va-lue of the standard. This reflects the fact, that for external parties the exact value ofthe measurand (e.g. the length of the gauge blocks) has no further meaning than theirnominal length, except for the purpose of expressing the equivalence. It compliesalso with the common practice of expressing calibration results for material stan-dards as the deviation from nominal value.
Practically this is done in the following way:For determining the degree of equivalence with respect to the reference value, thearithmetic (or weighted) mean xa and the uncertainty u(xa) of this mean are calculated.The degree of equivalence is given by the difference Di = (xi - xa) and the expandeduncertainty U(Di) of this difference. The key comparison reference value xR is ob-tained from the arithmetic mean xa of the participants values xi by adding a constant Cchosen such that the reference value is the nominal length L: xR = xa + C = L. C is thusthe deviation of xa from nominal length.The transfer of the key comparison referencevalue to a regional comparison is straight forward if similar artefacts of the same qua-lity with the same nominal values are used in the regional comparison. Since the no-minal value has no uncertainty, there is no additional uncertainty contribution to betaken into account in the regional comparison when calculating the degree of equi-valence with respect to the reference value.
The calculation of the mutual degree of equivalence between two laboratories is notrecommended for comparisons involving several material standards, since it cannotbe expressed in a single pair of values. It would be given by Dij = (xi - xj) and the ex-panded uncertainty U(Dij) of this difference for two laboratories participating in thesame comparison, and by Dij = (Di - Dj) and its expanded uncertainty U(Dij) for twolaboratories participating in distinct comparisons.
The proper link between two comparisons is established by an expert judgment ofthe results of the participants common to both comparisons, taking into account theirdegrees of equivalence for all standards of the two comparisons.

CCL-K1 Final Report 17 janv. 2001 33
Appendix 5: Results not to be published
During the comparison the measurement surfaces of the 1.1 mm steel gauge blockwere severely scratched, such that wringing became impossible towards the end ofthe circulation. Therefore, some laboratories did not report any result and compara-bility of the reported results (see graph below) cannot be guaranteed.
As mentioned in the main part of this report, the 90 mm tungsten carbide gaugeblock was 1.39145 mm shorter than its nominal length. It has been manufactured insuch a length as to have similar excess fringe fractions as a 90 mm gauge block forall laser and spectral lamp wavelengths usually used in gauge block interferometry.Only laboratories making a predetermination of the length by mechanical comparisoncould become aware of this fact. These results do therefore not necessarily repre-sent the measurement capability of the laboratories. The graph below shows the re-sults of those laboratories having perfomed a mechanical comparison before theinterferometric calibration.
-10
10
30
50
70
OFM
ET NPL
LNE
NRC
NIS
T
CEN
AM
VNIIM
CSI
RO
NR
LM
KRIS
S
NIM
dev.
from
nom
inal
leng
th /
nm
1.1 mm steel gauge block
-1391500
-1391480
-1391460
-1391440
-1391420
OFM
ET NPL
LNE
NRC
NIS
T
CEN
AM
VNIIM
CSI
RO
NR
LM
KRIS
S
NIM
dev.
from
nom
inal
leng
th /
nm
'90' mm TC gauge block