california council on problem gambling · california council on problem gambling problem gambling...
TRANSCRIPT

Presented by Bensinger, DuPont & Associates For California Council on Problem Gambling
Problem Gambling Help Line Report
13
Bensinger, DuPont & Associates 134 N. LaSalle, Suite 2200 Chicago, Illinois 60602 312-726-8620

2010 2011 2012 2013January 2031 1839 1628 1509February 1827 1787 1564 1463March 3732 2077 1838 1753April 2679 1988 1577 1479May 2710 1913 1601 1558June 2165 1831 1580 1590July 2272 1967 1731 1627August 2105 1888 1617 1501September 1925 1574 1455 1316October 1919 1627 1439 1379November 1736 1745 1446 1409December 2190 1830 1532 1578Average 2274 1839 1584 1514
!"#$%&'($")!&*(+$#)&(),'&-#./)0"/-#$(1
!"#$%&'($")*+#,)-$(+)./"/$0/$102345
!"##2)3(24.'.5))67(/"8+9):&(;7(/"8+)<)='"(8>:&(;7(/"8+)!"##0)6$(1#?@+0),'"(8)1"##0>ABC$&?0)='"(8)!"##0
6*/-.')&%)7(8"9.:!#$($+"#)!"##2
;&8"#)!"##2
<=>?>@>A?4D4E3533
0
500
1000
1500
2000
2500
3000
3500
4000
2010
2011
2012
2013
!"#$%&'(&)
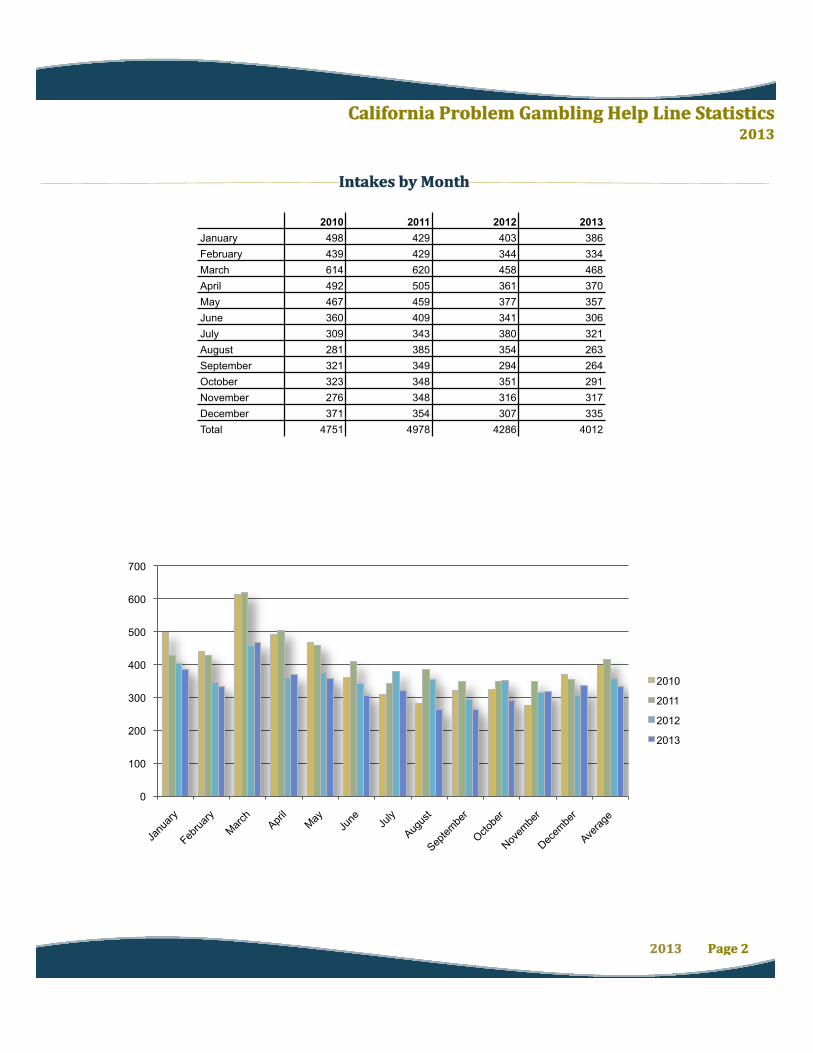
2010 2011 2012 2013January 498 429 403 386February 439 429 344 334March 614 620 458 468April 492 505 361 370May 467 459 377 357June 360 409 341 306July 309 343 380 321August 281 385 354 263September 321 349 294 264October 323 348 351 291November 276 348 316 317December 371 354 307 335Total 4751 4978 4286 4012
!"#$%&'($")*'&+#,-)."-+#$(/)0,#1)2$(,)34"4$54$65789:
;(4"<,5)+=)>&(4?
0
100
200
300
400
500
600
700
2010
2011
2012
2013
!"#$%&&'()

2013California Problem Gambling Help Line Statistics
Calls & Intakes by Month
2013 Page 3
2013California Problem Gambling Help Line Statistics
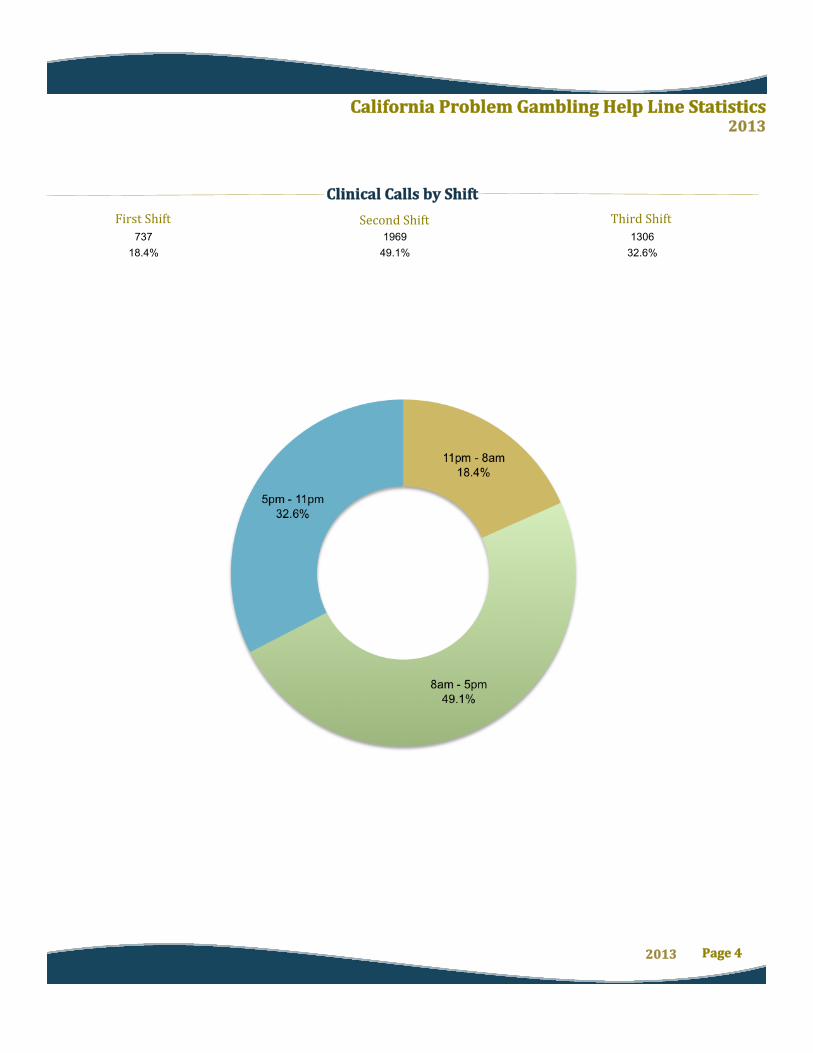
1969 130649.1% 32.6%
First Shift73718.4%
Clinical Calls by Shift
Second Shift Third Shift
2013 Page 4

2013California Problem Gambling Help Line Statistics
3170315
138
64
81
1523
3554
GamblerSpouse
Child
Parent
Sibling
FriendEmployer
TherapistOther
79.0%7.9%
3.4%
1.6%
2.0%
3.8%0.1%
0.9%1.3%
Type of Caller
2013 Page 5
2013California Problem Gambling Help Line Statistics
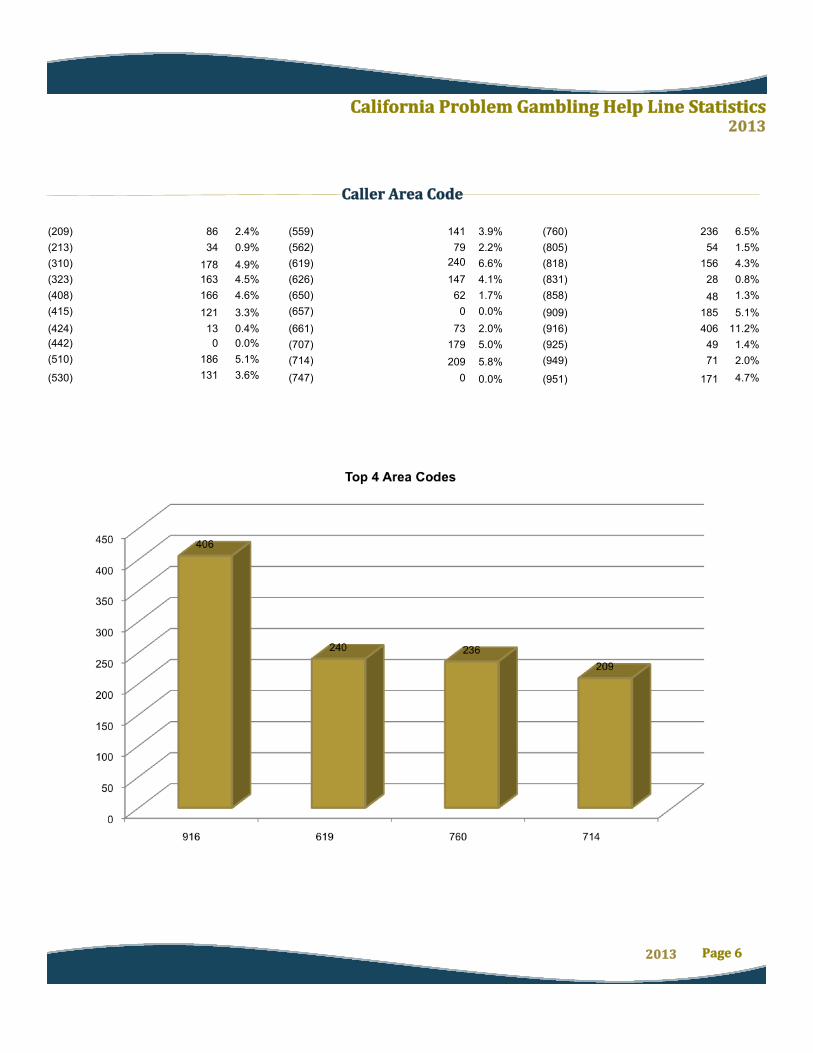
166121
186
34178
86
163 28
1854064971
179209
23654156
131
1417924014762
73
2.4%0.9%4.9%
4.6%3.3%
5.1%
4.5% 0.8%
5.1%11.2%1.4%2.0%
3.6%
3.9%2.2%6.6%4.1%1.7%
5.0%5.8%
6.5%1.5%4.3%
2.0%(925)
(408)(415)
(510)
(213)(310)
(209)
(323) (831)
(909)(916)
(949)(707)(714)
(760)(805)(818)
(530)
(559)(562)(619)(626)(650)
(661)
48(858) 1.3%
171 4.7%(951)
13 0.4%(424)0 0.0%(657)
0 0.0%(747)
0 0.0%(442)
Caller Area Code
2013 Page 6

2013California Problem Gambling Help Line Statistics
1654Female2358Male 58.8% 41.2%
Gender of Caller
389
280910
767792478250
323
0.1%2.5%7.8%
25.2%
21.3%22.0%13.3%
6.9%
0.9%0.1%
Under 18Age 18...21Age 22...25Age 26...35
Age 36...45Age 46...55Age 56...65Age 66...75
Age 76...85Age 85+
Caller Age
2013 Page 7

2013California Problem Gambling Help Line Statistics
1373Married 37.3%347Divorced 9.4% 73Separated 2.0% 76Widowed 2.1%217Cohabitant 5.9% 1594Single 43.3%
Caller Marital Status
2013 Page 8
2013California Problem Gambling Help Line Statistics
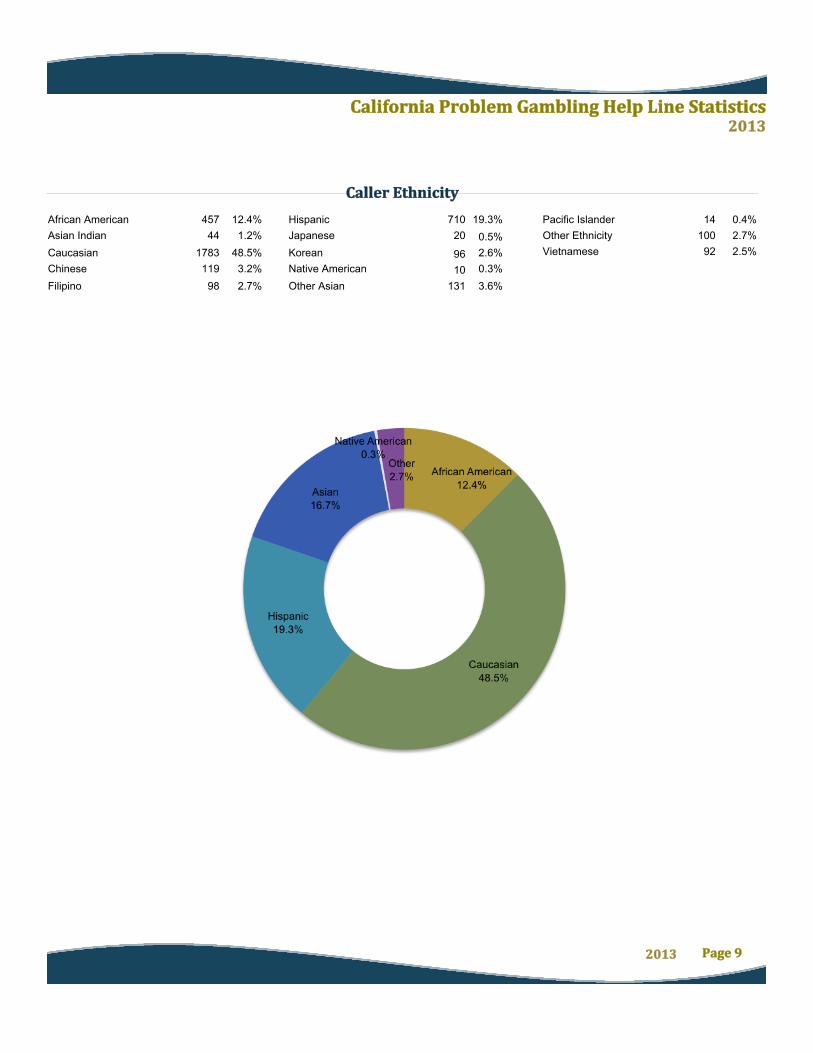
African American 710Hispanic 14Pacific Islander
119Chinese98Filipino
92VietnameseKoreanAsian Indian
19.3% 0.4%
3.2%2.7%
2.5%2.6%1.2%
96
44
Other Asian 3.6%131
1783Caucasian 48.5%
457 12.4%Other Ethnicity 2.7%10020Japanese 0.5%
10Native American 0.3%
Caller Ethnicity
2013 Page 9

2013California Problem Gambling Help Line Statistics
Lottery 293 7.6%
Indian Casinos 2593 67.0% Nevada Casinos 122 3.2%Bingo 16 0.4%
Horse Racing 42 1.1%Sports Betting 131 3.4%
Internet (Cards) 26 0.7%Internet (Other) 13 0.3%
Card Rooms 566 14.6%Cards (private) 18 0.5%
Other 30 0.8%
Stock Market 20 0.5%
Lottery
Indian Casinos Nevada CasinosBingo
Horse RacingSports BettingStock Market
Internet (Other)Other
472
130 6110
1476611
551.7%
14.2% 6.7%1.1%
1.5%8.3%0.7%1.2%
0.5%
Internet (Cards) 9 1.0%Cards (private) 10 1.1%Card Rooms 109 11.9%
Primary Gambling Preference
Secondary Gambling Preference
2013 Page 10
2013California Problem Gambling Help Line Statistics
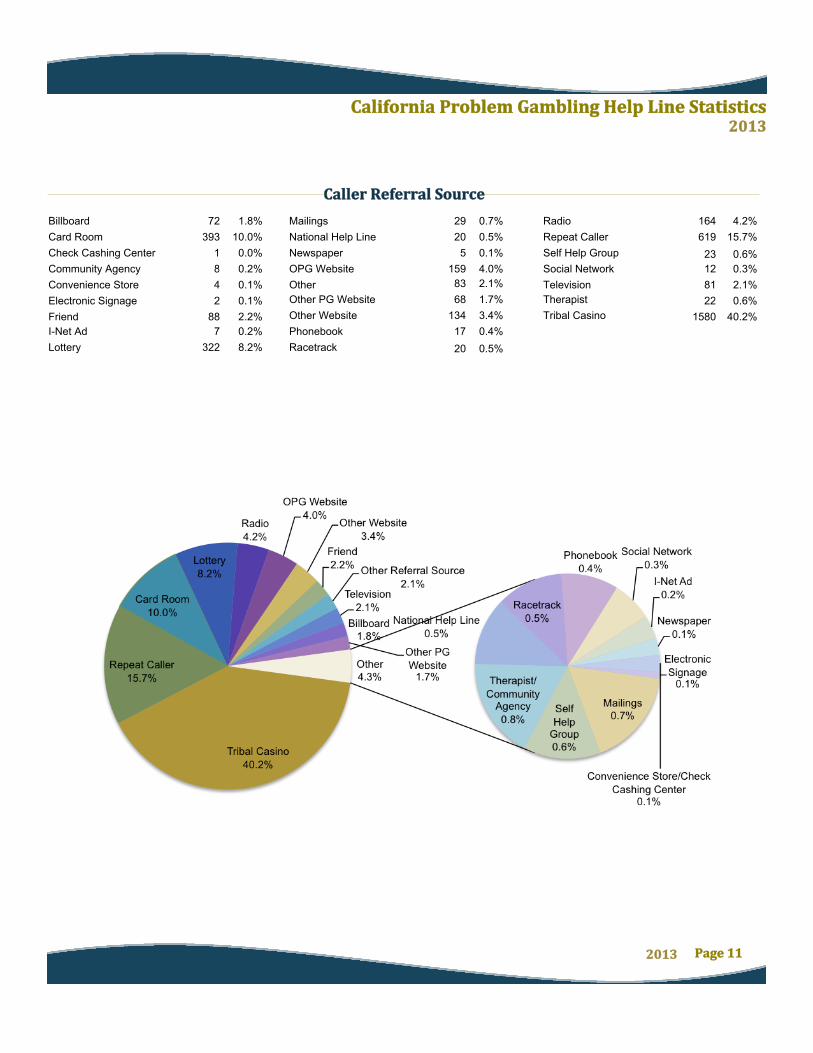
Newspaper 5 0.1%
Mailings 29 0.7%
Lottery 322 8.2%Phonebook 17 0.4%
National Help Line 20 0.5% Repeat Caller 619 15.7%
Therapist 22 0.6%Television 81 2.1%
Community Agency 8 0.2%
Radio 164 4.2%
Self Help Group 23
Other 83
Friend 88 2.2%
2.1%
Billboard 72
Tribal Casino 1580 40.2%
20Racetrack
10.0%393Card Room
4Convenience StoreSocial Network
I-Net AdOther WebsiteOther PG Website
OPG WebsiteCheck Cashing Center
Electronic Signage
159
68
7
12
134
1
2
4.0%
1.7%
0.2%
0.3%
Caller Referral Source
0.6%
1.8%
0.5%
0.1%
3.4%
0.0%
0.1%
2013 Page 11

2013California Problem Gambling Help Line Statistics
Self-‐Reported Information
FemaleMale
Lottery 244 8.0%
Indian Casinos 2098 68.4% Nevada Casinos 93 3.0%Bingo 12 0.4%
Horse Racing 33 1.1%Sports Betting 90 2.9%
Internet (Cards) 14 0.5%Internet (Other) 11 0.4%
Card Rooms 430 14.0%Cards (private) 12 0.4%
Other 19 0.6%
Stock Market 10 0.3%
Non Gambler Gender
371
219749
623626368220
202
0.1%2.4%7.5%
25.8%
21.5%21.6%12.7%
7.6%
0.7%0.1%
Under 18Age 18...21Age 22...25Age 26...35
Age 36...45Age 46...55Age 56...65Age 66...75
Age 76...85Age 86+
Gambler Age
Gambler's Primary Gambling Preference
1130Female2040Male 64.4% 35.6%
Gambler Gender
Total Debt ReportedAverage Debt $18,275 $25,457,459
Gambler's Indebtedness
Under 18Age 18...21Age 22...25Age 26...35
Age 36...45Age 46...55Age 56...65Age 66...75
Age 76...85Age 86+
Gambler's Average Debt by Age
Total Spent Per Yearon Gambling
Average Spent Per Yearon Gambling
$27,856 $42,256,975
Gambler's Spending
37.8%318 62.2%524
$0$4,189$6,997
$14,008
$19,253$17,576$24,840$95,100
$5,292$0
2013 Page 12

2013California Problem Gambling Help Line Statistics
Self-‐Reported Information
27.8% 72.2%Yes No
20.7%Multiple Daily10.4%Once Daily
12.6%Every Other Day29.3%Weekly
47.1%Instant Games Drawings 29.9% Instant and Drawing 23.0%
Big Payoffs 27.0%
Number of Gamblers Playing the Lottery
Type of Lottery Game
Frequency of Lottery Play
Average Number of Lottery Tickets Purchased Per Occasion
12.0
2013 Page 13
2013California Problem Gambling Help Line Statistics
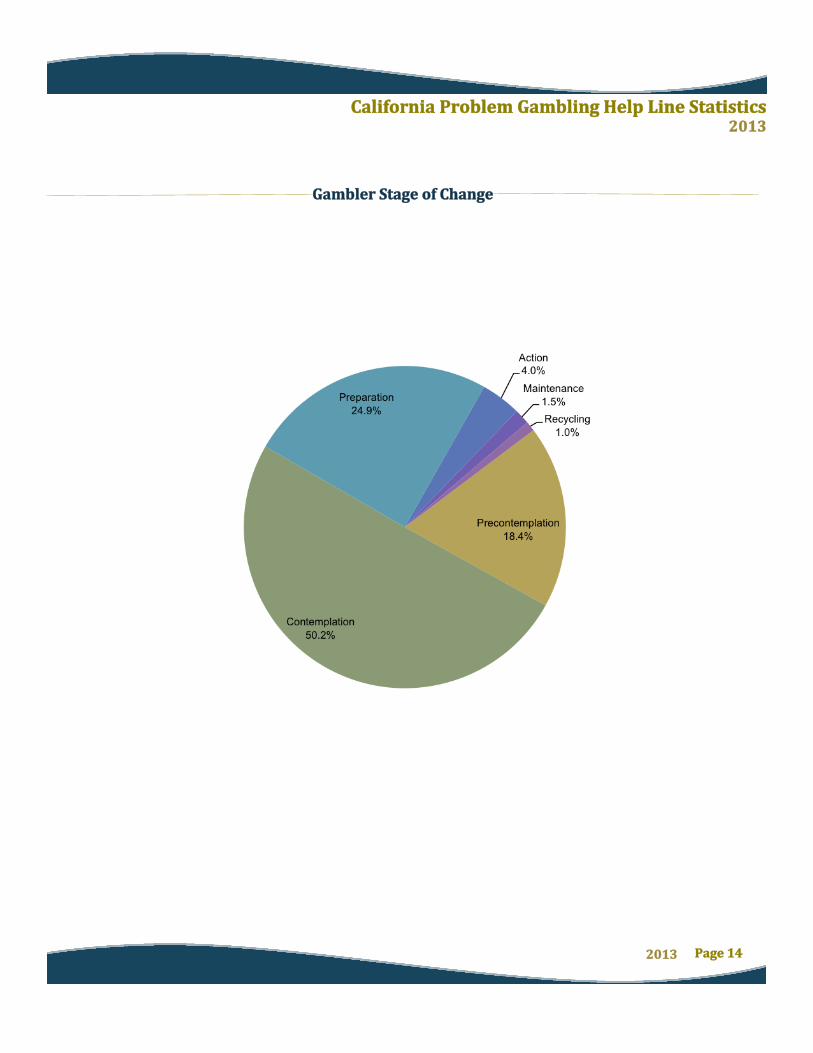
Gambler Stage of Change
2013 Page 14
2013California Problem Gambling Help Line Statistics
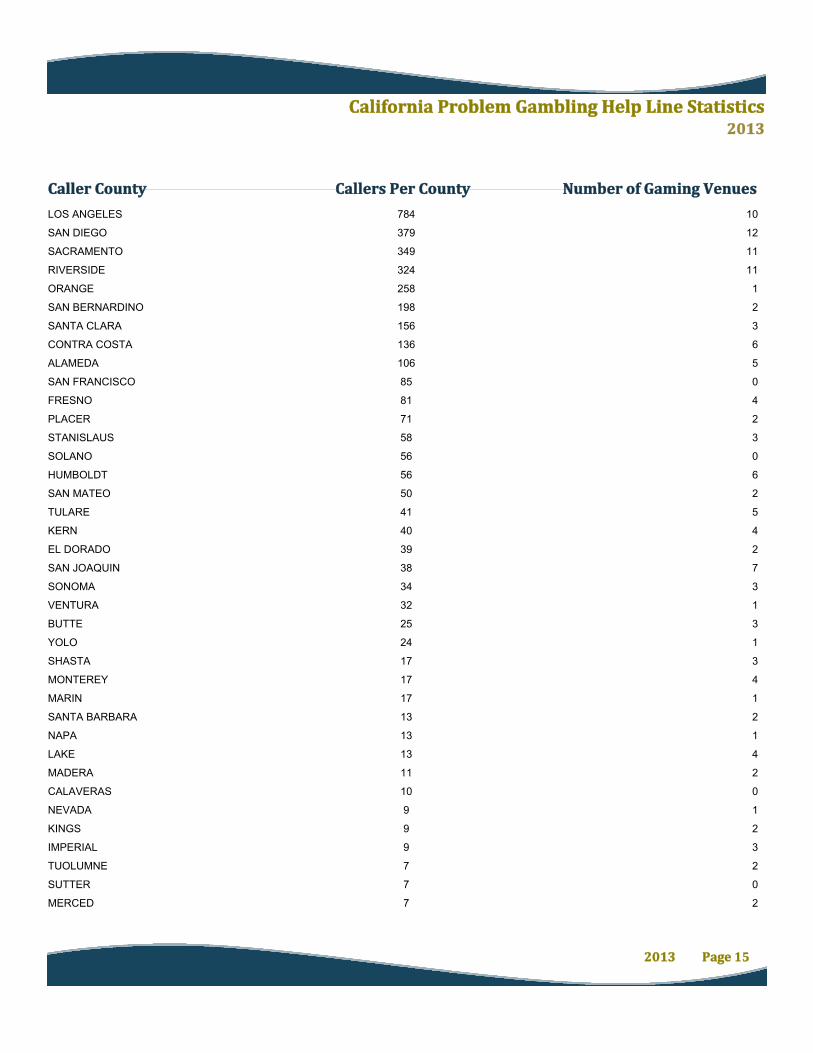
Caller County Callers Per County Number of Gaming Venues
LOS ANGELES 784 10 Los Angeles
SAN DIEGO 379 12 San Diego
SACRAMENTO 349 11 Sacramento
RIVERSIDE 324 11 Riverside
ORANGE 258 1 Orange
SAN BERNARDINO 198 2 San Bernardino
SANTA CLARA 156 3 Santa Clara
CONTRA COSTA 136 6 Contra Costa
ALAMEDA 106 5 Alameda
SAN FRANCISCO 85 0 San Francisco
FRESNO 81 4 Fresno
PLACER 71 2 Placer
STANISLAUS 58 3 Stanislaus
SOLANO 56 0 Solano
HUMBOLDT 56 6 Humboldt
SAN MATEO 50 2 San Mateo
TULARE 41 5 Tulare
KERN 40 4 Kern
EL DORADO 39 2 El Dorado
SAN JOAQUIN 38 7 San Joaquin
SONOMA 34 3 Sonoma
VENTURA 32 1 Ventura
BUTTE 25 3 Butte
YOLO 24 1 Yolo
SHASTA 17 3 Shasta
MONTEREY 17 4 Monterey
MARIN 17 1 Marin
SANTA BARBARA 13 2 Santa Barbara
NAPA 13 1 Napa
LAKE 13 4 Lake
MADERA 11 2 Madera
CALAVERAS 10 0 Calaveras
NEVADA 9 1 Nevada
KINGS 9 2 Kings
IMPERIAL 9 3 Imperial
TUOLUMNE 7 2 Tuolumne
SUTTER 7 0 Sutter
MERCED 7 2 Merced
2013 Page 15

2013California Problem Gambling Help Line Statistics
Caller County Callers Per County Number of Gaming Venues
DEL NORTE 7 2 Del Norte
YUBA 5 2 Yuba
MENDOCINO 5 4 Mendocino
AMADOR 4 1 Amador
SANTA CRUZ 3 0 Santa Cruz
SAN LUIS OBISPO 3 5 San Luis Obispo
PLUMAS 3 0 Plumas
INYO 3 1 Inyo
COLUSA 3 1 Colusa
TEHAMA 2 1 Tehama
SAN BENITO 1 0 San Benito
GLENN 1 0 Glenn
2013 Page 16

2013California Problem Gambling Help Line Statistics
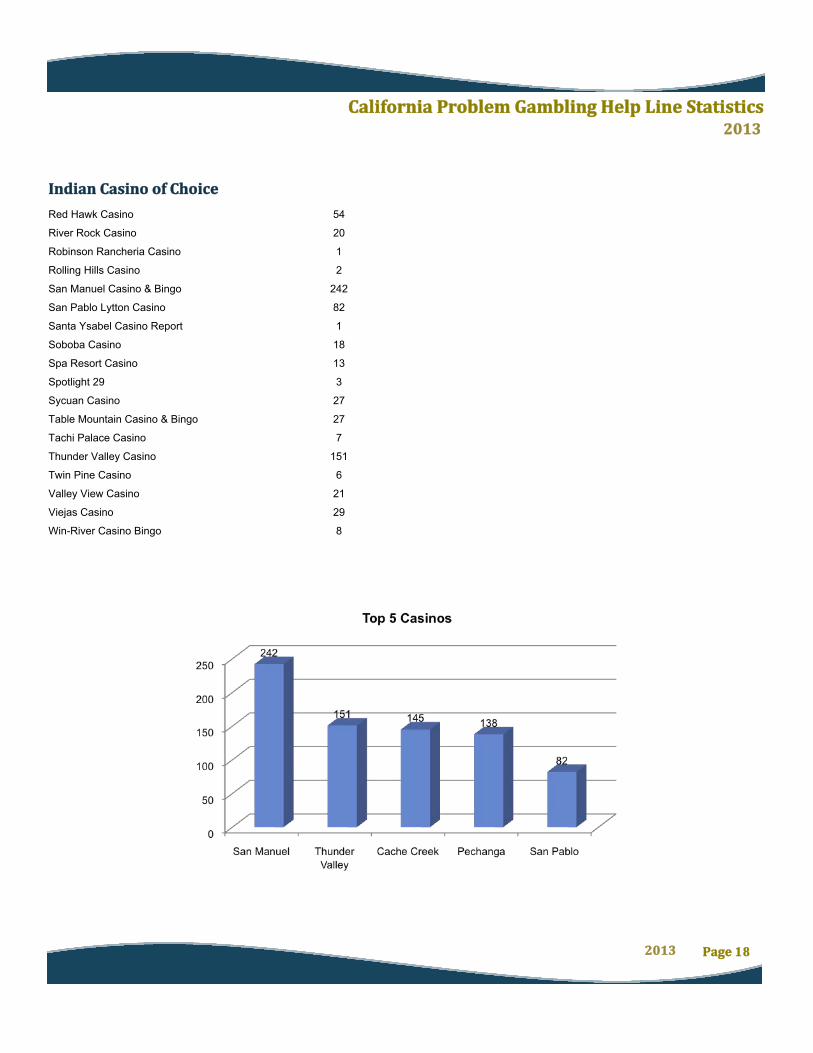
Indian Casino of Choice
Agua Caliente Casino 18
Augustine Casino 4
Barona Valley Ranch Resort & Casino 55
Bear River Casino 5
Black Bart Casino 2
Black Oak Casino 12
Blue Lake Casino 38
Cache Creek Casino & Bingo 145
Cahuilla Creek Casino 5
Casino Morongo 43
Casino Pauma 3
Chicken Ranch Bingo & Casino 2
Chukchansi Gold Resort & Casino 7
Chumash Casino 18
Colusa Indian Casino & Bingo 4
Coyote Valley Shodokai 1
Diamond Mountain Casino 1
Eagle Mountain Casino 10
Elk Valley Casino 4
Fantasy Springs Casino 3
Feather Falls Casino 2
Gold Country Casino 4
Golden Acorn Casino 3
Harrah's Rincon Casino and Resort 19
Havasu Landing Resort & Casino 1
Hopland Sho-Ka-Wah Casino 2
Jackson Rancheria Casino & Bingo 9
La Jolla Trading Post 8
Lucky Bear Casino & Bingo 2
Lucky Seven Casino 2
Mono Wind Casino 5
Paiute Palace Casino 7
Pala Casino 24
Palace Indian Gaming Center 4
Paradise Casino 3
Pechanga Resort & Casino 138
Quechan Casino Resort 1
Red Fox Casino 2
2013 Page 17
2013California Problem Gambling Help Line Statistics
Indian Casino of Choice
Red Hawk Casino 54
River Rock Casino 20
Robinson Rancheria Casino 1
Rolling Hills Casino 2
San Manuel Casino & Bingo 242
San Pablo Lytton Casino 82
Santa Ysabel Casino Report 1
Soboba Casino 18
Spa Resort Casino 13
Spotlight 29 3
Sycuan Casino 27
Table Mountain Casino & Bingo 27
Tachi Palace Casino 7
Thunder Valley Casino 151
Twin Pine Casino 6
Valley View Casino 21
Viejas Casino 29
Win-River Casino Bingo 8
2013 Page 18

2013California Problem Gambling Help Line Statistics
Translations
Chinese 22 10.1%
Korean 3 1.4%
0.0%Laotian 0
Mon-Khmer, Cambodian 2 0.9%
Other 7 3.2%
TTY 0 0.0%
Russian 0 0.0%
73.3%Spanish 159
Vietnamese 23 10.6%
Polish 0 0.0%
Miao, Hmong 0 0.0%
Armenian 1 0.5%
2013 Page 19

2013California Problem Gambling Help Line Statistics
Percentage of Total Intakes
Total Number of Quality Assurance Requests
Percentage of Total Number of Intakes
Were you able to speak to a Help Line counselor immediately?
Did you think that the counselor was understanding?
Quality Assurance
Survey Questions
Total Number of Quality Assurance Surveys Received
Percentage of Total Number of Survey Requests
10493%
118
11%
26%
Did you receive a referral to GA or GAMANON?
Did you attend the GA or GAMANON meeting?
If you called about your own gambling problem, are you still gambling?
Do you think that calling the 800# helped you recognize the extent of you or someone else's gambling problem?
Would you recommend the 800# to someone with a gambling problem?
3%
4%
15%
65%
60%
8%
1%
97%
96%
85%
35%
40%
92%
99%
Yes No
*Data is based on caller's willingness to disclose information.
2013 Page 20

2013California Problem Gambling Help Line Statistics
2013 Examples of Comments from California Callers who Completed QA Surveys
Has attended 2 sessions so far...and working on workbook. Grateful for help line.
Help line was fantastic.
Son & caller attend GA and Gamanon..son is also seeing a counselor. Working well.
Caller has been sick with the flu and back surgery, but no gambling since calling. Going to attend GA. States, "Thank you for all your support,you guys are great in what you do."
Still seeing the counselor, thankful of service.
Gambling has cut back, thanks to help line.
Has been attending GA 2x week, love the meetings, within comfort zone.
Doing C2C with Vanessa. No GA in her area. C2C is going very well.
Did not follow up on referrals, but has been doing well on his own. Counselor on line was helpful, also received info in the mail.
Very helpful and feels more relaxed and focused on what she was trying to do.
"Thank you for providing the service."
Glad the help line is there if she ever just needs someone to talk to .
Caller has stopped gambling since calling, help line was great.
Gambled 2-3x since calling the help line but had an "epiphany" of sorts and has stopped gambling.
Glad to find the help line because she did not have anyone else to talk to.
Does have urges, but hasn't gone since calling. Help line made a difference.
Thankful for the help line, feels like she can be a living testimony for broken people.
Reminded to give those referrals a call, been very busy, Gambling comes in spurts, hasn't gambled much since. Thankful for the follow up.
Thank you to the help line. Realized that gambling was too much and not just entertainment.
2013 Page 21

2013California Problem Gambling Help Line Statistics
2013 Examples of Comments from California Callers who Completed QA Surveys
"Glad this service is available, really got me back on the right track."
Since call to help line, cut back dramatically, goes to meetings regularly.
Great resources. Caller is gambling a lot less than before.
Hard to stop, did not take advantage of resources yet, but has slowed down since calling. The help line made a difference.
Saving lives, saving his marriage, going to GA too and about to get a sponsor. Thankful.
2013 Page 22